effects of drought and nutrients on growth, morphology and wood
TRANSCRIPT

Department of Crop Production
Ecology
Effects of drought and nutrients on
growth, morphology and wood
anatomy of two genotypes of Salix
Amanda Jansson
Agricultural Programme – Soil and Plant Science
Master’s thesis
Uppsala 2015
Effects of drought and nutrients on growth, morphology and
wood anatomy of two genotypes of Salix
Amanda Jansson
Supervisor: Friderike Beyer, SLU, Department of Crop Production
Ecology
Assistant supervisor: Martin Weih, SLU, Department of Crop Production Ecology
Examiner: Ioannis Dimitriou, SLU, Department of Crop Production
Ecology
Credits: 30 hec
Level: A2E
Course title: Independent Project/Degree Project in Biology – Master’s thesis – 30 hp
Course code: EX0565
Programme/education: Agricultural Programme – Soil and Plant Science
Place of publication: Department of Crop Production Ecology
Year of publication: 2015
Cover picture: Amanda Jansson
Online publication: http://stud.epsilon.slu.se
Keywords: Salix vinimalis, Salix schwerinii, biomass production, vessel, water, nutrients
Sveriges lantbruksuniversitet
Swedish University of Agricultural Sciences
Faculty of Natural Resources and Agricultural Sciences
Department of Crop Production Ecology

i
ABSTRACT
Due to a growing global population and an increasing welfare in combination with limited
resources of fossil fuels and environmental problems may bioenergy be one of the alternatives
for a more sustainable energy production. Among others, Salix is used as biological energy
source. Its energy conversion is high compared to other sources and it can be managed in a
short rotation period. For future energy production of Salix it is important to have resource
efficient genotypes with high biomass production. Thus, to secure future production, it is im-
portant to breed for production and resource use efficiency traits. Objectives with this study
were to evaluate how water and nutrients affect biomass production of two genotypes of Salix
and how xylem diameter of the same genotypes is affected by drought stress. Main hypothe-
ses with this study are that drought stressed plants have slower and lower biomass production
than well-watered plants. That available nitrogen (N) increase growth, that genotype 341 has a
drought tolerance than genotype 223 and that xylem vessels are narrower for drought stressed
plants compared to well-watered plants. Salix cuttings of the genotypes 223 and 341 from a
mapping population of Salix viminalis and the hybrid S. vinimalis x S. schwerinii were planted
and grown in a greenhouse in Uppsala, central Sweden, with a three week long treatment pe-
riod before final harvest. Greenhouse trial includes four treatments (control) 250 ml water
three times a week; water and nutrients) 250 ml water three times a week and 2 ml “Blomstra”
fertilizer/ l water once a week; nutrients) 250 ml water with 2 ml “Blomstra” fertilizer/ l water
once a week; water shortage treatment) 250 ml water once a week). Additionally, stems of
plants grown in a field trial in northern Italy for three years were collected. The stems were
irradiated with X-ray emanation for creation of a 3D-picture of the stem, the cross-section of
the pictures were used for counting vessels and analyzing vessel size. Both treatment and
genotype affected plant growth. Genotype 341 was more affected by the treatments than
genotype 223 but genotype 223 had an overall lower production. The production of the geno-
types differed mainly within treatment of high water and nutrient availability and the drought
treatment. The results indicate a more resource efficient production of the genotype 341 in
relation to water and nutrients and also a greater drought tolerance compared to genotype 223.
Highest nitrogen content was observed in fertilized plants, however in contrast to other stud-
ies soil water supply did not significantly affect N concentration in leaves. Greater vessel area
was observed in irrigated plants. Stem diameter was positively correlated with both total ves-
sel area and amounts of vessels. Amounts of vessels also tended to be negatively correlated to
δ13
C and to standardized WUE (water use efficiency based on δ13
C in relation to stem diame-
ter). For future studies a longer treatment period is recommended as well as increased number
of replicates for xylem analysis. I conclude that genotype 341 has great potential for biomass
production, is better suited for biomass production than genotype 223 and therefore recom-
mended to use in future trials.
Keywords: Salix vinimalis, Salix schwerinii, biomass production, vessel, water, nutrients

ii
POPULÄRVETENSKAPLIG SAMMANFATTNING
Salix är ett träd som kan odlas för produktion av energi. I takt med jordens ökande befolkning
och i kombination med hög levnadsstandard ökar efterfrågan på energi. I framtiden tror fors-
kare på en minskning av fossila tillgångar och därav en ökad efterfrågan på bioenergi. Idag
odlas Salix på jordbruksmark, vilket innebär platskonkurrens för grödor som odlas som mat
för människan. Trots att Salix är en förhållandevis tålig gröda med små behov ökar dess pro-
duktion vid god tillgång på vatten och näringsämnen. Det betyder att bra marker gynnar pro-
duktionen. Konkurrensen mellan mat och energi på jordbruksmark är en framtida fråga att
lösa.
Tack vare Salix tidiga blomning ger träden mat åt insekter tidigt efter en hård vinter. Detta är
en speciellt viktig egenskap eftersom våra pollinerande insekter tenderar att minska i antal.
Det har visats att Salix är effektiv på att ta upp giftiga ämnen ur marken, framförallt tungme-
tallen kadmium. En annan betydelsefull miljöaspekt är dess effektiva omvandling av bio-
massa till energi. Ur Salix kan man få ut mer energi per insatsvara jämfört med exempelvis
både vete, raps och fossila råvaror. Detta gör att det är mer energieffektivt att odla Salix än
spannmål för energiproduktion.
Om vi med hjälp av bioenergi från Salix vill kunna säkerställa den framtida energiförsörjning-
en är det viktigt att vi redan idag påbörjar förädlingen av tåliga sorter. Sorterna måste klara ett
framtida klimat. Ett klimat som förutspås vara varierat och innehålla intensiva perioder av
exempelvis regn och torka. Denna studie går därför ut på att jämföra två olika sorter med
varandra i ett växthusförsök, där växterna har fått olika mängd och kombination av vatten och
näring under tre veckor. Detta för att se hur de två sorterna reagerar på olika typer av tillväxt-
förutsättningar och hur deras behov skiljer sig från varandra. Ytterligare behandlar studien hur
växtens vattentransportsystem påverkas rent utseendemässigt av torka och hur detta kan på-
verka den totala biomassaproduktionen. Gällande analyserna för hur vattentransporten funge-
rar har data samlats in från Salix som växt i fält i Italien under tre år.
Resultat från denna studie är att en av sorterna (”341”) klarar torka bättre än den andra
(”223”). Överlag producerar sorten 341 mer biomassa än sorten 223 och är därmed mer läm-
pad för att använda i framtida forskning. Studien bekräftar även att både vatten och närings-
tillförsel ökar biomassaproduktionen samt att kväveinnehållet i bladen ökar vid tillförsel av
kväve. Storleken på rören som transporterar vatten i växten visade sig vara mindre när växten
utsattes för torka och antal rör ökade med en växande stamdiameter. Till vidare studier re-
kommenderas en längre behandlingsperiod för att öka resultatens trovärdighet.
Genom fortsatta studier på olika sorters Salix kommer förhoppningsvis både framtidens ener-
gitillgång och jordens biologiska mångfald att gynnas. Detta i kombination med att lösa vårt
framtida matbehov är en tuff och utmanande uppgift.

iii
TABLE OF CONTENT
1 LIST OF FIGURES ........................................................................................................... iv
2 LIST OF TABLES ............................................................................................................ iv
3 INTRODUCTION .............................................................................................................. 1
4 BACKGROUND ................................................................................................................ 2
4.1 A changing climate ...................................................................................................... 2
4.2 Positive environmental effects with willow production .............................................. 2
4.3 Willow production in Sweden ..................................................................................... 3
4.4 Establishment of willow .............................................................................................. 4
4.5 How water deficit and nitrogen affect growth and production .................................... 4
4.6 Hypotheses ................................................................................................................... 9
5 MATERIAL AND METHODS ......................................................................................... 9
5.1 Genotypes of willow, used in this study ...................................................................... 9
5.2 Greenhouse experiment in Uppsla, Sweden .............................................................. 10
5.3 Field experiment in Italy ............................................................................................ 12
5.4 Statistical analyzes ..................................................................................................... 12
6 RESULTS ......................................................................................................................... 13
6.1 Greenhouse experiment ............................................................................................. 13
6.2 Field experiment ........................................................................................................ 22
7 DISCUSSION .................................................................................................................. 25
7.1 Greenhouse experiment ............................................................................................. 25
7.2 Field experiment ........................................................................................................ 28
8 CONCLUSIONS .............................................................................................................. 31
9 AKNOWLEDGEMENT .................................................................................................. 32
10 REFERENCES ................................................................................................................. 33

iv
1 LIST OF FIGURES
Figure 1. The design of the greenhouse experiment. .............................................................. 11
Figure 2. Cross sections picture from X-ray analysis of willow stem .................................... 12
Figure 3. Absolute growth rate of mean leaf area ................................................................... 14
Figure 4. Relative growth rate of mean leaf area .................................................................... 15
Figure 5. Absolute growth rate of mean leaf biomass. ............................................................ 15
Figure 6. Relative growth rate of mean leaf biomass. ............................................................. 15
Figure 7. Absolute growth rate of mean root biomas. ............................................................. 16
Figure 8. Aboveground biomass (g). ....................................................................................... 17
Figure 9. Root biomass (g). ..................................................................................................... 17
Figure 10. Leaf area (cm2) ....................................................................................................... 17
Figure 11. Leaf biomass (g). ................................................................................................... 18
Figure 12. Root to shoot ratio .................................................................................................. 19
Figure 13. N content in leaves. ................................................................................................ 20
Figure 14. Soil moisture (%). .................................................................................................. 21
Figure 15. Aboveground biomass (g) of the plants grown in pots where soil moisture was
measured.. .............................................................................................................. 21
Figure 16. Column diagram of mean vessel area (mm2) ......................................................... 22
Figure 17. Scatter plot of stem diameter and total vessel area per stem (mm2) (A) and
amounts of vessels (B) .......................................................................................... 23
Figure 18. Scatter plot of mean amount of vessels and mean vessel area. .............................. 23
Figure 19. Scatter plot of mean amounts of vessels and δ13C (A) and standardized water use
efficiency (B). ........................................................................................................ 24
2 LIST OF TABLES
Table 1. Total amounts of biomass of genotype 223 and 341 at baseline harvest .................. 13
Table 2. Comparison of absolute growth rates for leaf biomass, leaf area, stem height, stem
biomass, aboveground biomass and root biomass ..................................................... 13
Table 3. Comparison of relative growth rates for leaf area, stem height and leaf, stem,
aboveground and root biomass................................................................................... 14
Table 4. ANOVA table of F-values and P-values of aboveground biomass, stem diameter and
leaf area ...................................................................................................................... 16
Table 5. Absolute values of specific root area (SRA) and specific root length (SRL)............ 18
Table 6. Wilcoxon table of p-values of differences in leaf biomass, root biomass, shoot to
root ratio, specific root area and specific root length between genotypes (223 and
341) ............................................................................................................................ 19
Table 7. Wilcoxon table of p-values of differences in leaf biomass, root biomass, shoot to
root ratio, specific root area and specific root length between treatments ................. 19
Table 8. ANOVA table for N content ...................................................................................... 20
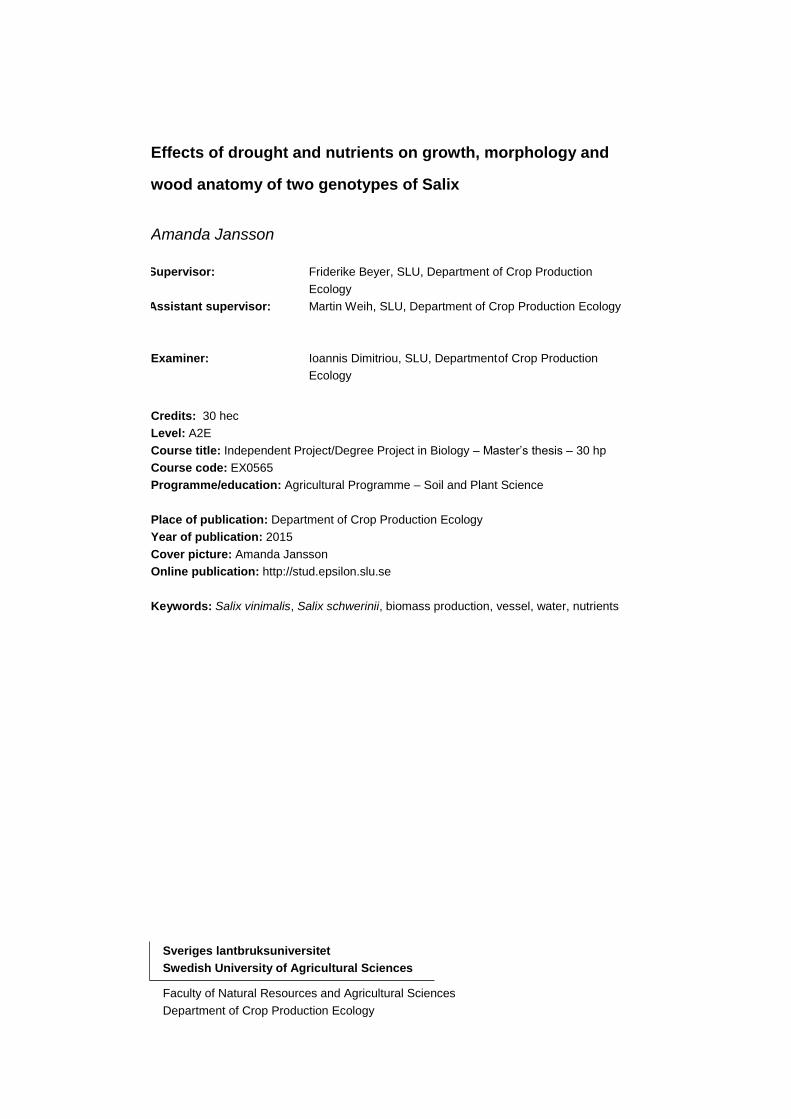
Table 9. ANOVA table for N concentration. ........................................................................... 21
Table 10. ANOVA table of measured variables of stems from Italy. ..................................... 22

v

1
3 INTRODUCTION
In the beginning of the 1970’s alternative energy sources for fossil fuel became interesting
due to high petroleum prices. Interest in fast growing forest increased, there among willow
(Salix spp.), and researchers started to develop high yield genotypes (Danfors, 1992). Willow
is a tree grown and can be used as a renewable energy resource (Swedish Board of Agricul-
ture, 2014) and is managed as short rotation coppices (SRC). The term “short rotation forest-
ry” is also used concerning willow (Hoffmann and Weih, 2005). SRCs are coppice with re-
growth vigour, harvested every 3-5 year and grown as purpose-grown wood. Today Sweden is
one of three leading countries in Europe together with Poland and the United Kingdom within
growing fast growing forest, based on area (SRCPlus, 2014). Genotypes of todays’ market
offers about a 50 % higher yield compared to the high yield genotypes used in the 1990’s
(Larsson1).
The demand for bioenergy in Europe is today increasing, but the supply of woodchips is not
high enough. Therefore an increased production is required (SRCPlus, 2014). A limited sup-
ply of fossil fuels (Lindblad, 2011) in combination with an increasing demand for bioenergy
(SRCPlus, 2014) and the negative effect of fossil fuels on the climate (Uppenberg et al.,
2001), indicates that some changes have to be done in the near future. Planting more fast
growing forest for biomass production is an alternative. To optimize the production it is im-
portant to have good raw material.. Water and nitrogen (N) are two important parameters for
production of biomass (Chaves et al., 2003) and different genotypes respond differently to
deficiency and availability of these (Weih et al., 2010; Campbell et al., 2008; Glynn et al.,
2004). To find efficient genotypes it is important to know how the different genotypes react to
these parameters (Chaves et al., 2003) and deeper knowledge about anatomical traits of ves-
sels will give additional understanding of drought adaptations of plants, thus water availability
influence vessels (Hilarie and Graves, 1998; Kulkarni et al., 2010; Plavcová and Hacke,
2012).
The objectives of this study are to evaluate how water and N affect two genotypes of willow,
differences between genotypes and interaction effects between water and N treatments. To see
if one of the genotypes is better suited for drought conditions and analyze how nitrogen and
water deficit affect biomass production, allocation and root production. Finally, the study in-
vestigates how the vessel size of one genotype reacts to drought compared with well-watered
conditions.
1 Stig Larsson, European Willow Breeding AB, 2015-02-04

2
4 BACKGROUND
4.1 A changing climate During the last decades the climate has been changing rapidly due to human actions and due
to the increased concentration of greenhouse gases in the atmosphere in particular (IPCC,
2014). The global mean temperature has increased with about 0.7 °C within the period 1906-
2005 and the temperature changes in Sweden are showing the same trend. Predictions for fu-
ture climate in Sweden are milder weather and higher precipitation up north and warmer
weather and unchanged precipitation rates, compared to today, in the south (SMHI, 2015).
The global mean surface temperature for the period 2016-2035 is predicted to increase with
0.3-0.7 °C (IPCC, 2014). When burning fossil fuel, carbon from the earth crust is released
into the atmosphere, likewise is carbon released when combusting plant material; e.g. biofuels
(Uppenberg et al., 2001). Differences are, among others, when combusting plant material e.g.
willow the release of CO2 is calculated as zero (Berntsson et al., 2014), due to that the emitted
CO2 when combusting equals the uptake of CO2 of a replanted growing tree (Berntsson et al.,
2014; Heller et al., 2003). Therefore, the cycle of biofuels is shorter than for fossil fuels and
thereby less environmentally damaging.
The combination of limited availability of usable energy of today and plants’ ability to
capture sun energy is a good reason for planting short rotation forest. The fact that willow is
one of the most efficient plants when transforming sun energy to plant biomass (Christersson,
2013) is worth considering for future energy production.
With efficient energy conversions willow could produce eleven times more electricity
than consumed fossil energy (Heller et al., 2003). Comparing different biofuels, willow can
contribute with as much as five times more energy compared with ethanol from wheat and
methyl ester from rape seed (Swedish Energy Agency, 2008). The production of bioenergy
needs to be productive and energy efficient if it is going to be less environment damaging
compared to fossil fuels. The impact on the environment depends among type of tillage, need
for additional nutrients, energy use while growing, energy content in product and usage of rest
products (Swedish Board of Agriculture, 2009).
4.2 Positive environmental effects with willow production Growth of willow can have positive effects on the environment compared to traditional crops.
Willow can increase biodiversity (Baum et al., 2012) and its pollen is very important for bee
and humblebee populations due to the early growth of the plants and thereby pollen produc-
tion during early spring (Christersson, 2013). This is an important trait that can help recover
last years’ global reduction of pollinating insects that has been shown during the last years.
Pollinating insects are important to most domestic and wild plants, thus gives the insects ma-
jor national economic importance (Rahbek et al., 2009).
Willow also reduces soil erosion and nutrient leakage due to a lower nutrient need and
its perennial growth. A lower nutrient need means less fertilizing and lower risk of eutrophi-
cation (Swedish Board of Agriculture, 2009). Willow has the capacity of cleaning waste water
from nutrients and toxic elements by water uptake. The water uptake leads to transpiration
and thereby less water leakage from the site. Its capacity of cleaning and removing water
makes it suitable for planting around waste disposal sites (Christersson, 2013).

3
Willow has a high ability of accumulating cadmium (Cd) from the soil (Reimann et al., 2015)
and can therefore be used as a vegetative filter (Mirck et al., 2005). It is usable that soil is
cleaned from unwanted elements, e.g. heavy metals, when planting willow, but according to
Gough et al. (2013) there is a risk of accumulating the heavy metals in the food chain by
browsing animals. Besides interfering in the food chain heavy metals can affect plants’ water
balance.
4.3 Willow production in Sweden The majority of the willow production area in Sweden is located in the south and middle parts
(Skåne, Mälardalen and Västra Götaland) (Swedish Board of Agriculture, 2014), mainly due
to the high frost risk up north (Dahlgren, 1992) and it covers about 10 500 hectares (Swedish
Board of Agriculture, 2014). Farmers were in the beginning of the 1990’s recommended to
grow willow on the least nutrient rich area; due to its great capacity to take up water, low nu-
trient demand and long growing season (Dahlgren, 1992). This recommendation led to low
yield. The recommendations are now modified and it is now recognized that willow biomass
production is favored by plant available nutrients (Swedish Energy Agency, 2008; Swedish
Board of Agriculture, 2013), a pH over 6 (Swedish Board of Agriculture, 2013).
In Sweden, nutrients are among the most important environmental factors that limit
growth of plants and if nutrients are not limiting, water can be a limiting factor occasionally
and/or locally. Though drought stress in not common in willow plantations in Sweden today
(Lindroth and Båth, 1999) it might be in the future due to changing climate. Another factor is
soil type, which can lead to drought stress depending on its water holding capacity. The right
combination of oxygen and water in the soil determines the plants’ survival. The soil needs to
be well aerated and at the same contain enough plant available water (Eriksson et al., 2011).
Even though willow has the capacity to survive in low water soils (Dahlgren, 1992) studies
have shown differences in water tolerance between genotypes (Weih et al., 2010). The origin
of the genotype can also affect the growth rate of the shoot (Wikberg and Ögren, 2004) and a
study by Dudley and Galen (2007) showed that female clones showed a greater drought stress
than male clones, by having a lower water potential under drought conditions.
Willow is grown on the same type of farmers land as cereal and ley, which results in
competition of land (Swedish Board of Agriculture, 2009). Reasons for not using forest land
are, among others, a higher risk for damages by game species and aggravated harvesting due
to hilled terrain. Lack of big roads for transportation of the biomass and long distances to
combusting fabrics are other reasons (Gustafsson et al., 2007). Willow is rated as an agricul-
tural crop and can therefore not be planted on forest land, due to that forest land does not in-
clude land cultivated as agricultural usage (Swedish Forest Agency, 2014). Though, usage of
arable forest land might be potential in the future, if willow production becomes successful
(Christersson, 2013). The Swedish Board of Agriculture (2009) has created different scenarios
for increasing willow production in Sweden. An increasing willow production, both (1) along
the coast of the south part of Sweden and (2) in the south parts of Sweden (coast and inland)
will lead to less national food production; cereal, oil seed rape, milk and beef. Thereby an
increasing import of food and export of environmental problems.
When the national food and fodder production is on a satisfactory level, the production
of alternative energy sources can increase. Growing on bigger and today non crop areas, using
a more efficient growing technique and also using optimal crop rotations are three future al-

4
ternatives for an increasing willow production in Sweden (Swedish Board of Agriculture,
2009).
4.4 Establishment of willow When establishing willow, it is important that the water content of the cuttings remains high
(from when taking the cuttings from its original plant) (SLU, 1994). It is also important with
weed control to minimize competition between crop and weed for water and nutrients. A non-
successful weed control can lead to lower yield (Tahvanainen, 1999). The usage of pesticides
in willow is low compared to other crops. When growing willow for 20 years the use of
chemical herbicides are mainly connected to the establishment phase. Additional weed treat-
ment is mostly mechanical. Though, there are some problems with insects and fungi in willow
plantations (Swedish Board of Agriculture, 2009).
4.5 How water deficit and nitrogen affect growth and production
4.5.1 Different types of drought stress
Drought stress occurs when the water uptake is lower than the rate of transpiration (Bray,
1997). Plants’ response to drought stress can be divided into two groups. Either the plants
close stomata and “avoid” drought or the transpiration function is maintained but on a lower
intensity (Savage et al., 1999). When closing stomata the stomatal conductance and photosyn-
thetic activities reduces (Pezeshki, 1998) leading to lower transpiration and thereby less water
losses. Reduced photosynthetic activity leads to less incorporation of carbon (Campbell et al.,
2008) and thereby lower growth rate. Drought can therefore negatively affect biomass produc-
tion of shoots and roots (Pezeshki, 1998; Nakai et.al, 2010; Glynn et al., 2004).
It is shown that onset of water stress can be delayed due to a decreased osmotic poten-
tial in leaves in combination with higher water and turgor potential. Caused by the increased
level of soluble sugars and decreased levels of starch, that plants gains during water stress. It
is also stated that drought stress reduces gas exchange in leaves but that an elevated CO2 miti-
gates the stress in willow. The elevated CO2 increased photosynthetic rate, reduced leaf con-
ductance and increased instantaneous transpiration rate for both willow and poplar (Johnson
et al., 2002).
Abscisic acid (ABA) is a plant hormone that among others facilitates drought tolerance
and the hormone usually acts antagonistic to growth hormones (Campbell et al., 2008). Newly
synthetized ABA respond to stomatal closure and the concentration of ABA changes in plants
during water stress (Liu et al., 1999). Thus drought conditions can trigger synthesize of ABA
in roots. ABA is thereafter transported through xylem vessles, to stomata where it triggers
stomatal closure (Wilkinson and Davies, 2002). The reaction is fast and concentrations ABA
increases rapidly in leaves under water loss. When watering after drought, a study have shown
that plants with newly synthetized ABA have a longer recovery time compared to plants that
have not suffered from drought conditions. The same study also showed that younger leaves
where more sensitive than mature (Liu et al., 1999).
4.5.2 Drought’s effect on aboveground biomass
Aboveground biomass of willow can be reduced with 35-60 % when exposed to drought (40
% soil water content of field capacity) compared to well-watered plants (75 % soil water con-
tent of field capacity) (Wikberg and Ögren, 2007), but not all studies have observed signifi-

5
cantly reduced growth due to drought, for all included genotypes (Van Splunder et al., 1996).
Drought can lead to leaf losses (Savage et al., 1999) and it is shown that populations from
regions with lower rainfall (low- rainfall species) have a lower specific leaf area (SLA) com-
pared to populations of vegetation in higher rainfall areas (high-rainfall species) (Cunningham
et al., 1999). Observations have stated that soil electrical capacitance is correlated to stem
biomass, leave biomass and stem height. This makes electrical capacitance a good indicator in
amount of future produced biomass (Pitre et al., 2010). It is also shown that permanent
drought stress reduces growth more than temperate drought stress (Weih et al., 2010) though,
according to Savege et al. (2009) a short period of drought did not affect the resprouting ca-
pacity of neither wetland specialists nor habitat generalists.
Drought stress decreases SLA (Liu and Stützel, 2003; Weih et al., 2011). SLA is the ra-
tio of leaf area to leaf dry mass and it indicates leaf thickness (Vile et al., 2005). The lower
SLA the thicker leaf and thereby a greater photosynthetic capacity due to a higher leaf protein
density (Erice et al., 2009). A higher protein density means a higher N content (Campbell et
al, 2008) and a higher N content have been observed in drought suffered plants (Glynn et al.,
2004; Weih et al., 2011).
4.5.3 How drought and low nutrient supply affect root growth
Drought can generate a greater biomass allocation to roots than to shoots (Glynn et al., 2004;
Van Splunder et al., 1996; Lambers et al., 2006), possibly due to decreased leaf growth and
increased assimilation transportation to roots (Lambers et al., 2006). Leading to a lower shoot
to root ratio during drought, compared to well-watered conditions (Van Splunder et al., 1996,
Lambers et al., 2006). Though, observation of allocation patterns in roots show an increasing
allocation to coarse roots and a decreasing allocation to fine-roots, under irrigation and fertili-
zation. Total root biomass was therefore the greatest when plants received both water and
fertilizer compared to the control and irrigation treatment (Ryan et al., 1995). Contrary, Van
Splunder et al. (1996) state that it is not necessary that drought affect root dry weight. How-
ever, root length can increase with drought (Van Splunder et al., 1996; Rytter and Hansson,
1996) and drought can also generate a greater proportion of root biomass in deeper soil layers
compared to shallower (Van Splunder et al., 1996). Nitrogen deficit can also affect root
length, by faster growth rate. Leading to a production of thinner roots and fewer branches,
compared to plants receiving plant available N (Ericsson, 1981).
4.5.4 Drought effects on vessel diameter and xylem area
The vascular transport system of trees consist two types of tissues; xylem and phloem. Phlo-
em transports solved sugar and other organic compounds produced in the photosynthesis. The
transport goes to where there the compounds are required or stored; usually to roots or sites of
growth (for example leaf production). Xylem transports water and solved nutrients from the
soil through the roots and to the leaves of the plant. A tree stem consists of more xylem in
relation to phloem and xylem. Xylem consists of dead and living plant cells and it transports
water through tracheids and vessels. Vessels are wider and longer than tracheids. Vessels are
conducted of vessel elements building up vessels and the vessels range from a few centime-
ters to many meters. The most of the vertical water transport moves through the vessels, the
open end walls of the vessel elements (perforation-plates) provide an efficient water transport-
ing pathway. During years of growth the xylem constructs the wood while old phloem is

6
sloughed off and only the youngest phloem is used for sugar transport (Taiz and Zeiger, 2007;
Campbell et al, 2008).
Vessel size diameter can be affected by water conditions. Studies have shown a de-
creased vessel diameter during drought (Kulkarni et al., 2010; Plavcová and Hacke, 2012),
increased during watering (Hilarie and Graves, 1998) and increased during fertilizing
(Plavcová and Hacke, 2012). Similar results shows smaller diameter during dry periods
(Worbes, 1999; Sevanto et al., 2005) and wider during wet periods (Sevanto et al., 2005).
Some studies state that vessel diameter changes and that the changes over time are relat-
ed to soil water content (Sevanto et al., 2005; Offenhalter et al., 2001) in the A-horizon and
daily vapor deficit (Sevanto et al., 2005). Predawn xylem diameter has been observed shrink-
ing, due to decreasing soil water content and when it started to rain, the shrining ceased and
the xylem re-expanded. The same study states that daily xylem diameter changes are greater
in the top of the tree than in the bottom (Offenhalter et al., 2001). Those changes may be re-
lated to the results of Moltz and Keppler (1973) who observed deformations in the phloem (92
%) and immature xylem (still living cells). Though Moltz and Keppler (1973) could not ob-
serve any deformation in the mature xylem (non-living) due to cellular water content varia-
tions, which they explain by the rigid formation of the xylem and the rigid formation makes
the xylem resistant to lateral compression and keeps the plant more tolerant to water stress.
Moltz and Keppler (1973) also mean that younger phloem tissues are more affected by the
plant water potential and have a stronger relationship to diurnal changes in stem diameter
compare to older tissue. They also state that there is no simple relationship between plant wa-
ter status (e.g. xylem water potential) and stem diameter changes.
There are different methods for analyzing plant vessel diameter and total area of the
vessels. Examples are with a camera lucida (Davis et al., 1999), a microscope or a Nanowood
Multi-resolution X-ray CT scanner (Beyer et al., unpublished). The X-ray method is new and
accurate, contributing with a deeper understanding of the genotypic differences of water use
efficiency, for example due to the possibilities in formation of 3D-pictures. The phoenix
v|tome|x (GE Measurement and Control, 2015, USA) is an X-ray machine and can produce
both 2D- and 3D-pictures; in this study 2D pictures of the vessels were used. The analyzed
object is placed in an X-ray machine and illuminated with radiation. First two-dimensional X-
ray images are taken while the object rotates 360°. The images contain information about
density and position of everything in the object that absorb radiation, sent from the X-ray
source. The 2D images are thereafter reconstructed to 3D images (GE, 2014). The 3D images
can thereafter be divided into horizontally images and e.g. showing a cross-section of a stem,
done for this study.
4.5.5 Water use efficiency and δ13C
Plants’ ability of water use efficiency refers to carbon gain per water loss and can be de-
scribed in two ways: intrinsic water use efficiency (WUEi) or water use efficiency (WUE)
(Lambers et al., 2006). Differences between WUE and WUEi are that WUEi is the instanta-
neous rate of assimilation and transpiration (Condon et al., 2002) and WUE is used in a wider
concept, e.g. defined as growth of aboveground biomass per unit water consumed (Slípková
and Pokorný, 2012). A third concept is standardized WUE, which is WUEi based on the car-
bon isotope composition (δ13
C) in relation to stem diameter, which is closely related to total
leaf area of the plant. δ13
C is the 13
C/12
C ratio related to an international standard, the lime-

7
stone Pee Dee belemnite ((δ13
C (‰) = ((Rp/Rs ) )-1x1000); where Rp is the ratio in the plant
and Rs is the ratio of the standard).
WUEi describes CO2 fixation of plants in relation to its water loss (Elason et al., 2004),
i.e. the rate of carbon assimilation divided by transpiration (A/T) (Condon et al., 2002).
WUEi can be measured as carbon discrimination, in relative values with δ13
C and in absolute
values with ∆13
C ((∆13
C = (Ra/Rp)-1; where Ra is the 13
C/12
C ratio in the atmosphere and Rp
is the ratio in the plant). The ratio of 13
C to 12
C in plant tissue is less than the isotopic ratio of 13
C to 12
C in the atmosphere, because plants discriminate against 13
C during photosynthesis,
due to their stomatal limitations and enzymatic processes. Though, measuring ∆13
C gives no
information of which the driven variable is; carbon assimilation or transpiration (Condon et
al., 2002), which should be taken in consideration before choosing between measuring A/T or
∆13
C.
Higher WUEi can be provided by either lower stomatal conductance and/or higher pho-
tosynthetic capacity (Condon et al., 2002) and this generates in greater growth due to lower
water use and/or greater biomass production compared to a lower WUE. Plants with a higher
drought tolerance often have lower stomatal conductance, leading to lower photosynthesis and
transpiration rates (Lamberts, 2002), plants with a higher drought tolerance will therefore in-
crease its ∆13
C content.
4.5.6 Size of annual rings
Size of annual rings is dependent on water availability. Higher precipitation leads to increased
cambial growth, thereby bigger rings (Worbes, 1999) and annual precipitation variation have
shown to be positive correlated with radial growth of the stem, drier period generates in
smaller ring widths (Walker et al, 2015).
Size of annual rings can be affected by different factors; observations have showed a re-
lation between size of annual rings in willow and reintroduction of wolves. The reintroduction
caused fewer herbivores and less browsing leading to greater growth-ring areas. Breeding for
less tasty genotypes of willow is important when wanting a high biomass production, due to
browsing and thereby lower growth (Beyer et al., 2007). This trait is also important for avoid-
ing insect attacks, though Barbour (2015) stated different genotypes of willow have different
levels of herbivory response.
4.5.7 How nitrogen content in leaves can be affected
Studies have stated that populations from regions with lower rainfall (low-rainfall species)
have a higher N in their leaves per unit leaf area than populations in vegetation at higher rain-
fall (high-rainfall species) (Wright et al., 2002; Cunningham et al., 1999). Low-rainfall spe-
cies have a lower concentration of internal CO2, at a given stomatal conductance, indicating
that they may have a greater photosynthetic rate than high-rainfall species. This partly ex-
plains the greater N in low-rainfall species. The lower water use makes the high N in the
leaves possible (Wright et al., 2002). It is also shown that area-based leaf N content is higher,
12 % according to Glynn et al. (2004) and 16 % according to Weih et al. (2011), in drought
suffered willow plants, compared to well watered plants. The higher N is acclimations to op-
timize N economy (Weih et al., 2011).However do plants need water to take up nutrients, due
to that solved nutrient enter the plant together with soil water through roots (Karlsson et al,

8
1999). So, too low water availability will not increase N content in leaves due to that the N
cannot be taken up.
In opposite to Wright et al. (2002) have Lauer and Boyer (1992) observed increasing in-
ternal CO2 partial pressure during decreasing water potential and thereby stomatal closure.
The pressure increased until the internal pressure was equal to the external pressure. That
means the CO2 uptake is not inhibited by stomatal closure and the pressure outside stomata
generally was the factor able to decrease the internal pressure (Lauer and Boyer, 1992). So, if
there is no reduction in photosynthesis, there should be no change in leaf N.
Drought is not the only factor the N in leaves depends on. For example, a higher N con-
tent in the soil increases the N in the leaves (Silvola & Ahlholm, 1992). Though, nitrogen is
often considered a deficient element on cultivated land (Campbell et al., 2008) and this makes
it an important nutrient when producing biomass. Because N deficit can lower growth
(Campbell et al., 2008; Ericsson 1981; Taylor, 1993; Tahvanainen, 1999; Cunningham et al.,
1999) and thereby reducing a potentially higher yield.
Nitrogen deficit has been shown to reduce leaf area and turn leaves yellow (Ericsson,
1981). A study by Savage et al. (2009) observed changes in pigment concentration under
short term drought conditions for willow and they stated that chlorophyll content declined
with drought and that some of the six species increased the xanthophyll content in leaf. The
observed reduced leaf area (Ericsson, 1981) might depend on a reduced plasticity of the cell
wall (Taylor, 1993).
Cunningham et al. (1999) state the same result as Silvola and Ahlholm (1992), that soil
enrichment affects the nutrient content in plant. Species grown in vegetation with lower nutri-
ent supply (low-nutrient species) contained a lower leaf N and had a lower SLA, compared to
species grown in vegetation at higher nutrient supply (high-nutrient species).
Studies have proven that N fertilizing increases N in both the leaves (Jug et al., 1999)
and the rest of the plant parts (Von Fircks et al., 2001), which is about the same result as Cun-
ningham et al. (1999) and Silvola & Ahlholm (1992) stated. Allocation of N in the plant has
shown to differ along the year, independent if the plants received fertilization or not. Nitrogen
concentration in leaves, stems and roots declined during fall. In October/November the N
started to increase in stems and roots to be stored in the perennial parts, while continuing to
decrease in leaves. During spring, N in stems, cuttings and roots declined (with a more dis-
tinct decrease for fertilized plants) due to growth of new shoots. Retranslocation to roots dur-
ing fall was more pronounced in plants not receiving additional fertilizing. There was a differ-
ence in time for allocation patterns for the treatments, but the pattern was the same independ-
ent fertilization or non-fertilized (Von Fircks et al., 2001).
As mentioned before, there is a relation between drought and N status in leaves (Wright
et al., 2002; Glynn et al., 2004; Weih et al., 2011). Zhong et al. (2015) have studied a tran-
scription factor in Arabidopsis (specifically transgenic AtTGA4 plants and wild type plants)
and the outcome is that the transcription factor is induced by both nitrogen stress and drought.
It was also shown that drought resistance and limited N stress was induced by overexpression
of the transcription factor and that drought resistance depends on enhanced nitrate transport
and assimilation. The transgenic plants had a higher tolerance to N stress and drought stressed
plants had a higher N content, compared to wild type plants.

9
4.6 Hypotheses Hypotheses for this study are:
Drought stressed plants have a slower and lower production of aboveground biomass and a
higher N concentration per leaf area compared to well-watered plants.
- Plants of genotype 341 has greater drought tolerance than plants of genotype 223.
- Available N increases biomass production and the combination of available N and wa-
ter generates in the highest biomass production for this study.
- The roots of the drought stressed plants have longer but thinner compared to well-
watered plants.
- Vessel diameter of drought stressed plants decreases compared to well-watered plants.
5 MATERIAL AND METHODS
5.1 Genotypes of willow, used in this study
All plants within the same genotype has the same origin heritage, they have the same heredity
(SLU, 1994). In this study two genotypes are used; 223 and 341. They both come from a F1
population from crossing the diploid female genotype L78183 (S. viminalis) and the diploid
male hybrid cultivar “Björn” (S. vinimalis x S. schwerinii).
The genotype L78183 entered the market in the 1970’s after joining a competition of
biomass production of willow. It was collected from around Båstad, south west part of Swe-
den (on the coast), and the genotype turned out to have a high production rate and a relatively
high frost hardiness. It has a yellowish-greenish stems with reddish-brownish spots towards
the stem top. The genotype is early in the spring and cuttings should therefore not be harvest-
ed too late in the season. During the late 1980’s it was used as a genotype reference for breed-
ing and also planted in high extension during the early 1990’s. Today is it replaced with new-
er genotypes and not available on the market (SLU, 1994; Larsson2).
In year 1991 Larsson2 create the cultivar “Björn” from crossing the Siberian genotype
L79069 and the genotype “Orm” (S. viminalis, L78195 * L78101) from the company Svalöv
Weibull AB. The crossing generated in very few seeds but the growing plants had a high bio-
mass production. Its sister “Tora” have about the same production capacity but a straighter
growth way and more side shoots. Neither of the siblings is flavorous by wild animals, which
generates in less damaging during the establishment phase (SLU, 1994; Larsson2).
S. viminalis can grow well in most soils, but do not favor condensed clays and coarse-
grained sands, it is also important that the soil contains enough plant available nitrogen for
high biomass production (Tahvanainen, 1999). When studying willow offspring from the
genotypes “L78183” and “Björn” Tsarouhas et al. (2002) observed that stem diameter corre-
lates with stem height (r=0.82). The same study also stated that “L78183” has a higher genetic
variation in growth traits than “Björn”.
The used genotypes (223 and 341) has been part of a field trial in in Cavallermaggiore
CN, Italy where plants of genotype 341 showed to have wider stem diameter and greater wa-
ter use efficiency than plants of genotype 223 (Beyer et al., unpubl.). The differences between
the genotypes are the reason for using them in this study.
2 Stig Larsson, European Willow Breeding AB, 2015-02-02

10
5.2 Greenhouse experiment in Uppsla, Sweden Stem cuttings from three year old shoots of the genotypes 223 and 341 were taken from a
field south of Uppsala, Sweden and planted for growing in a greenhouse. Ten centimeter (cm)
long cuttings were planted in 5.5 liters pots with a soil mixture of 1/3 planting soil (“S-jord”
from Hasselfors Garden) and 2/3 sand (sand from Askania and “silver sand” from Sibelco).
Forty cuttings of each genotype were planted and put in a greenhouse (20°C, twelve hours of
artificial light per day and 60 % air humidity) for growing seven weeks before starting the
treatment. Plants received water from table watering during the first seven weeks and addi-
tional water in pots when needed (to prevent the soil from drying out). Additionally each plant
received 250 ml fertilized water (2 ml fertilizer “Blomstra” l-1
water) (Cederroth, Upplands
Väsby, Sweden) one week before treatment, due to the slow growth rate. “Blomstra” is a
complete fertilizer with the proportions 5:1:4:0.4 of N, P, K and Mg and 2:3 of NH4+ and
NO3- (Cederroth, Upplands Väsby, Sweden) and used throughout the study.
Four sensors (two per genotype), from an EM50 data logger (Decagon Devices, Inc.
(USA)), were placed in the soil and used throughout the study (approximately 7 cm from the
stem) to collect data on soil moisture. Chlorophyll content was measured by SPAD-502
(Konita Minolta Sensing, Inc., Europe) at day of harvest and SPAD values are correlated to
leaf N content (Weih and Rönnberg-Wästljung, 2007). Data of mean levels of N were collect-
ed for each block and treatment. Measurements were taken in the middle of the leaf and on
three leaves per plant on three heights; bottom, middle and top.
The treatments were:
1) control, (watering 250 ml plant-1
every second day) (W+N-)
2) water and nutrients, watering 250 ml plant-1
every second day and 1.1 ml “Blomstra”
plant-1
once a week) (W+N+)
3) nutrients, (watering 250 ml and 1.1 ml “Blomstra” plant-1
once a week) (W-N+)
4) water shortage, (watering 250 ml plant-1
once a week) (W-N-)
Plants were seven weeks old and had an average shoot height of 27 cm when starting the
treatments. Length of each shoot was measured before treatment, to divide the plants equally
into treatments depending on height. Plants were placed in four randomized blocks (figure 1),
in greenhouse with an air humidity of 30 %, temperature of 20°C and twelve hours of artifi-
cial light per day.

11
BLOCK 1
BLOCK 3
341.3 223. 33 341.4 341.4
223.2 341.1 223.2 341.3 223.3 223.4
1 2 1 3
1 2 2 3 1 3
223.3 223.16 341.2 341. 20 223.2 341.1
341.4 223.1 223.8 341.3 341.3
4 2 2 3 4 4
4 3 4 2 4
223.2 341.35 223.2 341. 14 223.3 341.5
341.6 341.2 341.8 223.1 341. 3
3 1 1 2 3 4
3 1 3 2 1
BLOCK 2
BLOCK 4
341.2 223. 6 341.4 341. 18 223.9 341.1
341.3 341.2 223.4 223.2 341.2 223.4
2 3 1 4 1 3
2 4 2 1 3 4
341.3 223. 26 341.9 223. 5 341.2 341.1
341.4 223.4 341.1 223.3 341.2
4 1 2 4 2 1
3 4 2 3 1
223.3 223. 10 341.3 223. 11 223.4
223.4 341.3 223.3 341.7 223.7
2 4 3 2 3
1 4 3 1 2
Figure 1. The design of the greenhouse experiment. Plants were placed in randomized blocks during
treatment. Genotypes: 223 and 34; Individual plant number: number after the genotype on top row;
Treatment: number on the bottom row (1) control (blue), 2) water and nutrients (grey), 3) nutrients
(green) and 4) water shortage (red).
Baseline harvest was done when plants were eight weeks old (9th
of March) (on six plants per
genotype) and the final harvest was done three weeks of treatment (for all remaining plants;
genotype 223: W+N-: N=7, W+N+: n=8, W-N+: n=8, W-N-: n=7; genotype 341: W+N-: n=9,
W+N+: n=9, W-N+: n=9, W-N-: n=8 ). Harvest was done in the same way for both times.
Plant height and stem diameter was measured and leaves were counted and thereafter scanned
with a Ricoh Aficio MP C2051 (Ricoh Company, 2015, USA) scanner. All leaves per plant
were scanned for baseline harvest and ten representative leaves per plant were scanned for
final harvest. The program ImageJ-win32 (Rasband et al., 2014) was used for calculating leaf
area. All plant parts were thereafter dried (in 48 hours for 70 °C) and weighted. For plants
with more than one stem, the highest and widest stem were used for the statistical analysis of
stem height respectively wideness, while all data were used in analysis of aboveground bio-
mass. Soil and sand was removed from the roots under rinsing water. Three roots per plant
(approximately 10 cm long) were scanned with an Epson Perfection 4990 PHOTO (Epson
America, Inc., 2015, USA) scanner. Root area was analyzed with the program WinRhizo
Basic, Reg & Pro 2007 (Regent Instrument Inc., 2014, Québec, QC, Canada). All roots were
dried (in 48 hours for 70 °C) and thereafter weighted. Absolute and relative growth rate were
calculated as equations mentioned below (T=time).
Absolute growth rate = Final harvest − Baseline harvest
T2 − T1
Relative growth rate = LN(Final harvest) − LN(Baseline harvest)
T2 − T1

12
5.3 Field experiment in Italy Stems of genotype 223 and 341 grown in field for three years in Cavallermaggiore CN, Italy
(44°42'32.4"N 7°40'40.9"E) (about 50 km south of Turin) were collected. Plants were grown
under two treatments; control (receiving water by irrigating twice each vegetation period) and
non-irrigated treatment. Three stems from each genotype and treatment (2 genotypes * 3 repli-
cates * 2 treatments) were X-rayed with a phoenix v|tome|x (GE Measurement and Control,
2015, USA). The method is very new and a 3D-picture of an object can be produced by using
the computed tomography (CT) scan (GE, 2014) and thereafter converting raw data with the
GE image reconstruction software datos|x (GE Measurement and Control, 2015, USA) into
TIF files. In this study only 2D-pictures were analyzed. The 2D-pictures were produced by
dividing the 3D-pictures into horizontally images, showing cross-sections of the stems (figure
2). Analyses of the pictures were made with the program ImageJ-win32 (Rasband et al., 2014)
obtaining xylem data and size of annual rings.
Figure 2. Cross sections picture from X-ray analysis of willow stem showing vessel
as darker (A), white (B) or black (C) dots. Cross-section produced by the software da-
tos|x (GE Measurement and Control, 2015, USA) (A). Transformed pictures of cross-
sections produced with the program ImageJ-win32 (Rasband et al., 2014) (B, C).
5.4 Statistical analyzes Normal distribution of data was tested from the residuals of the response variable that could
not be explained by block, treatment, genotype or interaction effect from treatment and geno-
type with Shapiro-Wilk test. Homogeneity of variances (with genotype as a factor and differ-
ent respons variables) was tested with Levene test. Normal distributed data and with homoge-
neity of variance were analyzed with multi-way ANOVA and post-hoc Tukey test. Data with
non-normal distribution and/or non-homogeneity of variance were analyzed with Wilcoxon
test. All statistical analyses were done with the software R (Fox, 2005).
A B C

13
6 RESULTS
6.1 Greenhouse experiment
6.1.1 Growth rate of different above- and belowground parameters
Absolute and relative growth rate are calculated from initial (table 1) and harvested data. Ab-
solute and RGR of leaf area differed similar between the treatments within both genotypes
(table 2; table 3; figure 3; figure 4). Fertilized plants (W+N+; W-N+) produced leaf area in a
faster rate than non-fertilized plants. In conformity with growth of leaf area, the pattern of leaf
biomass absolute growth rate and RGR was similar to each other (table 2; table 3; figure 5;
figure 6). Within genotype 341 lead the combination of fertilization and irrigation (W+N+) to
both the highest RGR and growth rate for plants of leaf area and leaf biomass, for genotype
341, comparing plants within the same genotype (table 2; table 3; figure 3; figure 4; figure 5;
figure 6). Water and nutrient treated (W+N+) of genotype 223 had also the fastest absolute
growth rate and RGR of leaf area, comparing plants within the genotype, though nog signifi-
cantly faster than nutrient treated plants (table 2; table 3; figure 3; figure 4).
Table 1. Total amounts of biomass of genotype 223 and 341 at baseline harvest (DW per plant (without cutting
biomass)). T-test table with P-values and means ± 1 SE (n=3)
223 341
Initial biomass (g)
P
Biomass for the whole plant 0.22 0.43 ± 0.09 1.66 ± 0.69
Aboveground biomass 0.23
0.36 ± 0.07
1.43 ± 0.62
Belowground biomass 0.14
0.06 ± 0.02
0.23 ± 0.07
Leaf biomass 0.23
0.22 ± 0.04
0.87 ± 0.38
Stem biomass 0.21 0.11 ± 0.02 0.56 ± 0.24
Table 2. Comparison of absolute growth rates for leaf biomass, leaf area, stem height, stem biomass, above-
ground biomass and root biomass for genotype 223 and 341 with four treatments. Computed by subtracting ini-
tial data from harvested data and divided by time period of treatment ((Final harvest- Baseline harvest)/T2-T1).
Treatments: W+N- = Control, W+N+ = Water and nutrient treatment, W-N+ = Nutrient treatment, W-N- = Wa-
ter shortage treatment
Leaf Stem Aboveground Root
Genotype; Area Biomass Height Biomass Biomass Biomass Treatment (cm
2 day
-1) (g day
-1) (cm day
-1) (g day
-1) (g day
-1) (g day
-1)
223; W+N- 7.88 0.04 2.38 0.06 0.09 0.04
341; W+N- 7.95 0.04 2.25 0.06 0.10 0.07
223; W+N+ 24.84 0.08 2.75 0.08 0.15 0.04
341; W+N+ 30.09 0.11 3.48 0.14 0.25 0.08
223; W-N+ 14.58 0.05 2.60 0.05 0.10 0.03
341; W-N+ 10.02 0.03 2.66 0.06 0.09 0.04
223; W-N- 5.72 0.02 1.70 0.03 0.05 0.03
341; W-N- 1.22 0.01 2.20 0.04 0.05 0.06
Plants of genotype 223 with drought treatments (W-N-) had a higher RGR for both leaf bio-
mass (table 3; figure 6) and leaf area (table 3; figure 4) compared to genotype 341. Addition-

14
ally, fertilized and drought suffered plants (W-N+) of genotype 223 had a faster leaf biomass
growth rate (table 2; table 3; figure 5, figure 6) than plants of genotype 341. Furthermore
plants of genotype 223 had higher RGR of leaf area (table 3; figure 6), for plants with water
and nutrient treatments (W+N+) compared to genotype 341.
Table 3. Comparison of relative growth rates for leaf area, stem height and leaf, stem, aboveground and root
biomass for genotype 223 and 341 with four treatments. Computed by subtracting the natural logarithm of the
initial data from the natural logarithm of the harvested data and divided by time period of treatment ((LN(Final
harvest)-LN(Baseline harvest))/(T2-T2)). Treatments: W+N- = Control, W+N+ = Water and nutrient treatment,
W-N+ = Nutrient treatment, W-N- = Water shortage treatment
Leaf Stem Aboveground Root
Genotype; Area Biomass Height Biomass Biomass Biomass
Treatment (cm2 cm
-2 week
-1) (g g
-1 week
-)
1 (cm cm
-1 week
-1) (g g
-1 week
-1) (g g
-1 week
-1) (g g
-1 week
-)
1
223; W+N- 0.05 0.06 0.03 0.11 0.07 0.21
341; W+N- 0.02 0.02 0.03 0.04 0.03 0.22
223; W+N+ 0.10 0.10 0.05 0.12 0.10 0.20
341; W+N+ 0.05 0.06 0.05 0.08 0.07 0.24
223; W-N+ 0.08 0.09 0.05 0.11 0.09 0.19
341; W-N+ 0.02 0.02 0.03 0.05 0.04 0.21
223; W-N- 0.04 0.05 0.03 0.08 0.05 0.19
341; W-N- 0.00 0.01 0.02 0.04 0.03 0.23
There were some differences between the absolute and the relative growth rates of leaf area
(figure 3; figure 4). Plants of genotype 223 with water and nutrient treatment (W+N+) and
with water shortage treatment (W-N-) produce leaf area in a higher relative growth rate com-
pared to genotype 341 (figure 4). The opposite proportion is shown for the absolute growth
rate for plants with water and nutrient treatment (W-N+). Where plants of genotype 341 visu-
ally have faster absolute growth rate than genotype 223, though without significant differ-
ences (figure 3). On the other hand, absolute root growth rate for root biomass were signifi-
cantly faster for plants of genotype 341 with water and nutrient treatment (W+N+) and water
shortage treatment (W-N-) than plants of genotype 223 (figure 7).
Figure 3. Absolute growth rate of mean leaf area (cm
2 day
-1) of two willow genotypes (223 and 341), green-
house grown in four experimental treatments. Significant differences between treatments, within genotype, are
marked with different upper case letters (genotype 223: A-B; genotype 341: C-D) and significant differences
between genotype, within treatment, are marked with lower case letters. Treatments: W+N- = Control (blue),
W+N+ = Water and nutrient treatment (grey), W-N+ = Nutrient treatment (green), W-N- = Water shortage
treatment (red).
aA aC
aB aD
aAB aC
aA
aC
0
5
10
15
20
25
30
35
40
45
223 341 223 341 223 341 223 341
Ab
solu
te g
row
th r
ate
of
leaf
ar
ea
(cm
2 d
ay-1
)
W+N- W+N+ W-N+ W-N-

15
Figure 4. Relative growth rate of mean leaf area (cm
2 day
-1) of two willow genotypes (223 and 341), greenhouse
grown in four experimental treatments. Significant differences between treatments, within genotype, are marked
with different upper case letters (genotype 223: A-B; genotype 341: C-D) and significant differences between
genotype, within treatment, are marked with lower case letters. Treatments: W+N- = Control (blue), W+N+ =
Water and nutrient treatment (grey), W-N+ = Nutrient treatment (green), W-N- = Water shortage treatment (red).
Figure 5. Absolute growth rate of mean leaf biomass (g day
-1) of two willow genotypes (223 and 341) green-
house-grown in four experimental treatments. Significant differences between treatments, within genotype, are
marked with different upper case letters (genotype 223: A-B; genotype 341: C-F) and significant differences
between genotype, within treatment, are marked with lower case letters. Treatments: W+N- = Control (blue),
W+N+ = Water and nutrient treatment (grey), W-N+ = Nutrient treatment (green), W-N- = Water shortage
treatment (red).
Figure 6. Relative growth rate of mean leaf biomass (g day-1
) of two willow genotypes (223 and 341) green-
house-grown in four experimental treatments. Significant differences between treatments, within genotype, are
marked with different upper case letters (genotype 223: A-B; genotype 341: C-F) and significant differences
between genotype, within treatment, are marked with lower case letters. Treatments: W+N- = Control (blue),
W+N+ = Water and nutrient treatment (grey), W-N+ = Nutrient treatment (green), W-N- = Water shortage
treatment (red).
aA
aC
aB
bD
aAB
bC
aA
bC
0
0.02
0.04
0.06
0.08
0.1
0.12
0.14
0.16
223 341 223 341 223 341 223 341
Rel
ativ
e gr
ow
th r
ate
of
leaf
ar
ea
(cm
2 cm
-2 w
eek-1
)
W+N- W+N+ W-N+ W-N-
aAB aCE
aA aD
aA
bC aB
aF
0
0.05
0.1
0.15
0.2
223 341 223 341 223 341 223 341
Ab
solu
te g
row
th r
ate
of
leaf
b
iom
ass
(g d
ay-1
)
W+N W+N+ W-N+ W-N-
aAB
aCE
aA
aD
aA
bC
aB
bF
0
0.02
0.04
0.06
0.08
0.1
0.12
0.14
0.16
223 341 223 341 223 341 223 341
Rel
ativ
e gr
ow
th r
ate
of
leaf
b
iom
ass
(g
g-1
wee
k-1)
W+N- W+N+ W-N+ W-N-

16
Plants of genotype 223 with nutrient treatment (W-N+) produced aboveground biomass sig-
nificantly faster than genotype 341 according to RGR. On the contrary, plants of genotype
341 with water and nutrient treatment (W+N+) grew significantly faster than plants of geno-
type 223, according to absolute growth rate. No other significantly differences between the
genotypes within the treatments for neither absolute growth rate nor RGR were observed (ta-
ble 2; table 3). Plants of genotype 341 with water and nutrient treatment (W+N+) also pro-
duced aboveground biomass significantly faster than the other treatments within genotype
341, according to both absolute growth rate and RGR. Similar results were observed for ab-
solute root growth rate of roots, growth were significantly faster for water and nutrient treated
(W+N+) plants of genotype 341 comparing plants with nutrient treatment (W-N+) (table 2;
figure 7). Though, growth rate was not significantly faster than non-fertilized plants (W+N-;
W-N-) (table 2; figure 7).
Figure 7. Absolute growth rate of mean root biomass (g day
-1) ) of two willow genotypes (223 and 341) green-
house-grown in four experimental treatments. Significant differences between treatments, within genotype, are
marked with different upper case letters (genotype 223: A; genotype 341: B-C) and significant differences be-
tween genotype, within treatment, are marked with lower case letters. Treatments: W+N- = Control, W+N+ =
Water and nutrient treatment, W-N+ = Nutrient treatment, W-N- = Water shortage treatment.
6.1.2 Above-, belowground biomass and morphological traits
Production of aboveground biomass, size of stem diameter, leaf biomass and leaf area was
significantly affected by the genotype (table 4). Plants of genotype 341 with water and nutri-
ent treatment (W+N+) and with water shortage treatment (W-N-) produced significantly more
above ground biomass (6.7 g respectively 2.6 g) (figure 8), root biomass (1.67 g respectively
1.29 g) (figure 9) and leaf area (926 cm2 respectively 320 cm
2) (figure 10) compared to plants
of genotype 223.
Table 4. ANOVA table of F-values and P-values of aboveground biomass, stem diameter and leaf area (for the
both genotypes (223 and 341) and all four treatments (control; water and nutrients; nutrients; water shortage))
*** = p<0.001, ** = p<0.01, * = p<0.05, n.s. = p>0.05
Variable Genotype Treatment Genotype : Treatment Block
F-value P-value F-value P-value F-value P-value F-value P-value
Aboveground biomass (g) 15.61 *** 11.95 *** 1.85 n.s. 0.02 n.s.
Stem diameter (cm) 6.40 * 2.54 n.s. 0.34 n.s. 0.47 n.s.
Leaf area (cm2) 23.70 *** 20.75 *** 1.12 n.s. 1.55 n.s.
aA
aBC
aA
bB
aA aC aA
bBC
0
0.02
0.04
0.06
0.08
0.1
0.12
0.14
0.16
0.18
223 341 223 341 223 341 223 341
Ab
solu
te g
row
th r
ate
ofr
oo
t b
iom
ass
(g d
ay-1
)
W+N- W+N+ W-N+ W-N-

17
Figure 8. Mean aboveground biomass (g) of two willow genotypes (223 and 341) greenhouse-grown in four
experimental treatments. Significant differences between treatments, within genotype, are marked with different
upper case letters (genotype 223: A; genotype 341: B-C) and significant differences between genotype, within
treatment, are marked with lower case letters. Treatments: W+N- = Control (blue), W+N+ = Water and nutrient
treatment (grey), W-N+ = Nutrient treatment (green), W-N- = Water shortage treatment (red).
Figure 9. Mean root biomass (g) of two willow genotypes (223 and 341) greenhouse-grown in four experimental
treatments. Significant differences between treatments, within genotype, are marked with different upper case
letters (genotype 223: A-B; genotype 341: C-D) and significant differences between genotype, within treatment,
are marked with lower case letters. Treatments: W+N- = Control (blue), W+N+ = Water and nutrient treatment
(grey), W-N+ = Nutrient treatment (green), W-N- = Water shortage treatment (red).
Figure 10. Mean leaf area (cm
2) of two willow genotypes (223 and 341) greenhouse-grown in four experimental
treatments. Significant differences between treatments, within genotype, are marked with different upper case
letters (genotype 223: A-B; genotype 341: C-D) and significant differences between genotype, within treatment,
are marked with lower case letters. Treatments: W+N- = Control (blue), W+N+ = Water and nutrient treatment
(grey), W-N+ = Nutrient treatment (green), W-N- = Water shortage treatment (red).
aA
aB aA
bC
aA aB
aA
bB
0
2
4
6
8
10
223 341 223 341 223 341 223 341
Ab
ove
gro
un
d b
iom
ass
(g)
W+N- W+N+ W-N+ W-N-
aA aBC
aA
bB
aA aC aA
bBC
0.0
0.5
1.0
1.5
2.0
2.5
3.0
223 341 223 341 223 341 223 341
Ro
ot
bio
mas
s (g
)
W+N- W+N+ W-N+ W-N-
aA
aB
bD
aAB
aC
aA
bC
0
200
400
600
800
1000
1200
223 341 223 341 223 341 223 341
Leaf
are
a (c
m2 )
W+N- W+N+ W-N+ W-N-
bC

18
Plants of genotype 341 with water and nutrient treatment (W+N+) produced the greatest
amount of aboveground biomass, leaf biomass and leaf area. Similar, fertilized plants
(W+N+; W-N+) of genotype 223 produced greater leaf area and leaf biomass comparing the
other treatments within genotype 223 (figure 10; figure 11). Production of aboveground bio-
mass and root biomass of genotype 223 were on the other hand not significantly affected by
the treatments (figure 8; figure 9). Additionally plants of genotype 341 with water shortage
treatment (W-N-) produced significantly more leaf biomass (figure 11) (1.06 g) than genotype
223 (0.64 g) and plants of genotype 341 visually produced wider stems than plants of geno-
type 223.
Figure 11. Mean leaf biomass (g) of two willow genotypes (G223 and G341) greenhouse-grown in four experi-
mental treatments. Significant differences between treatments, within genotype, are marked with different upper
case letters (genotype 223: A-B; genotype 341: C-D) and significant differences between genotype, within
treatment, are marked with lower case letters. Treatments: W+N- = Control (blue), W+N+ = Water and nutrient
treatment (grey), W-N+ = Nutrient treatment (green), W-N- = Water shortage treatment (red).
Water shortage plants (W-N-) of genotype 341 produced significantly more root biomass in
relation to shoot biomass compared with the other treatments within genotype 341 (figure 12).
Water and nutrient treated plants (W+N+) and water shortage treated plants (W-N-) of geno-
type 341 produced significantly more root biomass in relation to shoot biomass compared
with plants of genotype 223 (table 6; figure 12). The relationship were inversely for plants
with control treatment (W+N-) and with nutrient treatment (W-N+), though without signifi-
cance differences between the genotypes (table 7; figure 12). Nutrient treated plants (W-N+)
of genotype 223 produced significantly longer roots (231 m g-1
) than plants of genotype 341
(175 m g-1
) (table 6; table 5). No other significant observations were made regarding SRA,
SRL (table 6; table 7) or stem height.
Table 5. Absolute values of specific root area (SRA) and specific root length (SRL) for roots of two genotypes
(223 and 341) with four treatments (W+N- = Control, W+N+ = Water and nutrient treatment, W-N+ = Nutrient
treatment, W-N- = Water shortage treatment).
SRA m2 g-1 SRL m g-1
223 341 223 341
W+N- 0.17 0.16 267 257
W+N+ 0.25 0.17 322 237
W-N+ 0.17 0.13 231 175
W-N- 0.17 0.13 265 190
aAB
aCE aA
aD
aA aC
aB bE
0
0.5
1
1.5
2
2.5
3
3.5
4
223 341 223 341 223 341 223 341
Leaf
bio
mas
s (g
)
W+N- W+N+ W-N+ W-N-

19
Table 6. Wilcoxon table of p-values of differences in leaf biomass, root biomass, shoot to root ratio, specific
root area and specific root length between genotypes (223 and 341) within treatments (W+N- = Control, W+N+
= Water and nutrient treatment, W-N+ = Nutrient treatment, W-N- = Water shortage treatment). Differences
between genotypes are marked with:
** = p<0.01, * = p<0.05, n.s. = p>0.05
Leaf biomass (g) Root biomass (g) Shoot : Root SRA SRL
Treatment Between genotypes
W+N- n.s. n.s. n.s. n.s. n.s.
W+N+ ** * * n.s. n.s.
W-N+ n.s. n.s. n.s. n.s. *
W-N- * * * n.s. n.s.
Figure 12. Mean root to shoot ratio of two willow genotypes (G223 and G341) greenhouse-grown in four exper-
imental treatments. Significant differences between treatments, within genotype, are marked with different upper
case letters (genotype 223: A-B; genotype 341: C-D) and significant differences between genotype, within
treatment, are marked with lower case letters. Treatments: W+N- = Control (blue), W+N+ = Water and nutrient
treatment (grey), W-N+ = Nutrient treatment (green), W-N- = Water shortage treatment (red).Morphological
results
Table 7. Wilcoxon table of p-values of differences in leaf biomass, root biomass, shoot to root ratio, specif-
ic root area and specific root length between treatments (W+N- = Control, W+N+ = Water and nutrient
treatment, W-N+ = Nutrient treatment, W-N- = Water shortage treatment) within genotypes (223 and 341).
Differences between genotypes are marked with:
** = p<0.01, * = p<0.05, n.s. = p>0.05
Leaves (g) Roots (g) Shoot : Root SRA SRL
Within genotype
Treatment 223 341 223 341 223 341 223 341 223 341
W+N- & W+N+ n.s. *** n.s. n.s. * ** n.s. n.s. n.s. n.s.
W+N- & W-N+ n.s. n.s. n.s. n.s. ** * n.s. n.s. n.s. n.s.
W+N- & W-N- n.s. n.s. n.s. n.s. n.s. * n.s. n.s. n.s. n.s.
W+N+ & W-N+ n.s. *** n.s. * n.s. n.s. n.s. n.s. n.s. n.s.
W+N+ & W-N- * *** n.s. n.s. ** *** n.s. n.s. n.s. n.s.
W-N+ & W-N- ** ** n.s. n.s. n.s. *** n.s. n.s. n.s. n.s.
aA
aD
aB
bE aBC
aE aAC
bF
0
2
4
6
8
10
12
14
223 341 223 341 223 341 223 341
Sho
ot
to r
oo
t ra
tio
W+N- W+N+ W-N+ W-N-

20
Nineteen of the replicates had some abscised leaves by time of harvest (5 with water and nu-
trient treatment; 8 with nutrient treatment; 6 with water shortage treatment). Sixteen of nine-
teen were of genotype 341, and the three of genotype 223 had nutrient treatment (2 plants)
and water shortage treatment (1 plant). Abscised leaves are not included in the analysis.
6.1.3 Nitrogen content and nitrogen concentration in leaves
Fertilized plants had a higher N content compared with unfertilized plants (figure 13) and
lowest N content was observed in the bottom of the plant (table 8). The N content and the N
concentration depended on genotype and nutrient availability (table 8; table 9), additionally
did water availability impact N concentration (table 9). Plants of genotype 223 with water and
nutrient treatment (W+N+) and plants with water shortage treatment (W-N-) had a significant-
ly higher N content than plants of genotype 341 (figure 13), however no significantly differ-
ences in N concentration were observed. A higher N content or greater N concentration could
not be observed due to drought. Though, N content in the bottom of drought suffered plants
(W-N+; W-N-) showed a positive correlation with aboveground biomass (R = 0.85), the cor-
relation between the two parameters declined in the middle and the top of the plant. Addition-
ally, genotype 223 showed to contain more N in relation to absolute growth rate compared
with genotype 341.
Figure 13. Significant differences of mean leaf N content for the whole plant between treatments, within geno-
type, are marked with different upper case letters (genotype 223: A-B; genotype 341: C-D) and significant dif-
ferences between genotype, within treatment, are marked with lower case letters. Treatments: W+N- = Control,
W+N+ = Water and nutrient treatment, W-N+ = Nutrient treatment, W-N- = Water shortage treatment.
Table 8. ANOVA table for N content (SPAD values) in leaves at three heights (bottom, middle and top) at all
willow plants (genotype 223 and 341 with four treatments; control, water and nutrient, nutrient, water shortage)
used in the greenhouse experiment at final harvest.
.*** = p<0.001, ** = p<0.01, * = p<0.05, n.s. = p>0.05
Top of plant Middle of plant Bottom of plant
F value P value F value P value F value P value
Genotype 1.47 n.s. 26.50 *** 8.27 **
Treatment 43.62 *** 18.25 *** 14.81 ***
Treatment:Genotype 0.68 n.s. 2.82 n.s. 2.17 n.s.
Block 0.18 n.s. 1.11 n.s. 0.83 n.s.
aA aC
aB bD
aB
aD aA
bC
0
10
20
30
40
50
223 341 223 341 223 341 223 341
N c
on
ten
t (S
PA
D v
alu
es)
W+N- W+N+ W-N+ W-N-
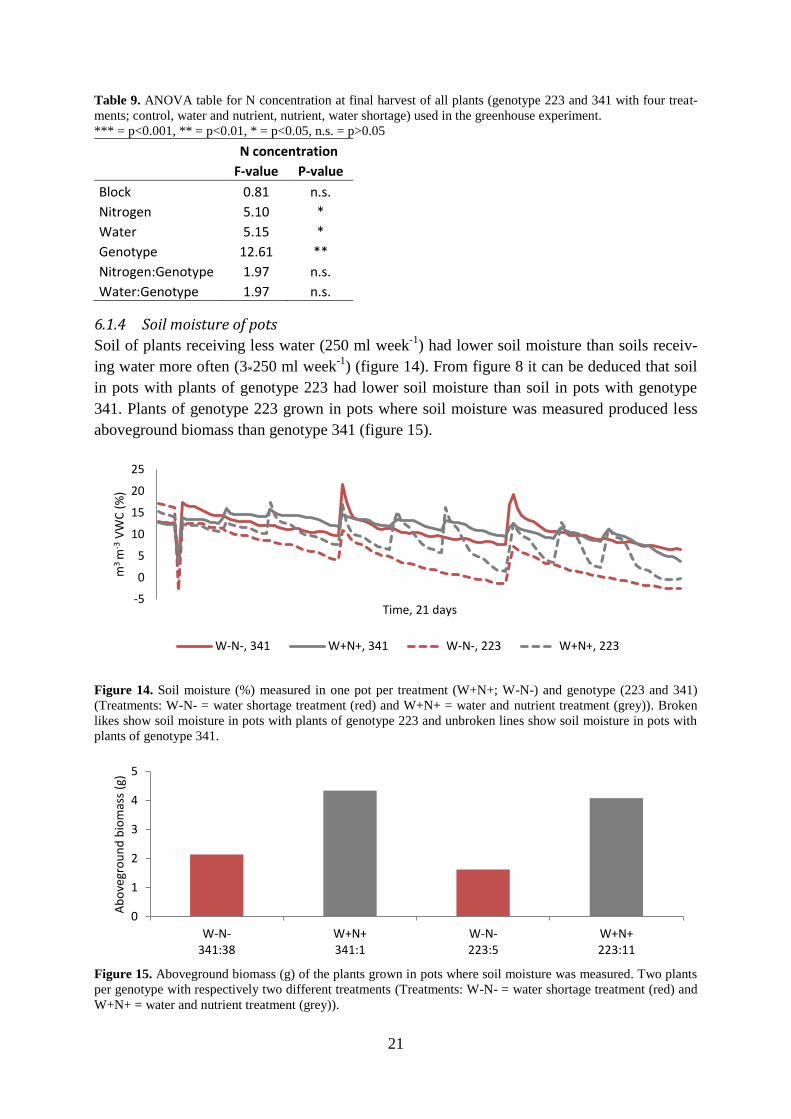
21
Table 9. ANOVA table for N concentration at final harvest of all plants (genotype 223 and 341 with four treat-
ments; control, water and nutrient, nutrient, water shortage) used in the greenhouse experiment.
*** = p<0.001, ** = p<0.01, * = p<0.05, n.s. = p>0.05
N concentration
F-value P-value
Block 0.81 n.s.
Nitrogen 5.10 *
Water 5.15 *
Genotype 12.61 **
Nitrogen:Genotype 1.97 n.s.
Water:Genotype 1.97 n.s.
6.1.4 Soil moisture of pots
Soil of plants receiving less water (250 ml week-1
) had lower soil moisture than soils receiv-
ing water more often (3*250 ml week-1
) (figure 14). From figure 8 it can be deduced that soil
in pots with plants of genotype 223 had lower soil moisture than soil in pots with genotype
341. Plants of genotype 223 grown in pots where soil moisture was measured produced less
aboveground biomass than genotype 341 (figure 15).
Figure 14. Soil moisture (%) measured in one pot per treatment (W+N+; W-N-) and genotype (223 and 341)
(Treatments: W-N- = water shortage treatment (red) and W+N+ = water and nutrient treatment (grey)). Broken
likes show soil moisture in pots with plants of genotype 223 and unbroken lines show soil moisture in pots with
plants of genotype 341.
Figure 15. Aboveground biomass (g) of the plants grown in pots where soil moisture was measured. Two plants
per genotype with respectively two different treatments (Treatments: W-N- = water shortage treatment (red) and
W+N+ = water and nutrient treatment (grey)).
-5
0
5
10
15
20
25
m3
m-3
VW
C (
%)
Time, 21 days
W-N-, 341 W+N+, 341 W-N-, 223 W+N+, 223
0
1
2
3
4
5
W-N-341:38
W+N+341:1
W-N-223:5
W+N+223:11
Ab
ove
gro
un
d b
iom
ass
(g)

22
6.2 Field experiment Vessel area were significantly affected by water availability (table 10), with a visually greater
vessel area for irrigated plants (figure 16) and significantly greater vessel area for irrigated
plants of genotype 223 (figure 16). In contrary, genotype 341 produced significantly greater
total vessel area (228 mm2 stem
-1) compared to genotype 223 (102 mm
2 stem
-1) (table 10),
with the greatest area for irrigated plants (237 mm2). Whereas genotype 223 produced the
greatest area for non-irrigated plants (88 mm2
stem-1
). Though, no significant observations
were made between the treatments within respective genotype.
Table 10. ANOVA table of measured variables (amounts of vessels, mean vessel area, total vessel area, stem
diameter, annual ring 1-3) of stems from Italy. Treatments: irrigated and non-irrigated. Genotypes: 223 and 341.
*** = p<0.001, ** = p<0.01, * = p<0.05, n.s. = p>0.05
Treatment Genotype Treatment : Genotype
Variable F-value P-value F-value P-value F-value P-value
Amounts of vessels 0.62 n.s. 5.10 n.s. 0.06 n.s.
Mean vessel area 25.84 *** 2.72 n.s. 1.71 n.s.
Total vessel area 0.01 n.s. 6.14 * 0.22 n.s.
Stem diameter 1.45 n.s. 5.23 n.s. 0.12 n.s.
Annual ring 1 0.40 n.s. 0.34 n.s. 0.64 n.s.
Annual ring 2 0.78 n.s. 4.95 n.s. 0.00 n.s.
Annual ring 3 1.48 n.s. 3.31 n.s. 0.02 n.s.
Figure 16. Column diagram of mean vessel area (mm
2) for different treatments (irrigated = W+ (blue); non-
irrigated = W- (red)). Significant differences between genotypes with uppercase letters (genotype 223: A-B;
genotype 341: C).
Genotype 341 produced wider stem diameter compared to genotype 223 (p = 0.0515) and
irrigation did not seem to have an on impact stem diameter (table 10). Thought, stem diameter
showed to be positive correlated with total vessel area (R = 0.93) (figure 17A) and amounts of
vessels (R = 0.96) (figure 17B).
A C
B C
0.000
0.005
0.010
0.015
0.020
0.025
0.030
223 341 223 341
Mea
n v
esse
l are
a (m
m2
vess
el-1
)
W+ W-

23
Figure 17. Scatter plot of stem diameter and total vessel area per stem (mm
2) (A) and amounts of vessels (B) for
two genotypes (223 and 341) and two treatments (irrigated and non-irrigated). Data collected from plants grown
in field in Italy for three years. Stem diameter: y = 11.105x - 75.087, R² = 0.86). Amounts of vessels: y =
703.55x – 6525, R² = 0.92.
Correlation between amounts of vessels and mean vessel area is plotted in a scatterplot dia-
gram (figure 18), showing a negative correlation of the fewer vessels the greater area. The low
R-value (R= 0.51) indicates poor correlation between the two parameters.
Figure 18. Scatter plot of mean amount of vessels and mean vessel area, y = -17169ln(x) – 58386 (R² = 0.28),
for two genotypes (223 and 341) and two treatments (irrigated and non-irrigated).
A negative linear correlation between amounts of vessels and δ13
C (R = 0.77) respectively
standardized WUE (R = 0.79) is shown in figure 19. The lower content of δ13
C in correlation
with a greater amounts of vessels (figure 19A) is related to the standardized WUE (figure
19B), due to a lower WUE indicates a higher water use and higher range or longer period of
open stomata and thereby a lower uptake of 13
C. All though no true conclusions can be made,
R² = 0.86
0
50
100
150
200
250
300
350
400
0 5 10 15 20 25 30 35 40
Tota
l ves
sel a
rea
mm
2) A
R² = 0.92
0
5000
10000
15000
20000
25000
0 5 10 15 20 25 30 35 40
Am
ou
nts
of
vess
els
Stem diameter (mm)
B
R² = 0.2649
-
5 000
10 000
15 000
20 000
25 000
0.0000 0.0050 0.0100 0.0150 0.0200 0.0250 0.0300
Am
ou
nts
of
ves
sels
Mean vessel area (mm2)

24
due to few replicates (n=2 per genotype; treatment: W-). Additionally, genotype 223 had few-
er amounts of vessels compared to stems of genotype 341.
Figure 19. Scatter plot of mean amounts of vessels and δ13C (y = -0.0002x - 27.375; R² = 0.60) (A) and stand-
ardized water use efficiency (y = -0.0002x - 26.859; R² = 0.62) (B) for two genotypes (23 and 341) and non-
irrigated plants. Data collected from plants grown in field in Italy for three years.
R² = 0.60 -33
-32
-31
-30
-29
-28
-27
-26
0 5000 10000 15000 20000 25000
δ1
3 C
A
R² = 0.62
-33
-32
-31
-30
-29
-28
-27
-26
0 5000 10000 15000 20000 25000
Stan
dar
diz
ed W
UE
Amounts of vessels
B

25
7 DISCUSSION
7.1 Greenhouse experiment For this experiment, plants of genotype 341 with water and nutrient treatment (W+N+) pro-
duced the greatest aboveground biomass, leaf biomass and leaf area. All wanted traits for bio-
energy production, thus the aboveground biomass of willow is used for the energy production.
Irrigation of plants of genotype 341 increased growth of aboveground biomass and drought
reduced biomass production, which is a well-known effect (Wikberg and Ögren, 2007).
Drought suffered plants (W-N+; W-N-) of genotype 341 reduced its aboveground biomass
with 27 % for non-fertilized plants (W-N- vs. W+N-) and with 51 % for fertilized plants
(W+N+ vs. W-N+), indicating the impact of drought events for yield. In contrary, irrigation of
genotype 223 did not significantly affect aboveground biomass production. Possibly due to an
overall lower growth of genotype 223 during the experiment.Previous results also states in-
significant effect of drought on some genotypes (Van Splunder et al., 1996).
Just like Silvola & Ahlholm (1992) this study shows that the nitrogen level in the soil is
reflected in the plants. In opposite from other studies (Glynn et al., 2004; Weih et al., 2011)
this study could not confirm that drought suffered plants have a greater N concentration than
well-watered plants. A reason for this may be the short period of treatment. It is also stated
that a limited water acquisition can lead to declined N uptake, even though there is available
N (Corbeels et al., 1998). Neither this could be confirmed by this study, thus greatest N con-
tent was observed in plants receiving N, independent of availability of water.
Nutrient treated plants (W-N+) for genotype 223 produced significantly longer roots
than genotype 341, but no other significant differences regarding SRL or SRA were shown.
Though, I can confirm that the genotype plays important roles for root production and that
low water conditions led to greater root biomass compared to well-watered conditions. For
both irrigated and fertilized (W+N+) conditions and non-irrigated and non-fertilized (W-N-)
conditions plants of genotype 341 produced significantly more root biomass than plants of
genotype 223. Thereby, genotype 341 has bigger resources for taking up water and solved
nutrients for producing more biomass (Lambers et al., 2006). The differences between the
genotypes may also indicate that genotype 341 is better suited for rapid environmental chang-
es due to the bigger root system.
Greenhouse experiments have some advantages compared to a field experiments. The trials
are under relatively controlled conditions, for example regarding air humidity, temperature,
irrigation (no precipitation) and fertilization (no additional due to droppings etc.). One ad-
vantage with this experiment was the possibilities to have four different treatments which
symbolized different growing conditions in relation to water and nutrients. It was beneficial to
be able to see the genotypes’ reactions in the different treatments and also to see how the gen-
otypes differed from each other within each treatment.
Another advantage with this study was the usage of already relatively known genotypes.
Different amounts of biomass production of the two genotypes were expected, due to the dif-
ferent amounts of production, of the used genotypes, in the Italian field experiment (Beyer et
al., unpubl.). This greenhouse experiment can therefor contribute with important results af-
fecting future studies regarding these genotypes and conclude that genotype 341 is probably
better suited for biomass production than genotype 223.

26
One of the limitations with the greenhouse experiment were the slow emerge of plants of gen-
otype 223, leading to great differences in initial biomass production between the plants of
genotype 223 and also a lower initial production of genotype 223 compared to genotype 341.
Of course it would have been easier if all plants were in the same growth stage when treat-
ment period started, but it can be hard to influence especially due to the genetic differences.
When harvesting the plants and removing the cuttings from the soil it appeared that some of
the shoots of genotype 223 grew from nodes in the bottom of the cutting. Consequently the
shoots had to grow through the soil before reaching soil above soil surface. Plants of genotype
341 did not emerge in this way and the differences in emerging decreased growth of genotype
223 compared to genotype 341. This emerging trait of genotype 223 is unfavorable for a
commercial genotype and from that perspective is genotype 223 not recommended to use for
bioenergy production.
To compensate for the differences in initial production I calculated RGR for leaf area,
stem height and leaf, stem, aboveground and root biomass to evaluate the differences growth
between both the genotypes and to see how the treatments affected growth rate. Though, there
are some problems with this equation generating in misleading information. Growth rate of
plants tend to slow down with growth and therefore a low initial size will generate a greater
RGR (Philipson et al., 2012). This is a possible reason for the greater RGR of genotype 223
compared to genotype 341, thus generally genotype 341 produced greater biomass throughout
the experiment with a greater absolute growth rate. Additionally, results from the field trial in
Italy (where stems to this study were collected) show that genotype 223 has a total lower bi-
omass production after three years compared to genotype 341 (Beyer et al., unpubl.). This
indicates that growth rate of genotype 223 is lower and thereby may the RGR calculations in
this study be misleading.
For future greenhouse experiment similar to this I recommend to measure soil moisture
in more pots than in only four. The result from this study only provides indications of differ-
ences between the genotypes and the treatments and it would be interesting to closer evaluate
the water use of the plants. The pots where soil moisture was measured plants of genotype
223 had a lower soil moisture compared to the pots were plants of genotype 341 grew. Addi-
tionally, the plants of genotype 223 produced less aboveground biomass indicating that geno-
type 223 has a lower WUE according to explanations of WUE by Condon et al. (2002) and
Slípková and Pokorný (2012). Though, as mentioned before these results are limited due to
few replicates but shows an indication of the genotypes’ water use and aboveground produc-
tion.
Even though it is not unusual that older leaves of plants lead to abscission for example
due to self-shading and translocation of nutrients to younger plant parts (Weih and Rönnberg-
Wästljung, 2007) this phenomenon might affected the results of leaf and aboveground bio-
mass negatively. Thus the treatment period only lasted for three weeks the loss of leaf bio-
mass differed between the genotypes and thereby changed the proportion of living leaf bio-
mass at harvest time compared to total produced biomass under time of growth. Most of the
replicates with abscised leaves were of genotype 341, this in combination with the overall
higher biomass production of genotype 341 indicates higher growth potential compared to
genotype 223. Another reason for abscised leaves, except from the natural behavior, can be
drought (Savage et al., 1999) or N deficit (Larsen 1998). N deficit is firstly shown on older

27
leaves, the leaves turns yellow and thereafter becomes necrotic (Larsen 1998) and have also
seen yellow and necrotic leaves on plants in the greenhouse experiment.
Finally, a longer experiment is recommended for future studies. Due to low emerge and
slow growth in the beginning of the experiment delayed start of treatment resulted in a shorter
treatment period. A longer time before the start of the treatment would probably have in-
creased the initial production, especially of plants of genotype 223 and decreased the initial
production between the genotypes. A longer treatment period may have generated significant
differences in N concentration between irrigated and non-irrigated plants and decreased dif-
ferences between the genotypes in amounts of abscised leaves. It may also generate greater
differences in both aboveground biomass production between the genotypes based on geno-
types’ biomass production in Italy (Beyer et al., unpubl.) and also in increased differences for
root biomass production. However, longer treatment period does not always generate signifi-
cant differences in root biomass production (Van Splunder et al., 1996). This study did not
show any significant differences in neither SRL nor SRA due to low water conditions, some-
thing a longer treatment is expected to show. At least for root length, where both drought
(Van Splunder et al., 1996; Rytter and Hansson, 1996) and N deficit (Ericsson, 1981) has
shown to lead to longer roots. Another possible reason for insignificance differences between
genotypes for above mention parameters may also, of course, be that there are no or few
genotypic differences for these parameters and different responses between the genotypes are
not to be expected.
Water and nutrient treatment (W+N+) is shown to significantly increase growth rate of
aboveground biomass production for plants of genotype 341. Availability of nutrients
played a significant role in absolute leaf area growth rate, for both genotypes and for
RGR of genotype 223. This study can therefore state that N deficit can lower growth, like
previously proven (Campbell et al., 2008; Ericsson 1981; Taylor, 1993; Tahvanainen, 1999;
Cunningham et al., 1999). Though, something that should be taken in consideration is the
great standard deviations for growth rate of leaf area, in spite of high values
there are significant differences between treatments, indicating that growth beneficial treat-
ments (high water availability and N fertilization) are important for high production.
Nutrients also positively impacted absolute growth rate of leaf biomass of genotype 341
but not RGR for neither one of the genotypes. Though, RGR of leaf biomass is significantly
slower for water shortage plants (W-N-) of genotype 223 compared to fertilized plants
(W+N+; W-N+) showing that drought slows down growth. On the other hand there are no
significant differences in RGR of leaf biomass between control treated plants (W+N-) and
water shortage plants (W-N-) nor between control treated plants (W+N-) and fertilized plants
(W+N+; W-N+).
This study shows that the genotype plays an important role for absolute root growth rate
during favorable (W+N+) or water and nutrient limiting conditions (W-N-), genotype 341
produced root biomass faster than genotype 223. Choice of genotype can thereby be determin-
ing for final biomass production. On contrary, genotype is not a significant factor for root
growth rate during good or bad conditions (W+N-; W-N+). Like other studies (Glynn et al.,
2004; Van Splunder et al., 1996; Lambers et al., 2006) this study shows a proportionally in-
creased root production due to drought. Though only for water shortage treated plants (W-N-)

28
of genotype 341. The N effect of nutrient treated plants (W-N+) may have increased above-
ground biomass production and thereby increased the shoot to root ratio.
The only significant differences in root biomass production (within the genotypes) are
for plants of genotype 341 between water and nutrient treatment (W+N+) and nutrient treat-
ment (W-N+), indicating that available water increase root biomass. Possibly due to that
plants with water and nutrient treatment (W+N+) produced more coarse roots in relation to
fine roots, and thereby increases root weight more than for nutrient treated plants (W-N+)
(Ryan et al., 1995). The greater root system of plants of genotype 341 with water and nutrient
treatment (W+N+) and water shortage treatment (W-N-) compared to the root system of geno-
type 223. A greater root system facilitates water and nutrient uptake (Campbell et al., 2008)
because of its greater nutrient uptake area compared to a smaller root system (Lambers, 2006)
and the root system can thereby continue to grow even bigger. The greater root system of
genotype 341 is reflected in the greater production of aboveground biomass compared to gen-
otype 223, indicating that the greater root system simplifies water and nutrient uptake and
biomass production.
N content in immature leaves depends on the development stage, cell division or cell
elongation. During cell division increases biomass, through synthesis of high N/C cytoplas-
mic material. Cell elongation is driven by water and ion uptake in combination of increasing
cell walls (Roggatz et al., 1999). N content may thereby differ between the leaves depending
on where it is in the cycle. This is a reason for insignificant results between N content and the
treatments respectively the genotypes for the upper and immature leaves. N content measure-
ments are therefore recommended to mature leaves for a representative result.
Plants of genotype 223 has a visually greater N concentration and N content than plants
of genotype 341, thus the results are not significant it is uncertain to make conclusions.
Though, it might be related to that drought suffered plants have shown to increase its N con-
centration (Glynn et al., 2004; Weih et al., 2011) because the results from this study indicates
that genotype 223 suffer more from drought than genotype 341.
7.2 Field experiment Mean vessel area was significantly greater for irrigated plants of genotype 223 and visually
greater for irrigated plants of genotype 341, showing that environmental factors affect the size
of the vessels and thereby affect the water transport in the plants. Total vessel area and the
amounts of vessels, on the other hand, was insignificantly affected by the treatments (irrigated
or non-irrigated), but rather affected by genotype. Plants of genotype 341 produced greater
total vessel area than genotype 223 and tended to have greater total vessel area for irrigated
plants. In contrary plants of genotype 223 produced greater total vessel area for non-irrigated
plants. The differences between the genotypes indicate that it is important to breed for geno-
types that can resist rapid temporal or seasonal changes in water availability as well as for
genotypes adapted for different environments.
One advantage of this part of the study is that the analyzed stems are field grown and the
plants may therefore look more similar to plants at commercially grown field compared to
greenhouse grown plants.
The used X-ray method is fine scaled and can obtain 3D-pictures and thereby possibili-
ties for analyzing for example vessel length or other vertical tissues. Even though only cross-

29
sections of the stems were used in this study, the collected data can be used for future studies.
It would for example be interesting to analyze if length of vessel element differed between
both the genotypes and irrigated versus non-irrigated conditions.
It worked well with the X-ray analysis, though a higher resolution would increase the reliabil-
ity of the analysis. The lower resolution aggravated the analysis and may have led to mislead-
ing results, for example it was difficult to distinguish the different annual rings from each
other.
A field experiment can be more challenging to control compared to a greenhouse experiment,
due to weather related difficulties and a field experiment has thereby more uncontrolled influ-
encing parameters. Weather can interfere with optimal growth and thereby change growth
pattern (Worbes, 1999; Walker et al, 2015), this may have happened in this field trial and the
unexpected variability in the data caused low statistical power regarding annual rings.
The field experiment had also problems with insects. The insects lowered the leaf area
by eating leaf tissue. Herbivory generates in smaller photosynthetic area and risk of reduced
photosynthetic capacity in remaining tissue (Zangerl et al., 2002) and thereby lower incorpo-
rated energy.
A limitation with the analysis of the stems from the field experiment was that the stems
were too few for providing reliable results, though the results shows indications and can be
reason for future studies. Choice of replicates were based on stem diameter, choosing the
smallest, middle and largest from each genotype and treatment because the analyzed were
about to focus on mean vessel area and not stem diameter nor annual rings. That is probably
the reason for insignificant results regarding diameter and ring size related to soil water status
and the results from this experiment does not agree with Worbes (1999) and Walker et al.
(2015) stating that availability of water affects size of annual rings. Additionally only four
replicates (n=2 genotype-1
) were included in the regression analysis of amounts of vessels and
δ13
C respectively standardized WUE, due to lack of data (of δ13
C and standardized WUE),
more replicates are needed to improve reliability.
Just as other studies have shown (Hilarie and Graves, 1998; Kulkarni et al., 2010; Plavcová
and Hacke, 2012) the water availability influenced the vessels; non-irrigated plants had a
smaller mean vessel area than irrigated plants. Mean vessel area influences water conduction
because conduction capacity scales as diameter to the fourth power (Tyree and Zimmerman,
2002; Wilson and Jackson, 2006), this in turn affects the transpiration, carbon fixation and
eventually growth (Poorter et al., 2010). Growth rate have shown to be positively related to
vessel diameter (Hoeber et al., 2014). Due to greater mean vessel area of genotype 223, plants
of genotype 223 might have a greater growth rate than genotype 341. This was also shown in
RGR calculations from the greenhouse experiment. Thus there are some doubts regarding the
RGR for genotype 223 the above mentioned relation between vessel diameter and growth rate
may not be applicable for this study.
Genotype 223 both had smaller total vessel area and fewer amounts of vessels compared
to genotype 341, because stem diameter were smaller. This may indicate a higher conductivity
of plants of genotype 223 thus higher conductivity is offered by fewer larger vessels com-
pared to many smaller vessels (Sperry et al., 2007), but a high density of smaller vessels in-

30
crease resistance against embolism (Ewers et al., 2007). The possibly higher conductivity of
plants of genotype 223 can be correlated with the results from the soil moisture measurement
in the greenhouse experiment, where plants of genotype 223 seemed to transpire more water
than plants of genotype 341, and were thereby less water use efficient.
Total vessel area and amounts of vessels showed to be positive correlated with stem di-
ameter, with a greater stem diameter for genotype 341. Greater stem diameter for genotype
341 was also shown by Beyer at al. (unpubl.) Previous studies (Seguara, 2006; Brown, 1997)
have shown positive correlations between stem diameter and aboveground biomass produc-
tion, based on their results total vessel area and the amounts of vessels may be positive corre-
lated with aboveground biomass production as well. If this theory is applicable, data for
aboveground biomass can be calculated based on either amounts of vessels, total vessel area
or possibly even standardized WUE or δ13
C. This because the amounts of vessels were corre-
lated with both δ13
C and standardized WUE. Growth rate have shown to be negatively related
with wood density and amounts of vessel respectively δ13
C (Hoeber et al., 2014) and thus the
greenhouse experiment showed a lower RGR for genotype 341 and the field experiment
showed a greater amounts of vessels and lower values of δ13
C the observations of Hoeber et
al. (2014) may be applicable to the results of this study.

31
8 CONCLUSIONS
Aboveground biomass productions of plants of genotype 341 were negatively affected by
drought. Plants of genotype 223 were in contrary not significantly affected, though they pro-
duced significantly less aboveground biomass compared to genotype 341 (for water and nutri-
ent treated (W+N+) and water shortage treated plants (W-N-)). Significantly slower absolute
growth rate or RGR could not been observed due to drought and no changes in root morphol-
ogy were measured.
However, plants of genotype 341 seem to have a greater drought tolerance than plants
of genotype 223, especially under low nutrient conditions. Vessel area was negatively affect-
ed by drought conditions. Finally, fertilization increased growth and the combination of irri-
gation and fertilization increased aboveground biomass, leaf area and leaf biomass production
significantly for plants of genotype 341.
To sum up; it is still unclear if genotype 223 or genotype 341 is the best genotype to grow for
bioenergy production under dry and nutrient poor conditions. Even though genotype 341 pro-
duced the greatest amount of aboveground biomass, genotype 223 seem to have traits corre-
lating to high relative growth rate and aboveground biomass production. Future studies within
both morphology and anatomy are needed for deeper evaluations. Thus, analyzing the differ-
ent anatomical traits of the xylem will contribute with further insight into the plant mecha-
nism and level of adaptation to drought.
If expanding the vessel analyze it would be interesting look at the relationship between vessel
area and annual rings and thereafter connect the results to climate data. It would also be inter-
esting to take a closer look at and see how the vessel area changes depending on time of pro-
duction.
For handling future energy questions and the development of bioenergy crops more re-
search regarding willow and other SRC’s is demanded. A tolerant and sustainable genotype is
desired for growing. It is also important to develop genotypes for specific climates, to opti-
mize production and secure energy resources.

32
9 AKNOWLEDGEMENT
I would like to express the deepest appreciation to my supervisor Friderike Beyer for being
there and guiding me throughout the study process. Thanks to my co-supervisor Prof. Martin
Weih for relevant advices and to Johannes Koestel and Stefan Andersson for helping out with
X-ray and image editing. I also would like to thank Postdoc. Dimitrije Markovic for help with
installing the program WinRhizo (root scanning) and Senior Lecturer Jan-Eric Englund for
statistical recommendations.

33
10 REFERENCES
Barbour, M.A., Rodriguez-Cabal, M.A., Wu, E.T., Julkunen-Tiitto, R., Ritland, C.E., Mis-
campbell, A.E., Jules, E.S. & Crutsinger, G.M. (2015). Multiple plant traits shape the ge-
netic basis of herbivore community assembly. Functional Ecology. pp. 1-12.
Baum, S., Bolte, A. & Weih, M. (2012). Short Rotation Coppice (SRC) Plantations Provide
Additional Habitats for Vascular Plant Species in Agricultural Mosaic Landscapes. Bio-
Energy Research, vol. 5, pp. 573–583.
Berntsson, T., Sandén, B. Olsson, L. & Åsblad, A. (2014). Vad är ett bioraffinaderi? in Per-
spektiv på förädling av bioråvara. Göteborg: Chalmers. [Electronic], Available:
http://www.chalmers.se/sv/styrkeomraden/energi/Documents/Perspektiv_pa_Foradling_av
_bioravara_2014_v1.1.pdf [2015-02-23]
Beyer, H.L., Merrill, E.H.. Varley, N. & Boyce, M.S. (2007). Willow on Yellowstone’s
northern range: Evidence for a trophic cascade? Ecological Applications, vol. 17, pp. 1563-
1571.
Bray, Elizabeth.A. (1997). Plant responses to water deficit. Trends in plant science, vol 2, no
2, p. 48. [Electronic]. Available: http://ac.els-cdn.com/S1360138597825629/1-s2.0-
S1360138597825629-main.pdf?_tid=41d3988c-a085-11e4-9b68-
00000aab0f6b&acdnat=1421745672_ac0ad0a5f758107fa3ec9ea7e82da3eb [2015-01-20]
Brown, S. (1997). Estimating biomass and biomass change in tropical forests. Rome, Italy.
FAO Forestry Paper 134. [Electronic]. Available:
https://books.google.se/books?hl=sv&lr=&id=uv-
ISez-
vitwC&oi=fnd&pg=PA1&dq=+Estimating+biomass+and+biomass+change+of+tropicalfor
ests:+a+primer&ots=OBr3Sk5-DH&sig=_DboDhdr7LjKFFs-q-
mxI6aHk9s&redir_esc=y#v=onepage&q&f=false [2015-05-12]
Campbell, N.A., Reece, J.B., Urry, L.A., Cain, M.L., Wasserman, S.A., Minorsky, P.V. &
Jackson, R.B. (2008). Biology. 8th
ed. San Fransisco: Pearson Benjamin Cummins.
Carlsson, D., Jordansson, a., Haji Sheykhi, N., Skoog, A. & Stolt, F. (2011). Automatisk be-
vattningssystem med webbgränssnitt. Lund: Lunds tekniska högskola.
Chaves, M.M., Maroco, J.P. & Pereira, J.S. (2003). Understanding plant responses to drought
– from genes to the whole plant. Functional Plant Biology, vol. 30, pp. 239-264.
Christersson, L. (2013). Papperspopplar och energipilar. Tranås: Budgetboken.
Condon, A.G., Richards, R. A., Rebetzke, G. J. & Farquhar, G. D. (2002). Improving Intrinsic
Water-Use Efficiency and Crop Yield. Crop science, vol. 42, pp. 122-131.
Corbeels, M., Hofman, G. & Van Cleemput, O. (1998). Residual effect of nitrogen fertilisa-
tion in a wheat–sunflower cropping sequence on a Vertisol under semi-arid Mediterranean
conditions. European Journal of Agronomy, vol 9, pp. 109-116.
Cunningham, S.A., Summerhayes, B. & Westoby, M. (1999). Evolutionary Divergences In
Leaf Structure And Chemistry, Comparing Rainfall And Soil Nutrient Gradients. Ecology,
vol. 69, pp. 569-588.
daCunha, K.P.V. & do Nascimento, C.W.A. (2009). Silicon Effects on Metal Tolerance and
Structural Changes in Maize (Zea mays L.) Grown on a Cadmium and Zinc Enriched Soil.
Water Air Soil Pollut, vol. 197, pp. 323-330.
Dahlgren, L. (1992). Salix. Stockholm: Stiftelsen Lantbruksforskning [Broschyr]

34
Danfors, B. (1992). Salixodling Maskiner, arbetsmetoder och ekonomi. Uppsala: JTI (Swe-
dish Institute of Agriculture Engineering) (Teknik för lantbruket, 436). Available:
http://www.jti.se/uploads/jti/Meddelande-436.pdf [2015-03-03]
Davis, S.D, Sperry, J.S. & Hacke, U.G. (1999). The relationship between xylem conduit di-
ameter and cavitation caused by freezing. American Journal of Botany, vol. 86, pp. 1367–
1372.
Easlon, H.M., Nemali, K.S., Richards, J.H., Hanson, D.T., Juenger, T.E. & McKay, J.K.
(2014). The physiological basis for genetic variation in water use efficiency and carbon
isotope composition in Arabidopsis thaliana. PhotosynthesisResearch, vol.119, pp. 119-
129.
Erice, G., Louahlia, S. Irigoyen, J.J., Sanchez-Diaz, M. Avice, J.-C., (2009). Biomass parti-
tioning, morphology and water status off our alfalfa genotypes submitted to progressive
drought and subsequent recovery. Journal of Plant Physiology, vol. 167, pp. 114-120.
Ericsson, T. (1981). Effects od varied nitrogen stress on growth and nutrition in three Salix
genotypes. Physiologica Plantarium, vol 51. pp. 423-429. Available:
http://onlinelibrary.wiley.com/doi/10.1111/j.1399-3054.1981.tb05580.x/pdf [2015-01-28]
Eriksson, J., Dahlin, S., Nilsson, I. & Simonsson, M. (2011). Marklära. Lund: Studentlittera-
tur AB.
Ewersl, F.W., Ewers, J.M., Jacobsen, A.L. & López-Portillo, J. (2007). Vessel Redundancy:
Modeling Safety In Numbers. IAWA Journal, vol. 28, pp. 373-388.
Fox, J. (2005). The R Commander: A Basic Statistics Graphical User Interface to R. Journal
of Statistical Software, 14(9):1-42.
GE (2014). Precision of 3D CT-Systems Case studies to determination of the measurement
accuracy referring to VDI standard 2630 and comparison with tactile CMMs. Wunstorf,
Lewistown: GE Measurement & Control [Brochure]
Glynn, C., Rönnberg-Wästljung, A-C., Julkunen-Tiitto, R. & Weih, M. (2004). Willow geno-
type, but not drought treatment, affects foliar phenolic concentrations and leaf-beetle re-
sistance. Entomologia Experimentalis et Applicata, vol. 113, pp. 1-14.
Gough, L.P., Lamothe, P.J., Sanzolone, R.F., Drew, L.J., Maier, J.A.K., & Schuenemeyer,
J.H. (2013). Cadmium geochemistry of soils and willow in a metamorphic bedrock terrain
and its possible relation to moose health, seward peninsula, Alaska. Alces, vol.49, pp. 99-
111.
Gustafsson, J., Larsson, S. & Nordh N-E. (2007). Manual för Salixodlare. Örebro: Lantmän-
nen Agroenergi AB/Salix [Brochure]
Heller, M.C., Keoleian, G. & Volk, T.A. (2003). Life cycle assessment of a willow bioenergy
cropping system. Biomass and Bioenergy, vol 25:2, pp.147-165.
Hilarie, R.S. & Graves, W.R. (1998). Water relations, growth, and foliar traits of drought-
stressed hard maples from central Iowa, eastern Iowa, and the eastern United States. in
Ecophysiology and genetic diversity of hard maples indigenous to eastern North America.
Diss. Ames: Iowa State University.
Hoeber, S., Leuschner, C., Köhler, L., Arias-Aguilar, D. & Schuldt, B. (2014). The im-
portance of hydraulic conductivity and wood density to growth performance in eight tree
species from a tropical semi-dry climate. Forest Ecology and Management, vol. 330, pp.
126-136.

35
Hoffmann, D. & Weih, M. (2005). Limitations and inprovements of the potential utilization of
woody biomass for energy derived from short rotation woody crops in Sweden and Ger-
many. Biomass and Bioenergy, vol. 28, pp. 267-279. [Electronic]. Available:
http://www.sciencedirect.com/science/article/pii/S0961953404001679 [2015-01-20]
IPCC. (2014) Climate Change 2014: Synthesis Report. Contribution of Working Groups I, II
and III to the Fifth Assessment Report of the Intergovernmental Panel on Climate Change
[Core Writing Team, R.K. Pachauri and L.A. Meyer (eds.)]. IPCC, Geneva, Switzerland,
151 pp.
Jug, A., Hoffmann-Schielle, C., Makeschin, F. & Rehfuess, K.E. (1999). Short-rotation plan-
tations of balsam poplars, aspen and willows on former arable land in the Federal Republic
of Germany. II. Nutritional status and bioelement export by harvested shoot axes. Forest
Ecology and Management, vol. 121, pp. 67-83.
Karlsson, J., Krigsman, T., Molander, B.-O. & Wickman, P.-O. (1994). Biologi 1 med natur-
kunskap för gymnasieskolan. Stockholm: Liber AB.
Kulkarni, M., Schneider, B., Raveh, E. & Tel-Zur a, N. (2010).Leaf anatomical characteristics
and physiological responses to short-term drought in Ziziphus mauritiana (Lamk.). Scien-
tia Horticulturae, vol. 124, pp.316-322.
Lambers, H., Chapin III, F.S. & Pons, T.L. (2006). Plant Physiological Ecology. New York,
NY, USA: Springer.
Larsen, E.W. (1998). Mangelsyndrome i landbrugsafgrøder. Copenhagen, Denmark: Hydro
Agri
Lauer, M.J. & and Boyer, J.S. (1992). Internal CO2 Measured Directly in Leaves, Abscisic
Acid and Low Leaf Water Potential Cause Opposing Effects. Plant Physiology, vol. 98, pp.
1310-1316.
Leavitt, S.W. (1992). Seasonal 13
C/12
C changes in tree rings: species and site coherence, and
possible drought influences. Canadian Journal of Forest Research, vol. 23(2), pp. 210-
218.
Lindblad, T. (2011). Allt större efterfrågan på ändliga tillgångar: Råvarorna som kan ta slut.
Allt om Vetenskap. January 4th
. [Electronic], Available:
http://www.alltomvetenskap.se/nyheter/ravarorna-som-kan-ta-slut [2015-02-04]
Lindroth, A. & Båth, A. (1999). Assessment of regional willow coppice yield in Sweden on
the basis of water availability. Forest Ecology and Management, vol. 121, pp. 57–65.
[Electronic]. Available:
http://www.sciencedirect.com/science/article/pii/S0378112798005568# [2015-01-20]
Liu, L.. McDonald, A.J.S., Standenberg, I. & Davies, W.J. (1999). Abscisic acid in leaves and
roots of willow: significance for stomatal conductance. Tree Physiology, vol 21. pp. 759-
764.
Liu, F. & Stützel, H. (2011). Biomass partitioning, specific leaf area, and water use efficiency
of vegetable 1maranth (Amaranthus spp.) in response to drought stress. Scientia Horticul-
turae, vol. 102, pp.15–27.
Loader, N.J., Robertson, I. & McCarroll, D. (2003). Comparison of stable 3arbon isotope rati-
os in the whole wood, cellulose and lignin of oak tree-rings. Palaeogeography, Palaeocli-
matology, Palaeoecology, vol. 196, pp. 395-407.

36
Mirck, J., Isebrands, J.G., Verwijst, T. & Stig Ledin, S. (2005). Development of short-rotation
willow coppice systems for environmental purposes in Sweden. Biomass and Bioenergy,
vol. 28, pp.219-228.
Moltz, F.J. & Keppler, B. (1973). On the Mechanism of Water-Stress-induced Stem Defor-
mation. Agronomy Journal, American society of agronomy, vol. 65:2, pp. 304-306.
Nakai, A.,Yurugi, Y. & Kisanuki, H. (2010) Stress responses in Salix gracilistyla cuttings
subjected to repetitive alternate flooding and drought. Trees, vol. 24, pp. 1087-1095.
Nakhforoosh, A., Schuhwerk, D., Bodner, G. Kutschka, S. & Grausgruber, H. (2012). Root
characteristics of durum wheat and wheat relatives. In: Tagungsband der 62. Jahrestagung
der Vereinigung der Pflanzenzüchter und Saatgutkaufleute Österreichs, 22-23 November
2011, Raumberg-Gumpenstein, von Markergestützter Selektion zu Genomischer Selektion
in der Pflanzenzüchtung, wheat stress und robust wheat.
Offenthaler , I., Hietz , P. & Richter , H. (2001). Wood diameter indicates diurnal and long-
term patterns of xylem water potential in Norway spruce. Trees, vol. 15, pp. 215-221.
Pezeshki, S.R., Anderson, P.H. & Shields, D.F. (1998). Effects of Soil Moisture Regimes on
Growth and Survival of Black Willow (Salix nigra) posts (cuttings), vol. 18, pp. 460-470.
Philipson, C.D., Saner, P., Marthews, T.R., Nilus, R., Reynolds, G., Turnbull, L.A. & Hector,
A. (2012). Light-based Regeneration Niches: Evidence from 21 Dipterocarp Species using
Size-specific RGRs. Biotropica, vol. 44, pp. 627-636.
Pitre, F.E., Brereton, N.J.B., Audoire, S., Richter, G.M., Shield, I. & Karp, A. (2010). Esti-
mating root biomass in Salix viminalis * Salix schwerinii cultivar “Olof” using the electri-
cal capacitance method. Plant Biosystems, vol. 144, pp.479-483. Available:
http://www.tandfonline.com/doi/abs/10.1080/11263501003732092#.VM-bEbdOU3E
[2015-02-02]
Plavcová, L. & Hacke, U.G. (2012). Phenotypic and developmental plasticity of xylem in
hybrid poplar saplings subjected to experimental drought, nitrogen fertilization, and shad-
ing. Journal of Experimental Botany, vol. 63, pp. 6481-6491.
Poorter, L., McDonald, I., Alarco´n, A., Fichtler, E., Licona, J.-C., Peña-Claros, M,. Sterck,
F., Villegas, Z. & Sass-Klaassen, U. (2009). The importance of wood traits and hydraulic
conductance for the performance and life history strategies of 42 rainforest tree species.
New Phytologist, vol. 185, pp. 481-492.
Rahbek Pedersen, T., Bommarco, R., Ebbersten, K., Falk, A., Fries, I., Kristiansen, P.,
Kryger, P., Nätterlund, H. & Rundlöf, M. (2009). Massdöd av bin – samhällsekonomiska
konsekvenser och möjlige åtgärder. Jönköping: Jordbruksverket (2009:24).
Rasband, W.S., ImageJ, U. S. National Institutes of Health, Bethesda, Maryland, USA,
http://imagej.nih.gov/ij/, 1997-2014.
Roggatz, U., Mcdonald, A. J. S., Stadenberg, S. & Schurr, U. (1999). Effects of nitrogen dep-
rivation on cell division and expansion in leaves of Ricinus communis L. Plant, Cell and
Environment, vol. 22, pp. 81-89.
Ryan, M.G., Hubbard, R.M., Pomgracic, S., Raison, R.J. & McMurtrie, R.E. (1995). Foliage,
fine-rro, woody-tissue and strand respiration in Pinus radiata in relation to nitrogen status.
Tree Pysiology, vol. 16, pp. 333-343.

37
Rytter, R.M. & Hansson, A.C. (1996). Seasonal amount, growth and depth distribution of fine
roots in an irrigated and fertilized Sali viminalis L. Plantation. Biomass and Bioenergy,
vol. 11, pp. 129-137.
Slípková, R. & Pokorný, R. (2012). Long-Term Water Use Efficiency of Young Spruce For-
est. Acta Horticulture, vol. 951, pp. 293-299.
Savage, J. A., Cavender-Bares, J. & Verhoeven, A. (2009) Willow species (genus: Salix) with
contrasting habitat affinities differ in their photoprotective responses to water stress. Func-
tional Plant Biology, vol. 36, pp. 300-309.
Schindelin, J.; Arganda-Carreras, I. & Frise, E. et al. (2012), "Fiji: an open-source platform
for biological-image analysis", Nature methods 9(7): 676-682, PMID 22743772.
(PDF, Supplement)
Seguara, M., Kanninen, M. & Suárez, D. (2006). Allometric models for estimating above-
ground biomass of shade trees and coffee bushes grown together. Agroforestry Systems,
vol.68, pp. 143-150.
Sevanto, S., Hölttä, T., Markkanen, T., Perämäki, M., Nikinmaa, E. & Vesala, T. (2005). Re-
lationships between diurnal xylem diameter variation and environmental factors in Scots
pine. Boreal Environment Research, vol. 10, pp. 447-458.
Sperry, J.S., Meinzer, F.C. & Mcculloh, C.A. (2008). Safety and efficiency conflicts in hy-
draulic architecture: scaling from tissues to trees. Plant, Cell and Environment, vol. 31, pp.
632-645.
Swedish Forest Agency (2014). Skogsvårds Lagstiftningen, Gällande regler 1 september
2014. Jönköping: Swedish Forest Agency [Brochure] Available:
http://www.skogsstyrelsen.se/Global/PUBLIKATIONER/svl/SVL%20sept.pdf [2015-03-
03]
Silvola, J. & Ahlholm, U. (1992). Photosynthesis in willows (Salix * dasyclados) grown at
different CO2 concentrations and fertilization levels. Oecologia, vol. 91, pp. 208-213.
[Electronic]. Available: http://link.springer.com/article/10.1007/BF00317785#page-1
[2015-01-23]
SLU (1994). Salix Kloninformation. Uppsala: Statens Lantbruksuniversitet [Brochure]
SMHI, Swedish Meteorological and Hydrological Institute (2015-01-23). Klimatförändringar
märks redan idag. http://www.smhi.se/kunskapsbanken/klimat/klimatforandringarna-
marks-redan-idag-1.1510 [2015-02-23]
SRCPlus (2014). About SRCplus. http://www.srcplus.eu/en/about-srcplus.html [2015-01-22]
Swedish Board of Agriculture (2003). Makronäringsämnen, mikronäringsämnen och pH i
ekologisk grönsaksodling. Statens Jordbruksverk (Ekologisk produktion av grönsaker)
[Broshure]
Swedish Board of Agriculture (2009). Jordbruk, bioenergi och miljö. Enköping: Statens Jord-
bruksverk (2009:22) Available: http://webbutiken.jordbruksverket.se/sv/artiklar/jordbruk-
bioenergi-och-miljo.html [2015-02-02]
Swedish Board of Agriculture (2013). Handbok för SALIXODLARE. Jönköping: Statens Jord-
bruksverk [Brochure] Available:
http://www2.jordbruksverket.se/webdav/files/SJV/trycksaker/Pdf_ovrigt/ovr250v2.pdf
[2015-01-28]

38
Swedish Board of Agriculture (2014-04-14). Odling av salix.
http://www.jordbruksverket.se/amnesomraden/odling/jordbruksgrodor/salix/odlingavsalix.
4.2ae27f0513e7888ce2280009132.html [2015-01-20]
Swedish Energy Agency (2008). Bioenergi: resurseffektivitet och bidrag till energi- och kli-
matpolitiska mål. Eskilstuna: Energimyndigheten (ER 2008:05).
Tahvanainen, L. & Rytko, V-M. (1999). Biomass production of Salix viminalis in southern
Finland and the effect of soil properties and climate conditions on its production and sur-
vival. Biomass and Bioenergy, vol. 16, pp. 103-117. Available:
http://www.sciencedirect.com/science/article/pii/S0961953498000749 [2015-02-02]
Taiz, L. and Zeiger, E. (2006). Plant Physiology. 4. ed. Sunderland, MA: Sinauer Associates.
Taylor, G., Mcdonald, A.J.S., Stadenberg, I. & Freer-Smith, P.H. (1993). Nitrate supply and
the biophysics of leaf growth in Salix viminalis. Journal of experimental botany, vol. 44,
pp, 155-164.
Tsarouhas, V., Gullberg, U. & Lagercrantz, U. (2002). An AFLP and RFLP linkage map and
quantitative trait locus (QTL) analysis of growth traits in Salix. Theor Appl Genet, vol.
105, pp. 277-288.
Tyree, M.T. & Zimmermann, M.H. (2002). Xylem structure and the ascent of sap. 2. ed. Ber-
lin: Springer.
Uppenberg, U., Almemark, M., Brandel, M., Lindfors, L-G., Marcus, H-O., Stripple, H.,
Wachtmeister, A. & Zetterberg, L. (2001) Miljöfaktabok drivmedel och bränslen. Stock-
holm: IVL Swedish Environmental Research Institute Ltd. (B 1334B-2)
Van Splunder,I., Voesenek, L.A.C.J., Coops, H., De Vries, L.A.C.J. & Blom, C.W.P.M.
(1996). Morphological responses of seedlings of four species of Salicaceae to drought. Ca-
nadian Journal of Botany, vol, 74 (12), pp. 1988-1995.
Vile, D., Ric Garnier, E., Shipley, B., Laurent, GE.R., Navas, M-L., Roumet, C., Lavorel, S.,
Di´Az, S. Hodgson, J.G., Lloret, F., Midgley, G.F., Poorter, H., Rutherford, M.C., Wilson,
P.J & Wright, I.J. (2005). Specific Leaf Area and Dry Matter Content Estimate Thickness
in Laminar Leaves. Annals of Botany, vol. 96, pp. 1129–1136.
Von Fircks, Y., Ericsson, T. & Sennerby-Forsse, L.(2001). Seasonal variation of macronutri-
ents in leaves, stems and roots of Salix dasyclados Wimm. grown at two nutrient levels.
Biomass and Bioenergy, vol. 21, pp. 321-334.
Walker, X.J., Mack, M.C. & Johnstone, J.F. (2015). Stable 3arbon isotope analysis reveals
widespread drought stress in boreal black spruce forests. University of Saskatchewan &
Northern Arizona University. Department of Biology & Department of Biological Scienc-
es. (Primary Research Articles)
Weih, M., Bonosi, L., Ghelardini, L. & Rönnberg-Wästljung, A-C. (2011). Optimizing nitro-
gen economy under drought: increased leaf nitrogen is an acclimation to water stress in
willow (Salix spp.). Oxford Journals, Annals of Botany Company, pp 1-7. [Electronic].
Available: http://aob.oxfordjournals.org/content/early/2011/09/06/aob.mcr227.short [2015-
01-23]
Weih, M., Bonosi, L. & Ghelardini, L. (2010). Growth responses of 15 Salix genotypes to
temporary water stress are different from the responses to permanent water shortage. Trees,
vol. 24, pp. 843-854.
Wikberg, J. & Ögren, E. (2004). Interrelationships between water use and growth traits in
biomass-producing willows. Tree, vol 18, pp. 70-76.

39
Wikberg, J. & Ögren, E. (2007). Variation in drought resistance, drought acclimation and wa-
ter conservation in four willow cultivars used for biomass production. Tree Physiology,
vol. 27, pp. 1339-1346.
Wilkonson, S. & Davies, W.J. (2002). ABA-based chemical signaling: the co-ordination of
responses to drought stress. Plant, Cell and Environment, vol. 25, pp. 195-210.
Wilson, C.J. & Jackson, R.B. (2006). Xylem cavitation causing by drought and freezing stess
in Juniperus species. Physiologica Plantarum, vol. 127. pp, 374-382.
Worbes, M. (1999). Annual growth rings, rainfall dependent growth and long term growth
patterns of tropical trees from the Caparo Forest Reserve in Venezuela. Journal of Ecology,
vol. 87, pp. 391-403.
Wright, I.J., Reich, P.B. & Westoby, M. (2002).Least-Cost inpot Mixtures of Water and Ni-
trogen for Photosynthesis. The American Naturalist, vol. 161, pp. 98-111.
Zangerl, A.R., Hamilton, J.G., Miller, T.J., Crofts, A.R., Oxborough, K., Berenbaum, M.R. &
de Lucia, E.H. (2002). Impact of folivory on photosynthesis is greater than the sum of its
holes. Proceedings of the National Academy of Sciences of the United States of America,
vol. 99, pp. 1088-1091.
Zhong, L., Chen, D., Min, D., Li, W., Xu, Z., Zhou, Y. Li, L., Chen, M. & Ma, Y. (2015).
AtTGA4, a bZIP transcription factor, confers drought resistance by enhancing nitrate
transport and assimilation in Arabidopsis thaliana. Biochemical and biophysical Research
Communications, vol. 457, pp. 433-439.
Zimmermann, M.H. (1983). Xylem Structure and the Ascent of Sap. Berlin, Heidelberg, New
York, Tokyo: Springer.