effects of biological compound turkish propolis extract … · effects of biological compound...
TRANSCRIPT

EFFECTS OF BIOLOGICAL COMPOUND TURKISH PROPOLIS
EXTRACT ON BREAST CANCER CELLS
A THESIS
SUBMITTED TO THE DEPARTMENT OF MOLECULAR BIOLOGY AND GENETICS
AND THE GRADUATE SCHOOL OF ENGINEERING AND SCIENCE
OF BILKENT UNIVERSITY
IN PARTIAL FULFILLMENT OF THE REQUIREMENTS
FOR THE DEGREE OF
MASTER OF SCIENCE
BY
DENİZ UĞURLU
AUGUST, 2013

ii
I certify that I have read this thesis and that in my opinion it is fully adequate,
in scope and in quality, as a thesis for the degree of Master of Science.
__________________________________
Assoc. Prof. Dr. Işık YULUĞ (Advisor)
I certify that I have read this thesis and that in my opinion it is fully adequate,
in scope and in quality, as a thesis for the degree of Master of Science.
__________________________________
Assoc. Prof. Dr. Dönüş TUNCEL
I certify that I have read this thesis and that in my opinion it is fully adequate,
in scope and in quality, as a thesis for the degree of Master of Science.
__________________________________
Assist. Prof. Dr. Özlen KONU
Approved for the Graduate School of Engineering and Science:
__________________________
Prof. Dr. Levent Onural
Director of the Graduate School

iii
ABSTRACT
EFFECTS OF BIOLOGICAL COMPOUND TURKISH PROPOLIS
EXTRACT ON BREAST CANCER CELLS
Deniz UĞURLU
M.S. in Molecular Biology and Genetics
Supervisor: Assoc. Prof. Dr. Işık YULUĞ
August, 2013
Propolis is a resinous compound which is collected from various plants then
combined with wax and bee enzymes by worker bees. There are many studies
conducted on propolis or its active components aiming to find new treatment
possibilities in diverse research fields such as immunology, infectious diseases,
allergy, diabetes, ulcers, and oncology. Chemical analysis indicated that propolis is a
multicomponent mixture of various compounds with prevalence of flavonoids and
phenolic acids. Therefore it is important to investigate the propolis extract
mechanisms of action in order to predict possible cytotoxic and may be therapeutic
effects for cancer. The most common propolis extract is ethanol extract of propolis
(EEP) whereas Turkish researchers were able to extract the propolis with dimethyl
sulfoxide (DMSO) which can maximize the penetration of compounds from propolis
to the cells as well as DMSO is a good solvent for flavonols (one of the most
common compound in propolis). There are many studies conducted on propolis or
its active components for treatment of cancer which reveals the potential of this
biological compound in the development of novel anti-cancerous agents. However,
anti-cancer activity of DMSO extract of Turkish propolis (DEP) on human breast
cancer has not been investigated yet. The aim of this study was to investigate the
anti-cancer effects of DMSO extract of Turkish propolis (DEP) on cancer cells.
Inhibitory effects of propolis extracts collected from different regions of Turkey
were analyzed on the growth of the human breast carcinoma cells. Two different

iv
propolis extracts were used to determine their cytotoxic effects of breast carcinoma
cell lines using SRB staining and IC50 values were determined. The results showed
that propolis is cytotoxic in dose-dependent manner (IC50 value of diverse from 25
ug/ml to 123 ug/ml). Real time monitoring (xCELLigence system) of propolis treated
cells confirmed the cytotoxic effect of propolis, since increasing concentrations of
propolis decreased the cell number in a dose- and cell line- dependent way.
Furthermore, propolis treatment induces apoptosis in breast carcinoma cell lines.
Propolis treated cells changed their adherent morphology to round cells and
detached from the surface. Hoechst 33258 staining of propolis treated cells
revealed the increasing number of cells displays DNA condensation. PARP-1, a 116
kDa nuclear enzyme, is cleaved in fragments of 89 and 24 kDa during apoptosis.
Western blot analysis was performed to detect the PARP-1 cleavage in propolis
treated cells. Decrease in the full-length PARP-1 protein levels supports our
hypothesis that propolis shows its cytotoxic effect at least partially through
induction of apoptosis. The effect of propolis on cell cycle was analyzed with flow
cytometer after staining the cells with Propidium iodide (PI). Increase in the G2/M
cell cycle arrest was observed in propolis treated cells compare to control DMSO
treated MDA-MB-231 cells. In addition to cytotoxic effects, in vitro wound healing
assay revealed that propolis treated MDA-MB-231 cells shows delayed invasion of
the cells to the denuded area when compared to the DMSO control cells. In
conclusion, propolis showed a cytotoxic effect on breast carcinoma cell lines by
inducing apoptosis, G2/M arrest as well as delaying the invasion capacity of the cells
which makes it a potent anti-tumorigenic compound that may be useful in cancer
chemoprevention or therapy.
Key words: Propolis, Breast Cancer, Cytotoxic, Apoptosis, xCELLigence, Scratch
Assay.

v
ÖZET
BİYOLOJİK BİLEŞKE TÜRK PROPOLİSİNİN MEME KANSERİ
HÜCRELERİNE ETKİLERİ
Deniz UĞURLU
Moleküler Biyoloji ve Genetik, Yüksek Lisans
Tez Yöneticisi: Doç. Dr. Işık YULUĞ
Ağustos, 2013
Propolis, işçi arılar tarafından çeşitli bitkilerden toplanıp balmumu ve arı
enzimleriyle kombine edilen, reçine tipinde bir üründür. Propolis veya aktif
bileşenleriyle ilgili olarak immünoloji, enfeksiyon hastalıkları, alerji, diyabet, ülser ve
onkoloji gibi çeşitli araştırma alanlarında yeni tedavi olasılıkları bulmayı hedefleyen
çok sayıda çalışma vardır. Kimyasal analizler propolisin flavonoidler ve fenolik
asitlerle birlikte çeşitli bileşenlerin karışımı olduğunu göstermiştir. Bu nedenle olası
toksik ve terapötik etkileri öngörmek açısından propolis ekstrelerinin etki
mekanizmalarını incelemek önemlidir. En sık kullanılan propolis ekstresi propolisin
etanol ekstresidir (EEP). Türk araştırmacılar propolis bileşenlerinin hücrelere
penetrasyonunu maksimuma çıkartabilecek şekilde propolisin dimetil sülfoksit
(DMSO) ile ekstresini elde edebilmişlerdir. DMSO, flavonoller (propolis içinde en sık
bulunan bileşenlerden) için iyi bir solventtir. Propolis veya aktif bileşenlerinin kanser
tedavisinde kullanımıyla ilgili olarak yapılmış ve bu biyolojik bileşenin yeni anti-
kanser ajanların geliştirilmesindeki potansiyelini gösteren çok sayıda çalışma vardır.
Ancak Türk propolisinin DMSO ekstresinin (DEP) insan meme kanseri üzerindeki
anti-kanser aktivitesi henüz incelenmemiştir. Bu çalışmanın amacı kanser hücreleri
üzerinde Türk propolisinin DMSO ekstresinin (DEP) anti-kanser etkilerini
araştırmaktır. Çalışmada Türkiye'nin çeşitli bölgelerinden toplanan propolisin insan
meme karsinomu hücrelerinin büyümesi üzerindeki inhibe edici etkileri incelendi.
SRB boyaması kullanılarak iki farklı propolis ekstresinin meme karsinomu hücre

vi
hatları üzerindeki sitotoksik etkileri incelendi ve IC50 değerleri belirlendi. Sonuçlar
propolisin doza bağımlı bir şekilde sitotoksik olduğunu gösterdi (IC50 değeri 25 ug/ml
ile 123 ug/ml arasında değişmektedir). Propolis ile muamele edilen hücrelerin
gerçek zamanlı incelenmesi (xCELLigence sistemi) propolis sitotoksik etkilerini
doğruladı çünkü artan propolis konsantrasyonları hücre sayısını doza ve hücre
hattına bağımlı bir şekilde azalttı. Ayrıca propolis tedavisi meme kanseri hücre
hatlarında apoptozu indükledi. Muamele edilen hücrelerin adheran morfolojisi
yuvarlak hücreler haline dönüştü ve Hoechst 33258 boyama yöntemi ile artan
sayıda hücrede DNA kondansasyonu gösterdi. Apoptoz sırasında, 116 kDa bir
nükleer enzim olan PARP-1, 89 ve 24 kDa büyüklüğündeki fragmanlara
ayrılmaktadır. Propolis ile muamele edilen hücrelerde PARP-1 ayrılmasını saptamak
üzere Western blot analizi yapıldı. Tam uzunlukta PARP-1 protein seviyelerinde
azalma, propolisin sitotoksik etkisini en azından kısmen apoptoz indüksiyonu yoluyla
gösterdiği hipotezimizi desteklemektedir. Propolisin hücre döngüsü üzerine etkisi,
hücrelerin Propidium iyodür (PI) ile boyandıktan sonra bir akış sitometresi
tarafından analiz edilmesiyle incelendi. Kontrol DMSO ile muamele edilmiş MDA-
MB-231 hücreleriyle karşılaştırıldığında propolis ile muamele edilen hücrelerde
G2/M hücre döngüsü arestinde güçlü bir artış görüldü. Sitotoksik etkilere ilaveten,
in vitro yara iyileşmesi testi, propolis ile muamele edilen MDA-MB-231 hücrelerinin
DMSO kontrol hücreleriyle karşılaştırıldığında soyulmuş bölgeye hücre
invasyonunda gecikme olduğu saptandı. Sonuç olarak, meme kanseri hücre
hatlarında apoptoz ve G2/M arestini indükleyerek ve ayrıca hücrelerin invazyon
kapasitesini geciktirerek gösterdiği sitotoksik etki sayesinde propolis kanser
kemoterapisi veya önlenmesinde faydalı olabilecek güçlü bir anti-tümorijenik
bileşendir.
Anahtar Sözcükler: Propolis, Meme Kanseri, Sitotoksik, Apoptoz, xCELLigence, Yara
İyileşmesi testi

vii
Acknowledgement
I would like to express my sincere gratitude to my supervisor, Assoc. Prof. Dr. Işık
Yuluğ, who welcomed me to her lab and supported me patiently. She was an
understanding advisor as well as sophisticated mentor in helping me gaining skills in
scientific research. It has always been a privilege to work in her lab.
I would like to thank Prof. Dr. Orhan Değer for providing the propolis extracts for
this study.
I am grateful to Assoc. Prof. Dr. Rengül Çetin-Atalay for her valuable contributions
to this study.
I am highly indebted to PhD-to-be Gurbet Karahan and Nilüfer Sayar who are the
greatest group mates with their helpful guidance and kind friendship.
I would also like to thank to The Scientific and Technological Research Council of
Turkey (TÜBİTAK) for their financial support throughout my master study.
Moreover, I would like to thanks to PhD. Çiğdem Özen and Deniz Cansen Yıldırım for
providing necessary information regarding this study.
I should also thank to lab members of Bilkent MBG, especially Sinem, Kerem, Azer,
Gökhan, Mehmet, İhsan, Derya, Damla, Emre, Yusuf and Sıla for being a friendly
colleagues.
I would like to thank my loved ones, Bilkenters Harun, Aslınur, Taner, Merve, Ece,
Alper and my old friends Ferhan, Ezgi, Asya, Mehtap, Ece who have supported me
throughout entire process, both by keeping me harmonious and helping me putting
pieces together. I will be grateful forever for your love.
I would like to express my gratitude towards my parents for their encouragement in
every step of my life.

viii
Table of Content
ABSTRACT .................................................................................................................... iii
EFFECTS OF BIOLOGICAL COMPOUND TURKISH PROPOLIS EXTRACT ON BREAST
CANCER CELLS ......................................................................................................... iii
ÖZET ............................................................................................................................. v
BİYOLOJİK BİLEŞKE TÜRK PROPOLİSİNİN MEME KANSERİ HÜCRELERİNE ETKİLERİ . v
Acknowledgement ......................................................................................................vii
Table of Content ......................................................................................................... viii
List of Figures .............................................................................................................. xi
List of Tables ................................................................................................................ xv
Abbreviations ............................................................................................................. xix
1 INTRODUCTION .................................................................................................... 1
1.1 Breast Cancer ................................................................................................. 1
1.1.1 Classification of Breast Cancer ............................................................... 2
1.1.2 Breast Carcinoma Cell Lines ................................................................... 3
1.2 Biological Compound Propolis ....................................................................... 4
1.2.1 Propolis Extracts ..................................................................................... 6
1.2.2 Antitumoral Activity of Propolis and Its Active Components ................ 8
1.2.3 Synergistic Effects of Propolis with Other Chemotherapeutic Drugs .. 10
1.3 Cell Death .................................................................................................... 12

ix
1.3.1 Apoptosis .............................................................................................. 13
1.3.2 Poly(ADP-ribose) Polymerase-1 (PARP-1) Cleavage ............................ 14
2 Materials ............................................................................................................ 16
2.1 Propolis Extract ............................................................................................ 16
2.2 Growth Mediums ......................................................................................... 16
2.3 Buffers and Solutions .................................................................................. 18
2.4 General Materials ........................................................................................ 20
3 Methods ............................................................................................................. 22
3.1 Cell Culture Techniques ............................................................................... 22
3.1.1 Growth Conditions ............................................................................... 22
3.1.2 Cryopreservation of Cells ..................................................................... 23
3.1.3 Reculturing Frozen Cells ....................................................................... 23
3.1.4 Storing Cell Pellets for Protein Isolation .............................................. 24
3.1.5 Cell Counting with Haemocytometer ................................................... 24
3.2 Sulforhodamine B (SRB) Assay .................................................................... 25
3.2.1 Trichloroacetic acid (TCA) Fixation ....................................................... 26
3.2.2 Sulforhodamine B (SRB) Staining ......................................................... 26
3.3 IC50 Calculations ........................................................................................... 27
3.4 Statistical Analyses ...................................................................................... 27
3.5 Live Cell Proliferation Assay (xCELLigence) ................................................. 28
3.6 Nuclear Staining with Hoechst 33258 ......................................................... 30
3.7 Western Blot ................................................................................................ 30
3.7.1 Cell Lysis ............................................................................................... 30
3.7.2 Bradford Assay for Protein Quantitation and Sample Preparation ..... 31

x
3.7.3 Preparation of SDS gel and Its Transfer to Nitrocellulose Membrane 34
3.7.4 Blocking & Antibody Incubations ......................................................... 35
3.7.5 ImageJ Analysis .................................................................................... 36
3.8 FACS ............................................................................................................. 37
3.8.1 Cell Fixation .......................................................................................... 37
3.8.2 Cell Staining with Propidium iodide (PI) .............................................. 37
3.9 Scratch Assay ............................................................................................... 38
4 RESULTS .............................................................................................................. 40
4.1 Analysis of Propolis' Effects in Cancer Cells ................................................ 40
4.2 IC50 Values for Propolis extracts for Breast Carcinoma Cell Lines ............... 49
4.3 Association of IC50 Values of Propolis extracts with Properties of Breast
Carcinoma Cell Lines .............................................................................................. 73
4.4 Dynamic Cell Proliferation of Propolis Treated Cells with xCELLigence ...... 79
4.5 Propolis Induces Apoptosis on Breast Carcinoma Cell Lines ....................... 83
4.5.1 Morphology of the Cells Changes with Propolis Treatment ................ 83
4.5.2 Chromatin Condensation and Nuclear Fragmentation ........................ 86
4.5.3 Western Blot Analysis of PARP-1 cleavage .......................................... 89
4.6 Propolis Slightly Increases G2/M arrest of MDA-MB-231 Cells .................. 95
4.7 Propolis Blocks Invasion of MDA-MB-231 Cells ........................................ 100
5 Discussion ......................................................................................................... 103
6 Future Perspectives .......................................................................................... 108
7 References ........................................................................................................ 110
8 Appendix .......................................................................................................... 116
8.1 IC50 Analysis of Propolis ............................................................................. 116
8.2 Documents of Permission to Reuse of Figures .......................................... 146

xi
List of Figures
Figure 1-1 Anatomy of breast (Harness, 2011). ........................................................... 1
Figure 1-2 The Chemical Structure of Caffeic acid phenethyl ester (CAPE) C17H16O4
(Akyol, 2012). ............................................................................................................... 9
Figure 1-3 Picture of Taxus brevifolia (Pacific Yew) which Paclitaxel was isolated
from (McMullen, 2008). ............................................................................................. 11
Figure 1-4 Fas-induced and TNF-induced Apoptosis Models (Nagata, 1997). .......... 13
Figure 1-5 Various Fragments of PARP-1 after cleaved by specific suicidal proteases
(Chaitanya, 2010). ...................................................................................................... 15
Figure 3-1 Schematic Drawing of the Working Principle of xCELLigence (ACEA
Bioscience Inc.) ........................................................................................................... 29
Figure 3-2 BSA Standard Curve .................................................................................. 32
Figure 3-3: The protein loading marker and the gel configuration where the dashed
lines show the cutting sites of the gels. ..................................................................... 35
Figure 4-1: The cell proliferation rate of FOCUS cells after propolis treatment. T ... 42
Figure 4-2: The cell proliferation rate of FOCUS (A) and Huh7 (B) cells after
treatment with Propolis-1 and DMSO at 24 h, 48 h, and 72 h time points. .............. 44
Figure 4-3: Cell proliferation of FOCUS, Huh7, SK-LC, MDA-MB-231 and MCF12A cell
lines with increasing concentrations of Propolis-1 and DMSO. ................................. 48
Figure 4-4: The relative fold change of each propolis treated cell line at different
concentrations of Propolis-1. ..................................................................................... 49
Figure 4-5: Calculation of IC50 values for propolis extracts in MCF10A cells. ............ 51
Figure 4-6: Calculation of IC50 values for propolis extracts in MCF12A cells. ............ 53
Figure 4-7 Calculation of IC50 values for propolis extracts in MDA-MB-231 cells. .... 54
Figure 4-8: Calculation of IC50 values for propolis extracts in CAMA-1 cells. ........... 56
xii
Figure 4-9: Calculation of IC50 values for propolis extracts in MDA-MB-453 cells ... 57
Figure 4-10: Calculation of IC50 values for propolis extracts in MDA-MB-468 cells. 59
Figure 4-11: Calculation of IC50 values for propolis extracts in T47D cells. .............. 60
Figure 4-12: Calculation of IC50 values for propolis extracts in MCF7 cells. ............. 62
Figure 4-13: Calculation of IC50 values for propolis extracts in HCC-1937 cells. ...... 63
Figure 4-14: Calculation of IC50 values for propolis extracts in MDA-MB-157cells. . 65
Figure 4-15: Calculation of IC50 values for propolis extracts in BT-20 cells. ............. 66
Figure 4-16: Calculation of IC50 values for propolis extracts in MDA-MB-361 cells. 68
Figure 4-17: Calculation of IC50 values for propolis extracts in BT-474 cells. ........... 69
Figure 4-18: Calculation of IC50 values for propolis extracts in ZR-75-1 cells. .......... 71
Figure 4-19: Calculation of IC50 values for propolis extracts in hTERT-HME-1 cells. 72
Figure 4-20 Comparison of IC50 Values of Two Different Propolis Extracts on Breast
carcinoma cell lines .................................................................................................... 74
Figure 4-21 Fold change of IC50 values of two different propolis extracts on breast
carcinoma cell lines .................................................................................................... 74
Figure 4-22 IC50 values of propolis extracts were used to analyze according to the
molecular subtypes of breast carcinoma cell lines. ................................................... 75
Figure 4-23 IC50 values of propolis extracts were used to analyzed according to the
ER status of breast carcinoma cell lines. .................................................................... 76
Figure 4-24 IC50 values of propolis extracts were used to analyzed according to the
PR status of breast carcinoma cell lines. .................................................................... 77
Figure 4-25 IC50 values of propolis extracts were used to analyzed according to the
HER2 status of breast carcinoma cell lines. ............................................................... 78
Figure 4-26 Dynamic monitoring of cell proliferation using the xCELLigence system
in MCF10A. ................................................................................................................. 80
Figure 4-27 Dynamic monitoring of cell proliferation using the xCELLigence system
in BT-474. ................................................................................................................... 80
Figure 4-28 Dynamic monitoring of cell proliferation using the xCELLigence system
in T47D. ...................................................................................................................... 81

xiii
Figure 4-29 Dynamic monitoring of cell proliferation using the xCELLigence system
in BT-20. ..................................................................................................................... 81
Figure 4-30 Dynamic monitoring of cell proliferation using the xCELLigence system
in CAMA-1. ................................................................................................................. 82
Figure 4-31 Dynamic monitoring of cell proliferation using the xCELLigence system
in MDA-MB-231. ........................................................................................................ 82
Figure 4-32 The morphological appearance of treated cell lines under the light
microscope. ................................................................................................................ 85
Figure 4-33 Hoechst 33258 staining and morphological appearance of cell nucleus
after treatment. ......................................................................................................... 88
Figure 4-34 Western blot analysis of PARP-1 cleavage in untreated and Adriamycin
treated breast carcinoma cell lines. ........................................................................... 89
Figure 4-35 Graphical representation of normalized data of PARP-1 band intensities
in untreated breast carcinoma cell lines. ................................................................... 90
Figure 4-36 Graphical representation of normalized data of PARP-1 band intensities
in untreated and Adriamycin treated MDA-MB-231 cells. ........................................ 90
Figure 4-37 Western blot analysis of PARP-1 cleavage in DMSO and Propolis-2
treated breast carcinoma cell lines. ........................................................................... 92
Figure 4-38 Graphical representation of normalized data of full length PARP-1 band
intensity in breast carcinoma cell lines. ..................................................................... 92
Figure 4-39 Graphical representation of normalized data of cleaved PARP-1 band
intensity in breast carcinoma cell lines. ..................................................................... 93
Figure 4-40 Graphical representation of normalized data of full length PAPR-1 and
cleaved PARP-1 band intensity ratio in untreated and Adriamycin treated MDA-MB-
231 cells. ..................................................................................................................... 94
Figure 4-41 Graphical representation of normalized data of full length PAPR-1 and
cleaved PARP-1 band intensity ratio in breast carcinoma cell lines. ......................... 94
Figure 4-42 Cell cycle analysis of untreated and Adriamycin treated MDA-MB-231
cell line with flow cytometer. .................................................................................... 96

xiv
Figure 4-43 Graphical representation of cell cycle analysis of untreated and
Adriamycin treated MDA-MB-231 cell line. ............................................................... 97
Figure 4-44 Cell cycle analysis of DMSO and propolis treated MDA-MB-231 cell line
with flow cytometer. .................................................................................................. 98
Figure 4-45 Graphical representation of cell cycle analysis DMSO and propolis
treated MDA-MB-231 cell line. .................................................................................. 99
Figure 4-46 Graphical representation of cell cycle analysis of untreated, DMSO,
propolis and Adriamycin treated MDA-MB-231 cell line. ........................................ 100
Figure 4-47 Light microscope image to evaluate wound healing in vitro in the scratch
assay using a confluent monolayer of MDA-MB-231 Cells. ..................................... 102
Figure 8-1 Permission to Reuse of Figure 1-1. ......................................................... 146
Figure 8-2 Permission to Reuse of Figure 1-2. ......................................................... 146
Figure 8-3 Permission to Reuse of Figure 1-3. ......................................................... 147
Figure 8-4 Permission to Reuse of Figure 1-4. ......................................................... 147
Figure 8-5 Permission to Reuse of Figure 1-5. ......................................................... 148

xv
List of Tables
Table 1.1 The two most common types of new cancer cases and deaths by world
area, 2008 .................................................................................................................... 2
Table 1.2 Properties of Breast carcinoma cell lines. .................................................... 4
Table 1.3 Chemical Composition of Propolis ............................................................... 7
Table 2.1 Growth mediums of cell lines ..................................................................... 17
Table 2.2 General Solutions ....................................................................................... 18
Table 2.3 Cell Lysis Buffer ........................................................................................... 18
Table 2.4 Bradford Stock Solution.............................................................................. 18
Table 2.5 Bradford Working Solution ......................................................................... 18
Table 2.6 5x Loading Dye ........................................................................................... 19
Table 2.7 30% Acrylamide/Bisacrylamide Solution.................................................... 19
Table 2.8 SDS Gel Formulation to Prepare two Gels ................................................. 19
Table 2.9 5x Running Buffer ....................................................................................... 19
Table 2.10 Wet Transfer Buffer .................................................................................. 19
Table 2.11 Antibodies and Their Solutions ................................................................ 20
Table 2.12 Propidium Iodide (PI) Staining Solution ................................................... 20
Table 2.13 Production Information of Materials ....................................................... 20
Table 3.1 Starting cell number for IC50 calculations ................................................... 25
Table 3.2 Sample Preparation for BSA Standard Curve ............................................. 31
Table 3.3 Sample Preparation for Protein Quantitation with Spectrophotometer... 32
Table 3.4 Absorbance and Protein Concentrations of Samples for Western Blot
Analysis. ...................................................................................................................... 33

xvi
Table 4.1: The ELISA reading results that show the cytotoxic effects of Propolis-1
and DMSO on FOCUS cells ......................................................................................... 41
Table 4.2: The ELISA reading results that show the cytotoxic effects of Propolis-1
and DMSO on FOCUS (A) and Huh7 (B) cells at different time points ....................... 43
Table 4.3: The ELISA reading results of Propolis-1 and DMSO on FOCUS, Huh7, SK-LC,
MDA-MB-231 and MCF12A cell lines. ........................................................................ 45
Table 4.4: Comparison of control DMSO and propolis treated cells proliferation
ratio. ........................................................................................................................... 48
Table 4.5 Classification of Breast carcinoma cell lines According to Their Molecular
Status with IC50 Values of Propolis Extracts ............................................................... 73
Table 4.6 Starting Cell Numbers of Cell Lines for xCELLigence Monitoring ............... 79
Table 4.7 Percent gate comparison of untreated, DMSO, propolis and Adriamycin
treated MDA-MB-231 cell line for cell cycle analysis. ............................................... 99
Table 8.1: The ELISA reading results of MCF10A cell numbers when treated with
Propolis-1 and DMSO. .............................................................................................. 116
Table 8.2: The ELISA reading results of MCF10A cell numbers when treated with
Propolis-2 and DMSO. .............................................................................................. 117
Table 8.3: The ELISA reading results of MCF12A cell numbers when treated with
Propolis-1 and DMSO. .............................................................................................. 118
Table 8.4: The ELISA reading results of MCF12A cell numbers when treated with
Propolis-2 and DMSO. .............................................................................................. 119
Table 8.5: The ELISA reading results of MDA-MB-231 cell numbers when treated
with Propolis-1 and DMSO. ...................................................................................... 120
Table 8.6: The ELISA reading results of MDA-MB-231 cell numbers when treated
with Propolis-2 and DMSO. ...................................................................................... 121
Table 8.7: The ELISA reading results of CAMA-1 cell numbers when treated with
Propolis-1 and DMSO. .............................................................................................. 122
Table 8.8: The ELISA reading results of CAMA-1cell numbers when treated with
Propolis-2 and DMSO. .............................................................................................. 123

xvii
Table 8.9: The ELISA reading results of MDA-MB-453 cell numbers when treated
with Propolis-1 and DMSO. ...................................................................................... 124
Table 8.10: The ELISA reading results of MDA-MB-453 cell numbers when treated
with Propolis-2 and DMSO. ...................................................................................... 125
Table 8.11: The ELISA reading results of MDA-MB-468 cell numbers when treated
with Propolis-1 and DMSO. ...................................................................................... 126
Table 8.12: The ELISA reading results of MDA-MB-468 cell numbers when treated
with Propolis-2 and DMSO. ...................................................................................... 127
Table 8.13: The ELISA reading results of T47D cell numbers when treated with
Propolis-1 and DMSO. .............................................................................................. 128
Table 8.14: The ELISA reading results of T47D cell numbers when treated with
Propolis-2 and DMSO. .............................................................................................. 129
Table 8.15: The ELISA reading results of MCF7 cell numbers when treated with
Propolis-1 and DMSO. .............................................................................................. 130
Table 8.16: The ELISA reading results of MCF7 cell numbers when treated with
Propolis-2 and DMSO. .............................................................................................. 131
Table 8.17: The ELISA reading results of HCC-1937 cell numbers when treated with
Propolis-1 and DMSO. .............................................................................................. 132
Table 8.18: The ELISA reading results of HCC-1937 cell numbers when treated with
Propolis-2 and DMSO. .............................................................................................. 133
Table 8.19: The ELISA reading results of MDA-MB-157 cell numbers when treated
with Propolis-1 and DMSO. ...................................................................................... 134
Table 8.20: The ELISA reading results of MDA-MB-157 cell numbers when treated
with Propolis-2 and DMSO. ...................................................................................... 135
Table 8.21: The ELISA reading results of BT-20 cell numbers when treated with
Propolis-1 and DMSO. .............................................................................................. 136
Table 8.22: The ELISA reading results of BT-20 cell numbers when treated with
Propolis-2 and DMSO. .............................................................................................. 137
Table 8.23: The ELISA reading results of MDA-MB-361 cell numbers when treated
with Propolis-1 and DMSO. ...................................................................................... 138
xviii
Table 8.24: The ELISA reading results of MDA-MB-361 cell numbers when treated
with Propolis-2 and DMSO. ...................................................................................... 139
Table 8.25: The ELISA reading results of BT-474 cell numbers when treated with
Propolis-1 and DMSO. .............................................................................................. 140
Table 8.26: The ELISA reading results of BT-474 cell numbers when treated with
Propolis-2 and DMSO. .............................................................................................. 141
Table 8.27: The ELISA reading results of ZR-75-1 cell numbers when treated with
Propolis-1 and DMSO. .............................................................................................. 142
Table 8.28: The ELISA reading results of ZR-75-1 cell numbers when treated with
Propolis-2 and DMSO. .............................................................................................. 143
Table 8.29: The ELISA reading results of hTERT-HME1 cell numbers when treated
with Propolis-1 and DMSO. ...................................................................................... 144
Table 8.30: The ELISA reading results of hTERT-HME1 cell numbers when treated
with Propolis-2 and DMSO. ...................................................................................... 145

xix
Abbreviations
°C degree Celsius
APS Ammonium persulfate
bCSCs breast cancer stem cells
BRCA1 breast cancer type 1 susceptibility protein
BRCA2 breast cancer type 2 susceptibility protein
BSA Bovine serum albumin
CAPE Caffeic acid phenethyl ester
caspase-3 cysteinyl-aspartate proteases-3
CI Cell Index
CO2 Carbon dioxide
Conc. Concentration
ddH2O Double-distilled water
DEP DMSO extract of propolis
DMEM Dulbecco’s modified Eagle's medium
DMSO Dimethyl sulfoxide
DNA Deoxyribonucleic acid
EDTA Ethylenediaminetetraacetic acid
EEP ethanol extract of propolis
EGF Epidermal growth factor
ELISA Enzyme-linked immunosorbent assay
ER estrogen receptor
etc et cetera
FACS Fluorescence-activated cell sorting
FBS Fetal bovine serum
G2/M Gap 2/Mitosis
h hour
HDACi histone deacetylase inhibitor
HER2(ERBB2) Human Epidermal Growth Factor Receptor 2
IC50 The half maximal inhibitory concentration
kDa kiloDalton
LNCaP androgen-sensitive human prostate adenocarcinoma cells
MMP matrix metalloproteinase
n/a not available
NaCl Sodium chloride

xx
NF-κB nuclear factor kappa-light-chain-enhancer of activated B cells
nm nanometer
NP-40 nonyl phenoxypolyethoxylethanol
OD Optical Density
p53 protein 53
PAR Poly(ADP-ribose)
PARP-1 Poly(ADP-ribose) Polymerase-1
PBS Phosphate buffered saline
PI Propidium iodide
Post-EMT Post-Epithelial–mesenchymal transition
PR progesterone receptor
rpm Revolutions per minute
RPMI Roswell Park Memorial Institute medium
SDS Sodium dodecyl sulfate
SEM Standard error of the mean
SRB Sulforhodamine B
TBS for SRB Tris Base Solution
TBS for Western Tris-buffered saline
TBS-T Tris-buffered saline with Tween 20
TCA Trichloroacetic Acid
TEMED Tetramethylethylenediamine
TNF Tumor necrosis factors
TRAIL TNF-related apoptosis-inducing ligand
ul microliter
VEGF Vascular endothelial growth factor
WEP water extract of propolis
wt wild type
Z impedance

1
1 INTRODUCTION
1.1 Breast Cancer
Malignant tumors can invade the surrounding cells or metastasize to other parts of
body. It is defined as breast cancer when the malignant tumor starts in the cells of
breast (cancer.org; American Cancer Society). Healthy breast consists of fat,
connective tissue, blood and lymph vessels (Figure 1-1).
Figure 1-1 Anatomy of breast (Harness, 2011).

2
Breast cancer is the most common cancer type and the leading cause of cancer
death among women worldwide (Table 1.1). Increase in the age is the most
important risk factor and BRCA1 & BRCA2 inherited mutations increase the risk
(cancer.org; American Cancer Society).
Table 1.1 The two most common types of new cancer cases and deaths by world
area, 2008 (cancer.org; American Cancer Society).
1.1.1 Classification of Breast Cancer
Since breast consists of epithelial cells, almost all of the breast cancers are
carcinomas. Some of them are adenocarcinomas if cancer starts from ducts or
lobules of the breast which produces milk. Carcinoma in situ is the early stage of the
cancer and this is referred to as non-invasive or pre-invasive (cancer.org; American
Cancer Society). On the other hand, infiltrating carcinomas are invasive and

3
constitutes more than 95% of all mammary carcinomas (Yoder, 2007). Both
carcinomas can be ductal or lobular.
Molecular classification is very important for breast cancer because of the
heterogeneous nature of the cancer. Basal and luminal cells are the two distinct
epithelial subtypes of mammary gland (Perou, 2000). Luminal subtype can be
divided into Luminal A and Luminal B as their gene expression pattern (Sorlie, 2003).
Also another subdivision came from Neve et. al. as Basal A and Basal B (Neve, 2006).
Dawson et. al. introduced a novel categorization in recently published article. This
categorization includes 10 “integrative clusters” which are generated from
molecular information of genomic and transcriptomic features of breast cancer
(Dawson, 2013). Categorization of Breast cancer is important for the sake of proper
treatment to each subtype of breast cancer. Different drugs may affect a subtype of
breast cancer which can be linked with its molecular properties.
1.1.2 Breast Carcinoma Cell Lines
BT-20 was the first breast carcinoma cell line to be established in 1958. Followed by
MD Anderson series of breast carcinoma cell lines and the most famous one, MCF7
was established by Michigan Cancer Foundation in 1973. Cell lines are good models
of breast cancer research (Holliday, 2011). Classification of cell lines is also
important to use the right cell line as model. For example, a specific kinase inhibitor
was shown that it preferentially inhibits proliferation of luminal estrogen receptor-
positive human breast carcinoma cell lines (Finn, 2009). Different compounds may
have selective effect on subtypes of breast cancer and this can be linked with its
molecular properties of the subtype. Some of the characteristics of the breast
carcinoma cell lines are summarized in the Table 1.2.

4
Table 1.2 Properties of Breast carcinoma cell lines. {* = amplified but not highly
expressed, n/a = not available, wt = wild type, ER = estrogen receptor, PR =
progesterone receptor, HER2[ERBB2] = Human Epidermal Growth Factor Receptor
2} (Neve, 2006; Kao, 2009; Finn, 2009; Holliday, 2011).
Subtype ER status PR status HER2 status p53 mutation
MCF10A Basal B negative negative immortalized +/- wt
MCF12A Basal B negative negative n/a +
CAMA-1 Luminal positive negative normal +
MDA-MB 231 Basal B(Post-EMT) negative negative normal ++ mutant
MDA-MB-453 Luminal negative negative amplified* - wt
MDA-MB-468 Basal A negative negative normal +
MCF7 Luminal A positive positive normal +/- wt
T47D Luminal A positive positive normal ++ mutant
MDA-MB-157 Basal B(Post-EMT) negative negative normal -
HCC-1937 Basal A (Post-EMT) negative negative normal -
BT-20 Basal A negative negative normal ++ wt
MDA-MB-361 Luminal positive positive amplified - wt
BT-474 Luminal B positive positive amplified +
ZR-75-1 Luminal B positive negative normal -
hTERT-HME1 Basal B negative n/a negative n/a
1.2 Biological Compound Propolis
From ancient times to today, humankind faced to reality of breast cancer and tried
different treatments varies from organic supplies to surgical operations. We are still
looking for a cure for cancer in general. If we assume that nature has a remedy for
all problems, we should look for the remedy for treatment of breast cancer. In this
case we are looking for it in a beehive where propolis comes from.

5
Propolis or bee glue is a yellow-brownish resinous compound which is collected
from various plants and combined with wax and bee enzymes by worker bees. This
mixture is used to smooth out hive walls, to protect bees from diseases because of
its antiseptic features and also to embalm the carcasses of invader insects to avoid
decomposition (Sforcin, 2011). The word propolis comes from a Greek origin which
pro is ‘in front of’ or ‘at the entrance to’ and polis is city -in this case, hive- therefore
propolis means that a material in defense of the hive (Castaldo, 2002).
Using propolis as a medicine has a long history dating back to ancient times. For
instance, Ancient Egyptians used propolis to embalm the cadavers and Ancient
Greeks and Romans used propolis as an anti-inflammatory agent to heal wounds
and ulcers. Also it was accepted as an official drug in London in 17th century
(Salatino, 2011). Still, it is widely used among Balkan States. There are also studies
that show propolis having no side effect to mice or human (Sforcin, 2007). Recently,
there are many studies associated with propolis extracts aiming to find new
treatment possibilities in diverse research fields such as immunology, oncology,
infectious diseases, allergy, diabetes, ulcers, etc (Sforcin, 2011).
Chemical composition of propolis varies by the geographical status and by the
different races of honeybees. Different studies are going on with local propolis
extracts such as Cuban, Brazilian, Chinese, Indian etc. (Monzote, 2012; Sforcin,
2011; Sun, 2012; Thirugnanasampandan, 2012). Propolis is mainly composed of
resins which comes from plants those honeybees collect from. Hence, propolis
extracts from different geographical origin have a specific combination of chemicals
that reflect the floral properties of the field (Salatino, 2011). Sibel Silici and
Semiramis Kutluca showed that Turkish propolis collected form Erzurum region
have a number of chemical compounds which were identified from propolis for the
first time (Silici, 2005).
Diversity of propolis has both advantages and disadvantages for the research.
Distinct compounds found in propolis may have novel benefits for the drug

6
discoveries or they may construct a novel synergistic effect with regular compounds
found in propolis. Major disadvantage would be the problem of standardization of
propolis as a possible drug; however there are many ways to overcome this
problem. The most common solution to standardize of propolis is to categorize
propolis according to its chemical composition and source of plant. Six main types
of propolis are poplar propolis, birch propolis, Brazilian green propolis, red propolis,
pacific propolis and Canarian propolis (Bankova, 2005). When the standardization
problem is defeated, the use of propolis is “safe and less toxic than many synthetic
medicines” (Castaldo, 2002).
1.2.1 Propolis Extracts
Propolis extraction is made with alcoholic solvents or water, generally. The most
common solvent is absolute ethanol, methanol and water follows it. While water
extraction has 7% activity, alcoholic extractions can reach up to 28% activity. Also
triglyceride extraction patent is held by Japanese researchers (Ashry, 2012). Since
the chemical composition of propolis is very complex (propolis consist of more than
300 components), solvent of the extraction method affects the activity of propolis.
Different compounds in the mixture can solubilize in different solvents so that each
extraction material gives different outcomes (Sforcin, 2007).
Turkish researchers were able to extract the propolis with dimethyl sulfoxide
(DMSO) which can dissolve both polar and nonpolar compounds (Aliyazicioglu,
2005). DMSO maximizes the penetration of compounds to the cells as well as it is a
good solvent for flavonols (one of the most common compound in propolis) (Cai,
2011). According to one of the studies, DMSO extract of propolis (DEP) is richer in
polyphenols and flavonoids than water extraction of propolis (WEP). They also claim
that the antioxidant potentials of those two extracts are parallel with the total
phenolic compounds in each extract (Barlak, 2011).

7
Propolis composition is highly variable considering the plant source, bee race,
geographical and seasonal diversity. In general, propolis contains flavonoids such as
chrysin, acacetin, apigenin, and phenolic acids like cinnamic acid, caffeic acid, etc
(Table 1.3). Propolis also includes some vitamins and minerals as well as fatty acids
(Khalil, 2006). Some of the researchers use the whole extract of propolis whereas
others prefer to use active components of it. Even though using an individual
constituent of propolis is an effective way of standardization, there might be a
synergic effect of components within the propolis extract. This effect can be the
reason that propolis has different pharmacological activities (Banskota, 2001).
Table 1.3 Chemical Composition of Propolis (Sawicka, 2012).
Compounds Percentage
Fatty and Aliphatic Acids 24-26 %
Flavonoids 18-20 %
Sugars 15-18 %
Aromatic Acids 5-10 %
Esters 2-6 %
Vitamins 2-4 %
Alcohol and Terpens 2-3.3 %
Microelements 0.5-2 %
Others 21-27 %

8
1.2.2 Antitumoral Activity of Propolis and Its Active Components
Propolis is a research subject for its antitumoral activity all over the world with local
extracts since its composition changes with its origin. The common point of the anti-
cancerous effects of propolis is the ability of propolis to trigger apoptosis in cancer
cells. Some of the active components of propolis as well as alcoholic extractions or
water-soluble derivatives of propolis were shown to induce apoptosis in cancer cells
depending on the concentration (Sawicka, 2012). There are many studies conducted
on propolis or its active components for treatment of cancer which reveals the
potential of this biological compound in the development of novel anti-cancerous
agents.
Numerous studies claim that polyphenols in propolis, activates TRAIL-induced
apoptosis in cancer cells. Naringenin in lung cancer, Biochanin A in prostate cancer,
Kaempferol in glioma and chrysin, quercetin, apigenin in various cancer cells were
particularly identified as a synthesizer of TRAIL-induced apoptosis (Szliszka, 2013).
Synthesizing cancer cells to TRAIL-targeted therapies with propolis or its
polyphenols would increase the anticancer activity of TRAIL so that TRAIL-resistance
may be overcome by propolis treatment.
Artepillin C (3,5-diprenyl-4-hydroxycinnamic acid) is one of the active components
of propolis which causes significant damage to carcinoma and malignant melanoma.
Intratumor injection of Artepillin C (500g, three times a week) increases the number
of helper T cells in addition to suppression of tumor growth in mice (Khalil, 2006).
Caffeic acid phenethyl ester (CAPE) is a strong antioxidant, extracted from propolis
and it is a well-known NF-κB specific inhibitor (Figure 1-2). It suppresses the cell
proliferation of some metastatic prostate cancer cell lines as well as sensitizes
cancer cells to radiation and chemotherapeutic drugs. LNCaP (androgen-sensitive
human prostate adenocarcinoma cells) xenograft nude mice were orally treated
with CAPE (10 mg/kg per day for six weeks) and consequently tumor volume was

9
reduced 50% (Liu, 2013). As a result of these findings, it is hypothesized that CAPE
can be an effective adjuvant therapy for prostate cancer.
Figure 1-2 The Chemical Structure of Caffeic acid phenethyl ester (CAPE) C17H16O4
(Akyol, 2012).
As a candidate anti-cancer agent, propolis can be a relatively inexpensive solution
for cancer treatment. Administration of propolis does not lead to side effects on
rats or humans along with the fact that it can reduce side effects of cancer
treatment (Watanabe, 2011). A research group from Turkey also supports that
usage of CAPE prevents the damages and side effects of chemotherapy and
radiotherapy. They propose the usage of CAPE as a protective agent during
chemotherapy in clinical trials (Akyol, 2012). A research group from Taiwan claims
that CAPE has an anti-metastatic and anti-angiogenic effects on cancer cells. Even
though the exact mechanism of anti-metastatic activity of CAPE is not revealed yet,
they demonstrated that CAPE has effects on destruction of capillary-like tube
formation, inhibition of tumor cell invasion, and elimination of VEGF level in vitro
and in vivo (Liao, 2003).
Another usage of active components of propolis is as a histone deacetylase inhibitor
(HDACi). with anticancer activity. Chrysin (Sun, 2012) and NMB-HD-1 (Huang, 2012)
are examples of HDACis synthesized from propolis. Chrysin, a known potent
anticancer compound, is a HDAC8 inhibitor as well as it can significantly inhibit
tumor growth. Chrysin is also important for the standardization of Chinese propolis
since it is the major index compound (Sun, 2012). NMB-HD-1 has an anti-
proliferative effect and also injection of NMB-HD-1 to MDA-MB-231 breast cancer

10
xenograft model exhibited antitumor activity. This outcome may involve HDAC
inhibition which changes chromatin core histones so that expression of cell cycle
regulating genes changes. Another possibility is the suppression of PTEN/AKT
pathway which inhibits cancer cell growth (Huang, 2012).
1.2.3 Synergistic Effects of Propolis with Other Chemotherapeutic Drugs
Propolis have various functional and biological properties such as antibacterial
(Grange, 1990)., antimicrobial (Monzote, 2012), anti-oxidative
(Thirugnanasampandan, 2012), antiviral (Viuda-Martos, 2008), hepatoprotective
(Albukhari, 2009), anti-cancerious (Sawicka, 2012), anti-ulcerous (Viuda-Martos,
2008) as well as anti-inflammatory (Banskota, 2001). Especially anti-oxidative and
anti-inflammatory features of propolis make it a promising candidate as an adjuvant
to chemotherapy.
More than 70% of antitumor agents are natural compounds or materials derived
from natural products (Watanabe, 2011). Propolis is one of the candidates for such
products while paclitaxel is already one of them. Paclitaxel also known as Taxol® is
an anticancer agent which was isolated from bark of Taxus brevifolia (Figure 1-3)
(Khosroushahi, 2011).

11
Figure 1-3 Picture of Taxus brevifolia (Pacific Yew) which Paclitaxel was isolated
from (McMullen, 2008).
Paclitaxel is widely used for treatment of breast cancer, non-small cell lung cancer,
ovarian cancer, melanoma, head and neck cancer. Giving paclitaxel in combination
with propolis, results in maximum protection from induced mammary
carcinogenesis in rats. Treating breast cancer-bearing rats with 50 mg propolis per
kg body weight along with 33 mg paclitaxel per kg body weight reduces the toxic
side effects of paclitaxel by propolis’ immunemodulatory activity. Another effect of
propolis is free radical scavenging activity against alkoxyl radicals that is due to the
antioxidant property of propolis. Synergistic action of propolis mixture is distinct
from the action of a single component since there are diverse effects of propolis on
cancer treatment (Padmavathi, 2006).
In another study, ethanolic extract of propolis was used with temozolomide to
inhibit U87MG (human glioblastoma cell line) cell line growth. Researchers affirmed
that propolis has cytotoxic effects as well as growth inhibiting activity in
combination with temozolomide. They think there is at least partial relationship
between cytotoxic properties and reduced activity of NF-κB since NF-κB is an
essential survival factor for glioblastomas (Markiewicz-Żukowska, 2013).

12
Caffeic acid phenethyl ester (CAPE), an active component of propolis was found to
change the characteristics of breast cancer stem cells (bCSCs). CAPE inhibits the self-
renewal and clonal expansion in soft agar, also decrease the CD44 (cell surface
markers for bCSCs) content and malignancy in bCSCs. Another effect of CAPE is that
it increases the cycling state of bCSCs so that susceptibility to chemotherapeutic
agents of bCSCs increases. In conclusion, CAPE can be used effectively for cancer
treatment in combination with other chemotherapeutic agents (Omene, 2012).
1.3 Cell Death
Carl Vogt was the first one to describe cell death in 1842 following the
establishment of cell theory. He observed the elimination of cells and replacement
of them by new cells (Clarke, 2012). Stress to the cellular system causes cell death
with a diverse and complex process. Apoptosis, necrosis, autophagy and mitotic cell
death are the known cell death types for today. An individual cell may have a
heterogeneous behavior within a population as well as cell death can also be a
heterogeneous property. Both biochemical and morphological properties may
cause the heterogeneity in cellular systems (Stevens, 2013). Apoptosis and
autophagy are the most well-known programmed cell death mechanism however
there is third one: programmed necrosis. These are the three main forms of
programmed cell death and they balance survival with cell death for normal cells
(Ouyang, 2012).

13
1.3.1 Apoptosis
In the case of cellular life, death program comes with the code which gives the life
itself. In case of emergencies, cells kill themselves for the sake of population of
other cells. This is also parallel with the evolutionary development since cells cannot
pass their genetic information if the information is damaged.
Figure 1-4 Fas-induced and TNF-induced Apoptosis Models (Nagata, 1997).
If the DNA damage is irreversible, major type of cell death is the apoptosis.
Apoptosis can be triggered by two different pathways: death receptor (extrinsic)
and mitochondrial (intrinsic) pathway. When plasma-membrane death receptor, Fas
binds to its extracellular ligand Fas-L; the extrinsic pathway triggers. Both TNF and
Fas induces extrinsic pathway of apoptosis (Figure 1-4). Mitochondrial pro-enzymes
control the intrinsic pathways of apoptosis (Ouyang, 2012).

14
1.3.2 Poly(ADP-ribose) Polymerase-1 (PARP-1) Cleavage
Single and double stranded DNA breaks activate the nuclear protein PARP and PARP
is also involved in DNA repair, cell cycle regulation, differentiation and
transformation mechanisms (Whitacre, 1999). PARP binds to DNA single strand
brakes and induces a structural modification to promote base excision repair.
Poly(ADP-ribose) (PAR) recruits other DNA damage proteins to the close vicinity and
PARP induces the synthesis of PAR. Following Poly(ADP-ribosyl)ation (PARylation),
PARP is needed to be cleaved by cysteinyl-aspartate proteases-3 (caspase-3)
(Nowsheen, 2012).
Caspases, calpains, cathepsins, granzymes and matrix metalloproteinases (MMPs)
are some of the suicidal proteases which cleave PARP from different sites so that
signature fragments appear (Figure 1-5). Each cleaved fragment has its specific
molecular weight therefore fragments can be used as a biomarker for specific cell
death program (Chaitanya, 2010).

15
Figure 1-5 Various Fragments of PARP-1 after cleaved by specific suicidal
proteases (Chaitanya, 2010).
PARP-1 cleavage by caspases is considered as a hallmark of apoptosis. There are 2
different possible fragments after the cleavage of PARP by caspases: 85 and 89 kDa
fragments. These fragments are indicators of apoptosis of the cell. The full-length
protein is 116 kDa and cleavage by caspase-3 results in 89 kDa fragment. However,
cleavage by caspases-7 yields two specific fragments, 89 and 24 kDa (Chaitanya,
2010). Therefore detection of one of these bands shows the association of
apoptosis. On the other hand, 50 kDa fragment is detected during necrosis
(Buontempo, 2010).

16
2 Materials
2.1 Propolis Extract
Propolis extracts were kindly provided by Prof. Dr. Orhan Değer from Karadeniz Technical
University, Faculty of Medicine, Department of Medical Biochemistry. Two different
batches of DMSO extracts of propolis were used in this study; first batch is 25 mg/ml
(Propolis-1) and second batch is 100 mg/ml (Propolis-2). Propolis was collected from
different regions of Turkey by Fanus Gıda Corporation (Trabzon, Turkey) and extractions
were prepared in laboratories of Karadeniz Technical University with the following method:
Natural propolis was grinded and mixed until it became powder. For 25 mg/ml propolis
extract, 0.5 g of propolis powder was mixed with 20 ml DMSO and vortexed. Mixture was
incubated on the shaker at 150 rpm for 24 hours at 60°C for propolis to dissolve. Mixture
was filtered with filter paper and the extracts were kept in dark at +4°C. 100 mg/ml propolis
extract was prepared with the same procedure.
2.2 Growth Mediums
Growth mediums of cell lines are given in Table 2.1.

17
Table 2.1 Growth mediums of cell lines

18
2.3 Buffers and Solutions
Table 2.2 General Solutions
10% TCA Solution (v/v) 10% TCA in ddH2O
1% Acetic Acid Solution (v/v) 1% Acetic acid in ddH2O
0.4% SRB Solution (w/v) 0.4% SRB in 1% Acetic Acid
10 mM Tris Base Solution 10 mM Tris in ddH2O
300 ug/ml Hoechst 33258 Stock Solution
300 ug/ml Hoechst dissolved in ddH2O (stored in dark)
1 ug/ml Hoechst 33258 Working Solution
1 ug/ml Hoechst diluted from 300 ug/ml Hoechst stock solution dissolved in 1x PBS (kept in dark)
10x TBS 12.19 g Tris-base and 87.76 g NaCl were dissolved in 1 liter of ddH2O and the pH was adjusted to 8 to prepare 10X TBS stock solution.
0.2 % TBS-T 0.2% Tween 20 was added into 1X TBS solution.
10% APS (w/v) 10% APS in 1% ddH2O
5 % BSA (w/v) 5% BSA in 0.2 % TBS-T
5 % milk (w/v) 5% milk powder in 0.2 % TBS-T
Table 2.3 Cell Lysis Buffer
Reagent Final concentration
Tris-HCl (pH:8.0) 50 mM
NaCl 150 mM
NP-40 1 %
SDS 0.1 %
Protease Inhibitor 1x
ddH2O Rest of the solution
Table 2.4 Bradford Stock Solution
Coomassie brilliant blue 17.5 mg
Ethanol 4.75 ml
Phosphoric acid 10 ml
final volume with ddH2O= 25 ml
Table 2.5 Bradford Working Solution
Bradford stock solution 1.5 ml
95% Ethanol 0.75 ml
Phosphoric acid 1.5 ml
final volume with ddH2O= 25 ml

19
Table 2.6 5x Loading Dye
Tris-HCL, pH:6.8, , 62.5 mM
β-mercaptoethanol 5%
glycerol 15%
bromophenol blue. 0.001%
SDS 2%
Table 2.7 30% Acrylamide/Bisacrylamide Solution
Acrylamide 29 gr
Bisacrylamide 1 gr
final volume with ddH2O= 100 ml
stored in the dark
Table 2.8 SDS Gel Formulation to Prepare two Gels
Reagents 5% Stacking Gel 10% Resolving Gel
30% acrylamide/bisacrylamide solution 1.3 ml 6.7 ml
1.0 M Tris Solution (pH: 8.8) - 7.5 ml
1.0 M Tris Solution (pH: 6.8) 1.0 ml -
10% SDS solution 80 ul 200 ul
10% APS solution 80 ul 200 ul
TEMED 8 ul 8 ul
ddH2O 5.6 ml 5.4 ml
TOTAL= 8 ml 20 ml
Table 2.9 5x Running Buffer
Tris 45 g
Glycine 216 g
SDS 15 g
final volume with ddH2O= 3 liters
Table 2.10 Wet Transfer Buffer
Tris 6 g
Glycine 28.8g
Methanol 15%
final volume with ddH2O= 1 liter

20
Table 2.11 Antibodies and Their Solutions
Primary Antibodies
PARP-1 (Cell Signaling 46D11): 1:200 in 5% BSA in 0.2 % TBS-T
β-actin (Sigma A5441): 1:5000 in 5% milk powder in 0.2% TBS-T
Secondary Antibodies
Anti-Mouse IgG (Sigma A9044): 1:5000 in 5% milk powder in 0.2% TBS-T
Anti-Rabbit IgG (Sigma A0545): 1:5000 in 5% BSA in 0.2 % TBS-T
Table 2.12 Propidium Iodide (PI) Staining Solution
Propidium Iodide (PI) stock 50 ug/ml
RNAse-A 0.1 mg/ml
Triton X 0.05%
Dissolved in PBS
2.4 General Materials
Table 2.13 Production Information of Materials
Material Catalog Number Company
DMEM (Low Glucose) SH30021.01 Hyclone
Acetic Acid 27225-2.5L-R Sigma Aldrich
Acrylamide BP170-500 Fisher Scientific
Adriamycin (ADRIMISIN 10 mg)
L01DB01 Saba İlaç
APS 420627 Carlo Erba
Bisacrylamide A3636,0250 AppliChem
Bovine Pituitary Extract 13028-014 Gibco
Bromophenol blue. B5525 Sigma Aldrich
BSA 10 735 078 001 Roche

21
Material Catalog Number Company
Coomassie brilliant blue 27816 Fluka
D-Glucose 16325 Riedel de Haen
DMEM/Ham's F12 F4815 Biochrom
DMSO A3672,0100 AppliChem
EGF E9644-2MG Sigma Aldrich
Ethanol CAS-64-17-5 AlcoMED
FBS SV30160.03 Hyclone
Glycerol 346165 Carlo Erba
Glycine EC200-272-2 Fisher Scientific
Hoechst 33258 861405 Sigma Aldrich
Hydrocortisone H0888-19 Sigma Aldrich
Insulin I1882-100MG Sigma Aldrich
Isopropanol 1.009.952.500 MERCK
L-Glutamine K0293 Biochrom
Methanol 24229-2.5L-R Sigma Aldrich
Milk powder - Sütaş
NaCl 1,06404,1000 MERCK
Nitrocellulose Membrane RPN3032D Amersham
Nonessential Amino Acids BE13-114E Lonza
NP-40 NonidetP-40 AppliChem
Parafilm PM.996 Pechiney
PBS BE17-516F Lonza
Penicillin/Streptomycin SV30010 Hyclone
Phosphoric acid 4107 Riedel de Haen
Propidium Iodide (PI) D4864 Sigma Aldrich
Protease Inhibitor 11873580001 Roche
RNAse-A EN0531 Thermo Scientific
RPMI Medium SH30096.01 Hyclone
SDS L5750 Sigma Aldrich
Sodium Pyruvate 11360 Gibco
Sulforhodamine B (SRB) S1402 Sigma Aldrich
Trichloroacetic Acid (TCA) 33731-100G Sigma Aldrich
Tris 826 Amresco
Tris-Base T1503-1KG Sigma Aldrich
Tris-HCl T-3253 Sigma Aldrich
Trypsin/EDTA SH30236.01 Hyclone
Tween 20 0777-1L Amresco
β-mercaptoethanol M-3148 Sigma Aldrich

22
3 Methods
3.1 Cell Culture Techniques
3.1.1 Growth Conditions
Every cell line was grown in their appropriate growth medium which is listed in the
materials section Table 2.1. Cells were passaged when their confluence was over
70%. Some of the cells were passaged 1:2 while some fast growing cell lines were
passaged 1:5. When cells reached confluency the growth medium was removed and
the cells were washed with 1xPBS. 1 ml pre-warmed Trypsin/EDTA was spread into
75 cm2 flasks and incubated at 37°C for 1-2 minutes. When cells detached from the
flask surface, trypsin was inactivated with FBS containing fresh culture medium.
Cells were dispersed by pipetting up and down a few times. Cells were transferred
to new culture flasks and incubated in a 5% air jacketed CO2 incubator at 370C.

23
3.1.2 Cryopreservation of Cells
Cells were incubated 24 h after passaging and 75 cm2 flask full of cells was frozen
into one tube. Their growth medium was removed and washed with 1x PBS. 1 ml
Trypsin/EDTA was spread into 75 cm2 flasks and incubated at 37°C for 1-2 minutes.
When cells appeared to have lost their adherence, trypsin was inactivated by adding
fresh medium which contains FBS. Cells were transferred into 15 ml tubes and
centrifuged at 1500 rpm for 5 minutes. Cryopreservative medium was freshly
prepared by mixing 90% FBS and 10% DMSO. After centrifugation, medium was
removed and cell pellets were suspended within 1 ml freezing medium. Each cell
pellet was stored in separate cryotubes at -20°C for 1 hour and -80°C or in liquid
nitrogen for long term storage. Each vial contains approximately 3-4 millions of
cells.
3.1.3 Reculturing Frozen Cells
Frozen cells need to be thawed rapidly therefore they were melted down in a water
bath at 37°C. Melted cells were mixed with 5 ml pre-warmed growth medium and
centrifuged at 1500 rpm for 5 minutes. After centrifugation, DMSO containing
freezing medium was removed and cell pellets were suspended within 5 ml fresh
growth medium and transferred into 25 cm2 flask. Cells were incubated at 37°C with
5% CO2 air. Next day, the growth medium was removed and the cells were washed
with 1x PBS. If the cells were confluent enough, the cells were cultured into 75 cm2
flask as described above. Cells were incubated at 37°C with 5% CO2 air. The cells
were passaged at least once before using for further manipulations.

24
3.1.4 Storing Cell Pellets for Protein Isolation
The cells pellets were collected for protein extraction to use for Western blot
experiments. The drug treated and un-treated cells were cultured in 6 well plates.
Since apoptotic cells detach from the plate surface and remain in the growth media,
growth medium in each well was collected into separate 15 ml tubes. The wells
were washed with 1x PBS and PBS was added into same 15 ml tubes detached cells
containing growth medium. 0.3 ml Trypsin/EDTA was spread into each well of 6
well plate to detach the adherent cells and incubated at 37°C for 1-2 minutes. When
cells appeared to have lost their adherence, trypsin was inactivated by adding fresh
medium which contains FBS. Cells were transferred into appropriate tubes
containing the cells collected from the previous steps and centrifuged at 1500 rpm
for 5 minutes at +4°C. The supernatant was removed and the cell pellets were
resuspended with ice-cold 1x PBS. Tubes were centrifuged at 1500 rpm for 5
minutes at +4°C. PBS was removed and tubes were soaked in liquid nitrogen
immediately to freeze them. Pellets were stored at -80°C for further experiments.
3.1.5 Cell Counting with Haemocytometer
Haemocytometer was used to determine the number of cells in the cell cultures.
Certain number of cells was required for IC50 calculations, xCELLigence and other
propolis treatment experiments. The cultured cells were trypsinized and
resuspended in culture mediums as described above. Haemocytometer was cleaned
with 70% ethanol and a coverslip was gently put onto the chamber area. The cell
suspension was mixed gently to ensure equal distribution of the cells in the tube
and then 10 ul of cell suspension was taken and placed into the edge of the
chambers. Two chambers were used for counting. The cells in 16 corner squares
were counted under the light microscope for both chambers of Haemocytometer.

25
Average of those numbers was multiplied with 104. This gives the approximate cell
number within 1 ml of cellular solution. The certain amount of cells for each cell line
was used for various experiments.
3.2 Sulforhodamine B (SRB) Assay
Different cell lines were plated (Table 3.1) into the 96 well plates and treated with
Propolis-24 hours later. At a given amount of time later, cells need to be fixed to
stop further cell growth. After fixation cells were stained with SRB and the color
intensity was measured with ELISA reader. Resulting optical density (OD) is
correlated with the amount of cells.
Table 3.1 Starting cell number for IC50 calculations
Propolis-1 Propolis-2
BT-20 12,000 12,000
BT-474 20,000 10,000
CAMA-1 4,000 4,000
HCC-1937 10,000 8,000
hTERT-HME1 6,000 6,000
MCF10A 4,000 5,000
MCF12A 5,000 6,000
MCF7 3,000 3,000
MDA-MB 231 4,000 7,000
MDA-MB-157 10,000 10,000
MDA-MB-361 20,000 20,000
MDA-MB-453 4,000 8,000
MDA-MB-468 4,000 4,000
T47D 5,000 4,000
ZR-75-1 5,000 6,000

26
3.2.1 Trichloroacetic acid (TCA) Fixation
For propolis and DMSO control treated cells, fixation was done as following method
for each well. These cells were plated and after 24 h, treated with either propolis or
DMSO. Cells need to be fixed after 72 h incubation of treatment. This part was done
by using multi-channel pipetting for 96 well plate.
Remove growth medium with pipet
Add 100-200 ul PBS at room temperature and shake gently (Add 500 ul for
24 well plates)
Remove PBS with pipet
Add 50 ul ice-cold 10% TCA solution (Add 200 ul for 24 well plates)
Incubate at +4°C for 1 hour
Wash with excess ddH2O for 5 times
Leave at room temperature for air dry
3.2.2 Sulforhodamine B (SRB) Staining
TCA fixed and air-dried plates were stained with SRB dye solution for further
measurements as in the following method:
0.4% SRB prepared with 1% acetic acid solution
Add 50 ul SRB solution to each well and make sure that solution covers all
the bottom surface of each well (Add 200 ul for 24 well plates)
Incubate the dye at room temperature for 10 minutes in dark.
Wash with excess 1% acetic acid solution 5 times
Leave at room temperature for air dry
Add ice-cold 100 ul 10mM Tris-base solution (Add 500 ul for 24 well plates)
Solubilize the dye in the Tris-base solution on the shaker for 5 minutes
Read the results with ELISA reader at 515 nm

27
3.3 IC50 Calculations
For the IC50 calculations SRB assay results were used. Cells were treated with
propolis and DMSO control with serial diluted concentrations of propolis for at least
5 different concentrations. Samples were collected and calculated at least in
triplicates. OD results were then converted to the percent cell death values by using
following formula. At a given concentration:
percent cell death = (1 – average OD propolis/average OD DMSO)*100
Percent cell death values of each concentration were calculated and drawn on an X-
Y Scatter graph on Excel sheet. For this graph logarithmic trend line was added and
50% inhibition intersection was calculated with given formula on Excel:
IC50 value =EXP((50 – y-intersection point of trend line)/ slope of trend line)
This formula gives IC50 value of propolis at a given time point for particular cell line.
Also coefficient of determination was checked to see the significance of calculated
IC50 value. That was calculated by Excel by R2 value of the trend line. For this study
IC50 values were calculated only if the R2 values are in between 0.75 -1.00.
3.4 Statistical Analyses
Standard Error of the Mean (SEM)
To determine the standard deviation between triplicate or quadruplicate samples,
SEM analysis was performed. STDEVA function was used for the calculation of

28
standard deviation and the result was divided by square root of sample number.
The result shows the standard error of the mean (SEM) for selected samples.
SEM = STDEVA (Sample1, sample2,…) / (√ sample number)
Student’s t-test
To calculate the significance of two groups such as luminal-basal, ER positive-
negative, etc. T-TEST function was used with Microsoft Excel. Function was used to
compare the significance of two subgroups with two-tailed distribution and two-
sample unequal variance. P<0.05 were analyzed as significant result.
3.5 Live Cell Proliferation Assay (xCELLigence)
The xCELLigence is a system that monitors dynamic cellular events in real time and
gives quantitative information about biological status of the cells including cell
number and viability. This system enabled to provide good sensitivity and
reproducibility in monitoring an entire cell population in a culture well. The
technology behind this system comes from the design of the platform. E-plate 96 is
similar to 96 well plates but it contains electrode sensors integrated into the each
well so that each well can be monitored separately. The electrode impedance (Z)
increases as the number of cells increase on it (Figure 3-1).

29
Figure 3-1 Schematic Drawing of the Working Principle of xCELLigence (ACEA
Bioscience Inc.)
Before inoculating the cells to the E-plate 96, 50 ul of growth medium was put into
E-plate 96 wells for each cell line to obtain background readings (takes only 1
minute). This step also allows us to determine if there are any inconvenient wells
exist in that particular plate so that a problematic well can be omitted from the
experiment design and replaced with another well. The certain number of cells
were from cell suspensions were added on top of growth mediums with 100 ul/well
volume where the total volume will be 150 ul/well in total. The xCELLigence system
(RTCA SP Station) where the cells were replaced was kept at 37°C with 5% CO2 air
incubator during the experiment. Depending of the cell growth (between 24 to 72
hours), cells were treated with either DMSO or Propolis-2 with pre-determined
concentrations. The treatment time point determined as the cells pass 0.75 Cell
Index and before they reach to 1.25 Cell Index so that cells can be treated when
they are in the log phase. At the beginning of the experiment, Cell Index values
were recorded for every 30 minutes but after the drug treatment the Cell Index

30
values were recorded for every 10 minutes to observe the fast drug response. After
the observation of fast drug response the counter changed into record Cell Index for
every 30 minutes. Long-term drug response was recorded at least 72 hours after the
drug treatment.
3.6 Nuclear Staining with Hoechst 33258
Cells (80,000 cells/well) were plated in cover slips in 6 well plates and after 24 h
cells were treated with 0.1 % DMSO control or 100 ug/ml Propolis-2. Cells were
incubated at 37°C with 5% CO2 air. After 48 h incubation, growth medium was
removed and cells were washed with 1x PBS. After removal of PBS, cells were fixed
with 1 ml ice-cold 100% methanol and kept for 10 minutes at +4°C. Cells were
washed with ice-cold 1x PBS. 1 ug/ml Hoechst 33258 solution was prepared with
ice-cold 1x PBS. After removal of PBS, cells were stained with 400 ul Hoechst
solution and incubated at room temperature for 5 minutes in the dark. Then the
cells were destained with ddH2O for 10 minutes at room temperature in the dark.
Water was removed and cover slips were mounted on glass slides with glycerol.
Cover slips were fixed onto the slides by wiping transparent nail polish to the edges.
The stained cells’ nuclear morphology was examined under fluorescent microscope.
3.7 Western Blot
3.7.1 Cell Lysis
Cell pellets were taken from -80°C freezer and thawed on ice. Each pellet was
resuspended with 50 ul (depending on to cell pellet size) cell lysis buffer, vortexed 3

31
times and left on ice for 30 minutes with occasional vortexing. Samples were
centrifuged at 13000 rpm at +4°C for 15 minutes. The supernatant was taken into
the fresh tubes. Protein samples were always stored in -80°C and kept on ice during
the experiments.
3.7.2 Bradford Assay for Protein Quantitation and Sample Preparation
Bradford assay was used to determine the amount of protein in each cell lysate.
BSA Standard Curve was prepared before using Bradford working solution. BSA
samples were prepared in Cuvettes as in Table 3.2. Samples were measured with
spectrophotometer at 515 nm wavelength and absorbance results were used to
draw a BSA Standard Curve (Figure 3-2). Trendline of this curve was used for protein
quantitation of samples.
Table 3.2 Sample Preparation for BSA Standard Curve
Vial # Blank 1 2 3 4 5 6
BSA (ug/ml) - 1 2 4 8 16 32
ddH2O (ul) 100 99 98 96 92 84 68
Bradford (ul) 900 900 900 900 900 900 900
TOTAL (ul) 1000 1000 1000 1000 1000 1000 1000

32
Figure 3-2 BSA Standard Curve
After generating the BSA Standard Curve, protein samples were prepared as in
Table 3.3 to measure with spectrophotometer at 515 nm wave length. The
measurements were taken and the results were calculated with the trendline
equation of BSA Standard Curve (y=0.2021x-0.2554). Since 2 ul of samples were
loaded to the cuvettes, the results were divided by 2. Absorbance of samples and
their protein concentrations were calculated and given in Table 3.4.
Table 3.3 Sample Preparation for Protein Quantitation with Spectrophotometer
Vial # Blank Samples
Cell Lysis Buffer (ul) 2 -
Protein Sample (ul) - 2
ddH2O (ul) 98 98
Bradford (ul) 900 900
TOTAL (ul) 1000 1000

33
Table 3.4 Absorbance and Protein Concentrations of Samples for Western Blot
Analysis.
Sample Name Absorbance Protein Conc.
(ug/ul)
for 50 ug (ul)
ddH2O (ul)
5X Loading dye (ul)
MCF10A DMSO(%0.1) 0,7606 22,99 2,18 9,82 3
Propolis(100ug/ml) 0,4599 16,18 3,09 8,91 3
MDA-MB-231 DMSO(%0.1) 0,5867 19,05 2,62 9,38 3
Propolis(100ug/ml) 0,4558 16,09 3,11 8,89 3
T47D DMSO(%0.1) 0,4038 14,91 3,35 8,65 3
Propolis(100ug/ml) 0,2771 12,05 4,15 7,85 3
CAMA-1 DMSO(%0.1) 0,4285 15,47 3,23 8,77 3
Propolis(100ug/ml) 0,1991 10,28 4,86 7,14 3
BT-20 DMSO(%0.1) 0,8366 24,71 2,02 9,98 3
Propolis(100ug/ml) 0,353 13,76 3,63 8,37 3
BT-474 DMSO(%0.1) 0,3074 12,73 3,93 8,07 3
Propolis(100ug/ml) 0,0323 6,51 7,68 4,32 3
MDA-MB-231
DMSO(%0.1) 0,5058 17,22 2,90 9,10 3
IC50(74 ug/ml) 0,0082 5,96 8,38 3,62 3
Propolis(100 ug/ml) 0,2985 12,53 3,99 8,01 3
IC100(148 ug/ml) -0,0519 4,60 10,86 1,14 3
MDA-MB-231 (Positive Control)
Adriamycin 500 ng/ml 0,2178 10,71 4,67 7,33 3
Adriamycin 750 ng/ml 0,3035 12,64 3,95 8,05 3
Adriamycin 1000 ng/ml 0,1351 8,83 5,66 6,34 3
MCF10A
Untreated Cell Lines
0,1726 9,68 5,16 6,84 3
T47D 0,0819 7,63 6,55 5,45 3
CAMA-1 0,038 6,64 7,53 4,47 3
BT-20 -0,0734 4,12 12,14 -0,14 3
BT-474 0,0431 6,75 7,40 4,60 3
MDA-MB-231 0,2143 10,63 4,71 7,29 3
BSA curve is y=0.2021x-0.2554 TOTAL 15 ul
Western blot analysis was performed with these protein extracts. 50 mg of protein
was mixed with 1x loading dye and added up to final volume of 15 ul with ddH2O

34
(Table 3.4). Samples were incubated on boiling water for 5 minutes. After a quick
spin down, samples were ready to load into SDS gel. The samples were always kept
on ice during the experiments.
3.7.3 Preparation of SDS gel and Its Transfer to Nitrocellulose Membrane
The material used for gel preparation was pre-washed with soap, rinsed with tap
water and then with distilled water to get rid of the debris on the material. The
apparatus was set and 10% resolving gel was prepared and poured in between the
glasses and then filled with isopropanol. After polymerization of resolving gel,
isopropanol was removed and the empty area was washed with distilled water to
remove remaining alcohol. 5% stacking gel was prepared, poured on top of
resolving gel and combs were placed in between glasses. After polymerization of
gels, glasses with gels were placed in the tank that was filled with 1x running buffer.
Combs were carefully removed and the wells were cleared with a syringe. The first
well was loaded with 5 ul of PageRuler Plus Prestained Protein Ladder (Thermo
Scientific) and samples were loaded into the wells. Power supply was adjusted to 90
Volts until proteins passed through the stacking gel and then increased to 120 Volts.
The gels were transferred to nitrocellulose membrane with wet transfer method.
Wet transfer buffer was prepared with 15% methanol concentration. Whatman
papers, sponges and membranes were soaked in wet transfer buffer for a few
minutes. From negative plate towards positive plate; sponge, two Whatman papers,
gel, nitrocellulose membrane, two Whatman papers, and sponge were aligned one
top of each other. Before putting the last sponge, air bubbles were destroyed by
rolling a tube on the layers. Transfer cassettes were placed in tank and filled with
wet transfer buffer. Power supply was adjusted to 80 Volts and the gels were run
for approximately 2 hours.
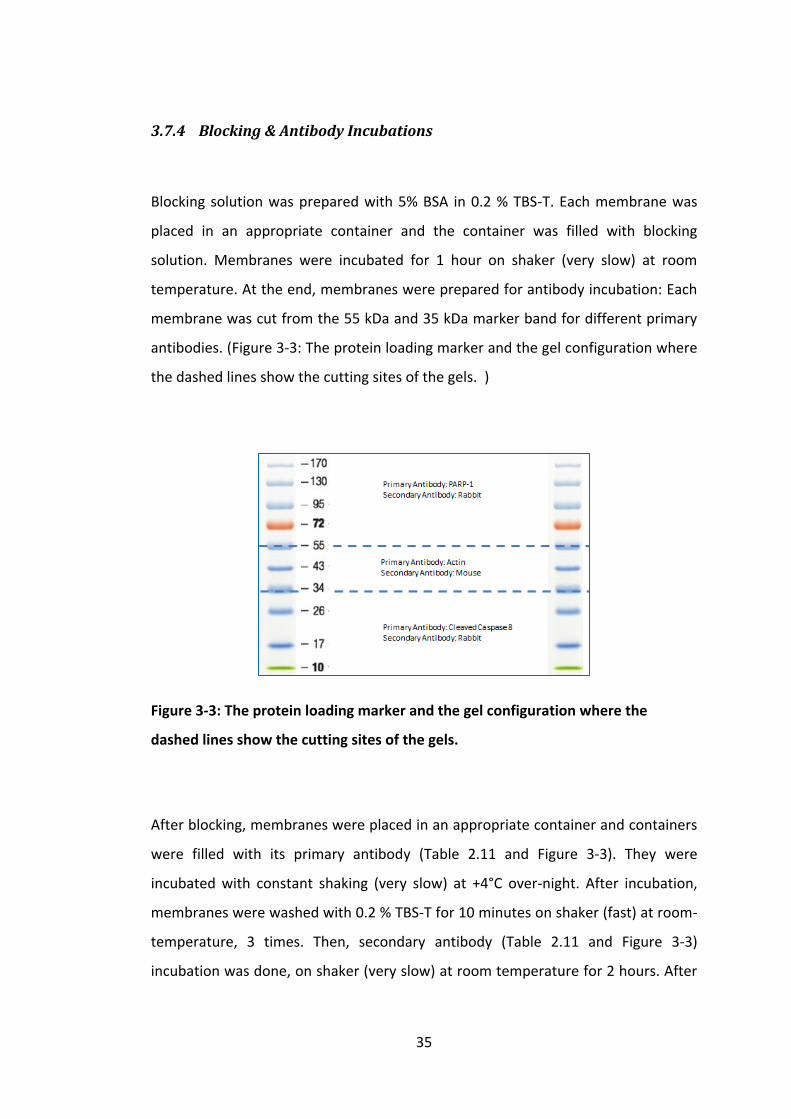
35
3.7.4 Blocking & Antibody Incubations
Blocking solution was prepared with 5% BSA in 0.2 % TBS-T. Each membrane was
placed in an appropriate container and the container was filled with blocking
solution. Membranes were incubated for 1 hour on shaker (very slow) at room
temperature. At the end, membranes were prepared for antibody incubation: Each
membrane was cut from the 55 kDa and 35 kDa marker band for different primary
antibodies. (Figure 3-3: The protein loading marker and the gel configuration where
the dashed lines show the cutting sites of the gels. )
Figure 3-3: The protein loading marker and the gel configuration where the
dashed lines show the cutting sites of the gels.
After blocking, membranes were placed in an appropriate container and containers
were filled with its primary antibody (Table 2.11 and Figure 3-3). They were
incubated with constant shaking (very slow) at +4°C over-night. After incubation,
membranes were washed with 0.2 % TBS-T for 10 minutes on shaker (fast) at room-
temperature, 3 times. Then, secondary antibody (Table 2.11 and Figure 3-3)
incubation was done, on shaker (very slow) at room temperature for 2 hours. After

36
incubation, membranes were washed three times with 0.2 % TBS-T for 10 minutes
on shaker (fast) at room-temperature.
Clarity™ Western ECL Substrate (Bio-Rad) material was used for detecting the signal
of secondary antibodies. The membranes were placed on a 10x10 cm parafilm on
the bench. Each membrane was coved with 250-350 ul (according to area of the
membrane) 1:1 mixed ECL solution drop by drop. Membranes were incubated for 5
minutes at room-temperature and plastic covers were put on top of every
membrane so that solution was not exposed to light. After incubation membranes
were placed on glass plate. The x-ray film was used to capture image of the
membranes in the dark room. Membranes were exposed to film between 1-5
seconds depending of the intensity of the bands.
3.7.5 ImageJ Analysis
Resulting bands on film were analyzed with ImageJ software (National Institutes of
Health (NIH)) which is a public domain Java image processing program. The resulted
band intensities need to be quantified to be able to compare the western blot
results. Films were scanned and saved as jpeg photo. These photos were used for
ImageJ analysis. The bands were selected with a rectangular shape option of the
program and all the lanes were repeated with the same rectangular selection. At
the end rectangular area was plotted by the program and the resulting band
intensity was quantified. The comparable data was calculated by dividing PARP-1
protein intensity to its β-actin loading control. The resulting values were displayed
in bar graphs.

37
3.8 FACS
3.8.1 Cell Fixation
Propolis-treated and un-treated cells were used for staining with Propidium iodide
(PI) to analyze the cell cycle stages with FACS method. Six well plates were used for
culturing the cells and for treatment. Since apoptotic cells detach from the plate
surface and remain in the growth media, each well was transferred into separate 15
ml tubes and labeled. Then, each well was washed with 1x PBS and PBS was
collected into same tubes containing the detached cells. 0.3 ml Trypsin/EDTA was
put into each well of 6 well plate and incubated at 37°C for 1-2 minutes to detach
the adherent cells. When the cells appeared to have lost their adherence, trypsin
was inactivated by adding fresh medium which contains FBS. Cells were transferred
into appropriate tubes containing the cells collected in previous steps and
centrifuged at 1500 rpm for 5 minutes at +4°C. Supernatant was removed and cell
pellets were resuspended by gentle pipetting with 1 ml 1x PBS. Cell suspensions
were vortexed vigorously and 2.5 ml of ice-cold 100% absolute ethanol was added
drop wise to prevent cell clumps during fixation. Cell suspensions were incubated
for 30 minutes on ice with occasional vortexing. Fixed cell suspensions were stored
at +4°C overnight before the PI staining procedure.
3.8.2 Cell Staining with Propidium iodide (PI)
Fixed cell suspensions were centrifuged at 1500 rpm for 5 minutes at +4°C. The
supernatant was aspirated. Cells were stained with 500 ul PI Staining Solution and
suspensions were pipetted gently to break cell clumps. Since PI is light-sensitive,

38
tubes need to be kept in dark after this step. Cells were incubated at 37°C for 40
minutes with occasional vortexing. After incubation, 3 ml 1x PBS was added onto
each tube and tubes were centrifuged at 1500 rpm for 5 minutes at +4°C. The
supernatant was removed and cell pellets were resuspended in 200-500 ul 1x PBS
(according to size of the pellet). Cell suspensions were transferred into special tubes
to analyze them in Flow Cytometer.
3.9 Scratch Assay
The in vitro scratch assay (wound healing assay) is an easy, low-cost and well-
developed method to measure cell invasion in vitro. A straight line of cells are
scraped from the plate and the invasion of the cells through this scraped line is
observed via light microscope.
FBS concentration in the growth medium was dropped from 10 % to 0.1 % to
prevent cells growing through the scratch. By this way, wound healing assay can
display the invasion properties of cells but not the proliferation. There were 6
conditions for this set up to observe the invasion rate:
10 % FBS containing growth medium treated cells (untreated, mock cells) to
observe the effect of proliferation and compare it with 0.1 % FBS medium
treated cells,
0.1 % FBS containing growth medium treated cells to observe the effect of
decreased FBS and compare it with DMSO control cells,
0.1 % FBS + 0.1 % DMSO containing growth medium treated cells as a
control for propolis treated cells,

39
0.1 % FBS + 50, 75 (IC50 value propolis for MDA-MB-231 cells) and 100
ug/ml Propolis-2 containing growth medium treated cells to see the effect of
gradually increasing concentrations of propolis on cell invasion ability.
Cells (500,000 cells/well) were seeded in 6 well plate to obtain high confluency and
24 hours later, scratches were made with a 200 ul micropipette tip. Cells were
washed with 1X PBS twice to get rid of cell debris in the medium and then cells
were treated with the growth mediums listed above. Right after the scratches were
performed, time zero photos were taken to observe the scratches borders clearly.
Then, the photos were taken at 6, 12, 24, 36 and 48 h intervals under the light
microscope with 10X magnification.

40
4 RESULTS
4.1 Analysis of Propolis' Effects in Cancer Cells
Two different propolis extracts were used in this study to analyze its cytotoxic
effects on cancer cells by using SRB staining and ELISA reading. First propolis extract
received from Karadeniz Technical University (Propolis-1) was prepared in DMSO
and the stock at a concentration of 25 mg/ml. The initial studies were performed
with increasing concentrations (starting from 100 ng/ml up to 2000 ng/ml) of
propolis by using FOCUS cell line at two different time points (48 and 72 h). The
ELISA reading as a result of SRB staining was given at Table 4.1 and results of these
experiments were analyzed in Figure 4-1.
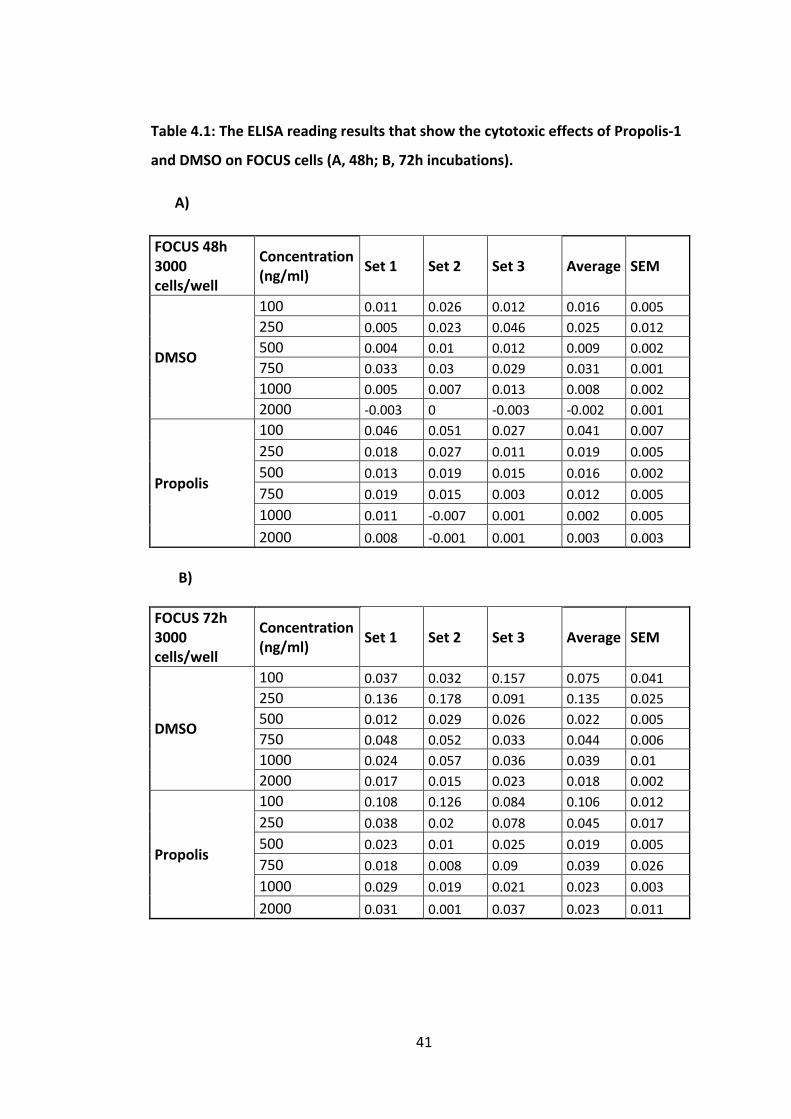
41
Table 4.1: The ELISA reading results that show the cytotoxic effects of Propolis-1
and DMSO on FOCUS cells (A, 48h; B, 72h incubations).
A)
FOCUS 48h 3000 cells/well
Concentration (ng/ml)
Set 1 Set 2 Set 3 Average SEM
DMSO
100 0.011 0.026 0.012 0.016 0.005
250 0.005 0.023 0.046 0.025 0.012
500 0.004 0.01 0.012 0.009 0.002
750 0.033 0.03 0.029 0.031 0.001
1000 0.005 0.007 0.013 0.008 0.002
2000 -0.003 0 -0.003 -0.002 0.001
Propolis
100 0.046 0.051 0.027 0.041 0.007
250 0.018 0.027 0.011 0.019 0.005
500 0.013 0.019 0.015 0.016 0.002
750 0.019 0.015 0.003 0.012 0.005
1000 0.011 -0.007 0.001 0.002 0.005
2000 0.008 -0.001 0.001 0.003 0.003
B)
FOCUS 72h
3000 cells/well
Concentration (ng/ml)
Set 1 Set 2 Set 3 Average SEM
DMSO
100 0.037 0.032 0.157 0.075 0.041
250 0.136 0.178 0.091 0.135 0.025
500 0.012 0.029 0.026 0.022 0.005
750 0.048 0.052 0.033 0.044 0.006
1000 0.024 0.057 0.036 0.039 0.01
2000 0.017 0.015 0.023 0.018 0.002
Propolis
100 0.108 0.126 0.084 0.106 0.012
250 0.038 0.02 0.078 0.045 0.017
500 0.023 0.01 0.025 0.019 0.005
750 0.018 0.008 0.09 0.039 0.026
1000 0.029 0.019 0.021 0.023 0.003
2000 0.031 0.001 0.037 0.023 0.011

42
Figure 4-1: The cell proliferation rate of FOCUS cells after propolis treatment. The
cells were treated with Propolis-1 and DMSO at 48 h (A) and 72 h (B). Standard
error of the mean (SEM) for each calculation is given at Table 4.1. (*, p<0.1; **,
p<0.05)
These analyses showed that the Propolis-1 at low concentrations (100 ng/ml up to
2000 ng/ml) did not result with a significant cytotoxic effect. Therefore, the
concentration of Propolis-1 was increased to 50 ug/ml. The cell proliferation rate
A
B

43
was measured at different time points (24, 48 and 72 h) by using FOCUS and Huh7
hepatocellular carcinoma cell lines. The ELISA reading as a result of SRB staining was
given at Table 4.2 and the results of these experiments were analyzed in Figure 4-2.
Table 4.2: The ELISA reading results that show the cytotoxic effects of Propolis-1
and DMSO on FOCUS (A) and Huh7 (B) cells at different time points (24 h, 48 h,
and 72 h). The starting cell number was 20,000 cells/well into 24 well plates.
A)
FOCUS Time Set 1 Set 2 Set 3 Set 4 Set 5 Set 6 Average SEM
Mock
24h 0.094 0.097 0.085 0.105 0.098 0.108 0.098 0.003
48h 0.216 0.221 0.212 0.24 0.217 0.214 0.22 0.004
72h 0.338 0.43 0.383 0.392 0.382 0.31 0.373 0.017
DMSO
24h 0.084 0.088 0.094 0.096 0.091 0.09 0.091 0.002
48h 0.214 0.243 0.229 0.224 0.266 0.248 0.237 0.008
72h 0.125 0.116 0.147 0.102 0.104 0.093 0.115 0.008
Propolis-1 50 ug/ml
24h 0.069 0.067 0.068 0.078 0.062 0.064 0.068 0.002
48h 0.109 0.096 0.078 0.091 0.097 0.082 0.092 0.005
72h 0.038 0.03 0.026 0.016 0.018 0.016 0.024 0.004
B)
Huh7 Time Set 1 Set 2 Set 3 Set 4 Set 5 Set 6 Average SEM
Mock
24h 0.064 0.062 0.069 0.073 0.07 0.064 0.067 0.002
48h 0.136 0.138 0.134 0.139 0.154 0.148 0.142 0.003
72h 0.289 0.295 0.3 0.306 0.309 0.264 0.294 0.007
DMSO
24h 0.065 0.057 0.057 0.053 0.059 0.056 0.058 0.002
48h 0.118 0.13 0.128 0.143 0.136 0.143 0.133 0.004
72h 0.324 0.3 0.266 0.293 0.32 0.307 0.302 0.009
Propolis-1 50 ug/ml
24h 0.043 0.043 0.038 0.042 0.039 0.043 0.041 0.001
48h 0.067 0.075 0.063 0.064 0.076 0.078 0.071 0.003
72h 0.083 0.063 0.087 0.083 0.084 0.084 0.081 0.004

44
Figure 4-2: The cell proliferation rate of FOCUS (A) and Huh7 (B) cells after
treatment with Propolis-1 and DMSO at 24 h, 48 h, and 72 h time points. Standard
error of the mean (SEM) for each calculations were given at Table 4.2. (**, p<0.05)
As a result of the above analysis, the most significant time point on HCC cell lines
showing significant cytotoxic effect was observed at 72 h with 50 ug/ml of Propolis-
1. Then the following experiments were designed to analyze the time points and
A
B

45
different concentration of Propolis-1 (25, 50 and 75 ug/ml) on five different cell
lines (FOCUS and Huh7 are hepatocellular carcinoma cells; SK-LC is a lung cancer cell
line; MDA-MB-231 is breast carcinoma cell line) and non-tumorigenic breast cell line
(MCF12A). For each cell line 20000 cells/well were plated on 24 well plates and
experiments were designed as triplicates. The cells were treated with indicated
concentrations of Propolis-1 and DMSO after 24 h incubation. The cells were fixed
and cell numbers were counted with SRB staining method at 72 h time point after
24 h treatment. The ELISA reading as a result of SRB staining was given at Table 4.3
and the results of these experiments were analyzed in Figure 4-3.
Table 4.3: The ELISA reading results of Propolis-1 and DMSO on FOCUS, Huh7, SK-
LC, MDA-MB-231 and MCF12A cell lines.
FOCUS (20000 cells/well) Set 1 Set 2 Set 3 Average SEM
25ug/ml DMSO 0.857 0.752 0.003 0.537 0.269
25ug/ml Propolis 0.306 0.402 0.415 0.374 0.034
50ug/ml DMSO 0.642 0.942 0.043 0.542 0.264
50ug/ml Propolis 0.042 0.095 0.119 0.085 0.023
75ug/ml DMSO 0.246 0.312 0.211 0.256 0.03
75ug/ml Propolis 0.005 0.007 0.008 0.007 0.001
Huh7 (20000 cells/well) Set 1 Set 2 Set 3 Average SEM
25ug/ml DMSO 0.431 0.616 0.019 0.355 0.176
25ug/ml Propolis 0.072 0.141 0.128 0.114 0.021
50ug/ml DMSO 0.331 0.535 0.177 0.348 0.104
50ug/ml Propolis 0.025 0.043 0.07 0.046 0.013
75ug/ml DMSO 0.279 0.387 0.13 0.265 0.075
75ug/ml Propolis 0.004 0.013 0.011 0.009 0.003
SK-LC (20000 cells/well) Set 1 Set 2 Set 3 Average SEM
25ug/ml DMSO 0.219 0.287 0.002 0.169 0.086
25ug/ml Propolis 0.035 0.042 0.051 0.043 0.005
50ug/ml DMSO 0.144 0.247 0.025 0.139 0.064
50ug/ml Propolis 0.038 0.035 0.034 0.036 0.001
75ug/ml DMSO 0.108 0.162 0.111 0.127 0.018
75ug/ml Propolis 0.002 0.004 0.002 0.003 0.001

46
MDA-MB-231 (20000 cells/well)
Set 1 Set 2 Set 3 Average SEM
25ug/ml DMSO 0.122 0.101 0.093 0.105 0.009
25ug/ml Propolis 0.057 0.064 0.061 0.061 0.002
50ug/ml DMSO 0.126 0.09 0.097 0.104 0.011
50ug/ml Propolis 0.049 0.043 0.043 0.045 0.002
75ug/ml DMSO 0.074 0.118 0.116 0.103 0.014
75ug/ml Propolis 0.012 0.01 0.007 0.01 0.001
MCF12A (20000 cells/well) Set 1 Set 2 Set 3 Average SEM
25ug/ml DMSO 0.052 0.075 0.052 0.06 0.008
25ug/ml Propolis 0.043 0.038 0.044 0.042 0.002
50ug/ml DMSO 0.041 0.066 0.088 0.065 0.014
50ug/ml Propolis 0.031 0.033 0.037 0.034 0.002
75ug/ml DMSO 0.041 0.057 0.013 0.037 0.013
75ug/ml Propolis 0.003 0.005 0.004 0.004 0.001
A

47
B
C
D

48
Figure 4-3: Cell proliferation of FOCUS (A), Huh7 (B), SK-LC (C), MDA-MB-231 (D)
and MCF12A (E) cell lines with increasing concentrations of Propolis-1 and DMSO.
Values are the average of at least three independent data sets. Error bars represent
standard error of the mean of triplicates given at Table 4.3. (*, p<0.1; **, p<0.05)
According to above analysis, higher concentrations of propolis have a greater effect
on cell number decrease in each cell line. When the ratio of DMSO over propolis
was calculated (Table 4.4), the effect of propolis was revealed more clearly (Figure
4-4). As the concentration of propolis increases, decrease in the cell number
became up to 10 fold more than low concentrations of propolis.
Table 4.4: Comparison of control DMSO and propolis treated cells proliferation
ratio. Each cell lines fold decrease ratio was calculated by dividing control DMSO
cell number to propolis value (data was taken from Figure 4-3).
Fold Decrease
FOCUS Huh7 SK-LC MDA-MB-231 MCF12A
25 ug/ml 1,4 3,1 3,9 1,7 1,4
50 ug/ml 6,4 7,6 3,9 2,3 1,9
75 ug/ml 36,6 29,4 42,3 10,3 9,3
E

49
Figure 4-4: The relative fold change of each propolis treated cell line at different
concentrations of Propolis-1. Each cell lines fold decrease ratio was calculated by
dividing control DMSO value to propolis value (data was taken from Table 4.3).
4.2 IC50 Values for Propolis extracts for Breast Carcinoma Cell
Lines
IC50 value determination was started with inoculation of breast carcinoma cells into
96 well plates. The numbers of cells were different for each cell line and indicated in
the related sections. 24 hours later, cells were treated with serial dilutions of
propolis and control DMSO. Propolis extract dissolved in DMSO, therefore the same
volume of DMSO was used in serial dilutions as controls. Cells were fixed with TCA
to 72 hours after the treatment. Cells were stained with SRB and the color intensity
was measured with ELISA reader. Resulting optical density (OD515) is correlated with

50
the amount of cells. Samples were collected and calculated at least in triplicates and
standard error of mean (SEM) was calculated according to sample number. IC50
values were analyzed with at least 5 different concentrations of propolis. All the IC50
value calculations were analyzed the same way. Two different batches of DMSO
extracts of propolis were used in this study; first batch is 25 mg/ml (Propolis-1) and
second batch is 100 mg/ml (Propolis-2). Propolis was collected from different
regions of Turkey by Fanus Gıda Corporation (Trabzon, Turkey) and extractions were
prepared in laboratories of Karadeniz Technical University, Medical biochemistry
laboratories, Trabzon.
IC50 Values of Propolis Extracts for Non-Tumorigenic Cell Lines (MCF10A and
MCF12A)
Analysis of IC50 value of propolis extracts on MCF10A was performed with following
conditions:
Propolis-1: 100-50-25-12.5-6 ug/ml, 4000 cells were used in each well. MCF10A cell
line’s IC50 value was calculated as 45 ug/ml (Figure 4-5, A). The experiment was
performed in triplicate.
Propolis-2: 200-150-100-75-37.5 ug/ml, 5000 cells were used in each well. MCF10A
cell line’s IC50 value was calculated as 72 ug/ml (Figure 4-5, B). The experiment was
performed in triplicate.
The original data for ELISA reading results are given in Appendix Table 8.1 for
Propolis-1 and Appendix Table 8.2 for Propolis-2.

51
Figure 4-5: Calculation of IC50 values for propolis extracts in MCF10A cells. Each
point shows the percent cell death at different concentrations of Propolis extracts.
A, The IC50 value for Propolis-1 is 45 ug/ml and R2 value is R2=0.7781. B, The IC50
value for Propolis-2 is 72 ug/ml and R2 value is R2=0.8955. Error bars represent
standard error of the mean (SEM).
A
B

52
Analysis of IC50 value of propolis extracts on MCF12A was performed with following
conditions:
Propolis-1: 100-80-50-40-25-12.5 ug/ml, 5000 cells were used in each well. MCF12A
cell line’s IC50 value was calculated as 35 ug/ml (Figure 4-6, A). The experiment was
performed in triplicate.
Propolis-2: 200-150-100-75-50-37.5 ug/ml, 6000 cells were used in each well.
MCF12A cell line’s IC50 value was calculated as 45 ug/ml (Figure 4-6, B). The
experiment was performed in quadruplicate.
The original data for ELISA reading results are given in Appendix Table 8.3 for
Propolis-1 and Appendix Table 8.4 for Propolis-2.
A

53
Figure 4-6: Calculation of IC50 values for propolis extracts in MCF12A cells. Each
point shows the percent cell death at different concentrations of Propolis extracts.
A, The IC50 value for Propolis-1 is 35 ug/ml and R2 value is R2=0.8174. B, The IC50
value for Propolis-2 is 45 ug/ml and R2 value is R2=0.8014. Error bars represent
standard error of the mean (SEM).
IC50 Values of Propolis extracts for MDA-MB-231 Cell line
Analysis of IC50 value of propolis extracts on MDA-MB-231 was performed with
following conditions:
Propolis-1: 100-75-50-25-12.5-6 ug/ml, 4000 cells were used in each well. MDA-MB-
231 cell line’s IC50 value was calculated as 26 ug/ml (Figure 4-6, A). The experiment
was performed in quadruplicate.
Propolis-2: 150-120-75-60-37.5-30 ug/ml, 7000 cells were used in each well. MDA-
MB-231 cell line’s IC50 value was calculated as 74 ug/ml (Figure 4-6, B). The
experiment was performed in quadruplicate.
B

54
The original data for ELISA reading results are given in Appendix Table 8.5 for
Propolis-1 and Appendix Table 8.6 for Propolis-2.
Figure 4-7 Calculation of IC50 values for propolis extracts in MDA-MB-231 cells.
Each point shows the percent cell death at different concentrations of Propolis
extracts. A, The IC50 value for Propolis-1 is 26 ug/ml and R2 value is R2 =0.9072. B,
The IC50 value for Propolis-2 is 74 ug/ml and R2 value is R2 =0.8009. Error bars
represent standard error of the mean (SEM).
A
B

55
IC50 Values of Propolis extracts for CAMA-1 Cell line
Analysis of IC50 value of propolis extracts on CAMA-1 was performed with following
conditions:
Propolis-1: 80-60-50-40-30-25 ug/ml, 4000 cells were used in each well. CAMA-1
cell line’s IC50 value was calculated as 25 ug/ml (Figure 4-8, A). The experiment was
performed in quadruplicate.
Propolis-2: 100-80-50-40-25-20 ug/ml, 4000 cells were used in each well. CAMA-1
cell line’s IC50 value was calculated as 35 ug/ml (Figure 4-8, B). The experiment was
performed in quadruplicate.
The original data for ELISA reading results are given in Appendix Table 8.7 for
Propolis-1 and Appendix Table 8.8 for Propolis-2.
A

56
Figure 4-8: Calculation of IC50 values for propolis extracts in CAMA-1 cells. Each
point shows the percent cell death at different concentrations of Propolis extracts.
A, The IC50 value for Propolis-1 is 25 ug/ml and R2 value is R2=0. 8977. B, The IC50
value for Propolis-2 is 35 ug/ml and R2 value is R2=0. 9885. Error bars represent
standard error of the mean (SEM).
IC50 Values of Propolis extracts for MDA-MB-453 Cell line
Analysis of IC50 value of propolis extracts on MDA-MB-453 was performed with
following conditions:
Propolis-1: 80-60-40-30-20 ug/ml, 4000 cells were used in each well. MDA-MB-453
cell line’s IC50 value was calculated as 47 ug/ml (Figure 4-9, A). The experiment was
performed in triplicate.
Propolis-2: 120-100-60-50-30 ug/ml, 8000 cells were used in each well. MDA-MB-
453 cell line’s IC50 value was calculated as 53 ug/ml (Figure 4-9, B). The experiment
was performed in quadruplicate.
B

57
The original data for ELISA reading results are given in Appendix Table 8.9 for
Propolis-1 and Appendix Table 8.10 for Propolis-2.
Figure 4-9: Calculation of IC50 values for propolis extracts in MDA-MB-453 cells.
Each point shows the percent cell death at different concentrations of Propolis
extracts. A, The IC50 value for Propolis-1 is 47 ug/ml and R2 value is R2=0. 9326. B,
The IC50 value for Propolis-2 is 53 ug/ml and R2 value is R2=0. 9154. Error bars
represent standard error of the mean (SEM).
A
B

58
IC50 Values of Propolis extracts for MDA-MB-468 Cell line
Analysis of IC50 value of propolis extracts on MDA-MB-468 was performed with
following conditions:
Propolis-1: 80-60-40-30-20-15 ug/ml, 4000 cells were used in each well. MDA-MB-
468 cell line’s IC50 value was calculated as 30 ug/ml (Figure 4-10, A). The experiment
was performed in quadruplicate.
Propolis-2: 120-100-60-50-30 -25 ug/ml, 4000 cells were used in each well. MDA-
MB-468 cell line’s IC50 value was calculated as 26 ug/ml (Figure 4-10, B). The
experiment was performed in quadruplicate.
The original data for ELISA reading results are given in Appendix Table 8.11 for
Propolis-1 and Appendix Table 8.12for Propolis-2.
A

59
Figure 4-10: Calculation of IC50 values for propolis extracts in MDA-MB-468 cells.
Each point shows the percent cell death at different concentrations of Propolis
extracts. A, The IC50 value for Propolis-1 is 30 ug/ml and R2 value is R2=0. 965. B,
The IC50 value for Propolis-2 is 26 ug/ml and R2 value is R2=0. 971. Error bars
represent standard error of the mean (SEM).
IC50 Values of Propolis extracts for T47D Cell line
Analysis of IC50 value of propolis extracts on T47D was performed with following
conditions:
Propolis-1: 80-60-50-40-30-25 ug/ml, 5000 cells were used in each well. T47D cell
line’s IC50 value was calculated as 36 ug/ml (Figure 4-11, A). The experiment was
performed in quadruplicate.
Propolis-2: 100-80-50-40-25-20 ug/ml, 4000 cells were used in each well. T47D cell
line’s IC50 value was calculated as 43 ug/ml (Figure 4-11, B). The experiment was
performed in quadruplicate.
The original data for ELISA reading results are given in Appendix Table 8.13 for
Propolis-1 and Appendix Table 8.14 for Propolis-2.
B

60
Figure 4-11: Calculation of IC50 values for propolis extracts in T47D cells. Each
point shows the percent cell death at different concentrations of Propolis extracts.
A, The IC50 value for Propolis-1 is 36 ug/ml and R2 value is R2=0. 979. B, The IC50
value for Propolis-2 is 43 ug/ml and R2 value is R2=0. 9602. Error bars represent
standard error of the mean (SEM).
A
B

61
IC50 Values of Propolis extracts for MCF7 Cell line
Analysis of IC50 value of propolis extracts on MCF7 was performed with following
conditions:
Propolis-1: 100-80-50-40-25-20 ug/ml, 3000 cells were used in each well. MCF7 cell
line’s IC50 value was calculated as 41 ug/ml (Figure 4-12, A). The experiment was
performed in quadruplicate.
Propolis-2: 120-100-60-50-30 -25 ug/ml, 3000 cells were used in each well. MCF7
cell line’s IC50 value was calculated as 61 ug/ml (Figure 4-12, B). The experiment was
performed in quadruplicate.
The original data for ELISA reading results are given in Appendix Table 8.15 for
Propolis-1 and Appendix Table 8.16 for Propolis-2.
A
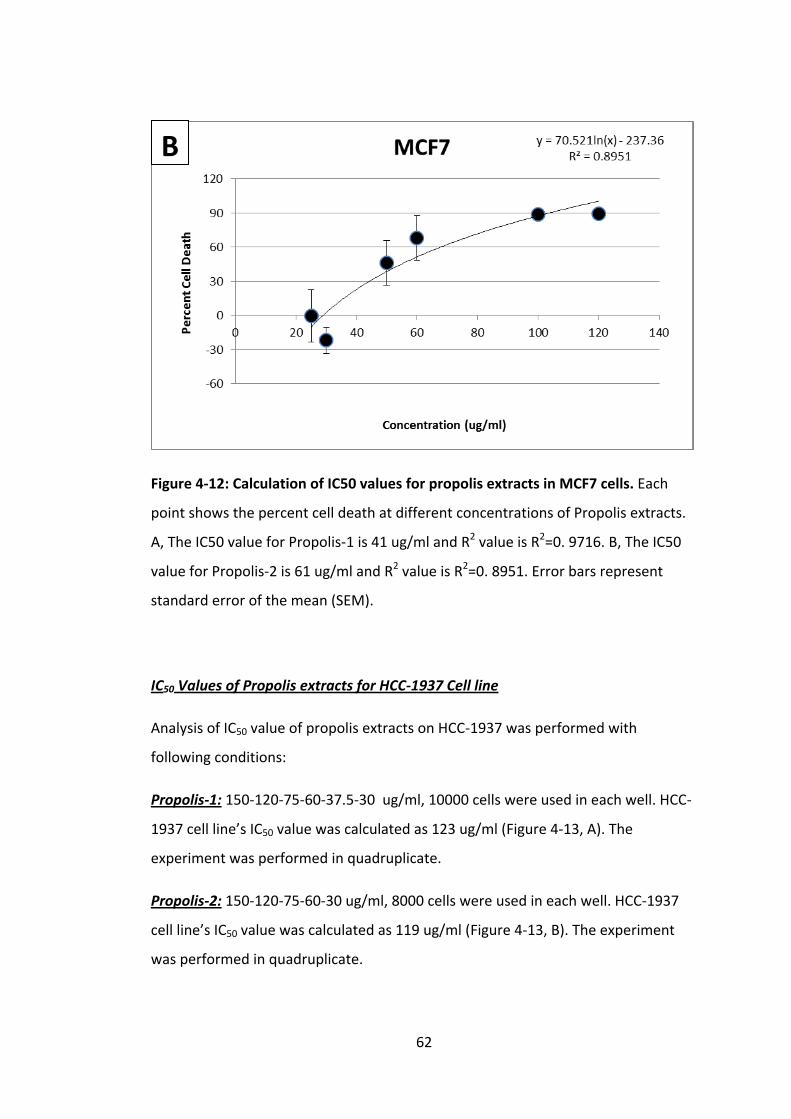
62
Figure 4-12: Calculation of IC50 values for propolis extracts in MCF7 cells. Each
point shows the percent cell death at different concentrations of Propolis extracts.
A, The IC50 value for Propolis-1 is 41 ug/ml and R2 value is R2=0. 9716. B, The IC50
value for Propolis-2 is 61 ug/ml and R2 value is R2=0. 8951. Error bars represent
standard error of the mean (SEM).
IC50 Values of Propolis extracts for HCC-1937 Cell line
Analysis of IC50 value of propolis extracts on HCC-1937 was performed with
following conditions:
Propolis-1: 150-120-75-60-37.5-30 ug/ml, 10000 cells were used in each well. HCC-
1937 cell line’s IC50 value was calculated as 123 ug/ml (Figure 4-13, A). The
experiment was performed in quadruplicate.
Propolis-2: 150-120-75-60-30 ug/ml, 8000 cells were used in each well. HCC-1937
cell line’s IC50 value was calculated as 119 ug/ml (Figure 4-13, B). The experiment
was performed in quadruplicate.
B

63
The original data for ELISA reading results are given in Appendix Table 8.17 for
Propolis-1 and Appendix Table 8.18 for Propolis-2.
Figure 4-13: Calculation of IC50 values for propolis extracts in HCC-1937 cells. Each
point shows the percent cell death at different concentrations of Propolis extracts.
A, The IC50 value for Propolis-1 is 123 ug/ml and R2 value is R2=0. 949. B, The IC50
value for Propolis-2 is 119 ug/ml and R2 value is R2=0. 8847. Error bars represent
standard error of the mean (SEM).
A
B

64
IC50 Values of Propolis extracts for MDA-MB-157 Cell line
Analysis of IC50 value of propolis extracts on MDA-MB-157 was performed with
following conditions:
Propolis-1: 120-100-60-50-30 -25 ug/ml, 10000 cells were used in each well. MDA-
MB-157cell line’s IC50 value was calculated as 88 ug/ml (Figure 4-14, A). The
experiment was performed in quadruplicate.
Propolis-2: 150-120-75-60-37.5-30 ug/ml, 10000 cells were used in each well. MDA-
MB-157cell line’s IC50 value was calculated as 61 ug/ml (Figure 4-14, B). The
experiment was performed in triplicate.
The original data for ELISA reading results are given in Appendix Table 8.19 for
Propolis-1 and Appendix Table 8.20 for Propolis-2.
A

65
Figure 4-14: Calculation of IC50 values for propolis extracts in MDA-MB-157cells.
Each point shows the percent cell death at different concentrations of Propolis
extracts. A, The IC50 value for Propolis-1 is 88 ug/ml and R2 value is R2=0. 9018. B,
The IC50 value for Propolis-2 is 61 ug/ml and R2 value is R2=0. 9429. Error bars
represent standard error of the mean (SEM).
IC50 Values of Propolis extracts for BT-20 Cell line
Analysis of IC50 value of propolis extracts on BT-20 was performed with following
conditions:
Propolis-1: 150-120-75-60-37.5-30 ug/ml, 12000 cells were used in each well. BT-20
cell line’s IC50 value was calculated as 73 ug/ml (Figure 4-15, A). The experiment was
performed in quadruplicate.
Propolis-2: 120-100-60-50-30 ug/ml, 12000 cells were used in each well. BT-20 cell
line’s IC50 value was calculated as 117 ug/ml (Figure 4-15, B). The experiment was
performed in triplicate.
B

66
The original data for ELISA reading results are given in Appendix Table 8.21 for
Propolis-1 and Appendix Table 8.22 for Propolis-2.
Figure 4-15: Calculation of IC50 values for propolis extracts in BT-20 cells. Each
point shows the percent cell death at different concentrations of Propolis extracts.
A, The IC50 value for Propolis-1 is 73 ug/ml and R2 value is R2=0. 9444. B, The IC50
value for Propolis-2 is 117 ug/ml and R2 value is R2=0. 8773. Error bars represent
standard error of the mean (SEM).
A
B

67
IC50 Values of Propolis extracts for MDA-MB-361 Cell line
Analysis of IC50 value of propolis extracts on MDA-MB-361 was performed with
following conditions:
Propolis-1: 80-60-40-30-20-15 ug/ml, 20000 cells were used in each well. MDA-MB-
361 cell line’s IC50 value was calculated as 51 ug/ml (Figure 4-16, A). The experiment
was performed in quadruplicate.
Propolis-2: 150-120-75-60-37.5-30 ug/ml, 20000 cells were used in each well. MDA-
MB-361 cell line’s IC50 value was calculated as 57 ug/ml (Figure 4-16, B). The
experiment was performed in quadruplicate.
The original data for ELISA reading results are given in Appendix Table 8.23 for
Propolis-1 and Appendix Table 8.24 for Propolis-2.
A

68
Figure 4-16: Calculation of IC50 values for propolis extracts in MDA-MB-361 cells.
Each point shows the percent cell death at different concentrations of Propolis
extracts. A, The IC50 value for Propolis-1 is 51 ug/ml and R2 value is R2=0. 9212. B,
The IC50 value for Propolis-2 is 57 ug/ml and R2 value is R2=0. 9433. Error bars
represent standard error of the mean (SEM).
IC50 Values of Propolis extracts for BT-474 Cell line
Analysis of IC50 value of propolis extracts on BT-474 was performed with following
conditions:
Propolis-1: 150-120-75-60-37.5-30 ug/ml, 20000 cells were used in each well. BT-
474 cell line’s IC50 value was calculated as 50 ug/ml (Figure 4-17, A). The experiment
was performed in triplicate.
Propolis-2: 150-120-75-60-37.5-30 ug/ml, 10000 cells were used in each well. BT-
474 cell line’s IC50 value was calculated as 92 ug/ml (Figure 4-17, B). The experiment
was performed in triplicate.
B
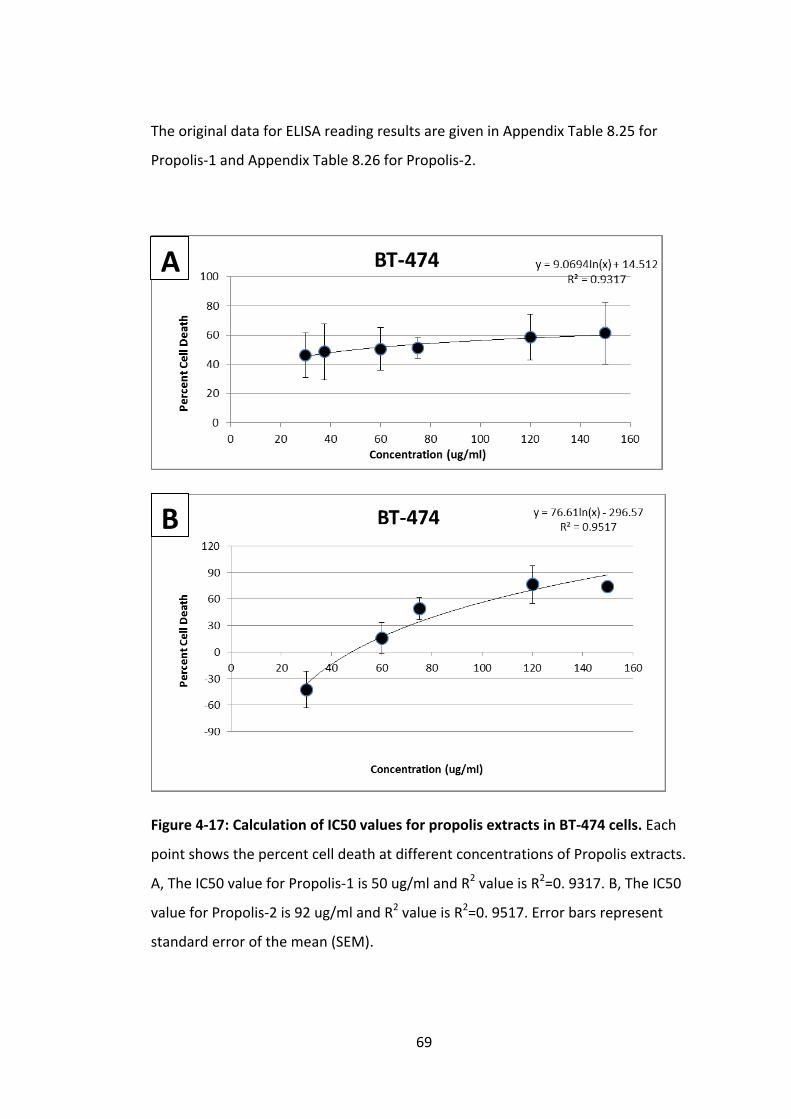
69
The original data for ELISA reading results are given in Appendix Table 8.25 for
Propolis-1 and Appendix Table 8.26 for Propolis-2.
Figure 4-17: Calculation of IC50 values for propolis extracts in BT-474 cells. Each
point shows the percent cell death at different concentrations of Propolis extracts.
A, The IC50 value for Propolis-1 is 50 ug/ml and R2 value is R2=0. 9317. B, The IC50
value for Propolis-2 is 92 ug/ml and R2 value is R2=0. 9517. Error bars represent
standard error of the mean (SEM).
A
B

70
IC50 Values of Propolis extracts for ZR-75-1 Cell line
Analysis of IC50 value of propolis extracts on ZR-75-1 was performed with following
conditions:
Propolis-1: 120-100-80-75-60-50 ug/ml, 5000 cells were used in each well. ZR-75-1
cell line’s IC50 value was calculated as 73 ug/ml (Figure 4-18, A). The experiment was
performed in quadruplicate.
Propolis-2: 120-100-60-50-30 ug/ml, 6000 cells were used in each well. ZR-75-1 cell
line’s IC50 value was calculated as 76 ug/ml (Figure 4-18, B). The experiment was
performed in triplicate.
The original data for ELISA reading results are given in Appendix Table 8.27 for
Propolis-1 and Appendix Table 8.28 for Propolis-2.
A

71
Figure 4-18: Calculation of IC50 values for propolis extracts in ZR-75-1 cells. Each
point shows the percent cell death at different concentrations of Propolis extracts.
A, The IC50 value for Propolis-1 is 73 ug/ml and R2 value is R2=0. 9423. B, The IC50
value for Propolis-2 is 76 ug/ml and R2 value is R2=0. 8916. Error bars represent
standard error of the mean (SEM).
IC50 Values of Propolis extracts for hTERT-HME-1 Cell line
Analysis of IC50 value of propolis extracts on hTERT-HME-1 was performed with
following conditions:
Propolis-1: 120-100-60-50-30 ug/ml, 6000 cells were used in each well. hTERT-HME-
1 cell line’s IC50 value was calculated as 41 ug/ml (Figure 4-19, A). The experiment
was performed in quadruplicate.
Propolis-2: 150-120-75-60-37.5 ug/ml, 6000 cells were used in each well. hTERT-
HME-1 cell line’s IC50 value was calculated as 114 ug/ml (Figure 4-19, B). The
experiment was performed in triplicate.
The original data for ELISA reading results are given in Appendix Table 8.29 for
Propolis-1 and Appendix Table 8.30 for Propolis-2.
B

72
Figure 4-19: Calculation of IC50 values for propolis extracts in hTERT-HME-1 cells.
Each point shows the percent cell death at different concentrations of Propolis
extracts. A, The IC50 value for Propolis-1 is 41 ug/ml and R2 value is R2=0. 8443. B,
The IC50 value for Propolis-2 is 114 ug/ml and R2 value is R2=0. 8783. Error bars
represent standard error of the mean (SEM).
A
B

73
4.3 Association of IC50 Values of Propolis extracts with
Properties of Breast Carcinoma Cell Lines
Previously calculated IC50 values of propolis extracts for breast carcinoma cell lines
were classified according to cell lines’ molecular properties (Table 4.5). Statistical
analysis was performed to analyze whether there is any correlation between IC50
values of propolis and the molecular status of cell line with Microsoft Excel program
by using T.TEST function. Student’s t-test was calculated with two-tailed distribution
and two-sample unequal variance. Fold change of propolis extracts was calculated
by dividing IC50 values of Propolis-2 extract to IC50 values of Propolis-1 extract(Figure
4-20 and Figure 4-21).
Table 4.5 Classification of Breast carcinoma cell lines According to Their Molecular
Status with IC50 Values of Propolis Extracts (Neve, 2006; Kao, 2009; Finn, 2009;
Holliday, 2011).
Cell Lines IC50 (ug/ml) Molecular Status of Cell Lines
Propolis-1
Propolis-2
Subtype Estrogen
Receptor (ER) Progesterone Receptor (PR)
HER2
BT-20 73 117 basal A negative negative normal
BT-474 50 92 luminal B positive positive amplified
CAMA-1 25 35 luminal positive negative normal
HCC-1937 123 119 basal A negative negative normal
hTERT-HME1 41 114 basal B negative n/a negative
MCF10A 45 72 basal B negative negative immortalized
MCF12A 35 45 basal B negative negative n/a
MCF7 41 61 luminal A positive positive normal
MDA-MB 231 26 74 basal B negative negative normal
MDA-MB-157 88 61 basal B negative negative normal
MDA-MB-361 51 57 luminal positive positive amplified
MDA-MB-453 47 53 luminal negative negative amplified
MDA-MB-468 30 26 basal A negative negative normal
T47D 36 43 luminal A positive positive normal
ZR-75-1 73 76 luminal B positive negative normal

74
Figure 4-20 Comparison of IC50 Values of Two Different Propolis Extracts on Breast
carcinoma cell lines
Figure 4-21 Fold change of IC50 values of two different propolis extracts on breast
carcinoma cell lines (p= 0,0016, IC50 values of Propolis-2 are significantly higher
than IC50 values of Propolis-1).

75
The result showed that IC50 values of Propolis-2 extract were significantly higher
than IC50 values of Propolis-1 extract among all cell lines. Pearson correlation was
also calculated and the resulted correlation was found as significant at the 0.05
level (2-tailed).
The calculated IC50 for each cell line was analyzed for the cell lines molecular
classification groups. Basal cell line group was compared to luminal cell lines to
analyze if there is any significant difference between the subgroups responding to
propolis extracts. The results showed that there is no significant correlation
between these two groups for any of the two extracts (Propolis-1, p=0.4 and
Propolis-2, p=0.2).
Figure 4-22 IC50 values of propolis extracts were used to analyze according to the
molecular subtypes of breast carcinoma cell lines. Basal cell line group was
compared to luminal cell line group for both Propolis-1 and Propolis-2 (Propolis-1,
p=0.4 and Propolis-2, p=0.2).

76
The calculated IC50 for each cell line was analyzed for ER status (positive/negative)
of the breast carcinoma cell lines. The results showed that there is no significant
correlation between these two groups for any of the two extracts (Propolis-1, p=0.4
and Propolis-2, p=0.3).
Figure 4-23 IC50 values of propolis extracts were used to analyzed according to the
ER status of breast carcinoma cell lines. ER positive cell line group was compared to
ER negative cell line group for both Propolis-1 and Propolis-2 (Propolis-1, p=0.4 and
Propolis-2, p=0.3).

77
The calculated IC50 for each cell line was analyzed for PR status (positive/negative)
of the cell lines. The results showed that there is no significant correlation between
these two groups for any of the two extracts (Propolis-1, p=0.3 and Propolis-2,
p=0.8).
Figure 4-24 IC50 values of propolis extracts were used to analyzed according to the
PR status of breast carcinoma cell lines. PR positive cell line group was compared
to PR negative cell line group for both Propolis-1 and Propolis-2 (Propolis-1, p=0.3
and Propolis-2, p=0.8).

78
The calculated IC50 for each cell line was analyzed for HER2 status
(normal/amplified) of the cell lines. The results showed that there is no significant
correlation between these two groups for any of the two extracts (Propolis-1, p=0.5
and Propolis-2, p=1.0).
Figure 4-25 IC50 values of propolis extracts were used to analyzed according to the
HER2 status of breast carcinoma cell lines. HER2 normal cell line group was
compared to HER2 amplified cell line group for both Propolis-1 and Propolis-2
(Propolis-1, p=0.5 and Propolis-2, p=1.0).

79
4.4 Dynamic Cell Proliferation of Propolis Treated Cells with
xCELLigence
The xCELLigence Systems allow for label-free and real-time monitoring of cellular
processes such as cell proliferation. The cell growth curves were automatically
recorded on the xCELLigence System in real time. IC50 value calculations were
restricted to the one time point whereas response to a treatment is dynamic
phenomena. Therefore observing the effect of propolis on growing cells (real-time)
is an important analysis. xCELLigence (Roche) system was used to monitor the
growing cells in real time. Dynamic monitoring of the logarithmic growth of the cells
was correlated with cell index (CI). Cells were inoculated to E plate 96 with indicated
cell numbers and experiments were performed in triplicate (Table 4.6). Cells were
monitored and measurements were collected every 10 minutes. When the cell
index reaches to 0,75 before it exceeds the cell index 1,20, cells were treated with
three different Propolis extract-2 concentrations (IC50 values, half and double of IC50
values of each cell line) and control DMSO. Then the measurements were collected
for every 30 min for minimum of 72 h. DMSO amount was adjusted in each
propolis-2 concentration to the same dilution so that only one control DMSO
dilution was used. The logarithmic growth of each cell line was given from Figure
4-26 to Figure 4-31.
Table 4.6 Starting Cell Numbers of Cell Lines for xCELLigence Monitoring
Cell Line Starting Cell Numbers
MCF10A 2000 cells/well
BT-474 4000 cells/well
T47D 2000 cells/well
BT-20 2000 cells/well
CAMA-1 4000 cells/well
MDA-MB-231 3000 cells/well

80
Figure 4-26 Dynamic monitoring of cell proliferation using the xCELLigence system
in MCF10A. MCF10A (IC50=72 ug/ml) cells treated with propolis-2 at 32.5 ug/ml, 65
ug/ml, and 130ug/ml concentrations and control DMSO. The arrow shows the time
point where the propolis-2 and DMSO were added to the cells.
Figure 4-27 Dynamic monitoring of cell proliferation using the xCELLigence system
in BT-474. BT-474 (IC50= 92 ug/ml) cells treated with propolis-2 at 47.5 ug/ml,
95ug/ml and 190ug/ml concentrations and control DMSO. The arrow shows the
time point where the propolis-2 and DMSO were added to the cells.

81
Figure 4-28 Dynamic monitoring of cell proliferation using the xCELLigence system
in T47D. T47D (IC50= 43 ug/ml) cells treated with propolis-2 at 20 ug/ml, 40ug/ml
and 80ug/ml concentrations and control DMSO. The arrow shows the time point
where the propolis-2 and DMSO were added to the cells.
Figure 4-29 Dynamic monitoring of cell proliferation using the xCELLigence system
in BT-20. BT-20 (IC50= 117 ug/ml) cells treated with propolis-2 at 55 ug/ml, 110
ug/ml and 220ug/ml concentrations and control DMSO. The arrow shows the time
point where the propolis-2 and DMSO were added to the cells.

82
Figure 4-30 Dynamic monitoring of cell proliferation using the xCELLigence system
in CAMA-1. CAMA-1 (IC50= 35 ug/ml) cells treated with propolis-2 at 17.5 ug/ml,
35ug/ml and 70ug/ml concentrations and control DMSO. The arrow shows the time
point where the propolis-2 and DMSO were added to the cells.
Figure 4-31 Dynamic monitoring of cell proliferation using the xCELLigence system
in MDA-MB-231. MDA-MB-231 (IC50= 74 ug/ml) cells treated with propolis-2 at 37.5
ug/ml, 75ug/ml and 150ug/ml concentrations and control DMSO. The arrow shows
the time point where the propolis-2 and DMSO were added to the cells.

83
Real Time Growth Curves of breast carcinoma cell lines with different
concentrations of propolis-2 were monitored by xCelligence system. The arrow
shows the time point where the propolis-2 and control DMSO were added to the
cells.
All the cell lines , except CAMA1, showed decrease in growth rate compare to only
DMSO treated cells. Increasing concentrations of propolis-2 was decreases the cell
number in a dose- and cell line- dependent way.
4.5 Propolis Induces Apoptosis on Breast Carcinoma Cell Lines
The observation of propolis anti-proliferative effect led us to evaluate its cellular
mechanism. To evaluate the anti-proliferative effects of propolis , the cell lines were
analyzed for cell death.
4.5.1 Morphology of the Cells Changes with Propolis Treatment
The cells were treated with propolis and their morphology was observed under the
light microscope. Morphological changes indicate apoptotic cell death. The effected
cells were changed their adherent morphology to round cells and after a few hours
later, those round cells were detached from the surface of the plate.
Breast carcinoma cell lines were cultured on 6 well plates as 80,000 cells/well. The
cells were treated with either 0.1 % DMSO or 100 ug/ml Propolis-2 after 24 hours.
The cells were observed under light microscope and photos were taken with 10X
magnification, 48 hours after the treatment (Figure 4-32).

84
A-1 ) MCF10A, DMSO A-2 ) MCF10A, Propolis
B-1 ) MDA-MB-231, DMSO B-2 ) MDA-MB-231, Propolis
C-1 ) T47D, DMSO C-2 ) T47D, Propolis

85
D-1 ) BT-20, DMSO D-2 ) BT-20, Propolis
E-1 ) BT-474, DMSO E-2 ) BT-474, Propolis
F-1 ) CAMA-1, DMSO, 10X F-2 ) CAMA-1, Propolis, 10X
Figure 4-32 The morphological appearance of treated cell lines under the light
microscope. The cells were treated with 100 ug/ml Propolis and 0.1% DMSO control

86
and the photos were taken after 48 h of treatment. MCF10A (A), MDA-MB-231 (B),
T47D (C), BT-20 (D), BT-474 (E), CAMA-1 (F), (10X magnification).
Cell death effect of propolis in cell lines were evaluated by treating cells with
propolis and the morphology of the cells were observed under light microscope.
The cell morphology changed after treatment. It was observed that the cells
become more round and the cell edges were sharper than control cells. The
increased number of round and detached cells were observed which made the
apoptosis as a suspected cell death mechanism.
4.5.2 Chromatin Condensation and Nuclear Fragmentation
To analyze the apoptosis the Propolis and DMSO treated cells were stained with
well-known nuclear dye Hoechst 33258 and common properties of apoptotic cells,
chromatin condensation and nuclear fragmentation, were observed.
The cells were seeded onto glass coverslips in 6 well plates as 80,000 cells/well and
24 hours later, cells were treated with either 0.1 % DMSO or 100 ug/ml Propolis-2.
Cells were stained with Hoechst 33258, 48 hours after the treatment. Photos were
taken under fluorescent microscope with 40X magnification (Figure 4-33).
Condensed chromatins were identified by their intense staining while normal cells
can be depicted with clear and uniformly dispersed nuclei. In DMSO control treated
cells, the nucleolus could be observed ( black dots in the cells) . White arrows in the
pictures indicate apoptotic cells with condensed chromatin and red circles indicate
the dividing cells. The bold white arrow in Figure 4-33, C-2 shows the nuclear
fragmented apoptotic cell.

87

88
Figure 4-33 Hoechst 33258 staining and morphological appearance of cell nucleus
after treatment. The MCF10A (A), MDA-MB-231 (B), T47D (C), BT-20 (D), CAMA-1
(E) cells were incubated with Propolis-2 with either 0.1% DMSO (1) or 100 ug/ml
Propolis-2 (2) for 48 h. Then the cells were stained with Hoechst 33258. Photos
were taken under the flourescent microscope with 40X magnification. Chromatin
condensations were indicated with arrows, red circles indicate dividing cells, and big
white arrow in C-2 shows the nuclear fragmented apoptotic cells.
The result showed that there is an increase in the number of apoptotic cells when
they were treated with propolis.

89
4.5.3 Western Blot Analysis of PARP-1 cleavage
The Poly (ADP-Ribose) Polymerase 1 (PARP-1) is an ADP-ribosylating enzyme
essential for initiating various forms of DNA repair. PARP-1, a 116 kDa nuclear
enzyme, is cleaved in fragments of 89 and 24 kDa during apoptosis. This cleavage
has become a useful hallmark of apoptosis. Western blot analysis was performed to
detect the PARP-1 cleavage in propolis treated cells. Cells were seeded on 6 well
plates as 80,000 cells/well and cells were treated with either 0.1 % DMSO or 100
ug/ml Propolis-2 after 24 hours. Cell pellets were collected after 48 hours of
treatment. Protein extraction was performed and 50 ug proteins were run in SDS-
PAGE. PARP-1 protein was detected in the membranes and β-actin was used as
equal loading control (Figure 4-37). The PARP-1 antibody can both target the full
length PARP-1 (116 kDa) as well as its cleaved fragment (89 kDa). The image photos
were analyzed with ImageJ software to obtain quantified, comparable data. Each
band’s intensity was quantified by using ImageJ to obtain numerical results of its
intensity. Each sample’s normalization was calculated by dividing its PARP-1 protein
band intensity to its β-actin protein band intensity (from Figure 4-38 to Figure 4-36).
Figure 4-34 Western blot analysis of PARP-1 cleavage in untreated and Adriamycin
treated breast carcinoma cell lines. Untreated cell lines (left), Adriamycin treated
(as a positive control) cells (right) were analysed for their PARP-1 protein cleavage.

90
Figure 4-35 Graphical representation of normalized data of PARP-1 band
intensities in untreated breast carcinoma cell lines. Each sample’s normalization
was calculated by dividing its full length PARP-1 protein (116 kDa) band intensity to
its β-actin protein (42 kDa) band intensity (left) and cleaved PARP-1 protein (89
kDa) band intensity to its β-actin protein (42 kDa) band intensity (right)(images from
Figure 4-34).
Figure 4-36 Graphical representation of normalized data of PARP-1 band
intensities in untreated and Adriamycin treated MDA-MB-231 cells. Each sample’s
normalization was calculated by dividing its full length PARP-1 protein (116 kDa)
band intensity to its β-actin protein (42 kDa) band intensity (left) and cleaved PARP-
1 protein (89 kDa) band intensity to its β-actin protein (42 kDa) band intensity
(right)(images from Figure 4-34).
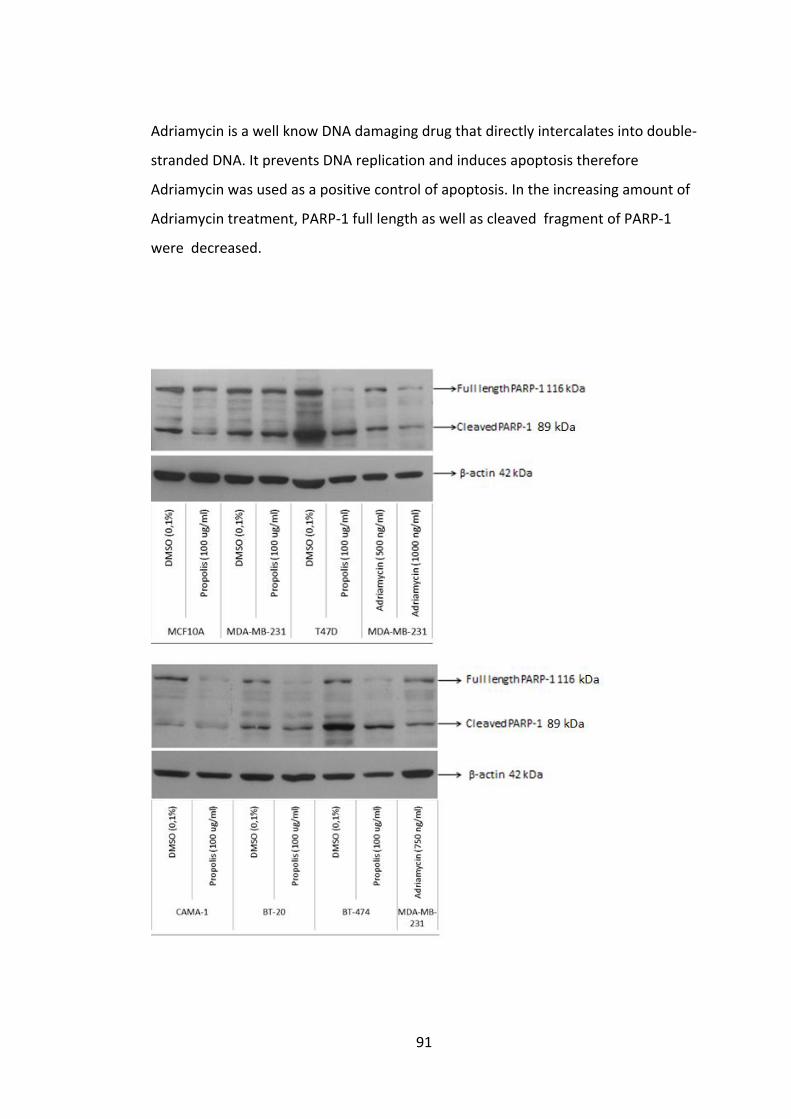
91
Adriamycin is a well know DNA damaging drug that directly intercalates into double-
stranded DNA. It prevents DNA replication and induces apoptosis therefore
Adriamycin was used as a positive control of apoptosis. In the increasing amount of
Adriamycin treatment, PARP-1 full length as well as cleaved fragment of PARP-1
were decreased.

92
Figure 4-37 Western blot analysis of PARP-1 cleavage in DMSO and Propolis-2
treated breast carcinoma cell lines. Adriamycin treated cells were analysed for
their PARP-1 protein cleavage as a positive control.
The propolis treated sample intensity was compared to DMSO control sample
intensity for PARP-1 changes after β-actin normalization.
Figure 4-38 Graphical representation of normalized data of full length PARP-1
band intensity in breast carcinoma cell lines. Each sample’s normalization was
calculated by dividing its full length PARP-1 protein (116 kDa) band intensity to its β-
actin protein (42 kDa) band intensity (images from Figure 4-37).

93
Figure 4-39 Graphical representation of normalized data of cleaved PARP-1 band
intensity in breast carcinoma cell lines. Each sample’s normalization was calculated
by dividing its cleaved fragment of PARP-1 protein (89 kDa) band intensity to its β-
actin protein (42 kDa) band intensity (images from Figure 4-37).
Decrease in the full length PARP-1 protein levels (except MDA-MB-231 cell line)
supports our hypothesis that propolis treated cells enter to apoptotic state.
Increase in the cleaved PARP-1 was observed only in MDA-MB-231 and BT-20 cell
lines. To analyze the relative effect of full length and cleaved PARP-1 protein levels,
another analysis was performed by calculating the intensity ratio of full length
PARP-1 and cleaved PARP-1 proteins. Since the analysis gave an expected result
with positive control samples (Figure 4-40), the same analysis was performed with
propolis and control DMSO treated cells ().
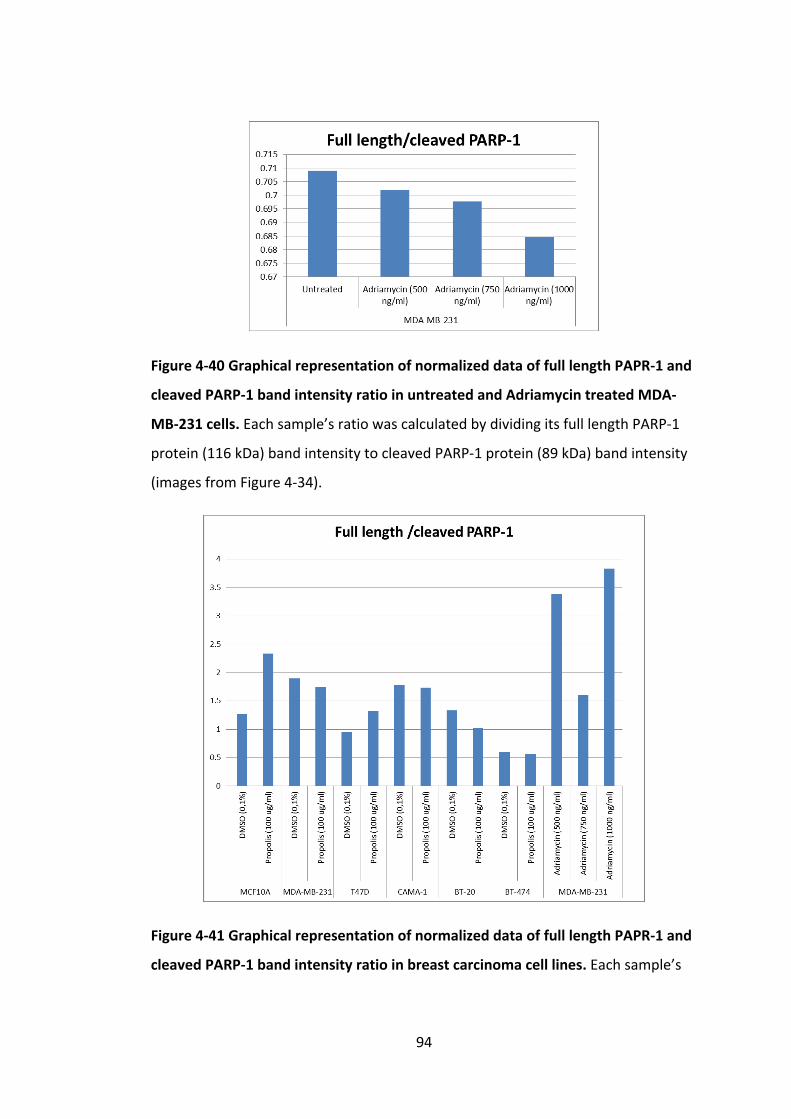
94
Figure 4-40 Graphical representation of normalized data of full length PAPR-1 and
cleaved PARP-1 band intensity ratio in untreated and Adriamycin treated MDA-
MB-231 cells. Each sample’s ratio was calculated by dividing its full length PARP-1
protein (116 kDa) band intensity to cleaved PARP-1 protein (89 kDa) band intensity
(images from Figure 4-34).
Figure 4-41 Graphical representation of normalized data of full length PAPR-1 and
cleaved PARP-1 band intensity ratio in breast carcinoma cell lines. Each sample’s

95
ratio was calculated by dividing its full length PARP-1 protein (116 kDa) band
intensity to cleaved PARP-1 protein (89 kDa) band intensity (images from Figure
4-37).
MDA-MB-231, CAMA-1, BT-20 and BT-474 cell lines were showed a decrease in the
ratio of full length PAPR-1 over cleaved PAPR-1 protein band intensity which
supports the apoptosis possibility of cell death mechanism.
4.6 Propolis Slightly Increases G2/M arrest of MDA-MB-231
Cells
The effect of propolis on cell cycle was analyzed with flow cytometer. MDA-MB-231
cells were seeded on 6 well plates (80,000 cells/well) and 24 hours later, cells were
treated with DMSO, 75 ug/ml Propolis-2 (IC50 value for this cell line), 250 ng/ ml
Adriamycin (as a positive control for G2/M arrest) or untreated (control for
Adriamycin treated cells) for 72 hours. Cell pellets were maintained and stained
with Propidium Iodide (PI) and stained cells were counted with flow cytometer.
Initially, the Adriamycin treated MDA-MB-231 cells were analyzed with flow
cytometer as a control experiment to observe cell cycle changes. The cells were
treated with Adriamycin for 72 hours (Figure 4-42).

96
Figure 4-42 Cell cycle analysis of untreated and Adriamycin treated MDA-MB-231
cell line with flow cytometer. Untreated cells (A) and Adriamycin treated cells (B).
The cell cycle phases were represented in the histogram as M1: Sub-G1; M2: G1;
M3: S; M4: G2/M.
A B

97
Figure 4-43 Graphical representation of cell cycle analysis of untreated and
Adriamycin treated MDA-MB-231 cell line. Data in Figure 4-42. was used to show
the cell cycle phase differences between untreated and Adriamycin treated cells.
It was observed that the Adriamycin treated cells were entered G2/M cell cycle
arrest. After this control experiment, the same analysis was performed with DMSO
and propolis treated MDA-MB-231 cells.

98
Figure 4-44 Cell cycle analysis of DMSO and propolis treated MDA-MB-231 cell line
with flow cytometer. DMSO treated cells (A) and Propolis-2 treated cells (B). The
cell cycle phases were represented in the histogram as M1: Sub-G1; M2: G1; M3: S;
M4: G2/M.
A B

99
Figure 4-45 Graphical representation of cell cycle analysis DMSO and propolis
treated MDA-MB-231 cell line. Data in Figure 4-44. was used to show the cell cycle
phase differences between DMSO and propolis treated cells.
Table 4.7 Percent gate comparison of untreated, DMSO, propolis and Adriamycin
treated MDA-MB-231 cell line for cell cycle analysis. Data was taken from Figure
4-42 an Figure 4-44.
% Gate Untreated DMSO Propolis Adriamycin
Sub-G1 0.65 0.49 1.18 1.36
G1 68.87 67.65 53.75 13.07
S 10.81 9.98 15.63 11.16
G2/M 19.99 21.28 27.49 72.4

100
Figure 4-46 Graphical representation of cell cycle analysis of untreated, DMSO,
propolis and Adriamycin treated MDA-MB-231 cell line. Data was taken from
Figure 4-42 an Figure 4-44.
Above analyses demonstrate that propolis treatment induces G2/M arrest of MDA-
MB-231 cell line.
4.7 Propolis Blocks Invasion of MDA-MB-231 Cells
The in vitro scratch assay (wound healing assay) is an easy, low-cost and well-
developed method to measure cell invasion in vitro. A straight line of cells are
scraped from the plate and the invasion of the cells through this scraped line is
observed via light microscope.
FBS concentration in the growth medium was dropped from 10 % to 0.1 % to
prevent cells growing through the scratch. By this way, wound healing assay can

101
display the invasion properties of cells but not the proliferation. There were 6
conditions for this set up to observe the invasion rate:
10 % FBS containing growth medium treated cells (untreated, mock cells) to
observe the effect of proliferation and compare it with 0.1 % FBS medium
treated cells,
0.1 % FBS containing growth medium treated cells to observe the effect of
decreased FBS and compare it with DMSO control cells,
0.1 % FBS + 0.1 % DMSO containing growth medium treated cells as a
control for propolis treated cells,
0.1 % FBS + 50, 75 (IC50 value propolis for MDA-MB-231 cells) and 100 ug/ml
Propolis-2 containing growth medium treated cells to see the effect of
gradually increasing concentrations of propolis on cell invasion ability.
Cells (500,000 cells/well) were seeded in 6 well plate to obtain high confluency and
24 hours later, scratches were made with a 200 ul micropipette tip. Cells were
washed with 1X PBS twice to get rid of cell debris in the medium and then cells
were treated with the growth mediums listed above. Right after the scratches were
performed, time zero photos were taken to observe the scratches borders clearly.
Then, the photos were taken at 6, 12, 24, 36 and 48 h intervals under the light
microscope with 10X magnification.
As shown in Figure 4-47, cells treated with propolis shows decreased invasion rate
of the cells to the denuded area when compared to the DMSO control cells.

102
EMPTY PAGE
Figure 4-47 Light microscope image to evaluate wound healing in vitro in the
scratch assay using a confluent monolayer of MDA-MB-231 Cells. Cell migration
into the wound was observed in response to an artificial injury of the cells.

103
5 Discussion
The aim of this study was to evaluate the organic compound propolis effect on
cancer cells. We are interested in the effects of propolis on cell growth in human
cancer cells, as predictors of novel agents that may be useful in cancer
chemoprevention or therapy. In recent years, it has been shown that propolis have
antiviral, antimicrobial and antifungal and anti-carcinogenic activity (Sun, 2012).
Propolis is a resinous material gathered by honeybees from the buds, leaf and bark
of certain trees and plants. It is claimed to improve human health and prevent
diseases, such as diabetes, inflammation and cancer (Viuda-Martos, 2008). There
are many studies conducted on propolis or its active components for treatment of
cancer which reveals the potential of this biological compound in the development
of novel anti-cancerous agents (Markiewicz-Zukowska, 2013). Chemical analysis
indicated that propolis is a multicomponent mixture of various compounds with
prevalence of flavonoids and phenolic acids. Therefore it is important to investigate
the propolis extract mechanisms of action in order to predict possible toxic and may
be therapeutic effects. The information may help us to develop new drugs that are
even more effective for the prevention and treatment of cancer.
In this study, the inhibitory effects of propolis collected from different regions of
Turkey were analyzed on the growth of the human breast carcinoma cells. Two
different extracts of propolis used in this study were provided by Prof. Dr. Orhan
Deger at Karadeniz Technical University, Medical Biology Department. The propolis
was extracted and diluted in DMSO and added to the cultures.
Initial experiments to evaluate the effect of propolis on cancer cells was analyzed
with low concentrations (100-2000 ng/ml). The low concentrations did not show

104
any significant effect on cancer cells. One of the reasons can be the very low cell
number of the living cells at the end of incubation period. However, the studies
conducted so far show that propolis from different regions of the world are
cytotoxic to cancer cells for different specific isolates of the extract with differing
concentrations. Therefore, the analysis was repeated with higher concentrations of
propolis and the result was promising. After the most effective incubation period
was determined as 72 hours, the following experiments were conducted with 72
hour incubation. The starting analysis was done with hepatocellular carcinoma cells,
lung cancer cells, breast cancer cells as well as normal breast cell line and higher
concentrations (25-50-75 ug/ml) of propolis were found to be significantly
increasing the cell death among cancer cell lines. However, we decided to focus on
one cancer type, breast cancer, to carry on further analysis.
The first step of screening was performed with breast carcinoma cell line panel by
calculating the IC50 values of propolis on each breast carcinoma cell line. The
resulting IC50 values of 15 breast carcinoma cell lines for Propolis-1 extract were
found to be ranging from 25 ug/ml to 123 ug/ml. Since propolis is a biological
compound, a new propolis extract (Propolis-2) was also screened with the same
breast carcinoma cell line panel by calculating the IC50 values to confirm that the
effect of propolis. In this case, IC50 values of those breast carcinoma cell lines for
Propolis-2 extract were found to be ranging from 26 ug/ml to 119 ug/ml. We
concluded that propolis is cytotoxic to breast cancer cells with dose-dependent
manner.
Student’s t-test and Pearson correlation analyses show that there is significant
increase in the IC50 values of Propolis-2 extract on breast carcinoma cell lines when
compared with the IC50 values of Propolis-1 extract. This result may stem from the
nature of a biological compound which can display fluctuating results according to
the different propolis collections. Since propolis is a mixture of many compounds,
plants that bees collect the propolis from may influence the effects on composition
of propolis. Even the season that propolis collected in has an effect on active

105
components of propolis (Barlak, 2011). Because of these reasons, having different
results from different extracts of a biological compound is inevitable.
Another statistical analysis was processed to assess the possible correlation
between molecular properties of different breast carcinoma cell lines and their IC50
values for propolis extracts. Student’s t-test results show that there is no significant
correlation between subtypes of breast carcinoma cell lines and IC50 values of
propolis extracts. ER status as well as PR status and HER2 status of breast carcinoma
cell lines do not result in a significant correlation with IC50 values of propolis
extracts. We concluded that there is not a significant correlation between the
cytotoxic effect of propolis extracts with different molecular properties of breast
carcinoma cell lines.
xCELLigence analysis is a powerful method to show the effect of drug on living cells.
In this study, real time monitoring was a confirmative assay to show the effect of
propolis on breast carcinoma cell lines. xCELLigence analysis shows the effect of
propolis on cells in a short time intervals whereas SRB experiments can be
performed only one particular time point. Results support the cytotoxicity of
propolis on breast carcinoma cells. We could see the gradual decrease in the cell
number as the concentration of propolis increases. Lower concentration of propolis
behaves similar to control treatments however high concentrations of propolis
almost kill all the cells after 72-100 hours. Also SRB measurements were correlated
with this experiment. Other than T47D and CAMA-1 cell lines, the result showed
that IC50 calculations had a similar effect on both SRB staining and xCELLigence
experiments. This data reveals that propolis has cytotoxic effects on breast
carcinoma cells and this effect is dose- and time- dependent.
Induction of apoptosis in cancer cells is an important mechanism to eliminate the
cancer cells. Since propolis extracts were toxic to the carcinoma cells, we evaluated
the apoptosis effect of propolis in cell lines. To reveal if propolis effects apoptosis
the cells were treated with the compound and the morphology of the cells were

106
first evaluated under light microscope and then stained with Hoechst, evaluated
under fluorescence microscope. The cell morphology changed after treatment. It
was observed that the cells become more round and the cell edges were sharper
than control cells. The increased number of round and detached cells were
observed. The Hoechst staining was performed to evaluate this observation. The
staining results showed chromatin condensation and partial nuclear fragmentation
in some cells. These data strengthen the hypothesis that Turkish propolis cytotoxic
effect resulted with cell death through apoptosis.
To further support this hypothesis, PARP-1 protein cleavage was investigated with
western blot analysis. PAPR-1 is a well-known marker protein for apoptosis. The
cleavage of PARP-1 into 89 kDa and 24 kDa fragments is another reliable marker of
apoptotic cells (Chaitanya, 2010). Adriamycin was used as a positive control of
apoptosis (Bilim, 1997). The Western blot results reveal that majority of the breast
carcinoma cell lines had less amount of full length PARP-1 protein when treated
with propolis than DMSO. The decrease in full length PARP-1 protein amount in
propolis treated cells indicates the apoptosis was taken place in the cells. However
we could not see a significant increase in the apoptotic 89 kDa PARP-1 fragment
when compared with control cells. Therefore further analysis are required to
confirm the cell western blot analysis. Caspase-3 or 7 activities can be detected or
other apoptotic markers can be analyzed. Also to eliminate the necrosis as a cell
death another PARP-1 western blot analysis can be done with a different antibody
which can recognize the 50 kDa fragment of PARP-1 protein which is associated
with necrosis (Buontempo, 2010). Although increase in the amount 89 kDa cleaved
protein was not clearly observed in propolis treated cells, observation of decrease
in the full length PARP-1 protein after treatment shows that apoptosis takes place in
these cell lines. Another analysis which compares the ratio of full length PAPR-1
over cleaved PARP-1 protein band intensity showed a better result for supporting
the apoptosis. MDA-MB-231, CAMA-1, BT-20 and BT-474 cell lines were found to
have decreased ratio of full length PAPR-1 over cleaved PARP-1 protein band

107
intensity which combines the expected result of decrease in the full length PAPR-1
band intensity while increase in the cleaved PAPR-1 band intensity.
The effect of propolis on cell cycle was also analyzed by flow cytometer. In this
assay Adriamycin treated cells were used as a positive control for G2/M arrest
(Bilim, 2000). The cell cycle analysis with Propidium iodide (PI) staining of propolis
treated cells showed that the cells enter cell cycle arrest in G2/M phase. When the
results were compared, increase in the propolis treated cells’ G2/M arrest was not
as dramatic as Adriamycin effect. Therefore we can conclude that propolis slightly
increases the number of cells stuck in the G2/M phase.
Previously CAPE was showed as an inhibitor of invasion in hepatocellular carcinoma
(Jin, 2005). We used scratch assay to see the effect of propolis on breast cancer
cells. Scratch assay was an easy but informative assay to analyze the effect of
propolis on invasion property of breast cancer cells. For this experiment one of the
most invasive breast cancer cell, MDA-MB-231 was chosen. When treated with
higher concentrations of propolis, cells could not invade the scratched area while
DMSO treated cells could fill up the scratched area within 2 days. Since we dropped
the serum concentration in the growth media, we can say that invasion of the
control samples are not due to the reproduction of existing cells but the invasion of
the neighboring cells. This assay is a strong evidence to show the ability of propolis
to block the invasion on breast carcinoma cell lines.
In conclusion, propolis showed a cytotoxic effect on breast carcinoma cell lines by
inducing apoptosis, G2/M arrest as well as delaying the invasion capacity of the cells
which makes it a potent anti-tumorigenic compound that may be useful in cancer
chemoprevention or therapy.

108
6 Future Perspectives
We are interested in the effects of propolis on cell growth in human cancer cells, as
predictors of novel agents that may be useful in cancer chemoprevention or
therapy. Anti-proliferative activity of DMSO and water extracts of Turkish propolis
was previously demonstrated with prostate cancer cell lines (Barlak, 2011). In this
study, we showed that DMSO extracts of Turkish propolis has an anti-proliferative
activity on breast carcinoma cell lines. Effects of Turkish propolis can be
investigated in other cancer types such as hepatocellular carcinoma and lung
carcinoma which we have preliminary data that shows cytotoxic effect.
Propolis and its polyphenols target TRAIL-induced apoptosis signaling pathway in
tumor cells and sensitizes the TRAIL-resistant cancer cells (Szliszka, 2013).
Therefore, more comprehensive study on apoptosis pathway that propolis induce
can be designed to reveal the molecular mechanism behind the cytotoxic effect of
propolis on carcinoma cells. We showed that DMSO extracts of Turkish propolis
increase the apoptosis rate in breast carcinoma cells however the responsible
apoptosis pathway is yet to be unknown. The activity of caspases (caspase3 and 7)
and other apoptotic molecules on propolis treated carcinoma cells is required to be
analyzed.
To eliminate the necrosis as a cell death another PARP-1 western blot analysis can
be done with a different antibody which can recognize the 50 kDa fragment of
PARP-1 protein which is associated with necrosis (Buontempo, 2010). To eliminate
the senescence as a cell death, senescence β-Galactosidase staining can be
performed to propolis treated cells.
Due to the technical problems, we performed the cell cycle analysis of only one cell
line (MDA-MB-231). The following experiments are required to analyze the effects
of propolis on cell cycle with remaining breast carcinoma cell lines. Flow cytometer
can be used for both PI staining which is used for cell cycle analysis and Annexin-V

109
staining for apoptosis detection. Therefore, Annexin-V staining can be performed to
confirm the apoptotic cell death of propolis treated cell lines.
To confirm the scratch assay results, matrigel assay can be performed so that
prevention of invasion can be proved. In addition, epithelial to mesenchymal
transition (EMT) markers (vimentin as mesenchymal and E-cadherin as an epithelial
marker) can be detected with immunofluorescence method to analyze the effect of
propolis on EMT.
Anti-proliferative activities of CAPE and Chrysin are not always based on similar
mechanisms as whole propolis extract was revealed by Sawicka et. al. in 2012.
Therefore, chemical analysis of propolis compound can be performed and the active
components of the propolis extract can be studied separately or in combinations to
see the individual effects of chemicals in propolis. We also believe in the synergistic
effects of individual compounds, depending on their concentrations. For example,
CAPE is an effective adjuvant by targeting Akt signaling in advanced prostate cancer.
CAPE treatment reduces the dosage of chemotherapeutic agents required therefore
it can be used as a potential adjuvant therapy since it is a safe, natural product (Liu,
2013). The resulting active components of Turkish propolis can be investigated in
synergistic effects with existing chemotherapeutic agents.
Protective role of flavonoids in propolis were demonstrated on rats to reduce the
toxicity as an adjuvant to chemotherapeutic agents (Padmavathi, 2006). According
to this study, there are strong evidences for propolis being a cytotoxic material so
that animal cancer models can be treated with Turkish propolis to see the effects on
healing. Clinical studies to substantiate these results can help to show the beneficial
effects of Turkish propolis since little information is available concerning propolis
efficiency clinically. Pharmacological variability of preparations is expected, but
biological properties of propolis could be linked to its chemical composition and to
its botanical sources (Sforcin, 2011). If Turkish propolis is standardized based on
most important active constituents, it can be subjected to clinical trials.

110
7 References
Akyol, Sumeyya et al... “The Potential Usage of Caffeic Acid Phenethyl Ester (CAPE)
Against Chemotherapy-induced and Radiotherapy-induced Toxicity.” Cell
biochemistry and function 30.5 (2012): 438–443. NCBI PubMed. Web.
Albukhari, Ashwag A et al... “Caffeic Acid Phenethyl Ester Protects Against
Tamoxifen-induced Hepatotoxicity in Rats.” Food and chemical toxicology:
an international journal published for the British Industrial Biological
Research Association 47.7 (2009): 1689–1695. NCBI PubMed. Web.
Aliyazicioglu, Yuksel et al... “Effects of Turkish Pollen and Propolis Extracts on
Respiratory Burst for K-562 Cell Lines.” International immunopharmacology
5.11 (2005): 1652–1657. NCBI PubMed. Web.
Ashry, El Sayed H El, and Tarek A Ahmad. “The Use of Propolis as Vaccine’s
Adjuvant.” Vaccine 31.1 (2012): 31–39. NCBI PubMed. Web.
Bankova, Vassya. “Chemical Diversity of Propolis and the Problem of
Standardization.” Journal of ethnopharmacology 100.1-2 (2005): 114–117.
NCBI PubMed. Web.
Banskota, A H, Y Tezuka, and S Kadota. “Recent Progress in Pharmacological
Research of Propolis.” Phytotherapy research: PTR 15.7 (2001): 561–571.
Print.
Barlak, Yaşam et al... “Effect of Turkish Propolis Extracts on Proteome of Prostate
Cancer Cell Line.” Proteome science 9 (2011): 74. NCBI PubMed. Web.
Bilim, V et al... “Adriamycin Induced G2/M Cell Cycle Arrest in Transitional Cell
Cancer Cells with Wt P53 and p21(WAF1/CIP1) Genes.” Journal of
experimental & clinical cancer research: CR 19.4 (2000): 483–488. Print.
Bilim, V N et al... “Adriamycin (ADM) Induced Apoptosis in Transitional Cell Cancer
(TCC) Cell Lines Accompanied by P21 WAF1/CIP1 Induction.” Apoptosis: an
international journal on programmed cell death 2.2 (1997): 207–213. Print.
111
Buontempo, Francesca et al... “Inhibition of Akt Signaling in Hepatoma Cells Induces
Apoptotic Cell Death Independent of Akt Activation Status.” Investigational
new drugs 29.6 (2011): 1303–1313. NCBI PubMed. Web.
<http://www.cancer.org/> 2013. American Cancer Society, Inc.
Cai, Wai-Jiao et al... “Icariin and Its Derivative Icariside II Extend Healthspan via
insulin/IGF-1 Pathway in C. Elegans.” PloS one 6.12 (2011): e28835. NCBI
PubMed. Web.
Castaldo, Stefano, and Francesco Capasso. “Propolis, an Old Remedy Used in
Modern Medicine.” Fitoterapia 73 Suppl 1 (2002): S1–6. Print.
Chaitanya, Ganta Vijay, Alexander J Steven, and Phanithi Prakash Babu. “PARP-1
Cleavage Fragments: Signatures of Cell-death Proteases in
Neurodegeneration.” Cell communication and signaling: CCS 8 (2010): 31.
NCBI PubMed. Web.
Chen, Ming-Jen et al... “Caffeic Acid Phenethyl Ester Inhibits Epithelial-mesenchymal
Transition of Human Pancreatic Cancer Cells.” Evidence-based
complementary and alternative medicine: eCAM 2013 (2013): 270906. NCBI
PubMed. Web.
Clarke, P G H, and S Clarke. “Nineteenth Century Research on Cell Death.”
Experimental oncology 34.3 (2012): 139–145. Print.
Dawson, Sarah-Jane et al... “A New Genome-driven Integrated Classification of
Breast Cancer and Its Implications.” The EMBO journal 32.5 (2013): 617–628.
NCBI PubMed. Web.
Finn, Richard S et al... “PD 0332991, a Selective Cyclin D Kinase 4/6 Inhibitor,
Preferentially Inhibits Proliferation of Luminal Estrogen Receptor-positive
Human Breast carcinoma cell lines in Vitro.” Breast cancer research: BCR
11.5 (2009): R77. NCBI PubMed. Web.
Grange, J M, and R W Davey. “Antibacterial Properties of Propolis (bee Glue).”
Journal of the Royal Society of Medicine 83.3 (1990): 159–160. Print.

112
Harness, Jay K, Thomas S Vetter, and Arthur H Salibian. “Areola and Nipple-areola-
sparing Mastectomy for Breast Cancer Treatment and Risk Reduction:
Report of an Initial Experience in a Community Hospital Setting.” Annals of
surgical oncology 18.4 (2011): 917–922. NCBI PubMed. Web.
Holliday, Deborah L, and Valerie Speirs. “Choosing the Right Cell Line for Breast
Cancer Research.” Breast cancer research: BCR 13.4 (2011): 215. NCBI
PubMed. Web.
Huang, Wei-Jan et al... “NBM-HD-1: A Novel Histone Deacetylase Inhibitor with
Anticancer Activity.” Evidence-based complementary and alternative
medicine: eCAM 2012 (2012): 781417. NCBI PubMed. Web.
Jin, Un-Ho et al... “Caffeic Acid Phenyl Ester in Propolis Is a Strong Inhibitor of
Matrix Metalloproteinase-9 and Invasion Inhibitor: Isolation and
Identification.” Clinica chimica acta; international journal of clinical
chemistry 362.1-2 (2005): 57–64. NCBI PubMed. Web.
Kao, Jessica et al... “Molecular Profiling of Breast carcinoma cell lines Defines
Relevant Tumor Models and Provides a Resource for Cancer Gene
Discovery.” PloS one 4.7 (2009): e6146. NCBI PubMed. Web.
Khalil, Mahmoud Lotfy. “Biological Activity of Bee Propolis in Health and Disease.”
Asian Pacific journal of cancer prevention: APJCP 7.1 (2006): 22–31. Print.
Liao, Hui-Fen et al... “Inhibitory Effect of Caffeic Acid Phenethyl Ester on
Angiogenesis, Tumor Invasion, and Metastasis.” Journal of agricultural and
food chemistry 51.27 (2003): 7907–7912. NCBI PubMed. Web.
Markiewicz-Żukowska, Renata et al... “Propolis Changes the Anticancer Activity of
Temozolomide in U87MG Human Glioblastoma Cell Line.” BMC
complementary and alternative medicine 13 (2013): 50. NCBI PubMed. Web.
McMullen, Catherine M. "Taxus brevifolia photo." Department of Natural Resource
Ecology and Management, Iowa State University; 06.08.2013. Web.
<http://www.nrem.iastate.edu/class/for356/species/Taxus_brevifolia.html>
Monzote, Lianet et al... “In Vitro Antimicrobial Assessment of Cuban Propolis
Extracts.” Memórias do Instituto Oswaldo Cruz 107.8 (2012): 978–984. Print.

113
Nagata, Shigekazu. "Apoptosis by Death Factor." Cell; Volume 88, 355-365; 1997.
Neve, Richard M et al... “A Collection of Breast carcinoma cell lines for the Study of
Functionally Distinct Cancer Subtypes.” Cancer cell 10.6 (2006): 515–527.
NCBI PubMed. Web.
Nowsheen, S, and E S Yang. “The Intersection Between DNA Damage Response and
Cell Death Pathways.” Experimental oncology 34.3 (2012): 243–254. Print.
Omene, Coral O, Jing Wu, and Krystyna Frenkel. “Caffeic Acid Phenethyl Ester
(CAPE) Derived from Propolis, a Honeybee Product, Inhibits Growth of
Breast Cancer Stem Cells.” Investigational new drugs 30.4 (2012): 1279–
1288. NCBI PubMed. Web.
Ouyang, L et al... “Programmed Cell Death Pathways in Cancer: a Review of
Apoptosis, Autophagy and Programmed Necrosis.” Cell proliferation 45.6
(2012): 487–498. NCBI PubMed. Web.
Padmavathi, Radhakrishnan et al... “Therapeutic Effect of Paclitaxel and Propolis on
Lipid Peroxidation and Antioxidant System in 7,12 Dimethyl
Benz(a)anthracene-induced Breast Cancer in Female Sprague Dawley Rats.”
Life sciences 78.24 (2006): 2820–2825. NCBI PubMed. Web.
Perou, C M et al... “Molecular Portraits of Human Breast Tumours.” Nature
406.6797 (2000): 747–752. NCBI PubMed. Web.
Salatino, Antonio et al... “Propolis Research and the Chemistry of Plant Products.”
Natural product reports 28.5 (2011): 925–936. NCBI PubMed. Web.
Sawicka, Diana et al.. “The Anticancer Activity of Propolis.” Folia histochemica et
cytobiologica / Polish Academy of Sciences, Polish Histochemical and
Cytochemical Society 50.1 (2012): 25–37. NCBI PubMed. Web.
Sforcin, J M. “Propolis and the Immune System: a Review.” Journal of
ethnopharmacology 113.1 (2007): 1–14. NCBI PubMed. Web.
Sforcin, José Maurício, and Vassya Bankova. “Propolis: Is There a Potential for the
Development of New Drugs?” Journal of ethnopharmacology 133.2 (2011):
253–260. NCBI PubMed. Web.

114
Silici, Sibel, and Semiramis Kutluca. “Chemical Composition and Antibacterial
Activity of Propolis Collected by Three Different Races of Honeybees in the
Same Region.” Journal of ethnopharmacology 99.1 (2005): 69–73. NCBI
PubMed. Web.
Sorlie, Therese et al.. “Repeated Observation of Breast Tumor Subtypes in
Independent Gene Expression Data Sets.” Proceedings of the National
Academy of Sciences of the United States of America 100.14 (2003): 8418–
8423. NCBI PubMed. Web.
Stevens, J B et al.. “Heterogeneity of Cell Death.” Cytogenetic and genome research
139.3 (2013): 164–173. NCBI PubMed. Web.
Sun, Li-Ping et al.. “Chrysin: a Histone Deacetylase 8 Inhibitor with Anticancer
Activity and a Suitable Candidate for the Standardization of Chinese
Propolis.” Journal of agricultural and food chemistry 60.47 (2012): 11748–
11758. NCBI PubMed. Web.
Szliszka, Ewelina, and Wojciech Krol. “Polyphenols Isolated from Propolis Augment
TRAIL-Induced Apoptosis in Cancer Cells.” Evidence-based complementary
and alternative medicine: eCAM 2013 (2013): 731940. NCBI PubMed. Web.
Thirugnanasampandan, R, Sayana Beena Raveendran, and R Jayakumar. “Analysis of
Chemical Composition and Bioactive Property Evaluation of Indian Propolis.”
Asian Pacific journal of tropical biomedicine 2.8 (2012): 651–654. NCBI
PubMed. Web.
Viuda-Martos, M et al.. “Functional Properties of Honey, Propolis, and Royal Jelly.”
Journal of food science 73.9 (2008): R117–124. NCBI PubMed. Web.
Watanabe, Maria Angélica Ehara et al.. “Cytotoxic Constituents of Propolis Inducing
Anticancer Effects: a Review.” The Journal of pharmacy and pharmacology
63.11 (2011): 1378–1386. NCBI PubMed. Web.
Whitacre, C M et al.. “Detection of poly(ADP-ribose) Polymerase Cleavage in
Response to Treatment with Topoisomerase I Inhibitors: a Potential
Surrogate End Point to Assess Treatment Effectiveness.” Clinical cancer

115
research: an official journal of the American Association for Cancer Research
5.3 (1999): 665–672. Print.
Yari Khosroushahi, Ahmad, Hossein Naderi-Manesh, and Henrik Toft Simonsen.
“Effect of Antioxidants and Carbohydrates in Callus Cultures of Taxus
Brevifolia: Evaluation of Browning, Callus Growth, Total Phenolics and
Paclitaxel Production.” BioImpacts: BI 1.1 (2011): 37–45. NCBI PubMed.
Web.
Yoder, Brian J, Edward J Wilkinson, and Nicole A Massoll. “Molecular and
Morphologic Distinctions Between Infiltrating Ductal and Lobular Carcinoma
of the Breast.” The breast journal 13.2 (2007): 172–179. NCBI PubMed. Web.

116
8 Appendix
8.1 IC50 Analysis of Propolis
Table 8.1: The ELISA reading results of MCF10A cell numbers when treated with
Propolis-1 and DMSO. Percent cell death and IC50 value were calculated according
to this data.
MCF10A Concentration (ug/ml)
Propolis-1 100 50 25 12.5 6.125
Set 1 0.003 0.448 1.161 1.692 1.415
Set 2 -0.002 1.018 1.859 2.192 1.729
Set 3 0.019 0.751 1.687 2.302 2.282
AVERAGE 0.007 0.739 1.569 2.062 1.809
SEM 0.006 0.165 0.21 0.188 0.253
MCF10A Concentration (ug/ml)
DMSO 100 50 25 12.5 6.125
Set 1 0.858 1.288 1.505 1.824 1.812
Set 2 0.904 1.367 1.672 1.829 1.925
Set 3 0.757 1.388 1.789 2.184 1.801
AVERAGE 0.84 1.348 1.655 1.946 1.846
SEM 0.043 0.03 0.082 0.119 0.04
Percent Cell Death
Concentration (ug/ml)
100 50 25 12.5 6.125
Set 1 99.65 65.217 22.857 7.237 21.909
Set 2 100.221 25.53 -11.184 -19.847 10.182
Set 3 97.49 45.893 5.702 -5.403 -26.707
AVERAGE 99.167 45.178 5.196 -5.961 2.004
SEM 0.679 9.356 8.025 6.388 11.96
y-int -83.773
slope 35.115 IC50 45 ug/ml
R2 0.78

117
Table 8.2: The ELISA reading results of MCF10A cell numbers when treated with
Propolis-2 and DMSO. Percent cell death and IC50 value were calculated according
to this data.
MCF10A Concentration (ug/ml)
Propolis-2 200 150 100 75 37.5
Set 1 0.103 0.109 0.246 0.327 0.406
Set 2 0.147 0.197 0.492 0.687 0.747
Set 3 0.101 0.169 0.376 0.418 0.653
AVERAGE 0.117 0.158 0.371 0.477 0.602
SEM 0.015 0.026 0.071 0.108 0.102
MCF10A Concentration (ug/ml)
DMSO 200 150 100 75 37.5
Set 1 0.329 0.584 0.786 0.959 0.923
Set 2 0.349 0.766 1.16 0.913 1.075
Set 3 0.397 0.47 0.913 0.91 0.713
AVERAGE 0.358 0.607 0.953 0.927 0.904
SEM 0.02 0.086 0.11 0.016 0.105
Percent Cell Death
Concentration (ug/ml)
200 150 100 75 37.5
Set 1 68.693 81.336 68.702 65.902 56.013
Set 2 57.88 74.282 57.586 24.754 30.512
Set 3 74.559 64.043 58.817 54.066 8.415
AVERAGE 67.318 73.97 61.07 48.544 33.407
SEM 3.989 4.105 2.878 9.986 11.24
y-int -50.593
slope 23.507 IC50 72 ug/ml
R2 0.9

118
Table 8.3: The ELISA reading results of MCF12A cell numbers when treated with
Propolis-1 and DMSO. Percent cell death and IC50 value were calculated according
to this data.
MCF12A Concentration (ug/ml)
Propolis-1 100 80 50 40 25 12.5
Set 1 0.006 0.034 0.203 0.022 0.073 0.529
Set 2 0.096 0.19 0.526 0.298 0.373 0.641
Set 3 0.021 0.189 0.332 0.466 0.615 0.707
Set 4 0.012 0.149 0.478 0.308 0.743 0.707
AVERAGE 0.034 0.141 0.385 0.274 0.451 0.646
SEM 0.021 0.037 0.073 0.092 0.148 0.042
MCF12A Concentration (ug/ml)
DMSO 100 80 50 40 25 12.5
Set 1 0.404 0.807 0.326 0.922 0.725 0.394
Set 2 0.661 0.851 0.64 0.836 0.927 0.88
Set 3 0.313 0.67 0.724 0.741 0.806 0.905
Set 4 0.322 0.4 0.815 0.58 0.682 0.935
AVERAGE 0.425 0.682 0.626 0.77 0.785 0.779
SEM 0.081 0.102 0.106 0.073 0.054 0.129
Percent Cell Death
Concentration (ug/ml)
100 80 50 40 25 12.5
Set 1 98.515 95.787 37.73 97.614 89.931 -34.264
Set 2 85.477 77.673 17.813 64.354 59.763 27.159
Set 3 93.291 71.791 54.144 37.112 23.697 21.878
Set 4 96.273 62.75 41.35 46.897 -8.944 24.385
AVERAGE 92 79.326 38.498 64.416 42.548 17.073
SEM 2.484 6.062 6.517 11.53 18.611 12.855
y-int -67.185
slope 33 IC50 35 ug/ml
R2 0.82

119
Table 8.4: The ELISA reading results of MCF12A cell numbers when treated with
Propolis-2 and DMSO. Percent cell death and IC50 value were calculated according
to this data.
MCF12A Concentration (ug/ml)
Propolis-2 37.5 50 75 100 150 200
Set 1 0.06 0.068 0.05 0.058 0.027 0.007
Set 2 0.174 0.235 0.144 0.107 0.044 0.038
Set 3 0.265 0.288 0.263 0.183 0.069 0.049
Set 4 0.285 0.304 0.216 0.155 0.089 0.049
AVERAGE 0.196 0.224 0.168 0.126 0.057 0.036
SEM 0.051 0.054 0.046 0.027 0.014 0.01
MCF12A Concentration (ug/ml)
DMSO 37.5 50 75 100 150 200
Set 1 0.173 0.169 0.193 0.193 0.143 0.113
Set 2 0.413 0.338 0.367 0.268 0.319 0.115
Set 3 0.45 0.466 0.412 0.339 0.487 0.168
Set 4 0.554 0.601 0.771 0.921 0.489 0.179
AVERAGE 0.398 0.394 0.436 0.43 0.36 0.144
SEM 0.081 0.092 0.121 0.166 0.082 0.017
Percent Cell Death
Concentration (ug/ml)
37.5 50 75 100 150 200
Set 1 65.318 59.763 74.093 69.948 81.119 93.805
Set 2 57.869 30.473 60.763 60.075 86.207 66.957
Set 3 41.111 38.197 36.165 46.018 85.832 70.833
Set 4 48.556 49.418 71.984 83.17 81.8 72.626
AVERAGE 50.754 43.147 61.468 70.698 84.167 75
SEM 4.618 5.562 7.538 6.923 1.152 5.231
y-int -32.074
slope 21.581 IC50 45 ug/ml
R2 0.8

120
Table 8.5: The ELISA reading results of MDA-MB-231 cell numbers when treated
with Propolis-1 and DMSO. Percent cell death and IC50 value were calculated
according to this data.
MDA-MB-231 Concentration (ug/ml)
Propolis-1 100 75 50 25 12.5 6
Set 1 -0.006 -0.006 0.267 0.358 0.465 0.61
Set 2 -0.004 -0.013 0.222 0.41 0.559 0.449
Set 3 -0.005 -0.006 0.216 0.424 0.692 0.764
Set 4 -0.014 -0.001 0.283 0.409 0.651 0.692
AVERAGE -0.007 -0.007 0.247 0.4 0.592 0.629
SEM 0.002 0.002 0.017 0.014 0.051 0.068
MDA-MB-231 Concentration (ug/ml)
DMSO 100 75 50 25 12.5 6
Set 1 0.616 0.527 0.714 0.663 0.966 0.801
Set 2 0.694 0.68 0.703 0.637 0.746 0.888
Set 3 0.574 0.499 0.625 0.608 0.664 0.61
Set 4 0.481 0.565 0.549 0.539 0.495 0.544
AVERAGE 0.591 0.568 0.648 0.612 0.718 0.711
SEM 0.044 0.04 0.038 0.027 0.098 0.08
Percent Cell Death
Concentration (ug/ml)
100 75 50 25 12.5 6
Set 1 100.974 101.139 62.605 46.003 51.863 23.845
Set 2 100.576 101.912 68.421 35.636 25.067 49.437
Set 3 100.871 101.202 65.44 30.263 -4.217 -25.246
Set 4 102.911 100.177 48.452 24.119 -31.515 -27.206
AVERAGE 101.184 101.232 61.883 34.641 17.549 11.533
SEM 0.463 0.31 3.832 4.021 15.706 16.42
y-int -64.179
slope 35.005 IC50 26 ug/ml
R2 0.91

121
Table 8.6: The ELISA reading results of MDA-MB-231 cell numbers when treated
with Propolis-2 and DMSO. Percent cell death and IC50 value were calculated
according to this data.
MDA-MB-231
Concentration (ug/ml)
Propolis-2 150 120 75 60 37.5 30
Set 1 0.001 0.012 0.018 0.036 0.054 0.052
Set 2 0.017 0.039 0.144 0.073 0.139 0.149
Set 3 0.007 0.028 0.152 0.11 0.125 0.134
Set 4 0 0.052 0.127 0.135 0.108 0.122
AVERAGE 0.006 0.033 0.11 0.089 0.107 0.114
SEM 0.004 0.008 0.031 0.022 0.019 0.021
MDA-MB-231
Concentration (ug/ml)
DMSO 150 120 75 60 37.5 30
Set 1 0.014 0.118 0.201 0.211 0.193 0.223
Set 2 0.026 0.142 0.187 0.187 0.138 0.147
Set 3 0.083 0.107 0.142 0.128 0.073 0.141
Set 4 0.07 0.125 0.099 0.117 0.086 0.12
AVERAGE 0.048 0.123 0.157 0.161 0.123 0.158
SEM 0.017 0.007 0.023 0.023 0.027 0.023
Percent Cell Death
Concentration (ug/ml)
150 120 75 60 37.5 30
Set 1 92.857 89.831 91.045 82.938 72.021 76.682
Set 2 34.615 72.535 22.995 60.963 -0.725 -1.361
Set 3 91.566 73.832 -7.042 14.063 -71.233 4.965
Set 4 100 58.4 -28.283 -15.385 -25.581 -1.667
AVERAGE 87.5 73.171 29.936 44.72 13.008 27.848
SEM 13.244 5.567 22.642 19.386 26.284 16.617
y-int -125.33
slope 40.743 IC50 74 ug/ml
R2 0.8

122
Table 8.7: The ELISA reading results of CAMA-1 cell numbers when treated with
Propolis-1 and DMSO. Percent cell death and IC50 value were calculated according
to this data.
CAMA-1 Concentration (ug/ml)
Propolis-1 80 60 50 40 30 25
Set 1 0 0 0 0.034 0.058 0.063
Set 2 0 0 0.019 0.067 0.069 0.083
Set 3 0.007 0.001 0.02 0.073 0.091 0.113
Set 4 -0.002 0.001 0.007 0.071 0.091 0.114
AVERAGE 0.001 0.001 0.012 0.061 0.077 0.093
SEM 0.002 0 0.005 0.009 0.008 0.012
CAMA-1 Concentration (ug/ml)
DMSO 80 60 50 40 30 25
Set 1 0.087 0.157 0.196 0.191 0.201 0.202
Set 2 0.202 0.187 0.198 0.18 0.207 0.184
Set 3 0.22 0.158 0.21 0.182 0.183 0.177
Set 4 0.158 0.129 0.19 0.164 0.198 0.138
AVERAGE 0.167 0.158 0.199 0.179 0.197 0.175
SEM 0.03 0.012 0.004 0.006 0.005 0.013
Percent Cell Death
Concentration (ug/ml)
80 60 50 40 30 25
Set 1 100 100 100 82.199 71.144 68.812
Set 2 100 100 90.404 62.778 66.667 54.891
Set 3 96.818 99.367 90.476 59.89 50.273 36.158
Set 4 101.266 99.225 96.316 56.707 54.04 17.391
AVERAGE 99.401 99.367 93.97 65.922 60.914 46.857
SEM 0.822 0.189 2.038 4.97 4.314 9.71
y-int -109.394
slope 49.468 IC50 25 ug/ml
R2 0.9

123
Table 8.8: The ELISA reading results of CAMA-1cell numbers when treated with
Propolis-2 and DMSO. Percent cell death and IC50 value were calculated according
to this data.
CAMA-1 Concentration (ug/ml)
Propolis-2 100 80 50 40 25 20
Set 1 0.022 0.025 0.072 0.078 0.101 0.109
Set 2 0.013 0.028 0.056 0.063 0.097 0.054
Set 3 0.016 0.013 0.054 0.101 0.039 0.054
Set 4 0.017 0.032 0.15 0.123 0.139 0.12
AVERAGE 0.017 0.025 0.083 0.091 0.094 0.084
SEM 0.002 0.004 0.023 0.013 0.021 0.018
CAMA-1 Concentration (ug/ml)
DMSO 100 80 50 40 25 20
Set 1 0.173 0.077 0.292 0.177 0.19 0.108
Set 2 0.156 0.202 0.294 0.249 0.116 0.1
Set 3 0.122 0.203 0.155 0.189 0.131 0.122
Set 4 0.127 0.207 0.208 0.148 0.154 0.158
AVERAGE 0.145 0.172 0.237 0.191 0.148 0.122
SEM 0.012 0.032 0.034 0.021 0.016 0.013
Percent Cell Death
Concentration (ug/ml)
100 80 50 40 25 20
Set 1 87.283 67.532 75.342 55.932 46.842 -0.926
Set 2 91.667 86.139 80.952 74.699 16.379 46
Set 3 86.885 93.596 65.161 46.561 70.229 55.738
Set 4 86.614 84.541 27.885 16.892 9.74 24.051
AVERAGE 88.276 85.465 64.979 52.356 36.486 31.148
SEM 1.034 4.801 10.357 10.477 12.155 10.91
y-int -84.629
slope 37.999 IC50 35 ug/ml
R2 0.99

124
Table 8.9: The ELISA reading results of MDA-MB-453 cell numbers when treated
with Propolis-1 and DMSO. Percent cell death and IC50 value were calculated
according to this data.
MDA-MB-453 Concentration (ug/ml)
Propolis-1 80 60 40 30 20
Set 1 0.001 0.046 0.041 0.043 0.034
Set 2 0.003 0.027 0.073 0.085 0.197
Set 3 0.052 0.024 0.077 0.086 0.129
Set 4 0.036 0.016 0.045 0.185 0.134
AVERAGE 0.023 0.028 0.059 0.1 0.124
SEM 0.013 0.006 0.009 0.03 0.034
MDA-MB-453 Concentration (ug/ml)
DMSO 80 60 40 30 20
Set 1 0.119 0.093 0.168 0.078 0.144
Set 2 0.115 0.13 0.106 0.141 0.086
Set 3 0.059 0.199 0.052 0.151 0.065
AVERAGE 0.098 0.141 0.109 0.123 0.098
SEM 0.019 0.031 0.034 0.023 0.024
Percent Cell Death
Concentration (ug/ml)
80 60 40 30 20
Set 1 97.391 79.231 31.132 39.716 -129.07
Set 2 11.864 87.94 -48.077 43.046 -98.462
Set 3 38.983 91.96 13.462 -22.517 -106.154
AVERAGE 76.531 80.142 45.872 18.699 -26.531
SEM 22.041 3.556 23.844 17.413 25.576
y-int -250.482
slope 77.961 IC50 47 ug/ml
R2 0.93

125
Table 8.10: The ELISA reading results of MDA-MB-453 cell numbers when treated
with Propolis-2 and DMSO. Percent cell death and IC50 value were calculated
according to this data.
MDA-MB-453
Concentration (ug/ml)
Propolis-2 30 50 60 100 120
Set 1 0.045 0.042 0.045 0.018 0.014
Set 2 0.108 0.093 0.095 0.06 0.027
Set 3 0.118 0.079 0.073 0.053 0.027
Set 4 0.093 0.073 0.101 0.058 0.028
AVERAGE 0.091 0.072 0.079 0.047 0.024
SEM 0.016 0.011 0.013 0.01 0.003
MDA-MB-453
Concentration (ug/ml)
DMSO 30 50 60 100 120
Set 1 0.128 0.052 0.179 0.222 0.071
Set 2 0.186 0.134 0.213 0.205 0.092
Set 3 0.125 0.185 0.176 0.214 0.077
Set 4 0.115 0.191 0.082 0.086 0.047
AVERAGE 0.139 0.141 0.163 0.182 0.072
SEM 0.016 0.032 0.028 0.032 0.009
Percent Cell Death
Concentration (ug/ml)
30 50 60 100 120
Set 1 64.844 19.231 74.86 91.892 80.282
Set 2 41.935 30.597 55.399 70.732 70.652
Set 3 5.6 57.297 58.523 75.234 64.935
Set 4 19.13 61.78 -23.171 32.558 40.426
AVERAGE 34.532 48.936 51.534 74.176 66.667
SEM 11.289 9.047 19.138 10.956 7.38
y-int -56.529
slope 26.85 IC50 53 ug/ml
R2 0.92

126
Table 8.11: The ELISA reading results of MDA-MB-468 cell numbers when treated
with Propolis-1 and DMSO. Percent cell death and IC50 value were calculated
according to this data.
MDA-MB-468 Concentration (ug/ml)
Propolis-1 15 20 30 40 60 80
Set 1 0.268 0.199 0.048 0.033 0.017 0.004
Set 2 0.331 0.053 0.233 0.172 0.032 -0.003
Set 3 0.335 0.292 0.301 0.204 0.076 -0.004
Set 4 0.325 0.293 0.233 0.244 0.142 0.009
AVERAGE 0.315 0.209 0.204 0.163 0.067 0.002
SEM 0.016 0.057 0.054 0.046 0.028 0.003
MDA-MB-468 Concentration (ug/ml)
DMSO 15 20 30 40 60 80
Set 1 0.492 0.433 0.466 0.186 0.146 0.264
Set 2 0.373 0.362 0.423 0.372 0.342 0.212
Set 3 0.272 0.344 0.395 0.388 0.372 0.196
Set 4 0.375 0.263 0.25 0.555 0.606 0.045
AVERAGE 0.378 0.351 0.384 0.375 0.367 0.179
SEM 0.045 0.035 0.047 0.075 0.094 0.047
Percent Cell Death
Concentration (ug/ml)
15 20 30 40 60 80
Set 1 45.528 54.042 89.7 82.258 88.356 98.485
Set 2 11.26 85.359 44.917 53.763 90.643 101.415
Set 3 -23.162 15.116 23.797 47.423 79.57 102.041
Set 4 13.333 -11.407 6.8 56.036 76.568 80
AVERAGE 16.667 40.456 46.875 56.533 81.744 98.883
SEM 12.201 18.478 15.567 6.694 2.97 4.584
y-int -104.079
slope 45.398 IC50 30 ug/ml
R2 0.97

127
Table 8.12: The ELISA reading results of MDA-MB-468 cell numbers when treated
with Propolis-2 and DMSO. Percent cell death and IC50 value were calculated
according to this data.
MDA-MB-468
Concentration (ug/ml)
Propolis-2 25 30 50 60 100 120
Set 1 0.119 0.075 0.036 0.06 0.01 0.014
Set 2 0.546 0.435 0.195 0.234 0.008 0.014
Set 3 0.447 0.35 0.188 0.236 0.048 0.004
Set 4 0.457 0.379 0.19 0.201 0.035 0.02
AVERAGE 0.392 0.31 0.152 0.183 0.025 0.013
SEM 0.094 0.08 0.039 0.042 0.01 0.003
MDA-MB-468
Concentration (ug/ml)
DMSO 25 30 50 60 100 120
Set 1 0.301 0.234 0.891 0.873 0.931 0.09
Set 2 0.793 0.619 0.773 1.123 0.798 0.303
Set 3 0.83 0.859 0.606 0.985 0.606 0.425
Set 4 0.927 1.004 0.247 0.428 0.403 0.253
AVERAGE 0.713 0.679 0.629 0.852 0.685 0.268
SEM 0.14 0.168 0.14 0.15 0.115 0.069
Percent Cell Death
Concentration (ug/ml)
25 30 50 60 100 120
Set 1 60.465 67.949 95.96 93.127 98.926 84.444
Set 2 31.148 29.725 74.774 79.163 98.997 95.38
Set 3 46.145 59.255 68.977 76.041 92.079 99.059
Set 4 50.701 62.251 23.077 53.037 91.315 92.095
AVERAGE 45.021 54.345 75.835 78.521 96.35 95.149
SEM 5.306 7.404 13.481 7.233 1.835 2.747
y-int -57.459
slope 32.889 IC50 26 ug/ml
R2 0.97

128
Table 8.13: The ELISA reading results of T47D cell numbers when treated with
Propolis-1 and DMSO. Percent cell death and IC50 value were calculated according
to this data.
T47D Concentration (ug/ml)
Propolis-1 120 100 60 50 30 25
Set 1 0.045 0.064 0.039 0.097 0.365 0.563
Set 2 0.032 0.006 0.39 0.749 1.636 1.658
Set 3 0.035 0.025 0.758 0.946 1.697 2.067
Set 4 0.031 0.031 0.99 0.931 1.955 2.009
AVERAGE 0.036 0.032 0.544 0.681 1.413 1.574
SEM 0.003 0.012 0.209 0.2 0.356 0.349
T47D Concentration (ug/ml)
DMSO 120 100 60 50 30 25
Set 1 1.152 2.009 2.511 2.554 2.452 2.159
Set 2 1.461 2.105 2.543 2.458 2.518 2.548
Set 3 1.466 1.679 2.233 2.137 2.668 2.483
Set 4 0.263 1.498 1.15 1.728 1.975 2.099
AVERAGE 1.086 1.823 2.109 2.219 2.403 2.322
SEM 0.284 0.142 0.327 0.186 0.15 0.113
Percent Cell Death
Concentration (ug/ml)
120 100 60 50 30 25
Set 1 96.094 96.814 98.447 96.202 85.114 73.923
Set 2 97.81 99.715 84.664 69.528 35.028 34.929
Set 3 97.613 98.511 66.055 55.732 36.394 16.754
Set 4 88.213 97.931 13.913 46.123 1.013 4.288
AVERAGE 96.685 98.245 74.206 69.311 41.199 32.214
SEM 2.007 0.523 16.146 9.443 14.988 13.147
y-int -104.651
slope 43.289 IC50 36 ug/ml
R2 0.98

129
Table 8.14: The ELISA reading results of T47D cell numbers when treated with
Propolis-2 and DMSO. Percent cell death and IC50 value were calculated according
to this data.
T47D Concentration (ug/ml)
Propolis-2 120 100 60 50 30 25
Set 1 0.12 0.134 0.203 0.283 1.062 0.64
Set 2 0.06 0.252 0.391 1.502 1.724 1.616
Set 3 0.126 0.07 1.041 1.547 1.847 1.715
Set 4 0.085 0.069 0.585 1.05 1.935 2.164
AVERAGE 0.098 0.131 0.555 1.096 1.642 1.534
SEM 0.015 0.043 0.18 0.293 0.198 0.321
T47D Concentration (ug/ml)
DMSO 120 100 60 50 30 25
Set 1 0.737 1.419 2.105 2.503 2.482 2.273
Set 2 1.022 2.07 1.999 2.324 2.352 2.298
Set 3 1.424 2.336 1.978 2.582 2.374 1.981
Set 4 1.357 1.269 1.967 2.186 1.823 2.216
AVERAGE 1.135 1.774 2.012 2.399 2.258 2.192
SEM 0.159 0.256 0.032 0.089 0.148 0.072
Percent Cell Death
Concentration (ug/ml)
120 100 60 50 30 25
Set 1 83.718 90.557 90.356 88.694 57.212 71.843
Set 2 94.129 87.826 80.44 35.37 26.701 29.678
Set 3 91.152 97.003 47.371 40.085 22.199 13.428
Set 4 93.736 94.563 70.259 51.967 -6.144 2.347
AVERAGE 91.366 92.616 72.416 54.314 27.281 30.018
SEM 2.096 1.771 7.976 10.454 11.243 13.202
y-int -119.562
slope 45.188 IC50 43 ug/ml
R2 0.96

130
Table 8.15: The ELISA reading results of MCF7 cell numbers when treated with
Propolis-1 and DMSO. Percent cell death and IC50 value were calculated according
to this data.
MCF7 Concentration (ug/ml)
Propolis-1 100 80 50 40 25 20
Set 1 0.025 0.11 0.259 0.335 0.298 0.975
Set 2 0.056 0.154 0.533 1.137 1.659 1.637
Set 3 0.077 0.253 0.619 1.166 1.525 1.223
Set 4 0.063 0.166 0.502 1.044 1.334 1.338
AVERAGE 0.055 0.171 0.478 0.921 1.204 1.293
SEM 0.011 0.03 0.077 0.197 0.309 0.137
MCF7 Concentration (ug/ml)
DMSO 100 80 50 40 25 20
Set 1 0.498 1.404 1.708 1.753 1.697 1.517
Set 2 0.634 1.742 1.757 1.767 1.719 1.562
Set 3 1.067 1.543 1.709 1.61 1.533 1.573
Set 4 1.078 0.901 1.225 1.132 1.248 1.106
AVERAGE 0.819 1.398 1.6 1.566 1.549 1.44
SEM 0.149 0.179 0.125 0.149 0.109 0.112
Percent Cell Death
Concentration (ug/ml)
100 80 50 40 25 20
Set 1 94.98 92.165 84.836 80.89 82.44 35.728
Set 2 91.167 91.16 69.664 35.654 3.49 -4.802
Set 3 92.784 83.603 63.78 27.578 0.522 22.25
Set 4 94.156 81.576 59.02 7.774 -6.891 -20.976
AVERAGE 93.284 87.768 70.125 41.188 22.272 10.208
SEM 0.723 2.308 4.862 13.406 18.163 11.122
y-int -151.771
slope 54.181 IC50 41 ug/ml
R2 0.97
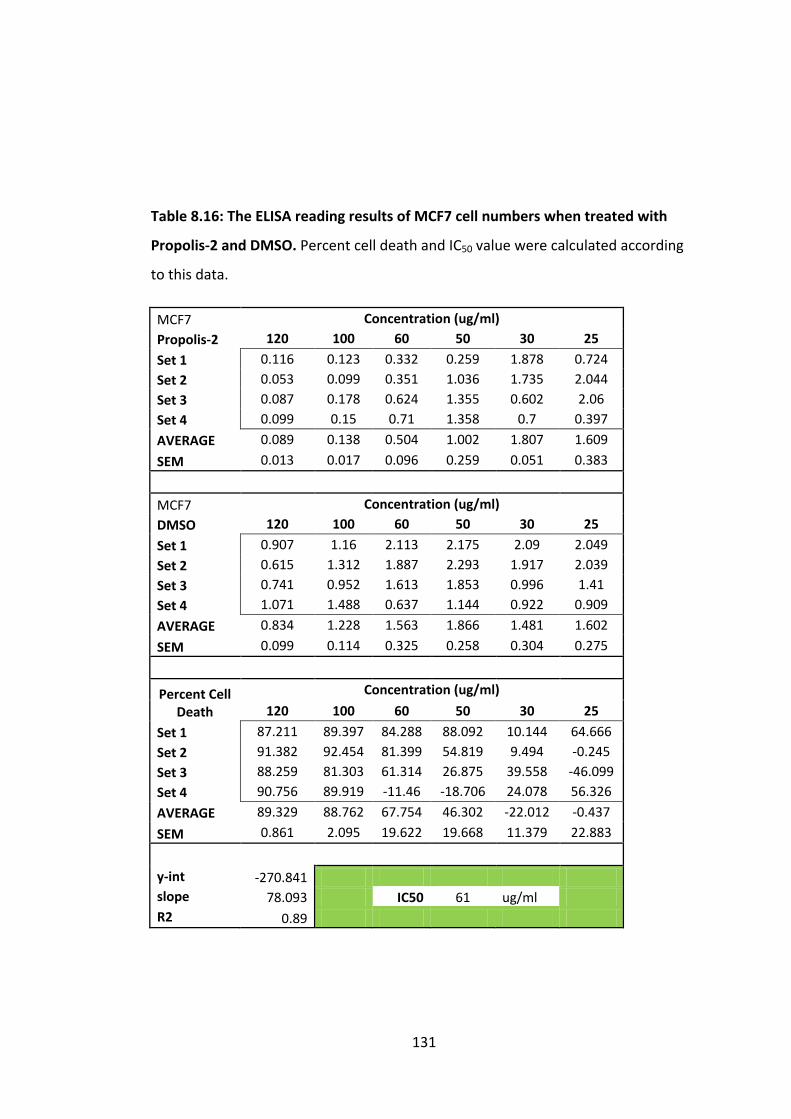
131
Table 8.16: The ELISA reading results of MCF7 cell numbers when treated with
Propolis-2 and DMSO. Percent cell death and IC50 value were calculated according
to this data.
MCF7 Concentration (ug/ml)
Propolis-2 120 100 60 50 30 25
Set 1 0.116 0.123 0.332 0.259 1.878 0.724
Set 2 0.053 0.099 0.351 1.036 1.735 2.044
Set 3 0.087 0.178 0.624 1.355 0.602 2.06
Set 4 0.099 0.15 0.71 1.358 0.7 0.397
AVERAGE 0.089 0.138 0.504 1.002 1.807 1.609
SEM 0.013 0.017 0.096 0.259 0.051 0.383
MCF7 Concentration (ug/ml)
DMSO 120 100 60 50 30 25
Set 1 0.907 1.16 2.113 2.175 2.09 2.049
Set 2 0.615 1.312 1.887 2.293 1.917 2.039
Set 3 0.741 0.952 1.613 1.853 0.996 1.41
Set 4 1.071 1.488 0.637 1.144 0.922 0.909
AVERAGE 0.834 1.228 1.563 1.866 1.481 1.602
SEM 0.099 0.114 0.325 0.258 0.304 0.275
Percent Cell Death
Concentration (ug/ml)
120 100 60 50 30 25
Set 1 87.211 89.397 84.288 88.092 10.144 64.666
Set 2 91.382 92.454 81.399 54.819 9.494 -0.245
Set 3 88.259 81.303 61.314 26.875 39.558 -46.099
Set 4 90.756 89.919 -11.46 -18.706 24.078 56.326
AVERAGE 89.329 88.762 67.754 46.302 -22.012 -0.437
SEM 0.861 2.095 19.622 19.668 11.379 22.883
y-int -270.841
slope 78.093 IC50 61 ug/ml
R2 0.89

132
Table 8.17: The ELISA reading results of HCC-1937 cell numbers when treated with
Propolis-1 and DMSO. Percent cell death and IC50 value were calculated according
to this data.
HCC-1937 Concentration (ug/ml)
Propolis-1 30 37.5 60 75 120 150
Set 1 0.63 0.69 0.552 0.555 0.433 0.443
Set 2 0.631 0.559 0.516 0.437 0.417 0.332
Set 3 0.427 0.52 0.387 0.463 0.099 0.291
Set 4 0.629 0.504 0.492 0.397 0.403 0.276
AVERAGE 0.579 0.568 0.487 0.463 0.338 0.336
SEM 0.051 0.042 0.035 0.034 0.08 0.038
HCC-1937 Concentration (ug/ml)
DMSO 30 37.5 60 75 120 150
Set 1 0.807 0.864 0.827 0.806 0.775 0.68
Set 2 0.775 0.86 0.81 0.81 0.732 0.704
Set 3 0.746 0.788 0.758 0.738 0.707 0.627
Set 4 0.833 0.772 0.745 0.771 0.713 0.689
AVERAGE 0.79 0.821 0.785 0.781 0.732 0.675
SEM 0.019 0.024 0.02 0.017 0.015 0.017
Percent Cell Death
Concentration (ug/ml)
30 37.5 60 75 120 150
Set 1 21.933 20.139 33.253 31.141 44.129 34.853
Set 2 18.581 35 36.296 46.049 43.033 52.841
Set 3 42.761 34.01 48.945 37.263 85.997 53.589
Set 4 24.49 34.715 33.96 48.508 43.478 59.942
AVERAGE 26.709 30.816 37.962 40.717 53.825 50.222
SEM 4.686 3.131 3.177 3.471 9.193 4.669
y-int -28.656
slope 16.334 IC50 123 ug/ml
R2 0.95

133
Table 8.18: The ELISA reading results of HCC-1937 cell numbers when treated with
Propolis-2 and DMSO. Percent cell death and IC50 value were calculated according
to this data.
HCC-1937 Concentration (ug/ml)
Propolis-2 150 120 75 60 30
Set 1 0.01 0.06 0.104 0.096 0.172
Set 2 0.022 0.169 0.324 0.445 0.781
Set 3 0.037 0.204 0.437 0.482 0.778
Set 4 0.052 0.245 0.319 0.563 0.588
AVERAGE 0.03 0.17 0.296 0.397 0.58
SEM 0.009 0.04 0.07 0.103 0.143
HCC-1937 Concentration (ug/ml)
DMSO 150 120 75 60 30
Set 1 0.09 0.419 0.457 0.238 0.626
Set 2 0.129 0.43 0.515 0.39 0.601
Set 3 0.098 0.231 0.313 0.475 0.55
Set 4 0.147 0.187 0.223 0.505 0.361
AVERAGE 0.116 0.317 0.377 0.402 0.535
SEM 0.013 0.063 0.067 0.06 0.06
Percent Cell Death
Concentration (ug/ml)
150 120 75 60 30
Set 1 88.889 85.68 77.243 59.664 72.524
Set 2 82.946 60.698 37.087 -14.103 -29.95
Set 3 62.245 11.688 -39.617 -1.474 -41.455
Set 4 64.626 -31.016 -43.049 -11.485 -62.881
AVERAGE 74.138 46.372 21.485 1.244 -8.411
SEM 5.735 22.72 25.813 15.135 26.119
y-int -190.347
slope 50.278 IC50 119 ug/ml
R2 0.88

134
Table 8.19: The ELISA reading results of MDA-MB-157 cell numbers when treated
with Propolis-1 and DMSO. Percent cell death and IC50 value were calculated
according to this data.
MDA-MB-157 Concentration (ug/ml)
Propolis-1 120 100 60 50 30 25
Set 1 0.179 0.105 0.267 0.307 0.376 0.386
Set 2 0.232 0.161 0.215 0.497 0.474 0.689
Set 3 0.211 0.195 0.263 0.446 0.48 0.585
Set 4 0.233 0.158 0.299 0.175 0.484 0.369
AVERAGE 0.214 0.155 0.261 0.356 0.454 0.507
SEM 0.013 0.019 0.017 0.073 0.026 0.078
MDA-MB-157 Concentration (ug/ml)
DMSO 120 100 60 50 30 25
Set 1 0.421 0.478 0.477 0.483 0.41 0.536
Set 2 0.459 0.46 0.454 0.465 0.484 0.426
Set 3 0.403 0.445 0.478 0.5 0.503 0.506
Set 4 0.413 0.413 0.421 0.439 0.413 0.427
AVERAGE 0.424 0.449 0.458 0.472 0.453 0.474
SEM 0.012 0.014 0.013 0.013 0.024 0.028
Percent Cell Death
Concentration (ug/ml)
120 100 60 50 30 25
Set 1 57.482 78.033 44.025 36.439 8.293 27.985
Set 2 49.455 65 52.643 -6.882 2.066 -61.737
Set 3 47.643 56.18 44.979 10.8 4.573 -15.613
Set 4 43.584 61.743 28.979 60.137 -17.191 13.583
AVERAGE 49.528 65.479 43.013 24.576 -0.221 -6.962
SEM 2.527 4.016 4.288 12.708 4.926 17.15
y-int -144.434
slope 43.383 IC50 88 ug/ml
R2 0.9

135
Table 8.20: The ELISA reading results of MDA-MB-157 cell numbers when treated
with Propolis-2 and DMSO. Percent cell death and IC50 value were calculated
according to this data.
MDA-MB-157
Concentration (ug/ml)
Propolis-2 30 37.5 60 75 120 150
Set 1 0.983 0.782 0.684 0.371 0.138 0.181
Set 2 0.88 0.905 0.953 0.742 0.341 0.287
Set 3 0.828 1.086 1.097 0.841 0.445 0.478
AVERAGE 0.897 0.924 0.911 0.651 0.308 0.315
SEM 0.046 0.088 0.121 0.143 0.09 0.087
MDA-MB-157
Concentration (ug/ml)
DMSO 30 37.5 60 75 120 150
Set 1 1.301 1.007 1.896 1.553 1.534 1.045
Set 2 1.303 1.34 1.654 1.711 1.487 1.353
Set 3 1.145 1.689 1.56 1.634 1.661 1.141
AVERAGE 1.25 1.345 1.703 1.633 1.561 1.18
SEM 0.052 0.197 0.1 0.046 0.052 0.091
Percent Cell Death
Concentration (ug/ml)
30 37.5 60 75 120 150
Set 1 24.443 22.344 63.924 76.111 91.004 82.679
Set 2 32.464 32.463 42.382 56.634 77.068 78.788
Set 3 27.686 35.702 29.679 48.531 73.209 58.107
AVERAGE 28.24 31.301 46.506 60.135 80.269 73.305
SEM 1.902 3.301 8.168 6.683 4.413 6.226
y-int -86.302
slope 33.19 IC50 61 ug/ml
R2 0.94

136
Table 8.21: The ELISA reading results of BT-20 cell numbers when treated with
Propolis-1 and DMSO. Percent cell death and IC50 value were calculated according
to this data.
BT-20 Concentration (ug/ml)
Propolis-1 150 120 75 60 37.5 30
Set 1 0.02 0.089 0.101 0.095 0.168 0.202
Set 2 0.004 0.082 0.189 0.743 0.683 0.731
Set 3 0.025 -0.011 0.566 0.4 0.91 0.642
Set 4 0.028 0.303 0.51 0.759 0.87 1.013
AVERAGE 0.019 0.116 0.342 0.499 0.658 0.647
SEM 0.005 0.066 0.115 0.158 0.171 0.168
BT-20 Concentration (ug/ml)
DMSO 150 120 75 60 37.5 30
Set 1 0.146 0.139 0.362 0.962 0.335 0.359
Set 2 0.103 0.412 0.915 0.976 0.663 0.542
Set 3 0.126 0.738 0.921 0.945 0.777 0.948
Set 4 0.092 0.778 1.16 0.641 0.858 0.974
AVERAGE 0.117 0.517 0.84 0.881 0.658 0.706
SEM 0.012 0.15 0.169 0.08 0.115 0.152
Percent Cell Death
Concentration (ug/ml)
150 120 75 60 37.5 30
Set 1 86.301 35.971 72.099 90.125 49.851 43.733
Set 2 96.117 80.097 79.344 23.873 -3.017 -34.871
Set 3 80.159 101.491 38.545 57.672 -17.117 32.278
Set 4 69.565 61.054 56.034 -18.409 -1.399 -4.004
AVERAGE 83.761 77.563 59.286 43.36 0 8.357
SEM 4.821 12.199 7.872 20.164 12.818 15.497
y-int -181.212
slope 53.877 IC50 73 ug/ml
R2 0.94

137
Table 8.22: The ELISA reading results of BT-20 cell numbers when treated with
Propolis-2 and DMSO. Percent cell death and IC50 value were calculated according
to this data.
BT-20 Concentration (ug/ml)
Propolis-2 120 100 60 50 30
Set 1 0.084 0.45 0.933 1.06 1.188
Set 2 0.115 0.488 1.194 1.352 1.41
Set 3 0.056 0.625 1.219 1.186 1.184
AVERAGE 0.085 0.521 1.115 1.199 1.261
SEM 0.017 0.053 0.091 0.085 0.075
BT-20 Concentration (ug/ml)
DMSO 120 100 60 50 30
Set 1 0.161 1.154 0.961 0.991 1.168
Set 2 0.139 1.537 0.817 0.525 0.546
Set 3 0.416 0.876 0.694 0.596 0.509
AVERAGE 0.21675 0.96525 0.6995 0.58725 0.61875
SEM 0.089 0.192 0.077 0.145 0.214
Percent Cell Death
Concentration (ug/ml)
120 100 60 50 30
Set 1 47.826 61.005 2.914 -6.963 -1.712
Set 2 17.266 68.25
-46.144
-157.524 -158.242
Set 3 86.538 28.653
-75.648
-98.993 -132.613
AVERAGE 60.784 46.024 -59.4 -104.172 -103.798
SEM 16.63 10.12 19.559 36.089 39.62
y-int -595.77
slope 135.493 IC50 117 ug/ml
R2 0.88

138
Table 8.23: The ELISA reading results of MDA-MB-361 cell numbers when treated
with Propolis-1 and DMSO. Percent cell death and IC50 value were calculated
according to this data.
MDA-MB-361 Concentration (ug/ml)
Propolis-1 15 20 30 40 60 80
Set 1 1.109 1.177 0.827 0.918 0.692 0.549
Set 2 1.923 1.847 1.143 0.857 0.954 0.981
Set 3 2.292 1.497 1.469 0.842 1.11 0.084
Set 4 2.292 1.711 0.969 1.161 1.138 0.779
AVERAGE 1.904 1.558 1.102 0.945 0.974 0.598
SEM 0.279 0.146 0.138 0.074 0.102 0.193
MDA-MB-361 Concentration (ug/ml)
DMSO 15 20 30 40 60 80
Set 1 2.158 0.795 1.783 1.835 2.389 2.032
Set 2 2.048 1.515 2.072 1.403 2.334 2.264
Set 3 1.872 1.807 2.045 1.886 1.514 1.678
Set 4 2.313 2.109 0.824 1.297 2.103 1.735
AVERAGE 2.098 1.557 1.681 1.605 2.085 1.927
SEM 0.093 0.281 0.293 0.149 0.2 0.136
Percent Cell Death
Concentration (ug/ml)
15 20 30 40 60 80
Set 1 48.61 -48.05 53.617 49.973 71.034 72.982
Set 2 6.104 -21.914 44.836 38.917 59.126 56.67
Set 3 -22.436 17.156 28.166 55.355 26.684 94.994
Set 4 0.908 18.872 -17.597 10.486 45.887 55.101
AVERAGE 9.247 -0.064 34.444 41.121 53.285 68.967
SEM 12.82 14.16 13.825 8.679 8.253 8.039
y-int -104.55
slope 39.224 IC50 51 ug/ml
R2 0.92

139
Table 8.24: The ELISA reading results of MDA-MB-361 cell numbers when treated
with Propolis-2 and DMSO. Percent cell death and IC50 value were calculated
according to this data.
MDA-MB-361
Concentration (ug/ml)
Propolis-2 30 37.5 60 75 120 150
Set 1 0.455 0.317 0.219 0.401 0.127 0.03
Set 2 0.779 0.797 0.489 0.692 0.432 0.053
Set 3 1.757 1.289 0.724 0.471 0.39 0.059
Set 4 1.748 1.353 0.622 0.489 0.269 0.099
AVERAGE 1.185 0.939 0.514 0.513 0.305 0.06
SEM 0.334 0.242 0.109 0.063 0.069 0.014
MDA-MB-361
Concentration (ug/ml)
DMSO 30 37.5 60 75 120 150
Set 1 0.74 0.825 1.908 1.797 1.631 1.382
Set 2 0.927 0.885 1.713 1.684 1.557 1.54
Set 3 1.728 1.737 1.586 1.614 1.442 1.594
Set 4 1.924 1.857 0.88 0.773 1.628 0.878
AVERAGE 1.33 1.326 1.522 1.467 1.565 1.349
SEM 0.292 0.273 0.224 0.234 0.044 0.163
Percent Cell Death
Concentration (ug/ml)
30 37.5 60 75 120 150
Set 1 38.514 61.576 88.522 77.685 92.213 97.829
Set 2 15.965 9.944 71.454 58.907 72.254 96.558
Set 3 -1.678 25.792 54.351 70.818 72.954 96.299
Set 4 9.148 27.141 29.318 36.74 83.477 88.724
AVERAGE 10.902 29.186 66.229 65.031 80.511 95.552
SEM 7.425 9.431 11.004 7.828 4.114 1.799
y-int -148.202
slope 49.003 IC50 57 ug/ml
R2 0.94

140
Table 8.25: The ELISA reading results of BT-474 cell numbers when treated with
Propolis-1 and DMSO. Percent cell death and IC50 value were calculated according
to this data.
BT-474 Concentration (ug/ml)
Propolis-1 30 37.5 60 75 120 150
Set 1 1.454 1.752 0.715 0.779 1.04 1.433
Set 2 1.878 0.402 0.119 0.51 1.517 0.682
Set 3 0.547 1.032 1.333 0.702 0.138 -0.012
AVERAGE 1.293 1.062 0.722 0.664 0.898 0.701
SEM 0.393 0.39 0.35 0.08 0.404 0.417
BT-474 Concentration (ug/ml)
DMSO 30 37.5 60 75 120 150
Set 1 2.128 1.787 1.21 1.612 1.697 1.734
Set 2 2.317 2.219 1.176 0.728 2.337 1.015
Set 3 2.744 2.19 1.989 1.73 2.464 2.679
AVERAGE 2.396 2.065 1.458 1.357 2.166 1.809
SEM 0.182 0.139 0.266 0.316 0.237 0.482
Percent Cell Death
Concentration (ug/ml)
30 37.5 60 75 120 150
Set 1 31.673 1.959 40.909 51.675 38.715 17.359
Set 2 18.947 81.884 89.881 29.945 35.088 32.808
Set 3 80.066 52.877 32.981 59.422 94.399 100.448
AVERAGE 46.035 48.571 50.48 51.069 58.541 61.249
SEM 15.218 19.093 14.576 7.298 15.688 21.075
y-int 14.512
slope 9.069 IC50 50 ug/ml
R2 0.93
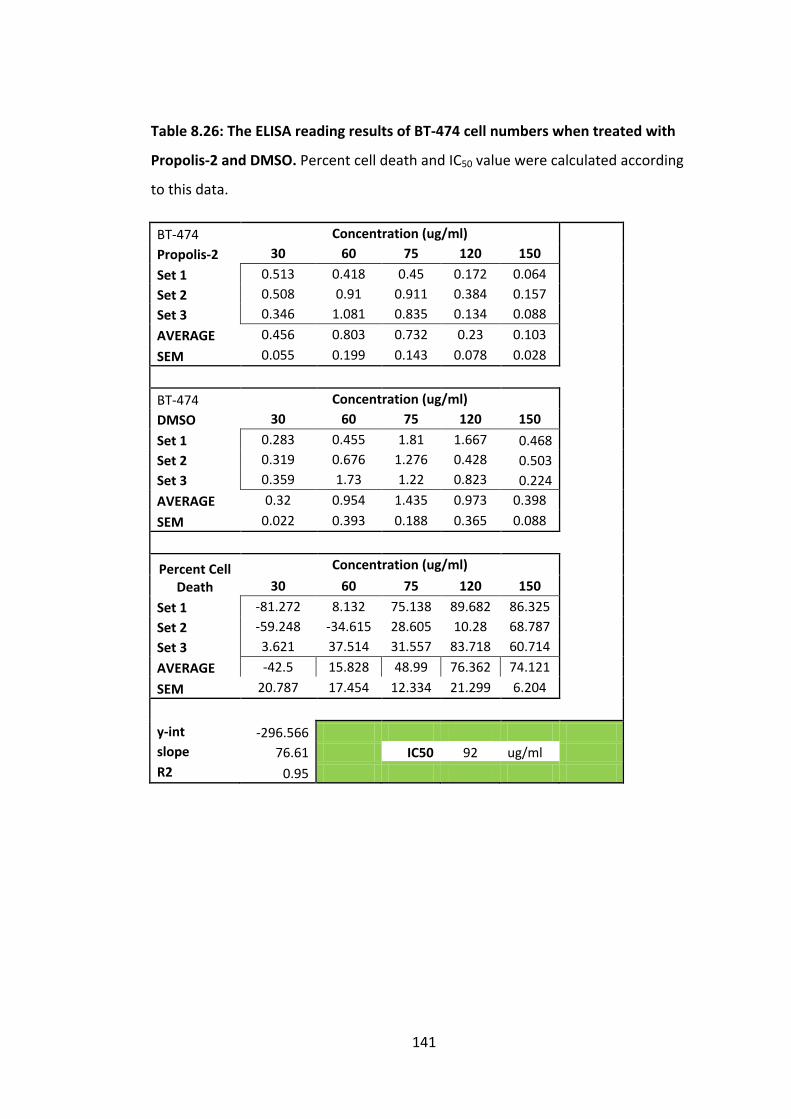
141
Table 8.26: The ELISA reading results of BT-474 cell numbers when treated with
Propolis-2 and DMSO. Percent cell death and IC50 value were calculated according
to this data.
BT-474 Concentration (ug/ml)
Propolis-2 30 60 75 120 150
Set 1 0.513 0.418 0.45 0.172 0.064
Set 2 0.508 0.91 0.911 0.384 0.157
Set 3 0.346 1.081 0.835 0.134 0.088
AVERAGE 0.456 0.803 0.732 0.23 0.103
SEM 0.055 0.199 0.143 0.078 0.028
BT-474 Concentration (ug/ml)
DMSO 30 60 75 120 150
Set 1 0.283 0.455 1.81 1.667 0.468
Set 2 0.319 0.676 1.276 0.428 0.503
Set 3 0.359 1.73 1.22 0.823 0.224
AVERAGE 0.32 0.954 1.435 0.973 0.398
SEM 0.022 0.393 0.188 0.365 0.088
Percent Cell Death
Concentration (ug/ml)
30 60 75 120 150
Set 1 -81.272 8.132 75.138 89.682 86.325
Set 2 -59.248 -34.615 28.605 10.28 68.787
Set 3 3.621 37.514 31.557 83.718 60.714
AVERAGE -42.5 15.828 48.99 76.362 74.121
SEM 20.787 17.454 12.334 21.299 6.204
y-int -296.566
slope 76.61 IC50 92 ug/ml
R2 0.95

142
Table 8.27: The ELISA reading results of ZR-75-1 cell numbers when treated with
Propolis-1 and DMSO. Percent cell death and IC50 value were calculated according
to this data.
ZR-75-1 Concentration (ug/ml)
Propolis-1 120 100 80 75 60 50
Set 1 0.064 0.039 0.097 0.365 0.563 0.914
Set 2 0.006 0.39 0.749 1.636 1.658 2.378
Set 3 0.025 0.758 0.946 1.697 2.067 2.441
Set 4 0.031 0.99 0.931 1.955 2.009 2.378
AVERAGE 0.032 0.544 0.681 1.413 1.574 2.028
SEM 0.012 0.209 0.2 0.356 0.349 0.372
ZR-75-1 Concentration (ug/ml)
DMSO 120 100 80 75 60 50
Set 1 2.009 2.511 2.554 2.452 2.159 2.369
Set 2 2.105 2.543 2.458 2.518 2.548 2.307
Set 3 1.679 2.233 2.137 2.668 2.483 2.505
Set 4 1.498 1.15 1.728 1.975 2.099 2.386
AVERAGE 1.823 2.109 2.219 2.403 2.322 2.392
SEM 0.142 0.327 0.186 0.15 0.113 0.041
Percent Cell Death
Concentration (ug/ml)
120 100 80 75 60 50
Set 1 96.814 98.447 96.202 85.114 73.923 61.418
Set 2 99.715 84.664 69.528 35.028 34.929 -3.078
Set 3 98.511 66.055 55.732 36.394 16.754 2.555
Set 4 97.931 13.913 46.123 1.013 4.288 0.335
AVERAGE 98.245 74.206 69.311 41.199 32.214 15.217
SEM 0.523 16.146 9.443 14.988 13.147 13.349
y-int -349.542
slope 93.018 IC50 73 ug/ml
R2 0.94

143
Table 8.28: The ELISA reading results of ZR-75-1 cell numbers when treated with
Propolis-2 and DMSO. Percent cell death and IC50 value were calculated according
to this data.
ZR-75-1 Concentration (ug/ml)
Propolis-2 120 100 60 50 25
Set 1 0.103 0.049 0.589 0.526 0.701
Set 2 0.125 0.08 0.635 0.684 0.755
Set 3 0.078 0.271 0.681 0.785 0.838
AVERAGE 0.102 0.133 0.635 0.665 0.765
SEM 0.014 0.069 0.027 0.075 0.04
ZR-75-1 Concentration (ug/ml)
DMSO 120 100 60 50 25
Set 1 0.198 0.091 0.94 1.066 0.93
Set 2 0.32 0.409 1.258 1.318 0.886
Set 3 0.191 0.716 0.958 1.139 0.72
AVERAGE 0.236 0.405 1.052 1.174 0.845
SEM 0.042 0.18 0.103 0.075 0.064
Percent Cell Death
Concentration (ug/ml)
120 100 60 50 25
Set 1 47.98 46.154 37.34 50.657 24.624
Set 2 60.938 80.44 49.523 48.103 14.786
Set 3 59.162 62.151 28.914 31.08 -16.389
AVERAGE 56.78 67.16 39.639 43.356 9.467
SEM 3.319 8.18 4.894 5.017 10.107
y-int -93.951
slope 33.28 IC50 76 ug/ml
R2 0.89

144
Table 8.29: The ELISA reading results of hTERT-HME1 cell numbers when treated
with Propolis-1 and DMSO. Percent cell death and IC50 value were calculated
according to this data.
hTERT-HME1 Concentration (ug/ml)
Propolis-1 25 30 50 60 100 120
Set 1 0.118 0.05 0.05 0.039 0.036 0.045
Set 2 0.548 0.557 0.624 0.093 0.041 0.092
Set 3 0.893 0.719 0.538 0.387 0.153 0.087
Set 4 0.723 0.713 0.371 0.155 0.082 0.087
AVERAGE 0.571 0.51 0.396 0.169 0.078 0.078
SEM 0.166 0.158 0.127 0.077 0.027 0.011
hTERT-HME1 Concentration (ug/ml)
DMSO 25 30 50 60 100 120
Set 1 0.237 0.304 0.272 0.922 1.02 0.399
Set 2 0.85 0.78 0.909 1.161 1.048 0.38
Set 3 0.889 1.065 1.091 1.15 1.122 0.542
Set 4 1.093 1.219 1.099 0.389 0.251 0.152
AVERAGE 0.767 0.842 0.843 0.906 0.86 0.368
SEM 0.185 0.201 0.195 0.181 0.204 0.081
Percent Cell Death
Concentration (ug/ml)
25 30 50 60 100 120
Set 1 50.211 83.553 81.618 95.77 96.471 88.722
Set 2 35.529 28.59 31.353 91.99 96.088 75.789
Set 3 -0.45 32.488 50.687 66.348 86.364 83.948
Set 4 33.852 41.509 66.242 60.154 67.331 42.763
AVERAGE 25.554 39.43 53.025 81.347 90.93 78.804
SEM 9.338 11.055 9.368 7.789 5.99 9.075
y-int -91.469
slope 38.216 IC50 41 ug/ml
R2 0.84

145
Table 8.30: The ELISA reading results of hTERT-HME1 cell numbers when treated
with Propolis-2 and DMSO. Percent cell death and IC50 value were calculated
according to this data.
hTERT-HME1
Concentration (ug/ml)
Propolis-2 37.5 60 75 120 150
Set 1 0.684 0.638 0.516 0.216 0.093
Set 2 0.679 0.636 0.561 0.314 0.097
Set 3 0.379 0.581 0.585 0.434 0.066
AVERAGE 0.581 0.618 0.554 0.321 0.085
SEM 0.101 0.019 0.02 0.063 0.01
hTERT-HME1
Concentration (ug/ml)
DMSO 37.5 60 75 120 150
Set 1 0.421 0.565 0.839 0.252 0.255
Set 2 0.516 1.059 0.874 0.576 0.275
Set 3 0.59 1.13 0.591 0.524 0.288
AVERAGE 0.509 0.918 0.768 0.55 0.273
SEM 0.049 0.178 0.089 0.1 0.01
Percent Cell Death
Concentration (ug/ml)
37.5 60 75 120 150
Set 1 -62.47 -12.92 38.498 14.286 63.529
Set 2 -31.589 39.943 35.812 45.486 64.727
Set 3 35.763 48.584 1.015 17.176 77.083
AVERAGE -14.145 32.68 27.865 41.636 68.864
SEM 23.729 15.844 9.888 9.346 3.539
y-int -190.891
slope 50.9 IC50 114 ug/ml
R2 0.88
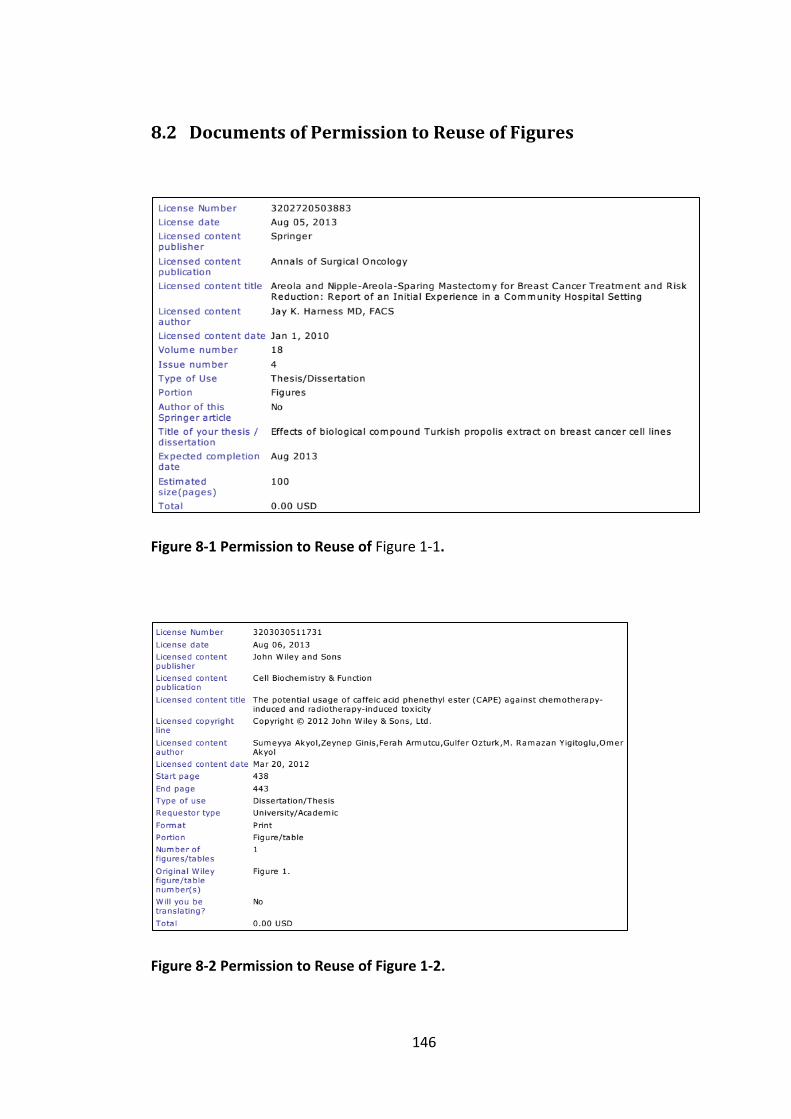
146
8.2 Documents of Permission to Reuse of Figures
Figure 8-1 Permission to Reuse of Figure 1-1.
Figure 8-2 Permission to Reuse of Figure 1-2.

147
Figure 8-3 Permission to Reuse of Figure 1-3.
Figure 8-4 Permission to Reuse of Figure 1-4.

148
Figure 8-5 Permission to Reuse of Figure 1-5.