effects of bank consolidation promotion policy: evaluating ... · pdf filedp rieti discussion...
TRANSCRIPT

DPRIETI Discussion Paper Series 04-E-004
Effects of bank consolidation promotion policy:Evaluating the Bank Law in 1927 Japan
OKAZAKI TetsujiRIETI
SAWADA MitsuruHitotsubashi University
The Research Institute of Economy, Trade and Industryhttp://www.rieti.go.jp/en/
1
RIETI Discussion Paper Series 04-E-004
Effects of bank consolidation promotion policy: Evaluating the Bank Law in 1927 Japan*
By
Michiru Sawada (Graduate School of Hitotsubashi University) Tetsuji Okazaki (The University of Tokyo and RIETI)
Abstract
In recent years, there has been a wave of bank consolidations that has spread across the world,
and bank consolidation has been one of the major issues of the research on banking and finance. This
paper explores the role of government in bank consolidations, using the data on prewar Japan. The
data on prewar Japan are useful, because not only there were numerous bank consolidations, but also
we can identify consolidations promoted by the government policy. The Bank Law of 1927 set the
minimum capital criterion for banks, which came to be a powerful measure for the government to
promote consolidations. In this paper, we identified policy-promoted consolidations referring to the
minimum capital of the bank, and examined the effects of policy-promoted consolidations in
comparison with other consolidations. It was confirmed that policy-promoted consolidations
mitigated the financial crisis by enhancing the ability of the bank to collect deposits, under the
condition that the financial system was exposed to serious negative shocks. On the other hand,
policy-promoted consolidations had negative aspects. They were accompanied by large
organizational costs, and decreased bank profitability.
JEL Classification: G21, G34, N25 Key Words: Bank, Consolidation, M&A, Regulation, Bank Law, Japan
* This paper is a product of the research project undertaken by the authors at the Research Institute of Economy, Trade and Industry (RIETI). We would like to thank Professor Yasushi Hamao, Takeo Hoshi, Anil Kashyap and other participants at the NBER Japan Project Meeting (September 2003, Tokyo) for their helpful comments and suggestions. All errors are the authors’ responsibility.
2
1.Introduction
In recent years, there has been a wave of bank consolidations that has spread across the world.
This phenomenon has been attracting the interest of researchers, financial authorities and those in the
banking industry. In fact, bank consolidation has been one of the major issues that research into
banking and finance has focused on. Research into bank consolidation progressed in the 1980s,
examining the effects on efficiency and the market power of the banks that had participated in these
consolidations, and in recent years the scope of the research has come to include wider issues, such
as the effects on the financing of small and medium-sized companies and the systemic risk on the
financial system. This research has great relevance, providing the financial authorities with the basis
to judge whether a certain consolidation application should be approved or not. Meanwhile, there is
another aspect of government intervention related to bank consolidation. That is, the government
could play a role in promoting bank consolidations. Berger et al[1999] argues that the government
could promote the consolidation of banks which are faced with difficulties or a financial crisis, based
on the case of the US Federal Deposit Insurance Corporation. In fact, the financial authorities of
Asian countries have been promoting bank consolidations since the Asian Financial Crisis in 1997,
and the Japanese government also has initiated a policy of promoting consolidations among regional
financial institutions (Berger et al.,1999; Financial Service Agency, Japan, 2002).
The idea underlying the consolidation promotion policy is that bank consolidations should
reduce the insolvency risk through asset diversification (Shih,2003). There are a number of empirical
studies which confirm a risk diversifying effect of bank consolidation whether directly or indirectly
(Hughes et al,1996,1999; Benston et al,1995; Craig and Santos,1997; Demsetzs and Strahan, 1997;
Saunders and Wilson, 1999, etc.). On the other hand, Shih[2003] points out the possibility that credit
risk could increase in the event a sound bank merges with an unsound one. Also, most of empirical
literatures suggest that bank consolidations do not significantly improve the performance and
efficiency of the participant banks (Berger et al.,1999; Amel et al.,2002). If a voluntary consolidation
does not enhance the performance of the participant banks, any performance enhancing effect of the
consolidation promoted by the government policy is more questionable.
Although the effect of policy-promoted consolidation is not obvious, there have been no
empirical studies that have directly examined the topic, to our knowledge. The first objective of this
paper is to investigate the effects of policy-promoted consolidation on the stability of the financial
system. A basic reason why research on the effects of policy-promoted consolidations has not
progressed lies in data constraints. Not only are a sufficient number of observations of bank
consolidations lacking, but it is also difficult to identify the consolidations promoted by government
policy. In order to resolve this problem, we have used the data from prewar Japan. In prewar Japan,
the government actively promoted bank consolidations in order to stabilize the financial system. As
a result, numerous bank consolidations took place in the 1920s and 1930s (Goto,1990;
3
Shiratori,2001; Okazaki and Sawada,2003). The central measure of the consolidation promotion
policy was the Bank Law of 1927, which provides us with a valuable opportunity to evaluate the
effects of the consolidation promotion policy. The Bank Law set the minimum capital of the bank,
which many banks were unable to meet. At the same time, the government did not always give its
approval to banks to increase their capital on their own. Many small banks were obliged to merge
with another bank or face liquidation. Hence, we can identify the bank consolidations promoted by
government policy by referring to the capital of the participant banks.
There is another advantage of using data from prewar Japan. Not only did many bank
consolidations take place, but these consolidations also took various pattern. Furthermore,
comprehensive information is available on the different forms of consolidation. As the pattern of
consolidation, in general, has an influence on the cost of organizational adjustment, it is necessary to
control for it to identify the effects of the consolidation promotion policy. Also, differences in the
organizational adjustment cost as determined by the pattern of consolidation is in itself an interesting
research topic. In this paper, we analyze how the pattern of consolidation influenced bank
performance.
The paper is organized as follows. Section 2 provides an overview of the process of bank
consolidations in prewar Japan. In section 3, we explain the data and methodology. Section 4
analyzes the effects of policy-promoted consolidation. In section 5, we analyze the effects of
policy-promoted consolidation in more detail, combining the information on the consolidation forms.
Section 6 concludes the paper.
2. Bank consolidation in prewar Japan: An overview
The structure of the banking industry in prewar Japan was substantially different from what it
became in the postwar period. One of the major differences was the existence of numerous banks.
This was because entry regulations had been comparatively lax until the early twentieth century. As a
result, bank exits frequently occurred through failures and consolidations. The number of banks was
as large as 2334 (1890 ordinary banks and 444 saving banks) in 1901, the peak year, and after that it
started to decline due to failures and consolidations.
The increase of bank consolidations since the early twentieth century was basically due to the
consolidation promotion policy of the government. The government recognized that the market
structure with many small banks was harmful to the stability of the financial system, and launched
its consolidation promotion policy, aiming to emulate the branch banking system of the UK. In 1901,
the government set the minimum paid-in capital (50 thousand yen) for a new bank to enter the
industry. While the government gradually raised the minimum capital required for a newcomer, it
requested local governments to promote bank consolidations.
In the 1920s, the government stepped up implementation of the consolidation promotion
4
policy, moving away from the UK branch banking system model. Specifically, in this period, the
government placed a higher priority on consolidation between banks in the same region. This policy
shift reflected the criticism leveled by local business circles that the large urban banks which
acquired regional banks, transferred funds from rural to urban areas (Shiratori,2000). In 1923, the
Ministry of Finance announced “The Policy on the Bank Regulation,” which stated that the
establishment of a new bank or bank branch would not be approved in principle, and that bank
consolidation would instead be promoted. In 1924, the Ministry of Finance again requested regional
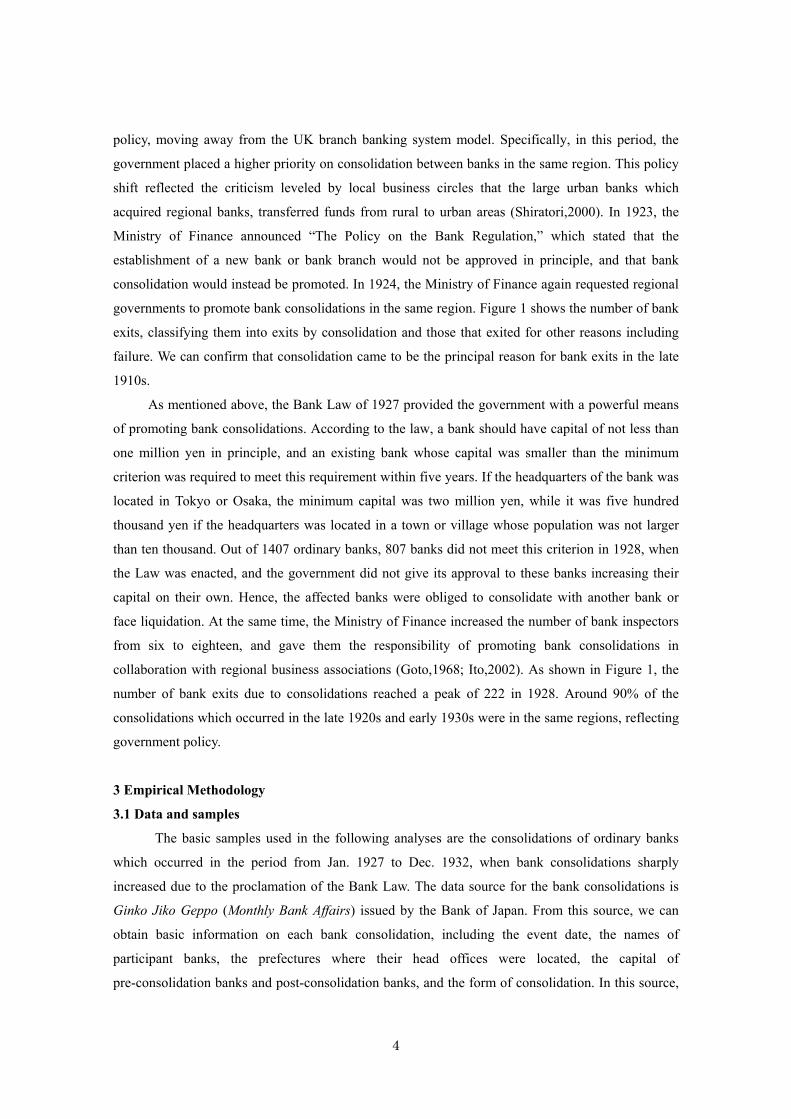
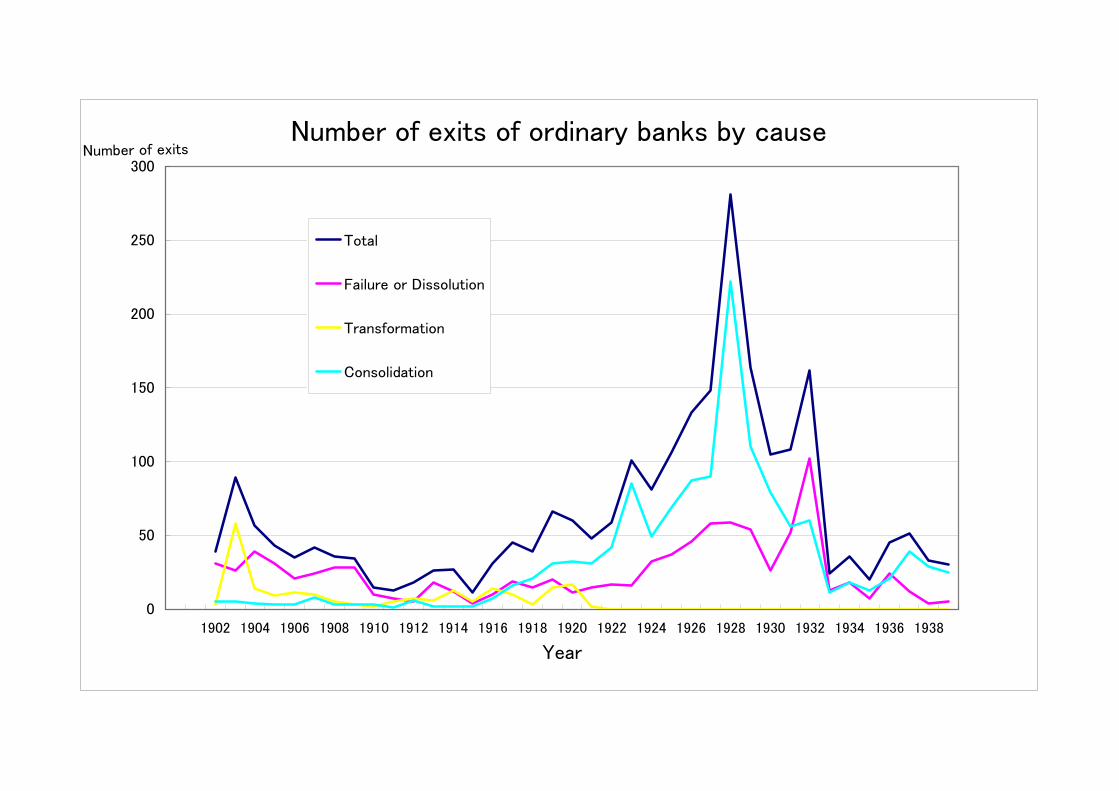
governments to promote bank consolidations in the same region. Figure 1 shows the number of bank
exits, classifying them into exits by consolidation and those that exited for other reasons including
failure. We can confirm that consolidation came to be the principal reason for bank exits in the late
1910s.
As mentioned above, the Bank Law of 1927 provided the government with a powerful means
of promoting bank consolidations. According to the law, a bank should have capital of not less than
one million yen in principle, and an existing bank whose capital was smaller than the minimum
criterion was required to meet this requirement within five years. If the headquarters of the bank was
located in Tokyo or Osaka, the minimum capital was two million yen, while it was five hundred
thousand yen if the headquarters was located in a town or village whose population was not larger
than ten thousand. Out of 1407 ordinary banks, 807 banks did not meet this criterion in 1928, when
the Law was enacted, and the government did not give its approval to these banks increasing their
capital on their own. Hence, the affected banks were obliged to consolidate with another bank or
face liquidation. At the same time, the Ministry of Finance increased the number of bank inspectors
from six to eighteen, and gave them the responsibility of promoting bank consolidations in
collaboration with regional business associations (Goto,1968; Ito,2002). As shown in Figure 1, the
number of bank exits due to consolidations reached a peak of 222 in 1928. Around 90% of the
consolidations which occurred in the late 1920s and early 1930s were in the same regions, reflecting
government policy.
3 Empirical Methodology
3.1 Data and samples
The basic samples used in the following analyses are the consolidations of ordinary banks
which occurred in the period from Jan. 1927 to Dec. 1932, when bank consolidations sharply
increased due to the proclamation of the Bank Law. The data source for the bank consolidations is
Ginko Jiko Geppo (Monthly Bank Affairs) issued by the Bank of Japan. From this source, we can
obtain basic information on each bank consolidation, including the event date, the names of
participant banks, the prefectures where their head offices were located, the capital of
pre-consolidation banks and post-consolidation banks, and the form of consolidation. In this source,

5
bank consolidations are classified into three forms, namely, absorption, acquisition and combination
into a new bank. Here, combination into a new bank refers to the form of consolidation where a new
bank is established after all of the participants are dissolved.
The information on the consolidation forms is useful because it allows us to infer the power
balance among the participants. According to Kin’yu Kenkyukai [1934], in the case where the power
of the participant banks was nearly equal, they tended to choose to combine into a new bank. On
the other hand, when one bank dominated the other participants, absorption or acquisition tended to
be the chosen path1. As Ginko Jiko Geppo distinguishes between the surviving banks and the exiting
banks after the consolidation, we can easily identify the acquirer bank and the target bank in the
absorption and acquisition.
The financial data of each bank are obtained from various issues of Ginkokyoku Nenpo (Year
Book of the Bank Bureau of the Ministry of Finance), which covers all the banks in Japan. However,
the information from this source is basically limited to balance sheet data. Since, as mentioned in the
previous section, the minimum capital set by the Bank Law depended on the location of the
headquarters of the bank, we compiled the addresses of the headquarters from Ginko Soran (The
Comprehensive List of Banks). Also, this source provides us with the address of each branch of each
bank, which was used to classify out-of-market and in-market consolidation. On the other hand, the
information on the population of the city, town or village where the headquarters of each bank was
located was obtained from Nippon Teikoku Tokei Nenkan (Statistical Year Book of the Japanese
Empire). Combining this information and the minimum capital set by the Bank Law, we can
discriminate whether each bank met the minimum capital criterion or not. We regard a consolidation
which involved at least one participant bank not meeting the minimum capital criterion as a
policy-promoted consolidation, and a consolidation where all the participants met the criterion as a
strategic consolidation.
In the rest of the paper, we examine the effects of consolidation on the bank performance by
comparing the change in performance from year T-1 to year T+2 and T+3, between the consolidated
banks and the non-consolidated banks, where T is the year when the consolidation occurred. In order
to identify the consolidation effects clearly, we exclude banks which participated in multiple
consolidations in the period from year T-2 to year T+3. There are 164 consolidation samples, in
which 393 banks were involved2. Table 1 shows the number of consolidated and non-consolidated
banks by year, where non-consolidated banks refer to those which did not participate in any
consolidation in the period from year T-2 to year T+3. The consolidations are classified into the
policy-promoted consolidations and the strategic consolidations, according to the definition stated
1 The government promoted combination into a new bank if there was no sound and leading bank among the banks undergoing consolidation (Sugiyama, 1982). 2 If we take a longer interval, we lose many consolidation samples.
6
above. Around 80% of the consolidations are classified as policy-promoted consolidations.
In Panel B to E of Table 1, we classify policy-promoted consolidations and strategic
consolidations into subcategories according to a separate set of criteria. In Panel B we add the
criteria for consolidation forms mentioned above, namely absorption, acquisition and combination
into a new bank. The additional criterion in Panel C is the number of participant banks. It is
remarkable that the ratio of one-to-one consolidation was substantially higher in the strategic
consolidations than in the policy-promoted consolidations. In panel D, we add the criteria of
in-market and out-of-market consolidation. Out-of-market consolidation refers to consolidation
where there were no branch offices overlapping in the same market among the participant banks3.
Over 75% of the total samples were in-market consolidations. It should be noted that the ratio of
in-market consolidations was substantially higher in the policy-promoted consolidations than in the
strategic consolidations, which is consistent with the fact that the government placed priority on
regional consolidations. Finally, we add the criterion of the area where the headquarters was located
after the consolidation. We distinguish between urban and rural areas. Urban areas refer to the
prefectures of Tokyo, Kanagawa, Aichi, Kyoto, Osaka and Hyogo. The proportion of consolidations
in rural areas was 75% of total samples.
3.2 Methodology
In measuring bank performance, we focus on the deposit growth rate and the return on assets
(ROA). The deposit growth rate is a performance measure closely related to the stability of the
financial system. In prewar Japan, depositors were wary of the risks associated with banks because
there was no deposit insurance system. In fact, bank runs frequently occurred in the 1920s, including
the Showa Financial Crisis in 19274. Arguably, the benefits of consolidation were potentially greater
in this situation, because the consolidation not only led to larger banks, but it also enabled the bank
to diversify its assets more extensively, which in turn decreased the risk to depositors (Hughes et
al,1996,1999; Benston et al,1995; Craig and Santos,1997; Demsetzs and Strahan, 1997; Saunders
and Wilson, 1999, etc.). On the other hand, Shih(2003) points out the possibility that when a
relatively healthy bank merges with a weak one, the post-merger bank can be a more risky
proposition than the weak one. However, his argument is based on the assumption that the average
credit risk of the two merging banks is extremely high, and this assumption cannot be applied to the
3 The unit of a market here is a city or a county. 4 Yabushita and Inoue [1993] established that if a bank was in poor financial condition this increased the probability of closure during the Showa Financial Crisis in 1927, and argued that the selection through market mechanism worked efficiently and there was no self-fulfilling run on the banks. On the other hand, Korenaga et al. [2001] split the period of the Showa Financial Crisis into two sub-periods, and confirmed that while in the first sub-period there was no self-fulfilling runs, the bank runs in the second sub-period were self-fulfilling.
7
situation of the banking industry in prewar Japan, even in the 1920s and 1930s5.
ROA has been used by a number of researchers to ascertain the effect of consolidation, but
the results are mixed (Berger and Humphrey, 1992; Cornett and Tehranian, 1992; Linder and Crane,
1992; Piloff, 1996; Rodes 1998). In addition, many of our consolidation samples are
policy-promoted ones, which were not always carried out as a result of strategic incentives. Hence, it
is inconceivable that consolidations would have a positive effect on ROA. One problem with ROA is
that it reflects both market power and efficiency (Akhavein et al, 1997; Berger et al,.1999). Although
ideally both the change in the profitability ratio and profit efficiency should be analyzed, we focus
on the former due to data constraints. However, as stated below, we found that consolidations had a
negative effect on ROA, which indicates that consolidations led to inefficiencies, and that it
dominated the effect of increased market power, if any. In this sense, the problem of market power
was not particularly serious.
In order to measure the effect of the consolidation, we estimate equation (1) by OLS. We
pool all the samples, using year dummies to control for the shocks common to the samples of the
same year. Also, the heteroskedasticity-robust standard error by White (1980) is used to calculate
statistical significance.
iiiii URBANBRANCHASSETLNCONSX 43210 )( βββββ +∆+++= (1)
where the dependent variable iX is the difference of ROA or deposit growth rate in the period from
year T-1 to year T+2 orT+36. For the value of a consolidated bank in year T-1, that of a pro-forma
bank is used. CONS is the dummy variable which equals 1 if the bank was a merged one, and 0,
otherwise. We are especially interested in the coefficient of this variable. If the consolidation had a
positive effect on the bank performance, the coefficient is expected to be positive with respect to
both dependent variables. LN(ASSET) is the natural log of the total assets in year T-1, and is
expected to capture the economies of scale. �BRANCH denotes the change in the number of
branches. In the case where the dependent variable is ROA, we expect this variable to capture the
effect of restructuring inefficient branches, since the government in principle prohibited the opening
of new branches from the early 1920s. If effective restructuring was accomplished, the sign of this
coefficient will be negative. With respect to deposit growth rate, the coefficient of �BRANCH is
expected to be positive, because, in general, the correlation between ability to collect deposits and
the number of branches is positive. URBAN is the dummy variable which equals 1, where the
headquarters of the bank was located in an urban area, in the sense defined in Section3, and 0,
5 He supported the assumption upon which his model was based, showing that even in late 1998 the non-performing loan ratio at Indonesian banks was still 50-100%. 6 Since consolidations were often accompanied by asset reevaluation, we adjust the assets of the post-consolidation bank in the following way. ASSETT+i=ASSETT-1 +(ASSETT+i-ASSETT), i=2, 3
8
otherwise. In the equation where the deposit growth rate is the dependent variable, the coefficient of
URBAN is expected to be positive, since it is known that there was a tendency for funds to flow
from rural areas to urban areas after the 1900s (Okazaki,1993; Shiratori,2000).
Table 2 shows the basic statistics on the pre-consolidation banks. With respect to absorption
and acquisition, we split samples into the acquirer banks and target banks. According to the table, the
acquirer banks were larger in terms of assets than the other banks. Also, the loan-deposit ratio
(Loan/Deposits) of the acquirer banks was lower. On the other hand, the target banks and
participants who combined into a new bank had relatively high ROA, which arguably reflects that
those banks were more or less monopolistic in the segmented local markets.7
4 The effects of policy-promoted consolidation
In this section, we examine the effects of policy-promoted consolidation on bank performance
as a way of revealing the effect of the Bank Law of 1927. Table 3 shows the result of OLS
estimation of Equation (1) with the deposit growth rate as the dependent variable. Column 1 and 3
show the results of the performance change from T-1 to T+2, and column 2 and 4 show those from
T-1 to T+3. According to column 1, the coefficient of the consolidation dummy is positive and
statistically significant at the 1% level. It implies that the consolidated banks could collect 6.5%
more deposits than the non-consolidated banks. Since the sample period includes the Showa
Financial Crisis in 1927 and the financial system did not have a deposit insurance system, the
depositors were expected to be aware of any risks associated with the bank. The positive coefficient
of the consolidation dummy arguably reflects the fact that the consolidation was seen by depositors
as reducing credit risk. The coefficient of LN (ASSET) is also positive and statistically significant,
which is consistent with our interpretation based on the risk-averse behavior of the depositors.
URBAN has no significant impact on the deposit growth rate. Hence, there is no evidence of [fund
flight][funds flowing] from local to urban areas, as was pointed out by former studies. The
coefficient of �BRANCH is, as expected, positive and statistically significant at the 1% level,
indicating that branches played a significant role in collecting deposits8. Column 2 shows the same
result qualitatively as that in column 1, whereas the magnitude and statistical significance of the
coefficient of the consolidation dummy is slightly smaller, and the coefficient of LN(ASSET) is
larger.
In column 3 and 4, we split the consolidations into policy-promoted consolidations and
strategic ones in order to identify the effect of consolidation promotion policy. These results show
7 Imuta (1976) and Teranish (1982) pointed out that while small-sized banks had market power in segmented country areas to some extent, medium-sized banks were frequently exposed to competition with large banks in urban areas. 8 Based on the deposit and loan data of Mitsubishi Bank by branch, Okazaki [2002b] shows that the increase of the branches in the 1920s and 1930s contributed to the increase of deposits.
9
that while the coefficient of the policy-promoted consolidation dummy is positive and statistically
significant, that of the strategic consolidation is positive but not significant. Moreover, the
magnitude of these coefficients are larger in the former than those in the latter. Hence, we can say
that the deposit growth rate went up, particularly when the consolidation was promoted by
government policy.
In order to explore the reason for the positive effect of the consolidation on the deposit
growth in more detail, we conducted a cross section analysis. That is, we estimated Equation (1) by
event year. The result where the performance change was measured from one year before the
consolidation to one year after the consolidation, is shown in panel A. Panel B and C show the
results where the performance change was measured from one year before the consolidation to two
and three years after the consolidation, respectively. According to these panels, the consolidations in
1927, when the Showa Financial Crisis occurred, had a strong positive effect on the deposit growth
rate. Those banks which consolidated in 1927 collected over 20% more deposits than the
non-consolidated banks. Also, the consolidations in 1928 had a positive effect on deposit growth,
although it was relatively small. On the other hand, the consolidations which occurred in the period
from 1929 to 1932 had no statistically significant effect. In other words, the positive effect of the
consolidation on the deposit growth was observed only in the period when the financial system was
especially unstable. This can be interpreted as being the risk-averse behavior of depositors that was
spurred by the financial crisis and which thus gave a premium to the consolidation. While not
reported, we estimated equation (1) using a policy promotion consolidation dummy and strategic
consolidation dummy with respect to the years 1927 and 1928 to confirm that the positive effect was
especially large for policy-promoted consolidation.
One interpretation of the larger effect of the policy-promoted consolidation is that the
policy-promoted consolidation aimed at rescuing financially distressed banks. Actually, comparing
the average loan deposit ratio between the acquiring banks and the acquired banks with respect to the
participants in policy-promoted consolidations, we find that the ratio of the former was 1.19, while
that of the latter was 1.51. In other words, the liquidity position of the acquired banks was extremely
bad. On the other hand, with respect to strategic consolidations, the average loan deposit ratio of the
acquiring banks was 1.00, while that of the acquired banks was 1.18, indicating that the liquidity
position of the acquired banks was not so bad. Hence, we can infer that strategic consolidations
rarely contributed to the rescue of financially distressed banks. In addition, according to Goto (1991),
in order to rescue small and weak banks, the Ministry of Finance actively coordinated consolidations
collaborating with bank managers and leading figures of local business circles. In summary, we can
conclude that the consolidations promoted by the Bank Law mitigated the financial crisis.
Next, we examine the effect of the consolidation on bank profitability. Table 5 shows the
results of OLS estimation of Equation (1) with the change of ROA as the dependent variable. As
10
shown in columns 1 and 2, the consolidation dummy is negative and statistically significant, which
means that the consolidation had a negative effect on bank profitability9. Since, as stated above, the
consolidation would more or less increase market power, the negative effect suggests that the
consolidation was accompanied by inefficiencies. This is not surprising, because most of the
literature on the bank consolidations in the 1980s and 1990s reject any significantly positive effect of
consolidations on profitability and efficiency (Berger et al.1999; Amel et al.,2002).
Meanwhile, LN(ASSET) and URBAN had a positive effect on ROA10. On the other hand, the
coefficient of �BRANCH is, contrary to our expectation, positive and statistically significant at the
1% level. It is possible that those banks whose profitability declined were obliged to decrease the
number of branches, however, the positive effect of restructuring branch networks was not large
enough to offset that correlation.
Finally, we focus on the effect of the policy-promoted consolidation on ROA. As shown in
column 3 and 4, the coefficient of the policy-promoted consolidation dummy is negative and
statistically significant. On the other hand, that of the strategic consolidation dummy is positive,
although it is not significant. These results imply that we can attribute the negative effect of the
consolidation on ROA to policy-promoted consolidation.
5 Patterns of consolidation and bank performance.
In the previous section, we confirmed that policy-promoted consolidation had a positive
effect on the deposit growth rate, and that it had a negative effect on ROA, which suggests that some
inefficiencies occurred. In this section, we investigate what caused these results in more detail. For
this purpose, we focus on the three patterns of consolidation that are relevant to bank performance.
That is, (1) the forms of consolidation (absorbing consolidations/mergers of equals), (2) the number
of participant banks, and (3) in-market consolidations/out-of-market consolidations. Then, we split
9 Since we did not include the banks which exited through failures and dissolutions, in estimating Equation (1), it is possible that the estimation results are affected by the sample selection bias. Therefore, we also estimated the sample selection model by the maximum likelihood method, where the explanatory variables of selection equation are reserve deposit ratio, loan deposit ratio, capital deposit ratio, log of assets, year dummy and area dummy. According to the sample selection estimation, the bank consolidation still had a positive impact on the growth rate of deposits. Also the coefficient of CONS is larger in magnitude and statistically more significant, compared with the OLS estimation. On the other hand, as for the change of ROA, the coefficient of CONS is still negative and slightly larger in absolute value. Moreover, when we use two step method by Heckman (1979), the results are not varied qualitatively in comparison with the OLS estimation. 10 The fact that the bank scale had a positive effect on ROA indicates the potential benefit of consolidations. Since in our estimation the value of a pro-forma bank is used with respect to the merged banks, the scale effect of the consolidation is controlled for. We also estimated equation (1) using the average value of assets of participant banks instead of a pro-forma value. In this case, as expected, the consolidation had a greater positive effect on the deposit growth rate, and a smaller negative effect on ROA.

11
policy-promoted and strategic consolidation into sub-categories based on these patterns.
(1) The form of consolidation. Integration of different organizations is generally
accompanied by coordination costs. The magnitude of the cost is likely to depend on the form of the
consolidation. Berger et al. (1999) points out that the reason why cost efficiency was not improved
by the consolidations in the 1980s was that the gains of the consolidation were offset by such
coordination costs as difficulties in managing large organizations, conflicts between different
corporate cultures, and problems in integrating systems. Compared with an absorbing consolidation,
coordination costs are expected to be higher in the case of mergers of equals, because in the latter
situation a dominant participant and leadership is lacking11. Here, we regard absorptions and
acquisitions as described in Ginko Jiko Geppo as absorbing consolidations, and regard the
combination into a new bank as a merger of equals.
(2) The number of participants (one-to-one consolidation versus consolidation with more
than two participants). In general, the more participants there are, the more difficult it is to integrate
organizations12. (3) In-market consolidation versus out-of-market consolidation. It has been pointed
that geographic expansion of the business area and branch network reduces the risk of bank
insolvency (Hughes et al, 1999). On the other hand, it is likely that in-market consolidation may
enhance profitability through restructuring inefficient branches and increasing market power (Berger
and Humphrey, 1992 etc.).
Combining the criteria (1)-(3) with the classification distinguishing between policy-promoted
consolidations and the strategic consolidations, we arrive at twelve subcategories of consolidation
patterns. We estimate equation (1), using the dummy variable which denotes each consolidation
pattern subcategory. Table 6 shows the estimated results. In columns 1 through 6, the dependent
variable is the change of ROA. In columns 1 and 2, we classify each of the policy-promoted
consolidations and strategic consolidations into either absorbing consolidations or mergers of equals.
With respect to policy-promoted consolidations, while both coefficients of absorbing consolidations
and mergers of equals are negative, the latter is larger in absolute value and the statistical
significance is relatively high. With respect to strategic consolidations, the coefficients of
absorbing consolidations and mergers of equals are positive in most cases, although they are not
statistically significant. These results indicate that it was the policy-promoted and mergers of equals
that suffered from a deterioration in profitability.
In columns 3 and 4, we focus on criterion (2) as well as on the criterion for
11 According to Sugiyama[1982], since the banks established through a combination into a new bank were faced with difficulties in determining new directors, they frequently invited outsiders. 12Sanwa Bank [1974] describes the internal conflicts which Sanwa Bank suffered immediately following the consolidation in 1933. Sanwa Bank, the predecessor to UFJ Bank, was established thorough a consolidation of three large banks.
12
policy-promoted/strategic consolidations. With respect to policy-promoted consolidations, both
coefficients of one-to-one consolidations and consolidations with more than two participants are
negative and the absolute value and statistical significance are markedly higher in the latter. On the
other hands, with respect to strategic consolidations, neither of the coefficients is statistically
significant.
It should be noted that policy-promoted consolidations did not always hurt profitability.
Policy-promoted consolidations damaged profitability where there was no dominant participant, or
where more than two banks participated in the consolidation. On the other hand, with respect to
strategic consolidations, there is no evidence that profitability declined for this form of consolidation.
One possible interpretation of these results is as follows. Some of the policy-promoted
consolidations were carried out with the aim of getting over the immediate crisis but lacked a
strategic vision regarding the new organization. Hence, after the consolidation, the merged banks
suffered from the various organizational problems mentioned above. Also, these problems were
especially serious where there was no dominant participant, or where more than two banks
participated in the consolidation.
In columns 5 and 6, we focus on criterion (3) as well as on the criterion for
policy-promoted/strategic consolidations. With respect policy-promoted consolidations, in-market
consolidations had an especially large negative effect on profitability. On the other hand, strategic
and in-market consolidations did not have a significant negative effect on profitability. Arguably, the
different effects of in-market consolidation reflect the difference in restructuring of the branch
network. Actually, although not reported, we confirmed that the coefficient of the interaction terms
between CONS and �BRANCH was negative and statistically significant when we estimated
equation (1) by adding this variable. Furthermore, while the number of the branches for
policy-promoted consolidations decreased by 0.86 (1.16) on average by two (three) years after the
consolidation, it decreased by 3.27 (3.41) for strategic consolidations. Hence, we can say that in the
case of policy-promoted consolidation, effective restructuring of the branches failed to occur.
The same analyses can be performed regarding deposit growth rate, but here we focus only on
the criterion for in-market and out-of-market consolidations. This is because whereas this
classification is directly related to the risk of insolvency through a diversification of the loan
portfolio, the form of consolidation and the number of participants appears to have no direct
relevance. Columns 7 and 8 show the estimated results. All of the consolidation dummies have
positive coefficients, but the magnitude and statistical significance differ markedly among the four
patterns. In particular, in the case of policy-promoted and out-of-market consolidations, the
magnitude of the coefficient is large. Namely, the banks that underwent this form of consolidation
gathered over 10% more deposits than the non-merged banks. This result that out-of market
consolidation had an especially large positive effect on the deposit growth is consistent with the risk
13
averse behavior of depositors.
6 Concluding Remarks
In prewar Japan, the banking industry was composed of many small banks, which led to
unstable financial systems. The Ministry of Finance promoted bank consolidations based on the
minimum capital criterion for banks set by the Bank Law of 1927. After the Law was enacted in
1928, there was a surge of bank consolidations. This event provides us with a valuable opportunity
to explore the effects of the consolidation promotion policy. .
In this paper, we identified bank consolidations that happened as a result of government
policy by referring to the minimum capital of the bank, and examined the effects of policy-promoted
consolidations in comparison with other consolidations. It is confirmed that policy-promoted
consolidations had a substantial positive effect on deposit growth. In addition, the positive effect was
especially large in 1927 and 1928, when the financial system was faced with a major crisis. On the
other hand, with respect to profitability, policy-promoted consolidations had a negative effect,
especially in the case where many banks were involved in the consolidation, where there was no
dominant participant, or where the participant banks had operated in the same market. From these
results, we can conclude that policy-promoted consolidations mitigated the financial crisis by
enhancing the ability of the bank to collect deposits, under the condition that the financial system
was exposed to serious negative shocks. However, we should also acknowledge the negative aspects
of policy-promoted consolidations. They were accompanied by large organizational costs, and
decreased bank profitability.
References Akhavein,J.D., A.N. Berger., Humphrey,D.B., [1997] “The effect of mega mergers on efficiency and
prices: Evidence from a bank profit function,” Review of Industrial Organization vol.12, 95-139
Amel,D., C. Barnes, F. Panetta, and C. Salleo [2002] “Consolidation and efficiency in the financial
sector; A review of international evidence,” Journal of banking and Finance forthcoming. Benston,G.J., W.C.,Hunter, and L.,D. Wall [1995] “ Motivation for bank mergers and
acquisitions:Enhancing the deposit insurance put option versus earnings diversification,” Journal of Money, Credit and Banking 27-3, 777-788
Berger,A.N.,R.S.Demsetz.and P.E.Strahan [1999] “The Consolidation of the financial services
industry ;Causes, consequences, and implications for the future,” Journal of Banking and Finance 23, 135-194
Berger,A.N. and Humphrey,D.B. [1992] “Megamergers in banking and the use of cost efficiency as
an antitrust defense,” Antitrusut Bulletin 37 541-600
14
Cornett,M.M. and H. Tehranian [1992] “Changes in corporate performance associated with bank
acquisitions,” Journal of Financial Economics 31, 211-234 Craig,B. and J. Santos [1997] “The risk effect of bank acquisitions,” Economic Review – Federal
Reserve Bank of Cleveland 33, 25-35. Demsetz,R.A. and P.E. Strahan [1997] “Diversification, size and risk at bank holding companies,”
Journal of Money, Credit and Banking 29, 300-313 Financial Service Agency, [2002] Koho Kona (The Public-Relation Press) Vol.23 Financial Service
Agency
Goto,S. [1968], Honpou Ginko Godo-Shi (History of bank consolidation in Japan). Kin’yu Zaisei Jijyo Kenkyuukai
Goto, S. [1991]. Ginko Godo no Jisshoteki Kenkyu (Empirical Studies on Bank Mergers) Tokyo: Nihon Keizai Hyoronsha. Hughes,J.P., W. Lang, L.J. Mester and C.G. Moon [1996] “Efficient banking under interstate
branching,”.Journal of Money, Credit and Banking 28, 1043-1071 Hughes,J.P., W. Lang, L.J. Mester and C.G. Moon[1999] “The dollar and sense of bank
consolidation,” Journal of Banking and Finance 23, 291-324 Imuta,T. [1980] “Ninon no shinyo kozo no saihen to chiho ginko” (Reorganization of the financial
structure and regional banks in Japan) T. Asakura ed. Ryotaisenki ni okeru kin’yu kozo (Financial structure during the two world wars) Ochanomizu Shobo
Ito,M. [2002] “Showa Shonen no Kin’yu Kiki” (The financial crisis in the beginning years of the
Showa Era,) IMES Discussion Paper Series 2001-J-24, Institute for monetary and economics studies, Bank of Japan.
Kin’yu Kenkyukai [1934] Waga kuni ni okeru giko godo no taisei (The trend of bank mergers in
Japan) Kin’yu Kenkyukai. Korenage,T., T. Nagase. and J. Teranishi [2001] “1927 nen Kin’yu kyoko kano yokin
toritsuke: Ginko kyugyo nikansuru suryo bunseki,”(The quantitative analysis on
bank closures and runs under the Showa Financial Crisis) Keizai Kenkyu (The
Economic Review) Vol.52, 315-332
Linder,J.C. and D.B. Crane [1992] ”Bank mergers: Integration and profitability” Journal of
Financial Services Research 7:35-55 Okazaki,T. [1993] “Senkanki no kin’yu kozo henka to kin’yu kiki,” (Change of the financial
structure and financial crisis between the two world wars) Keiza Kenkyu(The Economic Review)44-4, 300-310.
Okazaki,T. [2002] “Mitsubishi Ginko no shiten tenkai to shikin junkan: 1928-1942,” (The branch network and money flow of Mitsubishi Bank: 1928-42). Mitsubishi Shiryokan Ronshu (Mitsubishi Archives Review) 3, 1-29.

15
Okazaki,T. and M. Sawada [2003] “ Ginko togo to kin’yu shisutemu no anteisei,” (Bank consolidation and the stability of the financial system) Shakai Keizai Shigaku (Socio-Economic History) 69-3, 25-46
Pilloff,S.J.[1996] “Performance changes and shareholder wealth creation associated with mergers of
publicly traded banking institutions,” Journal of Money, Credit and Banking 28, 294-310 Rhoades,S.A.[1998] “The Efficiency effects of bank mergers: An overview of case studies of nine
mergers,” Journal of Banking and Finance 22, 273-291 Saunders,A. and B. Wilson [1999] “The impact of consolidation and safety-net support on Canadian,
US and UK banks:1893-1992,” Journal of Banking and Finance 23, 537-571 Shih, S.H.M. [2003] “An investigation into the use of mergers as a solution for the Asian banking
sector crisis,” The Quarterly Review of Economics and Finance 43 31-49 Sanwa Bank [1933] Sanwa Ginko no Rekishi (The History of Sanwa Bank). Sanwa Bank. Shiratori,T. [2000] “Ryotaisennki ni okeru ginko godo seisaku no keisei to henyo,” (Formation and
change of bank merger policy during the two world wars) Shakai Keizai Shigaku (Socio-Economic History) 66-3, 63-84.
Shiratori,T. [2002] “1920 nendai niokeru ginko kisei no keisei,” (Formation of bank regulations in
the 1920s) Keiei Shigaku (Business History) 36-3, 25-50. Sugiyama,K. [1982] “Chiho ginko godo no jinteki sokumen,” (Personnel aspect of the local-bank
mergers ) K.,Henmi ed. Keizai hatten to kin’yu (Economic development and finance) Sobunsha
Teranishi,J [1982] Nihon no keizai hatten to kin’yu (The Japanese economic development and
finance ). Iwanami Shoten. White[1980] “A heteroscedasticity-consistent covariance matrix and direct test for
heteroscedasticity,” Econometrica 48, 817-838 Yabushita,S.and A. Inoue. [1993] “The Stability of the Japanese financial system: A historical
perspective,” Journal of the Japanese and International Economies 7, 387-407.
Number of exits of ordinary banks by cause
0
50
100
150
200
250
300
1902 1904 1906 1908 1910 1912 1914 1916 1918 1920 1922 1924 1926 1928 1930 1932 1934 1936 1938
Year
Number of exits
Total
Failure or Dissolution
Transformation
Consolidation
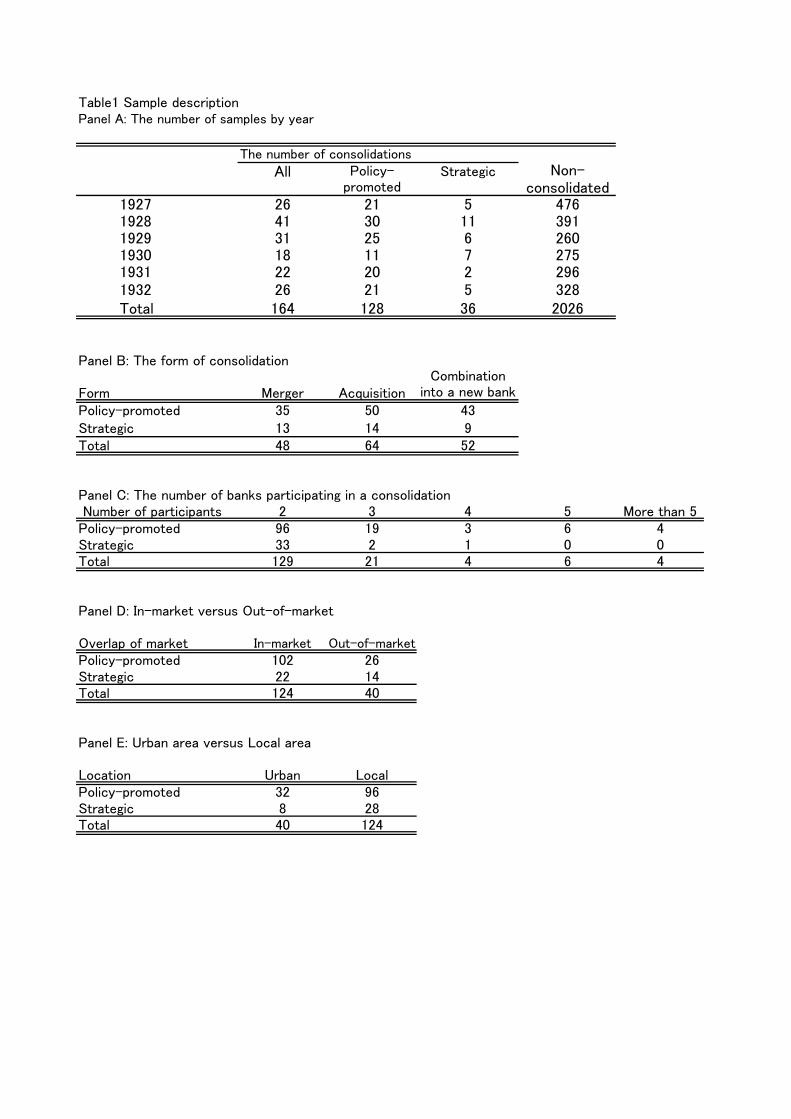
Table1 Sample description Panel A: The number of samples by year
The number of consolidations
All Strategic
1927 26 21 5 4761928 41 30 11 3911929 31 25 6 2601930 18 11 7 2751931 22 20 2 2961932 26 21 5 328Total 164 128 36 2026
Panel B: The form of consolidation
Form Merger AcquisitionPolicy-promoted 35 50 43Strategic 13 14 9Total 48 64 52
Panel C: The number of banks participating in a consolidation Number of participants 2 3 4 5 More than 5Policy-promoted 96 19 3 6 4Strategic 33 2 1 0 0Total 129 21 4 6 4
Panel D: In-market versus Out-of-market
Overlap of market In-market Out-of-marketPolicy-promoted 102 26Strategic 22 14Total 124 40
Panel E: Urban area versus Local area
Location Urban LocalPolicy-promoted 32 96Strategic 8 28Total 40 124
Non-consolidated
Combinationinto a new bank
Policy-promoted
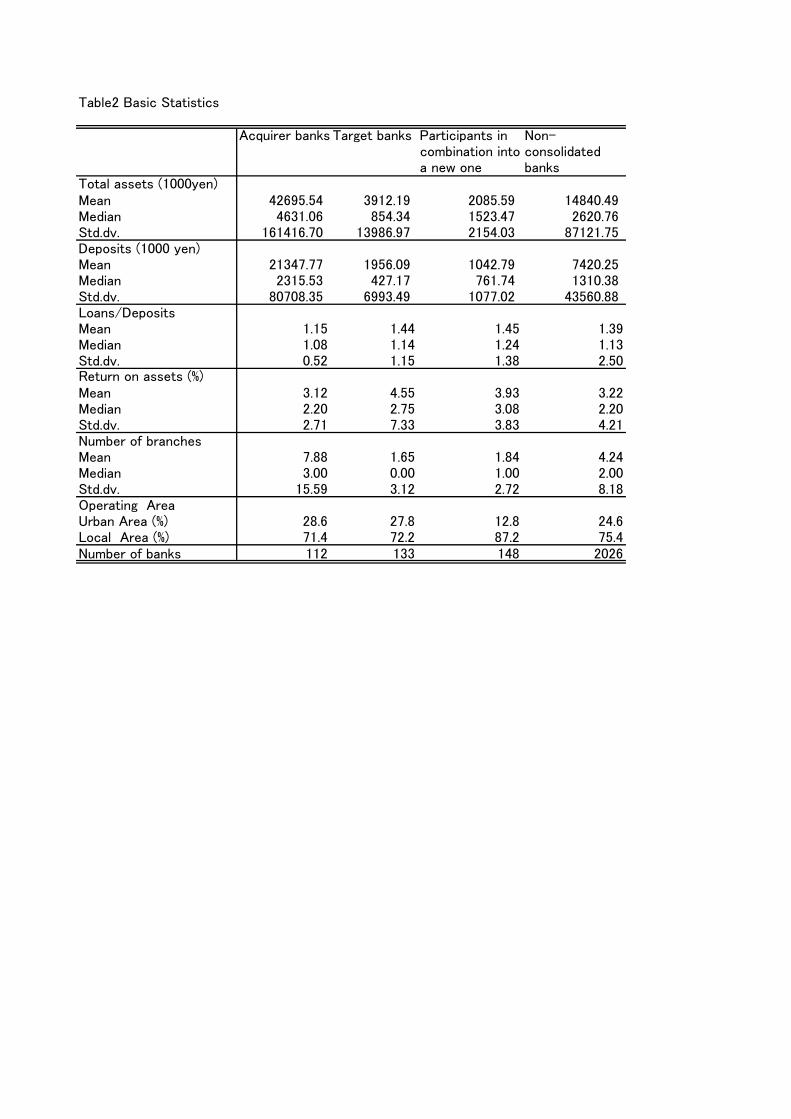
Table2 Basic Statistics
Acquirer banks Target banks Participants incombination intoa new one
Non-consolidatedbanks
Mean 42695.54 3912.19 2085.59 14840.49Median 4631.06 854.34 1523.47 2620.76Std.dv. 161416.70 13986.97 2154.03 87121.75Deposits (1000 yen)Mean 21347.77 1956.09 1042.79 7420.25Median 2315.53 427.17 761.74 1310.38Std.dv. 80708.35 6993.49 1077.02 43560.88Loans/DepositsMean 1.15 1.44 1.45 1.39Median 1.08 1.14 1.24 1.13Std.dv. 0.52 1.15 1.38 2.50
Mean 3.12 4.55 3.93 3.22Median 2.20 2.75 3.08 2.20Std.dv. 2.71 7.33 3.83 4.21Number of branchesMean 7.88 1.65 1.84 4.24Median 3.00 0.00 1.00 2.00Std.dv. 15.59 3.12 2.72 8.18Operating AreaUrban Area (%) 28.6 27.8 12.8 24.6Local Area (%) 71.4 72.2 87.2 75.4Number of banks 112 133 148 2026
Total assets (1000yen)
Return on assets (%)
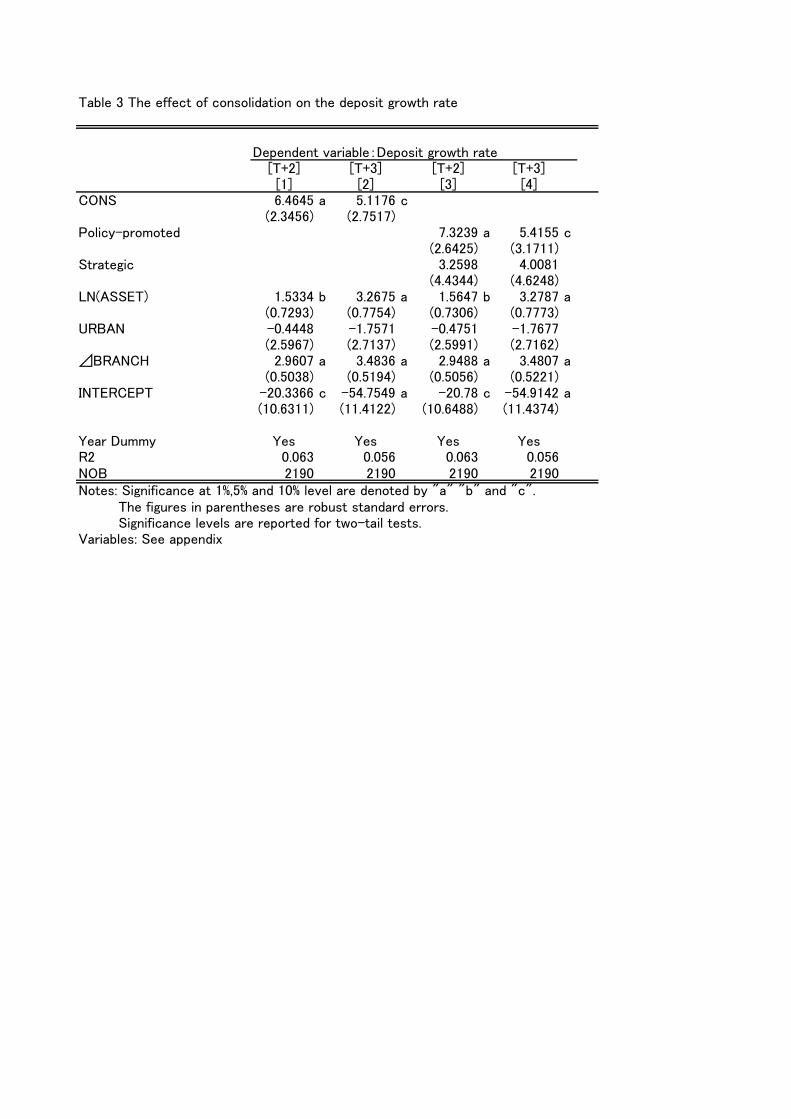
Table 3 The effect of consolidation on the deposit growth rate
Dependent variable:Deposit growth rate [T+2] [T+3] [T+2] [T+3][1] [2] [3] [4]
CONS 6.4645 a 5.1176 c(2.3456) (2.7517)
Policy-promoted 7.3239 a 5.4155 c(2.6425) (3.1711)
Strategic 3.2598 4.0081(4.4344) (4.6248)
LN(ASSET) 1.5334 b 3.2675 a 1.5647 b 3.2787 a(0.7293) (0.7754) (0.7306) (0.7773)
URBAN -0.4448 -1.7571 -0.4751 -1.7677(2.5967) (2.7137) (2.5991) (2.7162)
⊿BRANCH 2.9607 a 3.4836 a 2.9488 a 3.4807 a(0.5038) (0.5194) (0.5056) (0.5221)
INTERCEPT -20.3366 c -54.7549 a -20.78 c -54.9142 a(10.6311) (11.4122) (10.6488) (11.4374)
Year Dummy Yes Yes Yes YesR2 0.063 0.056 0.063 0.056NOB 2190 2190 2190 2190Notes: Significance at 1%,5% and 10% level are denoted by "a" "b" and "c". The figures in parentheses are robust standard errors. Significance levels are reported for two-tail tests.Variables: See appendix
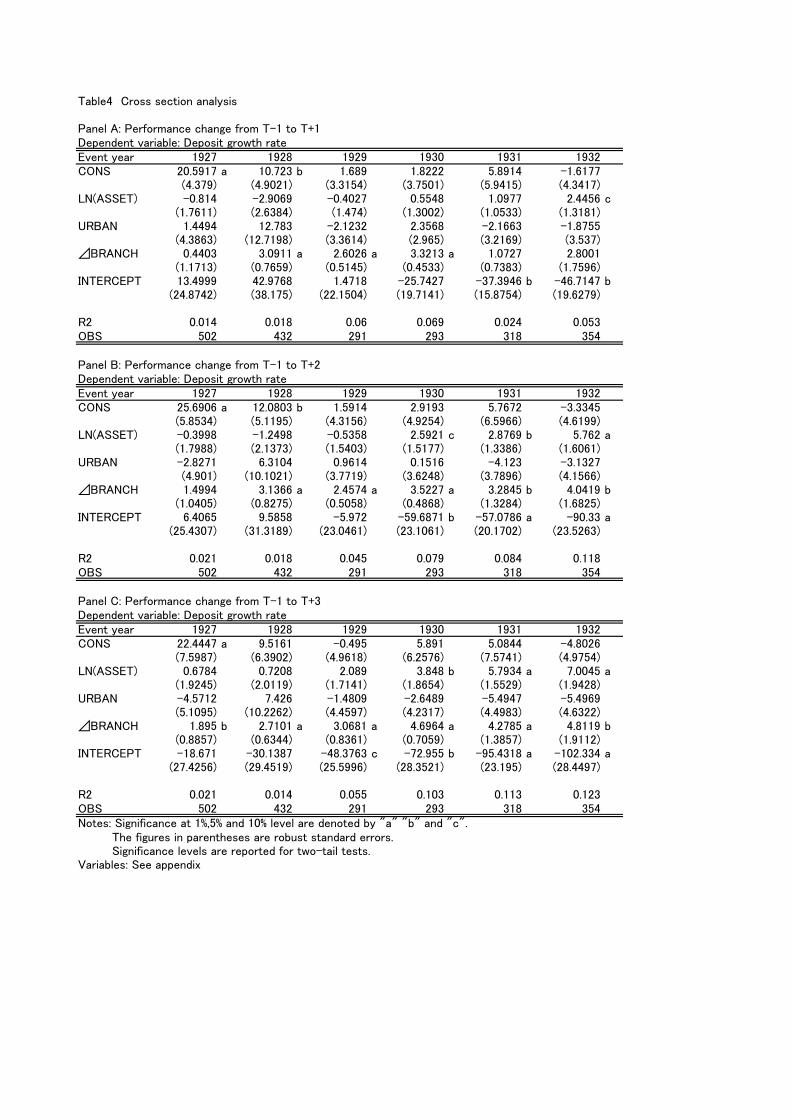
Table4 Cross section analysis
Panel A: Performance change from T-1 to T+1Dependent variable: Deposit growth rateEvent year 1927 1928 1929 1930 1931 1932CONS 20.5917 a 10.723 b 1.689 1.8222 5.8914 -1.6177
(4.379) (4.9021) (3.3154) (3.7501) (5.9415) (4.3417)LN(ASSET) -0.814 -2.9069 -0.4027 0.5548 1.0977 2.4456 c
(1.7611) (2.6384) (1.474) (1.3002) (1.0533) (1.3181)URBAN 1.4494 12.783 -2.1232 2.3568 -2.1663 -1.8755
(4.3863) (12.7198) (3.3614) (2.965) (3.2169) (3.537)⊿BRANCH 0.4403 3.0911 a 2.6026 a 3.3213 a 1.0727 2.8001
(1.1713) (0.7659) (0.5145) (0.4533) (0.7383) (1.7596)INTERCEPT 13.4999 42.9768 1.4718 -25.7427 -37.3946 b -46.7147 b
(24.8742) (38.175) (22.1504) (19.7141) (15.8754) (19.6279)
R2 0.014 0.018 0.06 0.069 0.024 0.053OBS 502 432 291 293 318 354
Panel B: Performance change from T-1 to T+2Dependent variable: Deposit growth rateEvent year 1927 1928 1929 1930 1931 1932CONS 25.6906 a 12.0803 b 1.5914 2.9193 5.7672 -3.3345
(5.8534) (5.1195) (4.3156) (4.9254) (6.5966) (4.6199)LN(ASSET) -0.3998 -1.2498 -0.5358 2.5921 c 2.8769 b 5.762 a
(1.7988) (2.1373) (1.5403) (1.5177) (1.3386) (1.6061)URBAN -2.8271 6.3104 0.9614 0.1516 -4.123 -3.1327
(4.901) (10.1021) (3.7719) (3.6248) (3.7896) (4.1566)⊿BRANCH 1.4994 3.1366 a 2.4574 a 3.5227 a 3.2845 b 4.0419 b
(1.0405) (0.8275) (0.5058) (0.4868) (1.3284) (1.6825)INTERCEPT 6.4065 9.5858 -5.972 -59.6871 b -57.0786 a -90.33 a
(25.4307) (31.3189) (23.0461) (23.1061) (20.1702) (23.5263)
R2 0.021 0.018 0.045 0.079 0.084 0.118OBS 502 432 291 293 318 354
Panel C: Performance change from T-1 to T+3Dependent variable: Deposit growth rateEvent year 1927 1928 1929 1930 1931 1932CONS 22.4447 a 9.5161 -0.495 5.891 5.0844 -4.8026
(7.5987) (6.3902) (4.9618) (6.2576) (7.5741) (4.9754)LN(ASSET) 0.6784 0.7208 2.089 3.848 b 5.7934 a 7.0045 a
(1.9245) (2.0119) (1.7141) (1.8654) (1.5529) (1.9428)URBAN -4.5712 7.426 -1.4809 -2.6489 -5.4947 -5.4969
(5.1095) (10.2262) (4.4597) (4.2317) (4.4983) (4.6322)⊿BRANCH 1.895 b 2.7101 a 3.0681 a 4.6964 a 4.2785 a 4.8119 b
(0.8857) (0.6344) (0.8361) (0.7059) (1.3857) (1.9112)INTERCEPT -18.671 -30.1387 -48.3763 c -72.955 b -95.4318 a -102.334 a
(27.4256) (29.4519) (25.5996) (28.3521) (23.195) (28.4497)
R2 0.021 0.014 0.055 0.103 0.113 0.123OBS 502 432 291 293 318 354Notes: Significance at 1%,5% and 10% level are denoted by "a" "b" and "c". The figures in parentheses are robust standard errors. Significance levels are reported for two-tail tests.Variables: See appendix
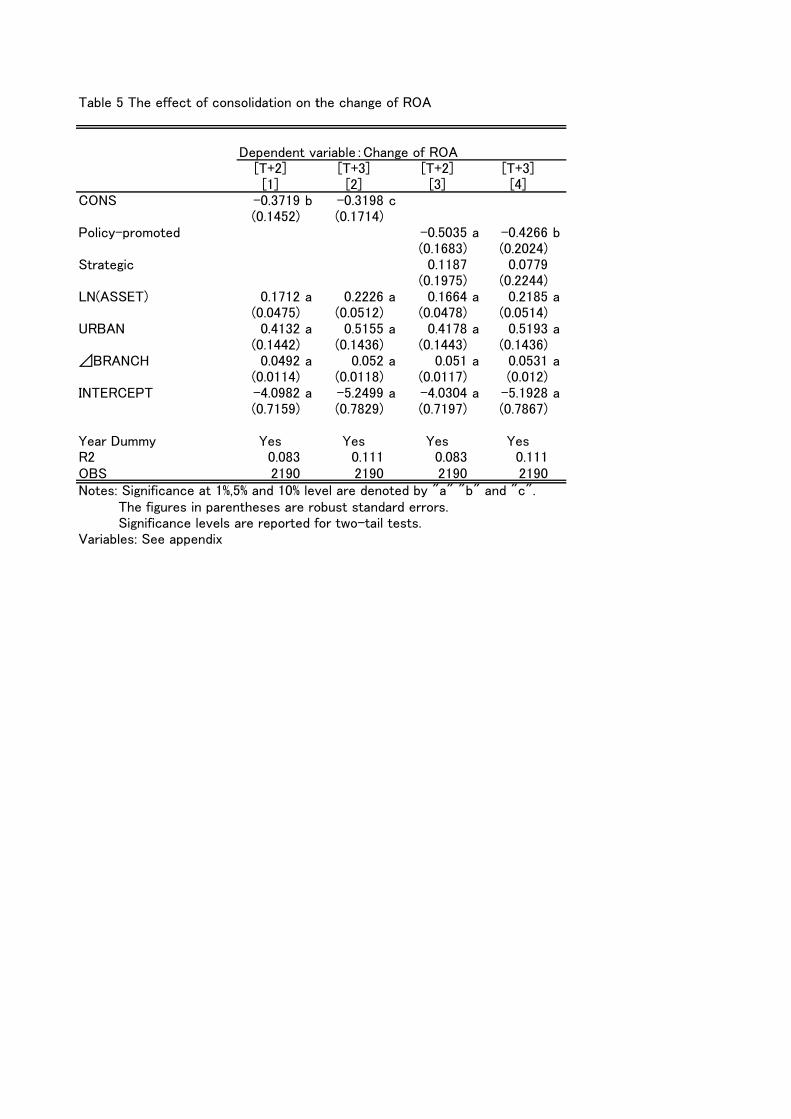
Table 5 The effect of consolidation on the change of ROA
Dependent variable:Change of ROA[T+2] [T+3] [T+2] [T+3][1] [2] [3] [4]
CONS -0.3719 b -0.3198 c(0.1452) (0.1714)
Policy-promoted -0.5035 a -0.4266 b(0.1683) (0.2024)
Strategic 0.1187 0.0779(0.1975) (0.2244)
LN(ASSET) 0.1712 a 0.2226 a 0.1664 a 0.2185 a(0.0475) (0.0512) (0.0478) (0.0514)
URBAN 0.4132 a 0.5155 a 0.4178 a 0.5193 a(0.1442) (0.1436) (0.1443) (0.1436)
⊿BRANCH 0.0492 a 0.052 a 0.051 a 0.0531 a(0.0114) (0.0118) (0.0117) (0.012)
INTERCEPT -4.0982 a -5.2499 a -4.0304 a -5.1928 a(0.7159) (0.7829) (0.7197) (0.7867)
Year Dummy Yes Yes Yes YesR2 0.083 0.111 0.083 0.111OBS 2190 2190 2190 2190Notes: Significance at 1%,5% and 10% level are denoted by "a" "b" and "c". The figures in parentheses are robust standard errors. Significance levels are reported for two-tail tests.Variables: See appendix
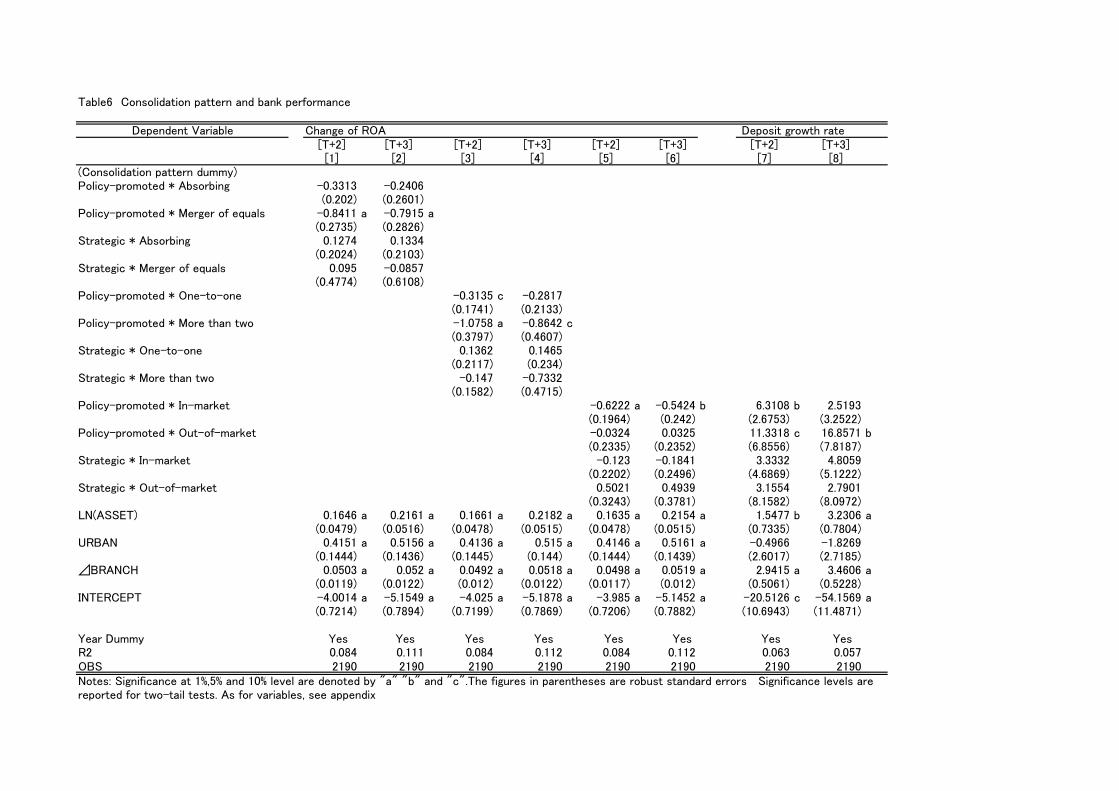
Table6 Consolidation pattern and bank performance
Dependent Variable Change of ROA Deposit growth rate [T+2] [T+3] [T+2] [T+3] [T+2] [T+3] [T+2] [T+3][1] [2] [3] [4] [5] [6] [7] [8]
(Consolidation pattern dummy)Policy-promoted * Absorbing -0.3313 -0.2406
(0.202) (0.2601)Policy-promoted * Merger of equals -0.8411 a -0.7915 a
(0.2735) (0.2826)Strategic * Absorbing 0.1274 0.1334
(0.2024) (0.2103)Strategic * Merger of equals 0.095 -0.0857
(0.4774) (0.6108)Policy-promoted * One-to-one -0.3135 c -0.2817
(0.1741) (0.2133)Policy-promoted * More than two -1.0758 a -0.8642 c
(0.3797) (0.4607)Strategic * One-to-one 0.1362 0.1465
(0.2117) (0.234)Strategic * More than two -0.147 -0.7332
(0.1582) (0.4715)Policy-promoted * In-market -0.6222 a -0.5424 b 6.3108 b 2.5193
(0.1964) (0.242) (2.6753) (3.2522)Policy-promoted * Out-of-market -0.0324 0.0325 11.3318 c 16.8571 b
(0.2335) (0.2352) (6.8556) (7.8187)Strategic * In-market -0.123 -0.1841 3.3332 4.8059
(0.2202) (0.2496) (4.6869) (5.1222)Strategic * Out-of-market 0.5021 0.4939 3.1554 2.7901
(0.3243) (0.3781) (8.1582) (8.0972)LN(ASSET) 0.1646 a 0.2161 a 0.1661 a 0.2182 a 0.1635 a 0.2154 a 1.5477 b 3.2306 a
(0.0479) (0.0516) (0.0478) (0.0515) (0.0478) (0.0515) (0.7335) (0.7804)URBAN 0.4151 a 0.5156 a 0.4136 a 0.515 a 0.4146 a 0.5161 a -0.4966 -1.8269
(0.1444) (0.1436) (0.1445) (0.144) (0.1444) (0.1439) (2.6017) (2.7185)⊿BRANCH 0.0503 a 0.052 a 0.0492 a 0.0518 a 0.0498 a 0.0519 a 2.9415 a 3.4606 a
(0.0119) (0.0122) (0.012) (0.0122) (0.0117) (0.012) (0.5061) (0.5228)INTERCEPT -4.0014 a -5.1549 a -4.025 a -5.1878 a -3.985 a -5.1452 a -20.5126 c -54.1569 a
(0.7214) (0.7894) (0.7199) (0.7869) (0.7206) (0.7882) (10.6943) (11.4871)
Year Dummy Yes Yes Yes Yes Yes Yes Yes YesR2 0.084 0.111 0.084 0.112 0.084 0.112 0.063 0.057OBS 2190 2190 2190 2190 2190 2190 2190 2190Notes: Significance at 1%,5% and 10% level are denoted by "a" "b" and "c".The figures in parentheses are robust standard errors Significance levels arereported for two-tail tests. As for variables, see appendix
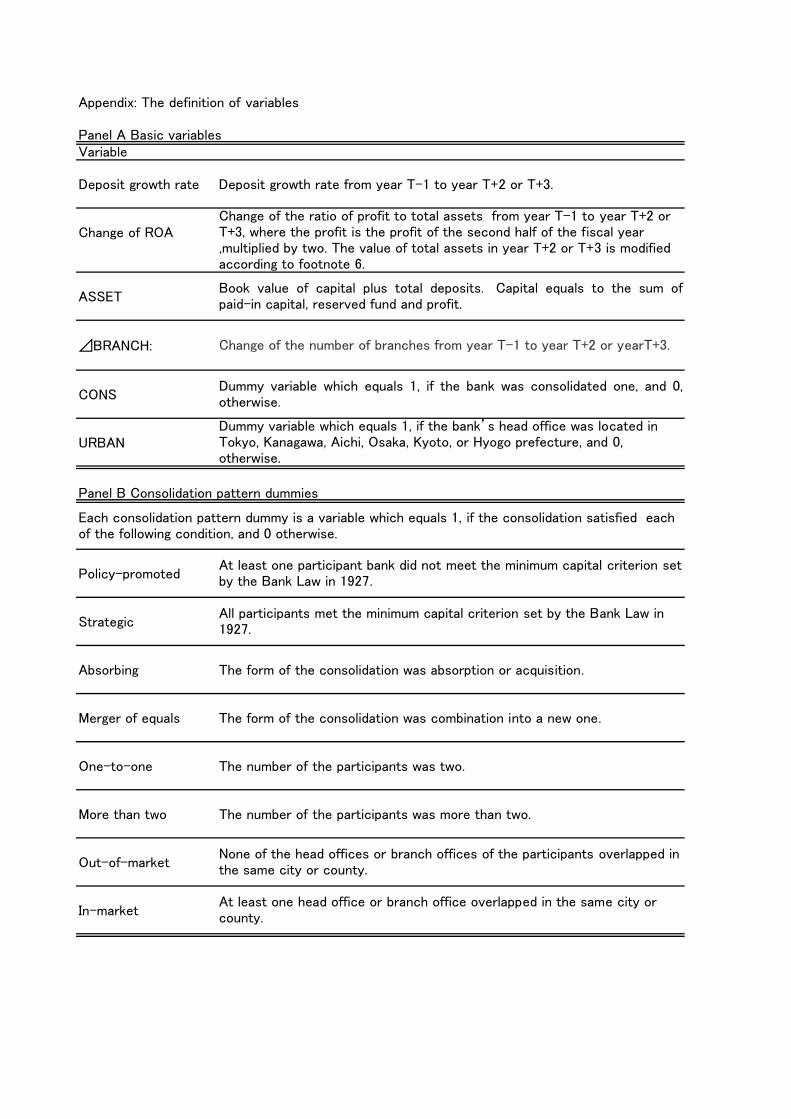
Appendix: The definition of variables
Panel A Basic variablesVariable
Deposit growth rate Deposit growth rate from year T-1 to year T+2 or T+3.
Change of ROA
ASSET
⊿BRANCH:
CONS
URBAN
Panel B Consolidation pattern dummies
Policy-promoted
Strategic
Absorbing The form of the consolidation was absorption or acquisition.
Merger of equals The form of the consolidation was combination into a new one.
One-to-one The number of the participants was two.
More than two The number of the participants was more than two.
Out-of-market
In-marketAt least one head office or branch office overlapped in the same city orcounty.
Book value of capital plus total deposits. Capital equals to the sum ofpaid-in capital, reserved fund and profit.
Change of the number of branches from year T-1 to year T+2 or yearT+3.
Dummy variable which equals 1, if the bank was consolidated one, and 0,otherwise.
Dummy variable which equals 1, if the bank’s head office was located inTokyo, Kanagawa, Aichi, Osaka, Kyoto, or Hyogo prefecture, and 0,otherwise.
Each consolidation pattern dummy is a variable which equals 1, if the consolidation satisfied eachof the following condition, and 0 otherwise.
At least one participant bank did not meet the minimum capital criterion setby the Bank Law in 1927.
All participants met the minimum capital criterion set by the Bank Law in1927.
None of the head offices or branch offices of the participants overlapped inthe same city or county.
Change of the ratio of profit to total assets from year T-1 to year T+2 orT+3, where the profit is the profit of the second half of the fiscal year,multiplied by two. The value of total assets in year T+2 or T+3 is modifiedaccording to footnote 6.