effects of acidic precipitation, o3, and soil mg status on throughfall, soil, and seedling loblolly...
TRANSCRIPT
E F F E C T S O F A C I D I C P R E C I P I T A T I O N , O3, AND S O I L M g S T A T U S
ON T H R O U G H F A L L , S O I L , AND S E E D L I N G L O B L O L L Y P I N E
N U T R I E N T C O N C E N T R A T I O N S
G. L. SIMMONS and J. M. KELLY
Tennessee Valley Authority, Cooperative Forest Studies Program, P.O. Box 2008, Bldg. 1506, Oak Ridge National Laboratory, Oak Ridge, TN37831-6034, U.S.A.
(Received September 30, 1988; revised December 16, 1988)
Abstract. The individual and combined impacts of acidic precipitation, 03, and soil Mg status on nutrient concentrations of throughfall, soil solution, soil, and seedling components were evaluated after one growing season. Loblolly pine seedlings were planted ih a sandy loam soil having approximately 15 or 35 mg kg I of exchangeable Mg and were exposed to subambient, ambient, or twice ambient concentrations of 03 in open top chambers from May through October. Seedlings also received ambient amounts of simulated precipitation at pH 4.0 or 5.3 during this period. Concentrations of nutrients analyzed increased slightly in throughfall, but did not respond significantly to precipitation pH treatments. No increased nutrient leaching and no soil acidification were evident in soil exposed to low pH precipitation after one growing season. Ozone treatments had no significant effects on tissue nutrient concentrations. Interaction responses were very limited and do not suggest any significant synergisms.
1. Introduction
Acidic deposition can contribute to the acidification of soils, and in areas of sensitive soils, can adversely affect forest growth (Ulrich et al., 1980). In nutrient-rich soils,
atmospheric inputs have a relatively small impact on soil solution chemistry since solution composition is determined primarily by the soil, while the relative influence of precipitation may be more apparent in nutrient-poor soils (Wiklander, 1975).
Exchangeable bases are thought to be particularly vulnerable to changes by acidic precipitation because of the contribution of H ÷ to the exchange process and the
fact that the accompanying SO42- and NO 3- anions enhance leaching of the exchanged bases (Johnson and Cole, 1980). Because of the buffering capacity of soils, however, the acidification of even very sensitive soils is a slow process that may require many decades before measureable changes occur.
Acidic precipitation may also impose a significant stress on plant nutrient relationships in a direct manner by increasing the rate of foliar leaching (Wood
and Borman, 1975; Mollitar and Raynal, 1983), which could result in reduced foliar nutrient concentrations, or indirectly by altering nutrient uptake by roots or soil
nutrient availability. The significance of nutrient losses to plant growth will depend on rates of replenishment from the soil and the initial nutrient status of the plant (McLaughlin, 1985). Since many forest soils are relatively infertile, acidic preci- pitation can potentially influence the productivity of forested areas by the positive impact of increased nutrient inputs, particularly N (Reich et al., 1987), and the negative impact of increased foliar leaching (Kelly and Strickland, 1986).
Water, Air, and Soil Pollution 43: 199-210, 1989. © 1989 Kluwer Academic Publishers. Printed in the Netherlands.
200 G.L. SIMMONS AND J.M. KELLY
Interactive effects of gaseous pollutants and acidic precipitation on forest trees are not well understood, and may occur through a variety of physiological pathways (McLaughlin, 1985). Elevated levels of 03 may accelerate the rate of foliar leaching of cations, especially Mg, by disrupting the selective ion permeability of chloroplast membranes (Krause, et al., 1983). Sustained foliar loss of Mg could induce general needle chlorosis and affect patterns of whole plant C allocation (Taylor et al., 1986), which in turn could affect nutrient uptake from the soil (Prinz, 1987).
The objective of this research was to determine the singular and interactive effects of acidic precipitation, atmospheric 03, and exchangeable soil Mg status on the nutrient concentration of throughfall, soil solution, soil, and loblolly pine seedlings after one growing season. This research is part of a project designed to determine the growth response of loblolly pine to the above-mentioned factors and to investigate the physiological and edaphic basis underlying and observed growth responses.
2. Methods
2.1. SOIL AND SEEDLING PREPARATION
Soil used in the study was collected from the A horizon of a fine loamy silicious, mesic Typic Hapludult (Lilly Series) from a hardwood forest site which had been site prepared for pine conversion. After collection, the soil was passed through a 10 mm sieve and mixed (80:20, v:v) with sand derived from the same sandstone residuum from which the soil had formed. The addition of sand changed the textural classification of the soil from loam to sandy loam.
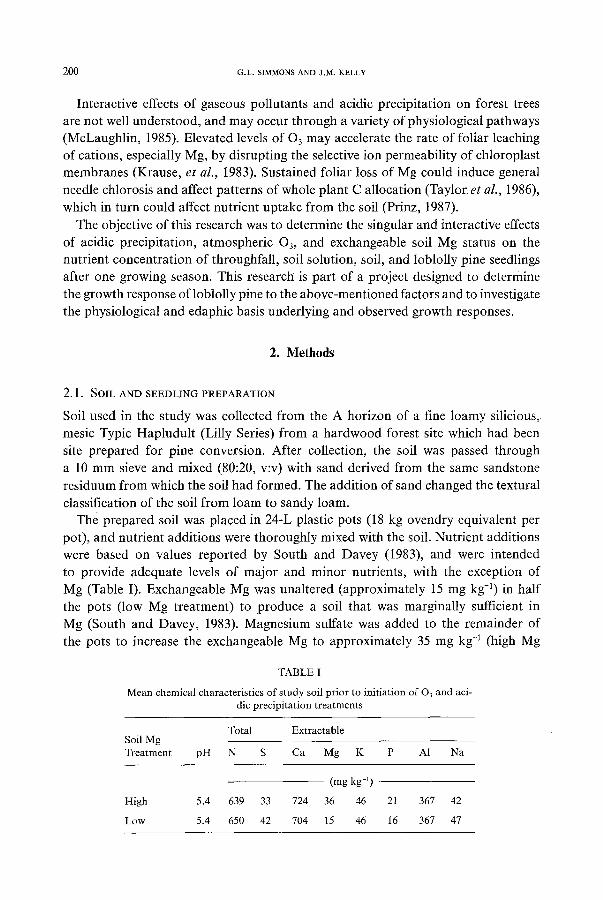
The prepared soil was placed in 24-L plastic pots (18 kg ovendry equivalent per pot), and nutrient additions were thoroughly mixed with the soil. Nutrient additions were based on values reported by South and Davey (1983), and were intended to provide adequate levels of major and minor nutrients, with the exception of Mg (Table I). Exchangeable Mg was unaltered (approximately 15 mg kg -1) in half the pots (low Mg treatment) to produce a soil that was marginally sufficient in Mg (South and Davey, 1983). Magnesium sulfate was added to the remainder of the pots to increase the exchangeable Mg to approximately 35 mg kg -1 (high Mg
TABLE I
Mean chemical characteristics of study soil prior to initiation of 03 and aci- dic precipitation treatments
Total Extractable Soil Mg Treatment pH N S Ca Mg K P A1 Na
(mg kg -1)
High 5.4 639 33 724 36 46 21 367 42
Low 5.4 650 42 704 15 46 16 367 47

ACIDIC PRECIPITATION, 03 AND SOIL Mg 201
treatment). Four monthly applications of NH4NO3 at a rate equivalent to 170 kg N ha -1 yr -1 were also made to all pots during the growing season, in an attempt to increase plant demand for Mg, and thus enhance the possibility of a Mg deficiency response.
In mid-April of 1987, bare-root 1-0 loblolly pine seedlings of similar height and diameter were transplanted into the pots (one seedling per pot). Initial height and diameter were recorded for use as covariates in subsequent growth analyses. Seedlings used in this study were provided by the Weyerhaeuser Corporation at New Bern, North Carolina, and were produced from half-sib seed of Weyerhaeuser family number 8-127, a family that has been successfully planted along the species' northern range (Adams et al., 1988).
2.2. EXPERIMENTAL FACILITIES
Pots were randomly assigned to 36 open top chambers (36 pots per chamber) equipped for gaseous pollutant exposures and rainfall exclusion/addition (Johnston et al.,
1986), and 03 treatments were initiated in early May. Ozone treatments were: subambient (charcoal-filtered air), ambient, and twice ambient. Ozone was generated from ambient air and delivered through Teflon R tubing to the air stream entering the chamber plenum of those chambers receiving incremental 03. Air was injected into the chambers at a flow rate of approximately 1.17 m 3 s -1, which provided 4 air changes min -1. Further details on the 03 generating system are reported by McEvers et al. (1988). The chambers were operated for 24 hr a day from May 7 to October 19, 1987. The mean 03 exposure levels (~L L -1) for the 1987 growing season were as follows (7-hr daylight mean (1000-1700 EDT), 24-hr mean): subambient (0.02, 0.02), ambient (0.05, 0.04), and twice ambient (0.09, 0.07).
Two simulated acidic precipitation treatments, targeted at pH 3.8 and 5.2, were used in the study. Actual pH's determined during each simulated precipitation event and volume weighted for the growing season were 4.0 (low pH) and 5.3 (high pH). Rainfall exclusion was achieved through the use of fiberglass covers that automatically covered each chamber during a precipitation event. Simulated rainfall was prepared from a stock solution of standard ionic composition (Irving, 1985) which was adjusted with H2SO 4 and HNO3 (70:30 equivalent basis) to produce treatment pH. Simulated rainfall was dispensed on a chamber-specific basis at a volume equivalent to that occurring under ambient conditions (44 cm from May- October). Soil water potential was monitored throughout the growing season, and precipitation events were scheduled to minimize seedling water stress. However, low precipitation amounts during September and October resulted in soil water potentials exceeding -800 kPa (-8 bar), and probably resulted in some water stress to the seedlings.
Four pots per chamber (two for each soil Mg treatment) were fitted with tension- free lysimeters in the bottom of the pots to collect soil solution samples. A funnel type collector was placed beneath the canopy of each tree in the lysimeter pots to collect throughfall solutions during each precipitation event. An additional
202 G.L. SIMMONS AND J.M. KELLY
collector was placed above the seedling canopy within each chamber to sample simulated incident rainfall.
2.3. MEASUREMENTS
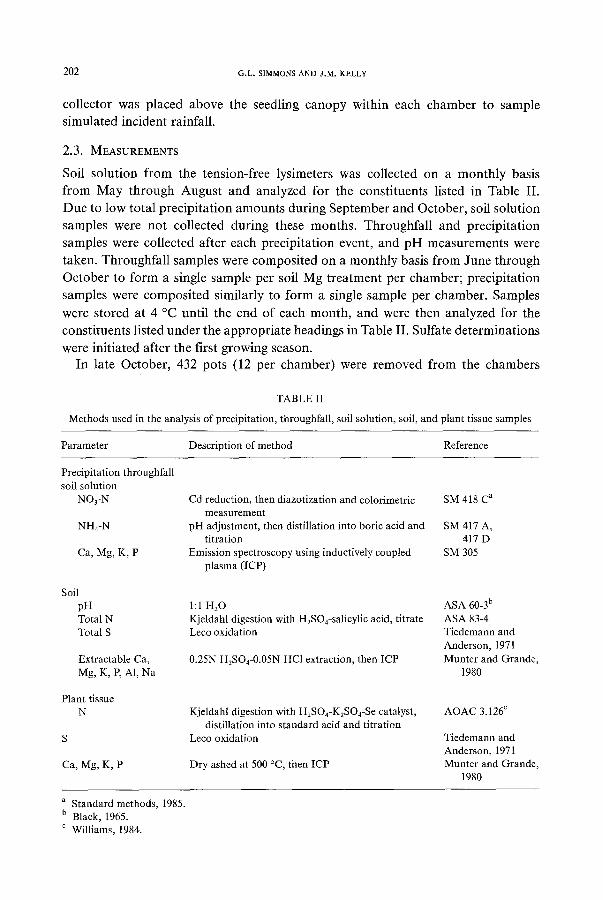
Soil solution f rom the tension-free lysimeters was collected on a month ly basis
f rom May th rough Augus t and analyzed for the constituents listed in Table II.
Due to low total precipi tat ion amounts during September and October , soil solution
samples were not collected during these months . Throughfal l and precipi tat ion
samples were collected after each precipi tat ion event, and p H measurements were
taken. Throughfal l samples were composi ted on a month ly basis f rom June th rough
October to fo rm a single sample per soil Mg t reatment per chamber; precipitat ion
samples were composi ted similarly to fo rm a single sample per chamber. Samples
were s tored at 4 °C until the end of each month , and were then analyzed for the
consti tuents listed under the appropr ia te headings in Table II. Sulfate determinations
were initiated after the first growing season. In late October , 432 pots (12 per chamber) were removed f rom the chambers
TABLE II
Methods used in the analysis of precipitation, throughfall, soil solution, soil, and plant tissue samples
Parameter Description of method Reference
Precipitation throughfall soil solution
NO3-N Cd reduction, then diazotization and colorimetric SM 418 C a
measurement NHa-N pH adjustment, then distillation into boric acid and SM 417 A,
titration 417 D Ca, Mg, K, P Emission spectroscopy using inductively coupled SM 305
plasma (ICP)
Soil pH 1:1 H20 ASA 60-3 b Total N Kjeldahl digestion with H2SO4-salicylic acid, titrate ASA 83-4 Total S Leco oxidation Tiedemann and
Anderson, 1971 Extractable Ca, 0.25N H2SO4-0 .05N HC1 extraction, then ICP Munter and Grande, Mg, K, P, A1, Na 1980
Plant tissue N Kjeldahl digestion with H2SO4-K2SO4-Se catalyst, AOAC 3.126 c
distillation into standard acid and titration Leco oxidation
Ca, Mg, K, P Dry ashed at 500 °C, then ICP
Tiedemann and Anderson, 1971 Munter and Grande,
1980
a Standard methods, 1985. b Black, 1965. c Williams, 1984.

ACIDIC PRECIPITATION, 03 AND SOIL Mg 203
for harvesting. Soil samples were collected in two fractions (0 to 5 cm; 5 to 25 cm), freed of roots, air-dried, and ground to pass through a 2 mm sieve. Chemical determinations and methods used for soil analyses are listed in Table II. After soil samples were collected, seedlings were harvested and separated into the following components for nutrient analysis: last fully expanded flush of current year's needles, second-to-last flush of current year's needles, stem, coarse roots (diam ~ 1 mm), and fine roots (diam _< 1 ram). Procedures for chemical analyses are listed in Table II.
2.4. EXPERIMENTAL DESIGN AND STATISTICAL ANALYSIS
The study utilized a split plot arrangement in a randomized complete block design, with 03 and precipitation pH as main treatments in each chamber and soil Mg status as the split. Pots were rearranged at four week intervals to minimize position effects. Each treatment combination was replicated six times, with six seedlings in eacta replication. Volume weighted mean nutrient concentrations for the growing season were calculated for precipitation, throughfall, and soil solution data. Analysis of variance techniques were used to evaluate all data (level of significance was P _< 0.05 for all statistical comparisons unless otherwise stated), and Tukey's studentized range test was used for mean separation where significant main effects were present (Steel and Torrie, 1980).
3. Results and Discussion
3.1. THROUGHFALL AND SOIL SOLUTION CHEMISTRY
Throughfall chemistry was not significantly affected by main treatment effects, nor were there any significant interactions (Table III), but NO 3- concentration was somewhat greater at the low pH precipitation treatment. Differences in NO3- concentration were due to differences in concentration of HNO 3 in each precipitation treatment. Volume weighted pH of the throughfall was quite variable from month to month and within each precipitation pH treatment, but averaged 3.9 for the low pH treatment and 5.0 for the high pH treatment for the growing season (May through October).
Concentrations of all nutrients, especially NO3-N and NH4-N, were greater in throughfall than in precipitation (Table Ill). Increased concentrations of NO3-N and NH4-N observed at twice ambient levels of O3 were probably due to concomitant production of NO× during 03 generation, leading to HNO3 formation and deposition (Brown and Roberts, 1988). Increased nutrient concentrations in throughfall also suggest that nutrients were removed from the foliage through foliar exchange or plant exudation, or that ions were removed from the surface of needles (Parker, 1983).
As indicated in Table III, precipitation acidity did not significantly alter the concentration of any nutrients in the throughfall. Leininger and Winner (1988)
204 G.L. SIMMONS AND J .M. KELLY
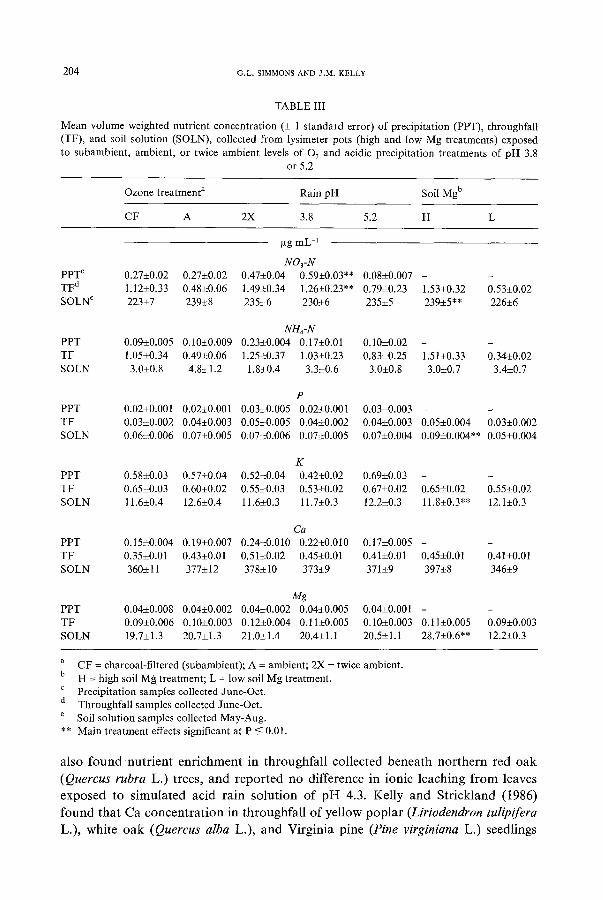
TABLE III
Mean volume weighted nutrient concentration (± 1 standard error) of precipitation (PPT), throughfall (TF), and soil solution (SOLN), collected from lysimeter pots (high and low Mg treatments) exposed to subambient, ambient, or twice ambient levels of 03 and acidic precipitation treatments of pH 3.8
or 5.2
Ozone treatment a Rain pH Soil Mg b
CF A 2X 3.8 5.2 H L
~tg mL -t
NO3-N PPT c 0.27_+0.02 0.27_+0.02 0.47_+0.04 0.59___0.03** 0.08_+0.007 - - TF d 1.12-+0.33 0.48_+0.06 1.49-+0.34 1.26_+0.23'* 0.79:50.23 1.53_+0.32 0.53+0.02 SOLN e 223-+7 239_+8 235±6 230_+6 235+5 239-+5** 226±6
NH4-N PPT 0.09+0.005 0.10±0.009 0.23_+0.004 0.17_+0.01 0.10±0.02 - - TF 1.05+0.34 0.49_+0.06 1.25_+0.37 1.03_+0.23 0.83+_0.25 1.51-+0.33 0.34_+0.02 SOLN 3.0-+0.8 4.8_+1.2 1 .8 ,+0.4 3.3_+0.6 3.0_+0.8 3.0_+0.7 3.4+0.7
P PPT 0.02_+0.001 0.02_+0.001 0.03±0.005 0.02_+0.001 0.03+0.003 - - TF 0.03-+0.002 0.04_+0.003 0.05_+0.005 0.04_+0.002 0.04_+0.003 0.05_+0.004 0.03_+0.002 SOLN 0.06-+0.006 0.07_+0.005 0.07±0.006 0.07±0.005 0.07+0.004 0.09_+0.004** 0.05+0.004
K PPT 0.58_+0.03 0.57-+0.04 0.52-+0.04 0.42~+0.02 0.69_+0.03 - - TF 0.65:50.03 0.60-+0.02 0.55_+0.03 0.53~+0.02 0.67_+0.02 0.65_+0.02 0.55_+0.02 SOLN 11.6_+0.4 12.6_+0.4 11.6_+0.3 11.7_+0.3 12.2_+0.3 11.8_+0.3"* 12.1_+0.3
Ca PPT 0.15_+0.004 0.19_+0.007 0.24_+0.010 0.22_+0.010 0.17+0.005 - - TF 0.35_+0.01 0.43_+0.01 0.51_+0.02 0.45_+0.01 0.41_+0.01 0.45-+0.01 0.41-+0.01 SOLN 360_+11 377_+12 378_+10 373-+9 371_+9 397_+8 346+9
Mg PPT 0.04_+0.008 0.04_+0.002 0.04_+0.002 0.04_+0.005 0.04+0.001 - - TF 0.09_+0.006 0.10_+0.003 0.12_+0.004 0.11_+0.005 0.10_+0.003 0.11-+0.005 0.09_+0.003 SOLN 19.7_+1.3 20.7_+1.3 21.0_+1.4 20.4-+1.1 20 .5+1 .1 28.7_+0.6** 12.2_+0.3
a C F = charcoal-filtered (subambient); A = ambient; 2X - twice ambient. b H = high soil Mgtreatment; L = low soil Mg treatment. c Precipitation samples collected June-Oct. d Throughfall samples collected June-Oct. e Soil solution samples collected May-Aug, ** Main treatment effects significant at P _< 0.01.
a l so f o u n d n u t r i e n t e n r i c h m e n t in t h r o u g h f a l l c o l l e c t e d b e n e a t h n o r t h e r n r ed o a k
(Quercus rubra L.) t rees , a n d r e p o r t e d n o d i f f e r ence in i on ic l e a c h i n g f r o m leaves
e x p o s e d to s i m u l a t e d ac id r a in s o l u t i o n o f p H 4.3. Ke l ly a n d S t r i c k l a n d (1986)
f o u n d t h a t C a c o n c e n t r a t i o n in t h r o u g h f a l l o f ye l l o w p o p l a r (Liriodendron tulipifera L.) , w h i t e o a k (Quercus alba L.), a n d V i rg in i a p i n e (Pine virginiana L.) seed l ings

ACIDIC PRECIPITATION, 0 3 AND SOIL Mg 205
increased slightly at a precipitation pH of 3.5, but other cations exhibited little response to increasing precipitation acidity.
Soil solution chemistry was not significantly affected by 03 or precipitation pH treatments, and no significant treatment interactions were detected (Table III). These data indicate that no increased soil nutrient leaching occurred in response to increased acidity of precipitation after one growing season. Similar results were reported by Kelly and Strickland (1987) for a forest microcosm soil exposed to precipitation of pH 5.7 to 3.5, and by McClenahen (1987) for a deciduous forest soil treated with simulated throughfall at pH 6.0 or 4.0.
Soil solution pH for the first growing season was slightly lower in lysimeter pots exposed to the low pH precipitation treatment (4.7) than solution pH for pots in the high pH treatment (4.9), but differences were not statistically significant. MacDonald et al. (1986) found that acidification of a Grayling sand occurred at rain pH 3.0 and below, while depletion of soil cations was restricted to rain pH levels 2.5 and 2.0. Lee and Weber (1982) also found no acid rain-related effects on pH and soil solution chemistry after 2.5 yr exposure to pH 3.0 simulated rain.
The volume weighted concentrations of NO3-N, Ca, P, and Mg were significantly greater for soil solution from the high Mg soil than for soil solution from the low Mg soil (Table III). Although differences in Mg concentration between soil Mg treatments were expected due to the addition of MgSO 4 to the high Mg soil, no explanation is readily apparent for the differences observed in NO3-N , Ca, and R One possibility could be that the nutrient additions in each soil Mg treatment have not had sufficient time to equilibrate with the soil in the pots. In this case, we would expect that differences would not be as large in subsequent years of the study.
3.2. S O I L N U T R I E N T CONTENT
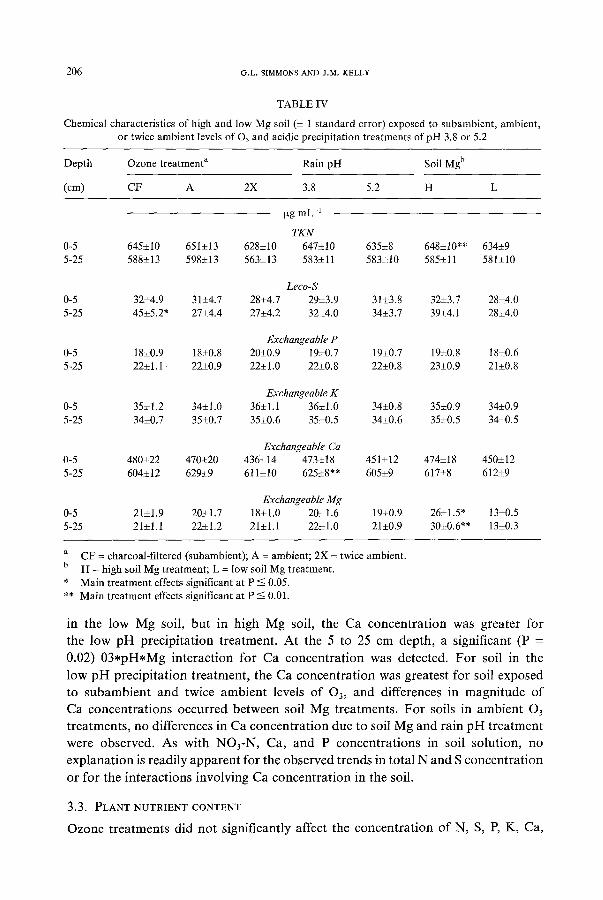
Precipitation pH treatments had no significant effect on nutrient content of the soil at the 0 to 5 cm depth. At the 5 to 25 cm depth, only exchangeable Ca concentration was significantly greater in soil exposed to low pH precipitation (Table IV). Precipitation pH also had no significant effect on soil pH. The pH of soils from both precipitation pH treatments was approximately 5.4. These data, in conjunction with the soil solution data, further indicate that leaching of nutrients was not accelerated and soil acidification did not occur in soil exposed to low pH precipitation after one growing season.
Ozone treatments had no significant effects on soil chemistry (Table IV), except for total S concentration in the 5 to 25 cm soil depth; total S concentration was greatest for soil exposed to subambient 03 levels. The concentration of total N within the 0 to 5 cm soil depth and Mg concentrations at both soil depths were greater for soil from the high soil Mg treatment than for soil from the low Mg treatment.
A significant (P -- 0.03) pH*Mg interaction was detected for Ca in the 0 to 5 cm depth of soil. At this depth, Ca concentrations were not affected by pH
206 O.L. SIMMONS AND J.M. KELLY
TABLE IV
Chemical characteristics of high and low Mg soil (_+ 1 standard error) exposed to subambient, ambient, or twice ambient levels of O3 and acidic precipitation treatments of pH 3.8 or 5.2
Depth Ozone treatment a Rain pH Soil Mg b
(cm) CF A 2X 3.8 5.2 H L
~tg mL -1
TKN 0-5 645_+10 651_+13 628_+10 647_+10 635_+8 648_+10"* 634_+9 5-25 588_+13 598_+13 5 6 3 + 1 3 583_+11 583_+10 585-+11 581_+10
Leco-S 0-5 32_+4.9 31_+4.7 2 8 + 4 . 7 29+3.9 31_+3.8 32_+3.7 28_+4.0 5-25 45-+5.2* 27-+4.4 27_+4.2 32_+4.0 34_+3.7 39_+4.1 28+4.0
Exchangeable P 0-5 18_+0.9 18_+0.8 20_+0.9 19_+0.7 19+0.7 19_+0.8 18_+0.6 5-25 22_+1.1 2 2 + 0 . 9 22_+1.0 22+0.8 22_+0.8 23_+0.9 21-+0.8
Exchangeable K 0-5 35_+1.2 34_+1.0 36+1.1 36_+1.0 34+0.8 35_+0.9 34_+0.9 5-25 34_+0.7 35_+0.7 35_+0,6 35_+0.5 34_+0.6 35_+0.5 34+0.5
Exchangeable Ca 0-5 480+22 470_+20 436_+14 473_+18 451_+12 4 7 4 + 1 8 450+12 5-25 604_+12 629-+9 611_+10 625___8** 605-+9 617+8 612_+9
Exchangeable Mg 0-5 21-+1.9 20_+1.7 18_+1.0 20_+1.6 19_+0.9 26_+1.5" 13_+0.5 5-25 21+1.1 22_+1.2 21_+1.1 22_+1.0 21+0.9 30_+0.6** 13_+0.3
a C F = charcoal-filtered (subambient); A = ambient; 2X = twice ambient. b H = high soil Mg treatment; L = low soil Mg treatment. * Main treatment effects significant at P _< 0.05. ** Main treatment effects significant at P ---% 0.01.
in the low Mg soil, but in high Mg soil, the Ca concen t ra t ion was greater for
the low p H prec ip i ta t ion t reatment . A t the 5 to 25 cm depth, a significant (P =
0.02) 0 3 * p H * M g in terac t ion for Ca concen t ra t ion was detected. F o r soil in the
low p H prec ip i ta t ion t rea tment , the Ca concen t ra t ion was greatest for soil exposed
to subambien t and twice ambien t levels o f 03, and differences in magni tude o f
Ca concent ra t ions occur red be tween soil Mg treatments . F o r soils in ambient 03
t rea tments , no differences in Ca concen t ra t ion due to soil Mg and rain p H t rea tment
were observed. As with NO3-N, Ca, and P concent ra t ions in soil solut ion, no
explana t ion is readi ly apparen t for the observed trends in to ta l N and S concent ra t ion
or for the in teract ions involv ing Ca concen t ra t ion in the soil.
3.3. PLANT NUTRIENT CONTENT
Ozone t rea tments did not significantly affect the concen t ra t ion o f N, S, P, K, Ca,

ACIDIC PRECIPITATION, O 3 AND SOIL Mg 207
T A B L E V
N u t r i e n t c o n c e n t r a t i o n o f lob lo l ly p ine seedl ings (± 1 s t a n d a r d e r r o r ) g r o w n a t t w o levels o f soil M g a n d exposed to s u b a m b i e n t , a m b i e n t , o r twice a m b i e n t levels o f 0 3 a n d ac id ic p r e c i p i t a t i o n t r e a t m e n t s
o f p H 3.8 o r 5.2
O z o n e t r e a t m e n t a R a i n p H Soil M g b Seedl ing c o m p o n e n t C F A 2X 3.8 5.2 H
~g g - ' (×10-3)
TKN Las t f lush c 15.0±0.1 15.6±0.2 15.5±0.1 15.5±0.1 15.3±0.1 15.4+0.1 15.3±0.1 2rid f lush d 15.6±0.2 16.3±0.2 16.0±0.2 16~0±0.1 15.8±0.1 16.0±0.1 15.9±0.1 S tem 6 .5±0.09 6 .6+0.09 6 .6±0.07 6 .6±0.08 6 .5±0.07 6 .4±0.07 6 .7±0.08 C o a r s e r o o t s e 8 .7±0.2 9 .2±0.2 8 .9+0.2 9 .1±0 .2 8.8±0.1 8 .9±0.2 9 .0±0.2 F ine r o o t s f 19.7±0.3 20.4±0.3 20.1±0.3 20 .4±0.2 19.7+0.2 20 .3±0.2 19.8±0.2
g g g-I
Leco-S Las t f lush 888+9 904±9 944±13 915±8 908+10 917±9 905±9 2 n d f lush 768±12 795±15 817+14 795±11 792±12 794±12 792±11 S tem 385+9 397±12 402±10 394±7 395±10 394±8 395±9 C o a r s e r o o t s 594+15 596±18 616±19 602+14 603±14 629±14" 575±13 F ine r o o t s 1521±30 1450±33 1551±37 1515±28 1500±28 1614±29" 1399±22
P Las t f lush 1131±31 1106±24 1223±29 1159±26 1144±20 1139±21 1165±26 2rid f lush 889±17 890±21 943±19 899±14 916±17 890±17 925±14 S tem 651+15 666±25 662±17 658±18 662±13 638±12" 681±18 C o a r s e r o o t s 703±22 678±21 724±20 695±17 708±17 681±17" 723±17 F ine r o o t s 1371±27 1310±30 1351±33 1340±24 1348±25 1318±25" 1370±24
K Las t f lush 7115±165 7442±200 7263±161 7286±147 7273±145 7376±145 7175±146 2 n d f lush 5747±160 5902±160 5824±130 5896+134 5751±110 5912±126 5736+118 Stem 3426±102 3872±119 3688±98 3710+95 3617±82 3621±85 3705±94 C o a r s e r o o t s 4699+182 5325±150 5286+155 5097±148 5120±121 5210+137 5003±132 F ine r o o t s 7546±217 8 3 8 8 ± 1 6 2 8290±195 8164±163 7981+159 8166±161 7975±162
Ca Las t f lush 3908±136 4485±193 3737+130 4188±136 3935±129 3966±125 4161±140 2 n d f lush 7130±175 7447+210 7048±198 7374±170" 7033+146 7210±170 7189±148 Stem 3527±100 3708±90 3727±81 3643±80 3665±68 3533±68 3774±79 C o a r s e r o o t s 2944±71 2914±80 2867±79 2907±68 2910±57 2975±62 2840±63 F ine r o o t s 10740±266 11428+270 11169±286 11194±233 11028±216 11309±215 10908±233
Mg Las t f lush 787±23 772±21 782±22 792+19 768±17 828+17" 728+18 2 n d f lush 1001+24 963±27 989±24 990±18 981±22 1082±19 893±17 S tem 486+14 506+16 502±16 504±17 493±11 535±12 461±16 C o a r s e r o o t s 447±14 446±14 472±13 463+11 448±11 499±11"* 411±9 F ine r o o t s 1343±30 1365±28 1374±31 1365±25 1355±24 1495±21"* 1223±20
a C F = cha rcoa l - f i l t e r ed ( subambien t ) ; A = a m b i e n t ; 2X = twice a m b i e n t . b H = h igh soil M g t r e a t m e n t ; L ~ low soil M g t r e a t m e n t . c Las t fu l ly e x p a n d e d f lush o f c u r r e n t yea r ' s needles. a s e c o n d - t o - l a s t fu l ly e x p a n d e d f lush o f c u r r e n t y e a r ' s needles. e d i a m e t e r > l m m . f d i a m e t e r <~ l m m . * m a i n t r e a t m e n t effect f o r a g iven seedl ing c o m p o n e n t s ign i f ican t a t P <_ 0,05. ** m a i n t r e a t m e n t effect fo r a g iven seedl ing c o m p o n e n t s ign i f ican t a t P <_ 0,01.
208 G.L. SIMMONS AND J.M. KELLY
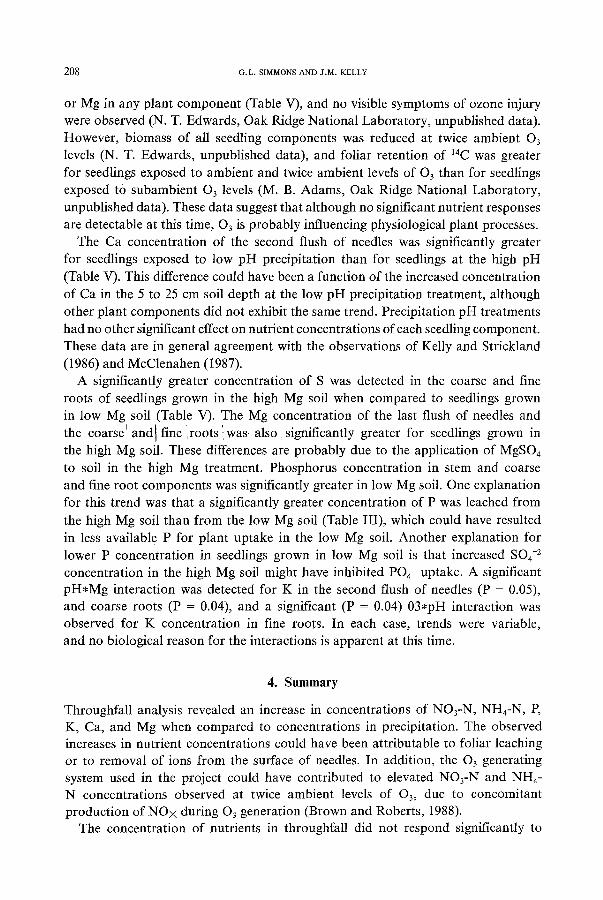
or Mg in any plant component (Table V), and no visible symptoms of ozone injury were observed (N. T. Edwards, Oak Ridge National Laboratory, unpublished data). However, biomass of all seedling components was reduced at twice ambient 03 levels (N. T. Edwards, unpublished data), and foliar retention of 14C was greater for seedlings exposed to ambient and twice ambient levels of O3 than for seedlings exposed to subambient 03 levels (M. B. Adams, Oak Ridge National Laboratory, unpublished data). These data suggest that although no significant nutrient responses are detectable at this time, 03 is probably influencing physiological plant processes.
The Ca concentration of the second flush of needles was significantly greater for seedlings exposed to low pH precipitation than for seedlings at the high pH (Table V). This difference could have been a function of the increased concentration of Ca in the 5 to 25 cm soil depth at the low pH precipitation treatment, although other plant components did not exhibit the same trend. Precipitation pH treatments had no other significant effect on nutrient concentrations of each seedling component. These data are in general agreement with the observations of Kelly and Strickland (1986) and McClenahen (1987).
A significantly greater concentration of S was detected in the coarse and fine roots of seedlings grown in the high Mg soil when compared to seedlings grown in low Mg soil (Table V). The Mg concentration of the last flush of needles and
and I fine 'roots '.was: also the coarse significantly greater for seedlings grown in the high Mg soil. These differences are probably due to the application of MgSO4 to soil in the high Mg treatment. Phosphorus concentration in stem and coarse and fine root components was significantly greater in low Mg soil. One explanation for this trend was that a significantly greater concentration of P was leached from the high Mg soil than from the low Mg soil (Table III), which could have resulted in less available P for plant uptake in the low Mg soil. Another explanation for lower P concentration in seedlings grown in low Mg soil is that increased SO4 -2 concentration in the high Mg soil might have inhibited PO4- uptake. A significant pH*Mg interaction was detected for K in the second flush of needles (P = 0.05), and coarse roots (P = 0.04), and a significant (P = 0.04) 03*pH interaction was observed for K concentration in fine roots. In each case, trends were variable, and no biological reason for the interactions is apparent at this time.
4. Summary
Throughfall analysis revealed an increase in concentrations of NO3-N, NH4-N, P, K, Ca, and Mg when compared to concentrations in precipitation. The observed increases in nutrient concentrations could have been attributable to foliar leaching or to removal of ions from the surface of needles. In addition, the O3 generating system used in the project could have contributed to elevated NO3-N and NH 4- N concentrations observed at twice ambient levels of 03, due to concomitant production of NO× during 03 generation (Brown and Roberts, 1988).
The concentration of nutrients in throughfall did not respond significantly to

ACIDIC PRECIPITATION, 0 3 AND SOIL Mg 209
precipitation acidity. One explanation for the lack of response is that dry deposition is largely responsible for the increased nutrient concentration observed in throughfall, since local sources of dust and other atmospheric pollutants occur in the area. The removal of surface deposited ions could have masked any increased nutrient leaching which might have occurred at the lower pH precipitation treatment.
Soil and soil solution analyses revealed no increased nutrient leaching and no soil acidification in response to increased acidity of precipitation after one growing season. As might be expected, precipitation pH treatments also had no significant effects on seedling nutrient concentrations, since soil chemistry was not altered by this treatment. However, long-term leaching losses of cations from the soil are possible, and could lead to responses in tissue nutrient concentrations in subsequent years.
Ozone treatments also had no significant effect on seedling nutrient concentration. However, seedling biomass was significantly reduced at twice ambient 03 levels (N. T. Edwards, unpublished data), and foliar retention of 14C was greatest at elevated 03 levels (M. B. Adams, unpublished data). These data suggest that although plant nutrient concentrations have not begun to respond to 03 treatments, physiological plant processes are being affected.
Based on soil and soil solution data, the two desired levels of soil Mg were achieved within the first year of the study. However, soil Mg did not exacerbate 03 or precipitation pH effects on seedling nutrient content. Two explanations for the apparent lack of synergism can be offered: one is that although two soil Mg levels were established, Mg may not have been deficient in the low Mg treatment. Consequently, seedlings may not have been subjected to Mg stress great enough for symptoms to be evident. A second possibility is that sufficient time has not elapsed for treatment effects to be manifested. This could also explain the variable trends observed for several soil and soil solution nutrients in response to to soil Mg treatments. Analyses in subsequent years of the study should provide more insight on these responses.
Acknowledgments
This work was supported by the TVA Office of Power and the Electric Power Research Institute under contract RP-2799-2. The authors greatfully acknowledge the technical contributions of R A. Mays, J. B. Edwards, and T. Grizzard, and the assistance with statistical analysis and data management provided by Dr. J. J. Beauchamp and C. L. Hohanshelt.
References
Adams, M. B., Kelly, 2. M., and Edwards, N. T.: 1988, Water, Air, andSoilPollut. 38, 137. Black, C. A.: 1965, Methods of SoilAnalysis, American Society of Agronomy, Madison, WI. 1572 p. Brown, K. A. and Roberts, T. M.: 1988, Environ. Pollut. (in press).

210 G.L. SIMMONS AND J.M. KELLY
Irving, E M.: 1985, Environ. andExp. Bot. 25, 327. Johnson, D, W. and Cole, D. W.: 1980, Environ. Int. 3, 79. Johnston, J. W., Jr. Shriner, D. S., and Abner, C. H.: 1986, J. Air Pollut. Contro. Assoc. 36, 894. Kelly, J. M. and Strickland, R. C.: 1986, Water, Air, and Soil Pollut. 29, 219. Kelly, J. M. and Strickland, R. C.: 1987, Water, Air, and Soil Pollut. 34, 167. Krause, G. H. M., Prinz, B., and Jung, K. D.: 1983, Symposium on Air Pollution and the Productivity
of the Forest, Izaak Walton League of America, Arlington, VA. pp. 297-332. Lee, J. J. and Weber, D. E.: 1982, Jour. Environ. Qual. 11, 57. Leininger, T. D. and Winner, W. E.: 1988, Can. J. For. Res. 18, 478. MacDonald, N. W., Hart, J. B. Jr., and Nguyen, E V.: 1986, SoilSci. Soc. Am. J. 50, 219. McClenahen, J. R.: 1987, Water, Air, and SoilPollut. 35, 319. McEvers, J. A., Bowers, T. L., and Edwards, N. T.: 1988, ORNL/TM-10758. Oak Ridge National
Laboratory, Oak Ridge, TN. McLaughlin, S. B.: 1985, J. Air Pollut. Contr. Assoc. 35, 512. Mollitor, A. W. and Raynal, D. J.: 1983, J. AirPollut. Contr. Assoc. 33, 1032. Munter, R. C. and Grande, R. A. 1980, Developments in Atomic Plasma Spectrochemical Analysis."
Proceedings of International Winter Conference. pp. 653-671, San Juan, Puerto Rico. January 7- 11.
Parker, G. G.: 1983, Adv. Ecol. Res. 13, 57. Prinz, B.: 1987, Environ. 29, 11. Reich, E B., Schoettle, A. W., Stroo, H. E, Troiano, J., and Amundson, R. G.: 1987, Can. J. Bot.
65, 977. South, D. B. and Davey, C. B.: 1983, Circular 265, Alabama Agricultural Experiment Station, Auburn,
AL. Standard Methods for the Examination of Water and Waste Water. 16th ed.: 1985. American Public
Health Association, Washington, D. C. Steel, R. G. D. and Torrie, J. H.: 1980, Principles and Procedures of Statistics: A Biometrical Approach.
McGraw-Hill Book Co. New York. Taylor, G. E., Norby, R. J., McLaughlin, S. B., Johnson, A. H., and Turner, R. S.: 1986, Oeeologia.
70, 163. Tiedemann, A. R. and Anderson, T. D.: 1971, Plant and Soil 35, 197. Ulrich, B., Mayer, R., and Khanna, E K.: 1980, SoilSci. 130, 193. Wiklander, L.: 1975, Geoderma. 14, 93. Williams, S.: 1984, Official Methods of Analysis o f the Association of Official Analytical Chemists. 14th
ed. Assoc. of Official Analytical Chemists, Inc. Arlington, VA. Wood, T. and Bormann, F. H.: 1975, Ambio. 4, 169.