effective water quality bmp monitoring tools - us … · effective water quality bmp monitoring...
TRANSCRIPT
Effective Water Quality BMP Monitoring Tools
Ginger Paige and Nancy Mesner
University of Wyoming Utah State University
Overview
BMP Monitoring Guidance Document for Stream Systems • Lessons learned
• CEAP Conservation Effects Assessment Project
• The Guidance Document & Tools Water Quality Monitoring Training Resources
• Components and key links…
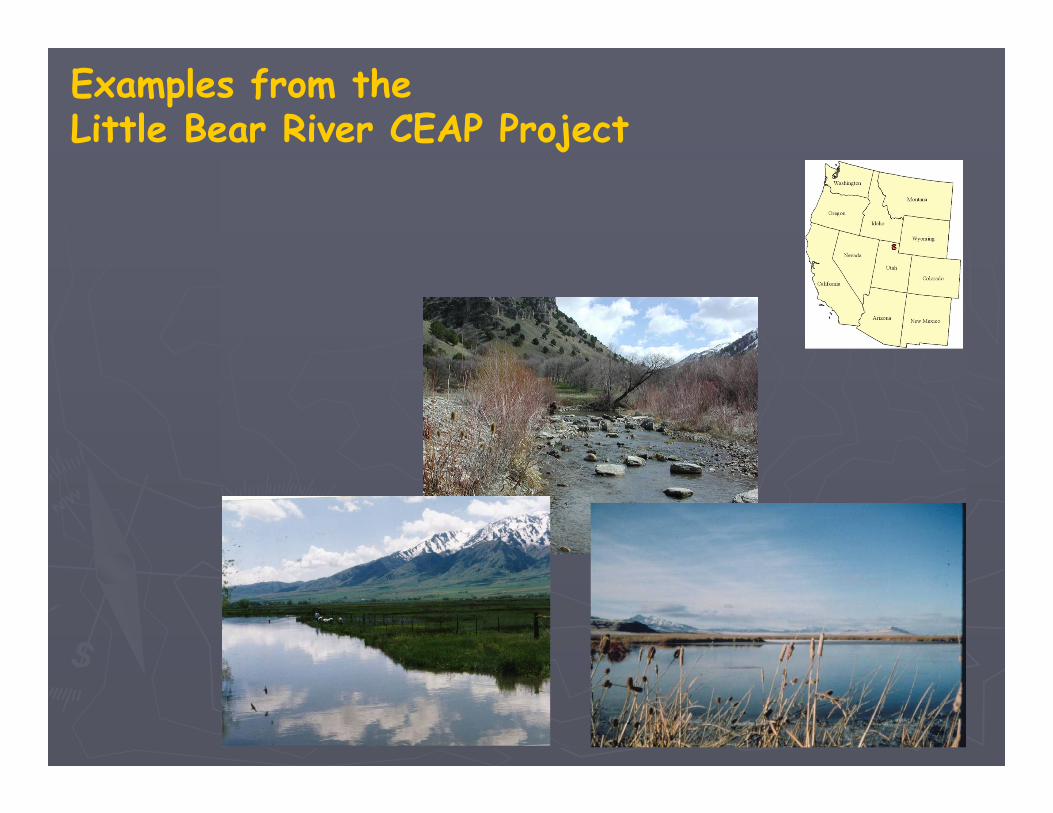
Examples from the Little Bear River CEAP Project
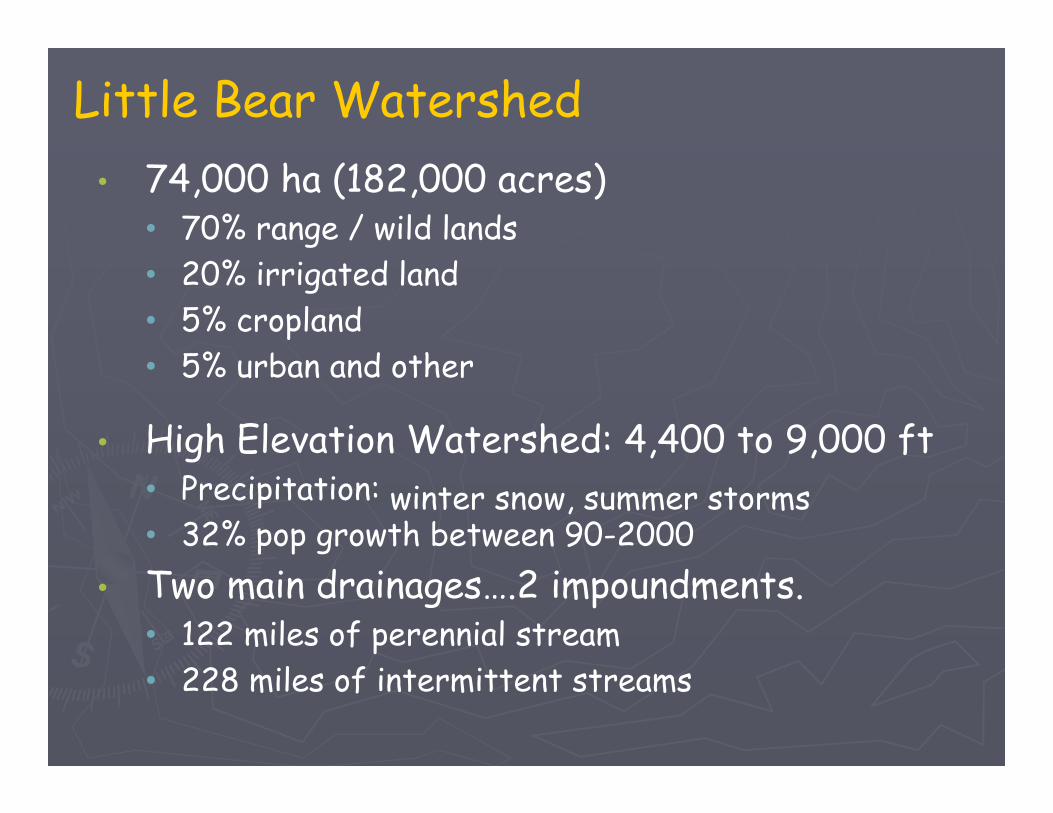
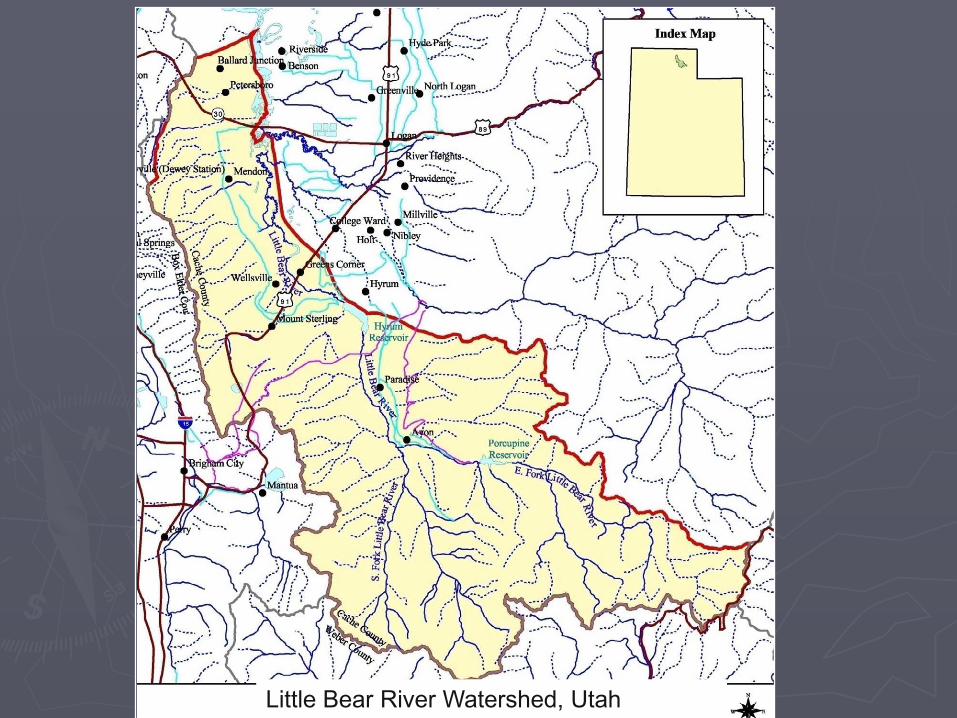
Little Bear Watershed • 74,000 ha (182,000 acres)
• 70% range / wild lands • 20% irrigated land • 5% cropland • 5% urban and other
• High Elevation Watershed: 4,400 to 9,000 ft • Precipitation: winter snow, summer storms • 32% pop growth between 90-2000
• Two main drainages….2 impoundments. • 122 miles of perennial stream • 228 miles of intermittent streams
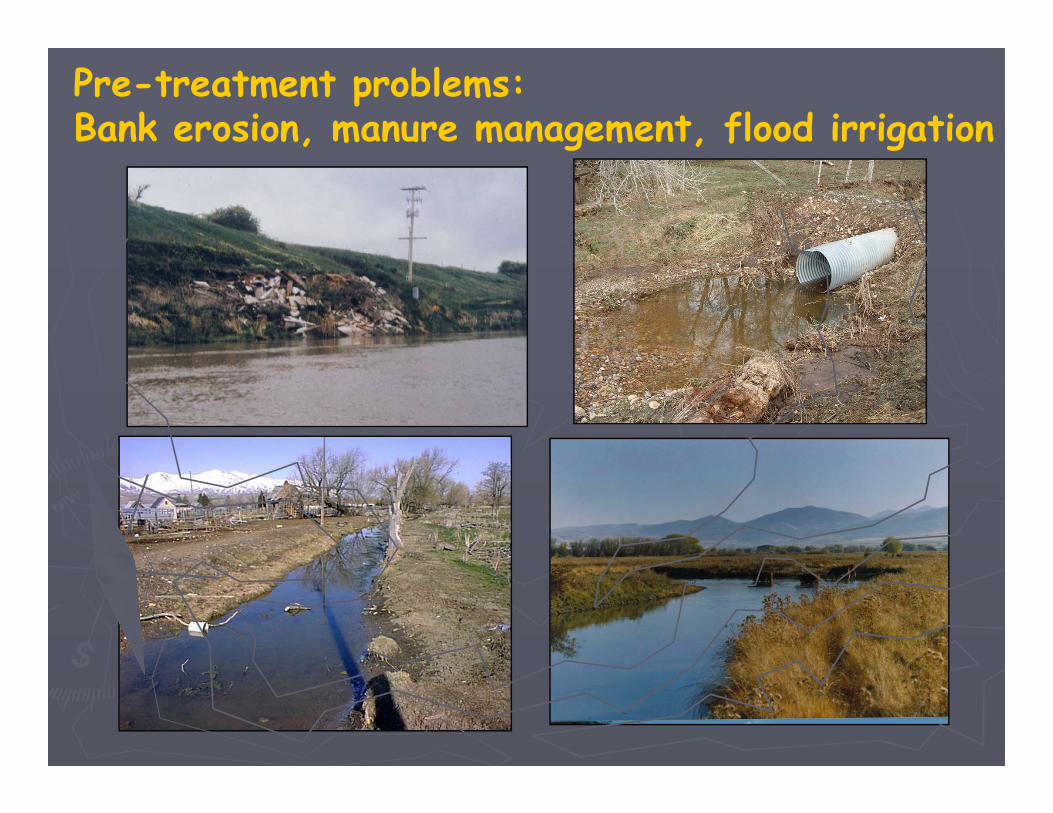
Pre-treatment problems: Bank erosion, manure management, flood irrigation
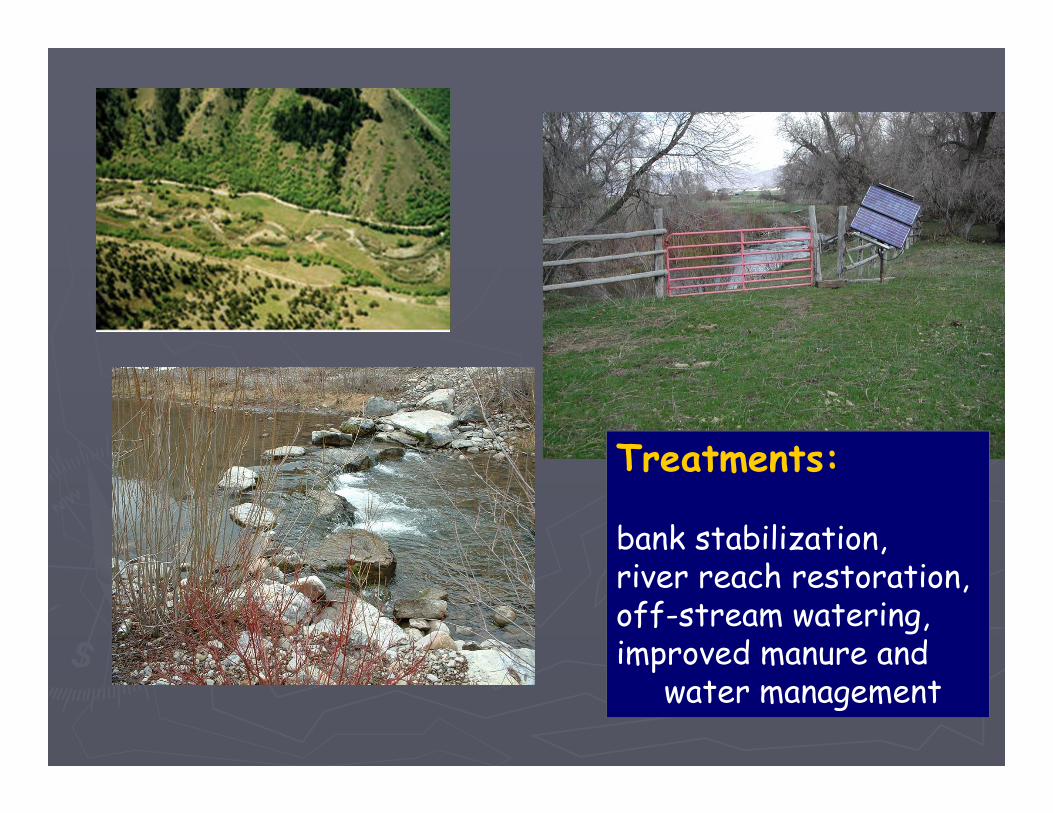
Treatments:
bank stabilization, river reach restoration,off-stream watering, improved manure and
water management
Common problems in BMP monitoring programs:
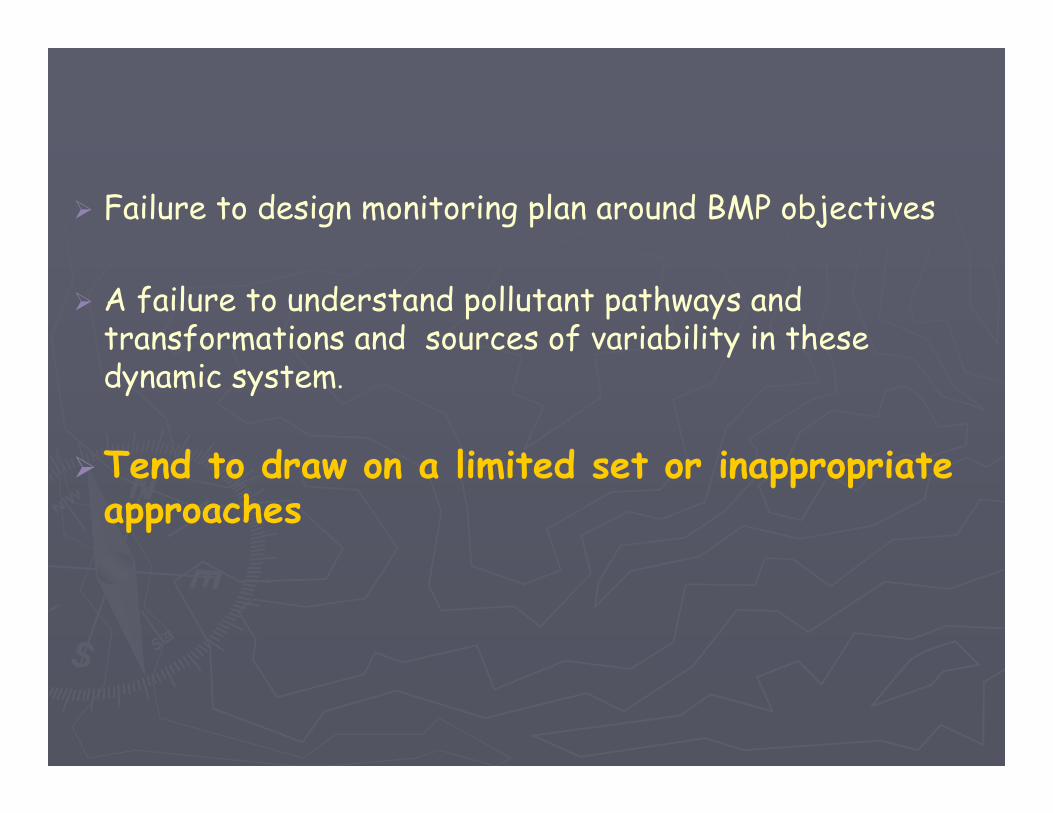
Failure to design monitoring plan around BMP objectives
A failure to understand pollutant pathways and transformations and sources of variability in these dynamic system.
Tend to draw on a limited set or inappropriate approaches
Failure to design monitoring plan around BMP objectives
A failure to understand pollutant pathways and transformations and sources of variability in these dynamic system.
Tend to draw on a limited set or inappropriate approaches
v
Little Bear River Watershed, Utah
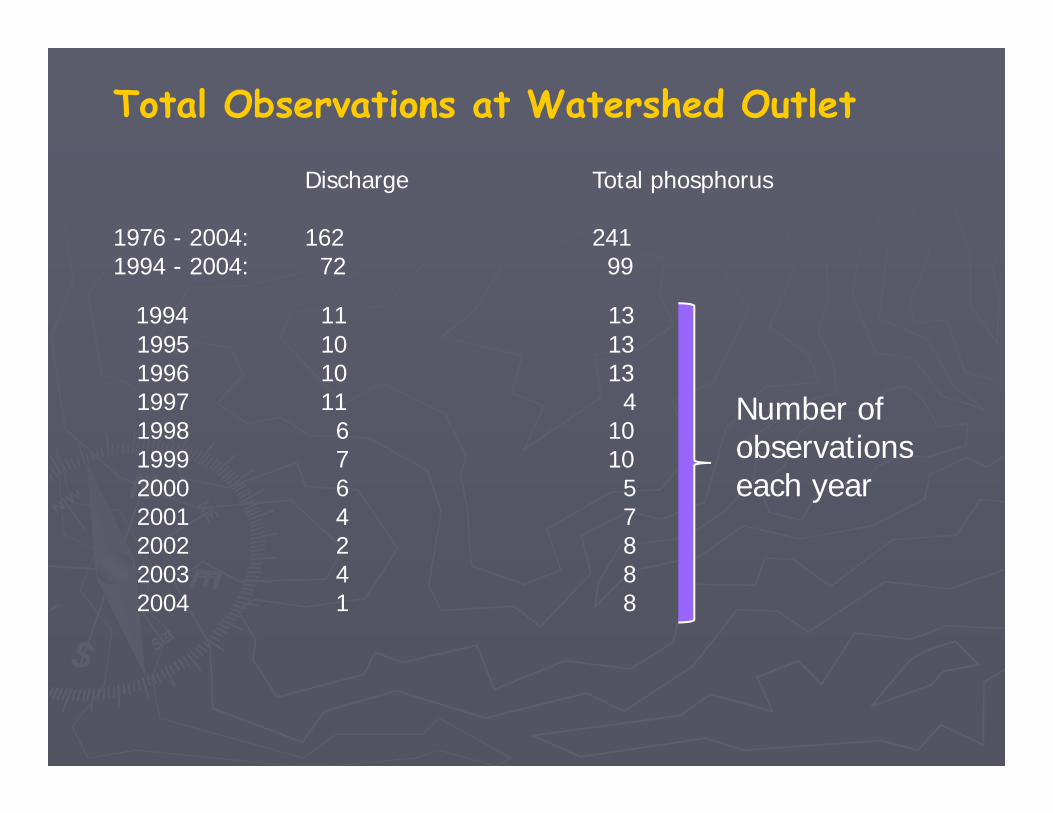
1994 11 13 1995 10 13 1996 10 13 1997 11 4 1998 6 10 1999 7 10 2000 6 5 2001 4 7 2002 2 8 2003 4 8 2004 1 8
Total Observations at Watershed Outlet
Discharge Total phosphorus
1976 - 2004: 162 241 1994 - 2004: 72 99
Number of observations each year
Failure to design monitoring plan around BMP objectives
A failure to understand pollutant pathways and transformations and sources of variability in these dynamic system.
Tend to draw on a limited set or inappropriate approaches
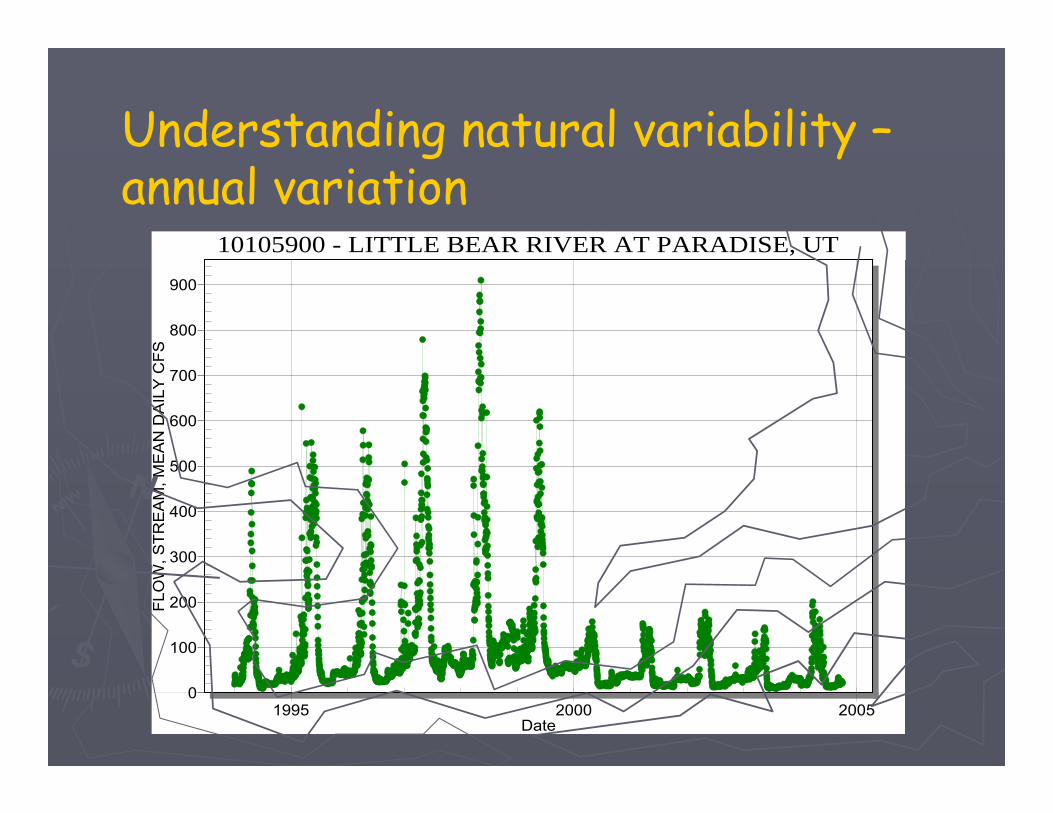
10105900 - LITTLE BEAR RIVER AT PARADISE, UT 900
800
700
600
500
400
300
200
100
0 1995 2000 2005
Date
FLO
W, S
TRE
AM
, ME
AN
DA
ILY
CFS
Understanding natural variability – annual variation
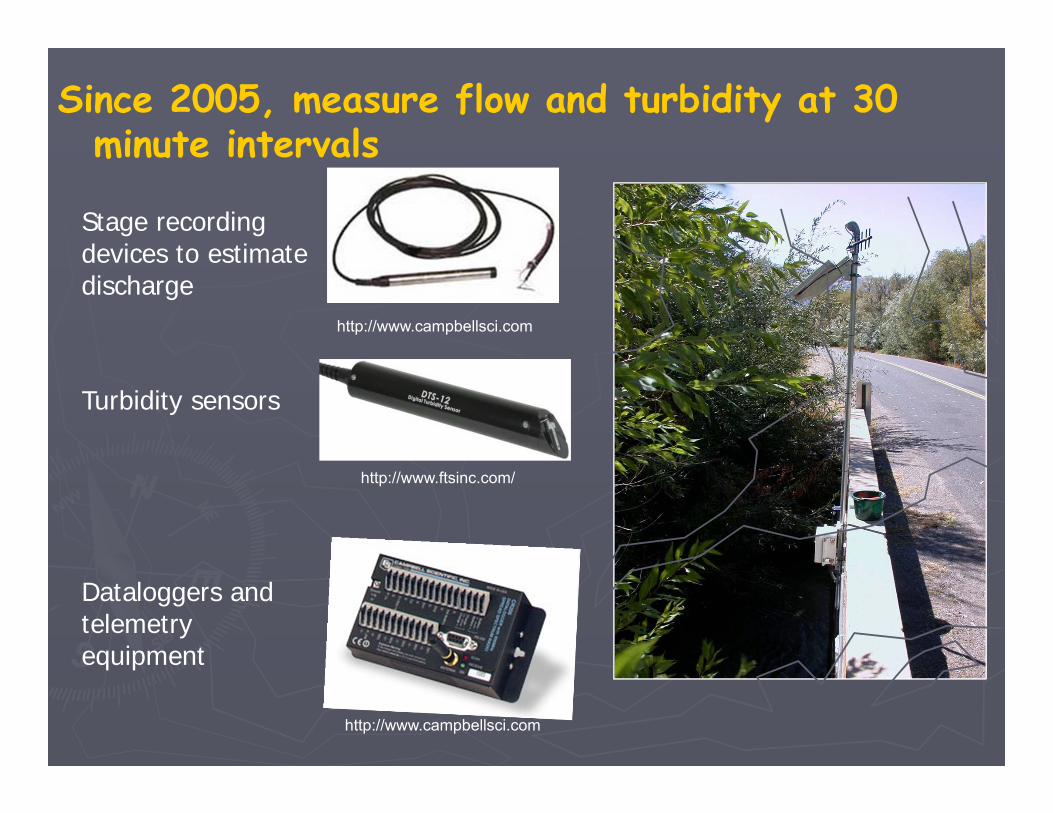
Since 2005, measure flow and turbidity at 30 minute intervals
Stage recording devices to estimate discharge
Turbidity sensors
Dataloggers and telemetry equipment
http://www.campbellsci.com
http://www.ftsinc.com/
http://www.campbellsci.com
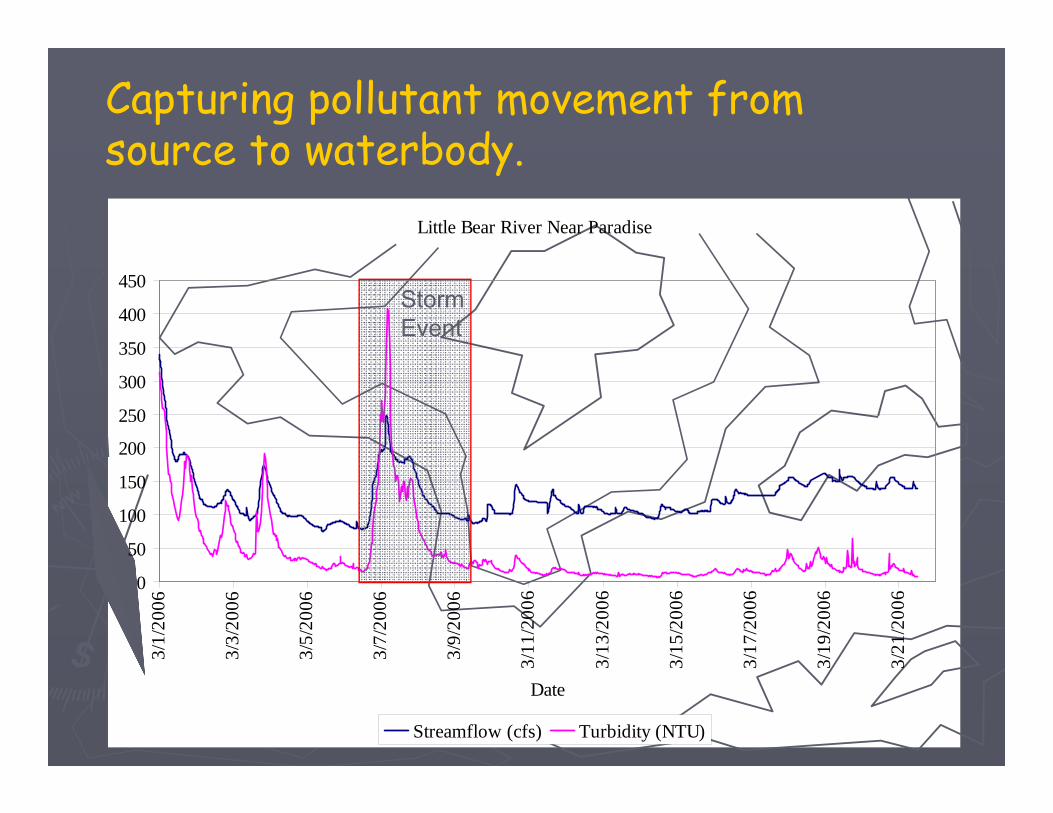
Storm Event
Little Bear River Near Paradise
450
400
350
300
250
200
0
100
150
50
3/1/
2006
3/3/
2006
3/5/
2006
3/7/
2006
3/9/
2006
3/11
/200
6
3/13
/200
6
3/15
/200
6
3/17
/200
6
3/19
/200
6
3/21
/200
6
Date
Streamflow (cfs) Turbidity (NTU)
Capturing pollutant movement from source to waterbody.
Failure to design monitoring plan around BMP objectives
A failure to understand pollutant pathways and transformations and sources of variability in these dynamic system.
Tend to draw on a limited set or inappropriate approaches
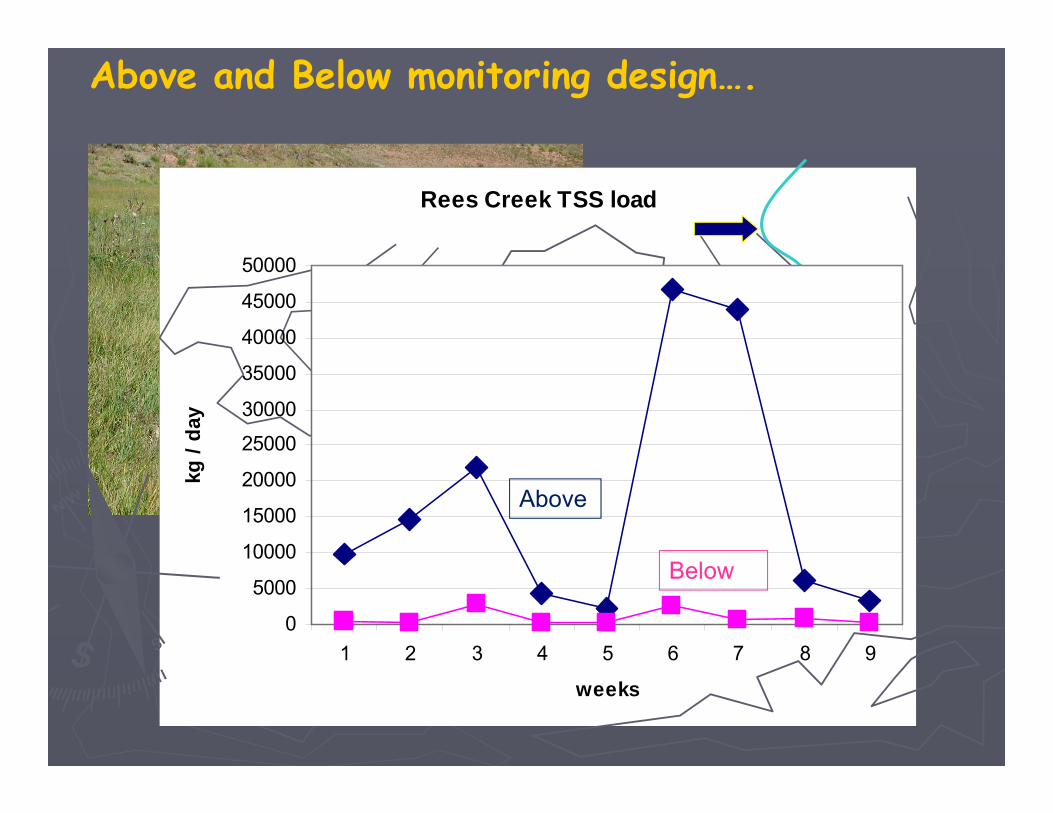
Problem: excess sedimentAverage flow = 20 cfsBMP = series of in-stream sediment basins
Above
4 5 6 7 8 9
weeks
Below
Rees Creek TSS load kg
/ da
y
50000
45000
40000
35000
30000
25000
20000
15000
10000
5000
0
1 2 3
Above and Below monitoring design….
Problems with “one-size-fits-all” monitoring design
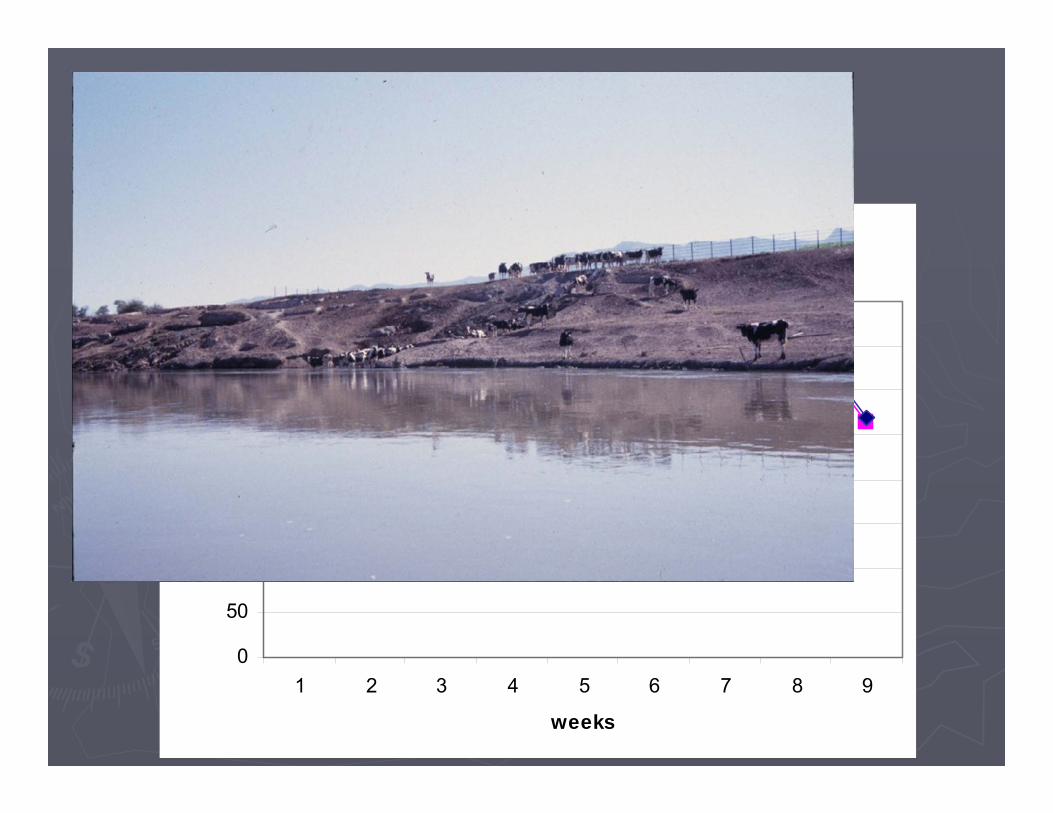
Problem: excess phosphorusAverage flow = 1000 cfsBMP = fence cattle OUT of riparian area and revegetate
Bear River phosphorus load
0
50
100
150
200
250
300
350
400
1 2 3 4 5 6 7 8 9
weeks
load
(kg/
day)
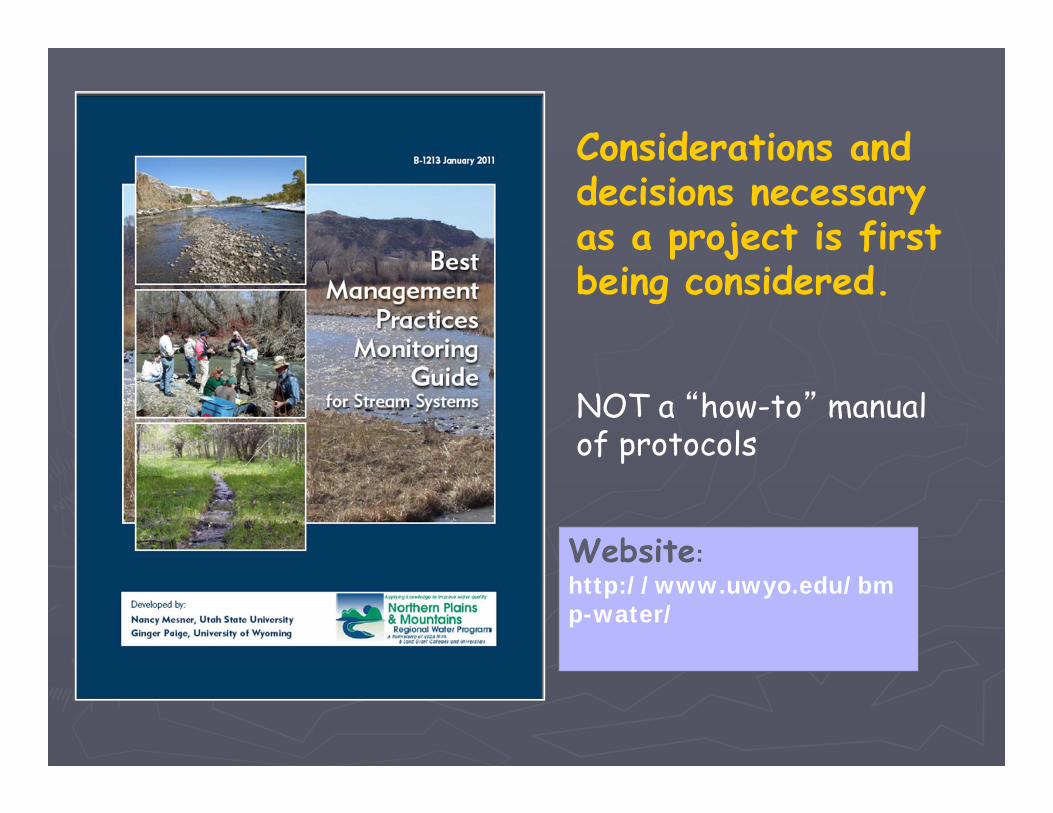
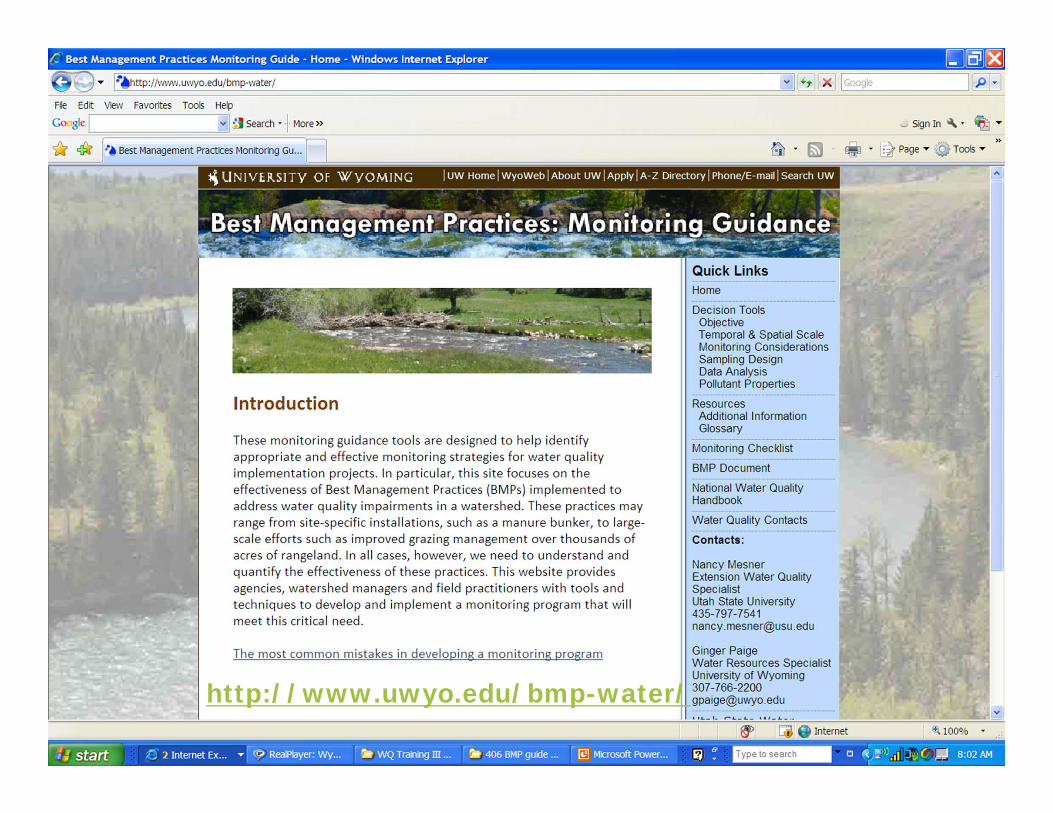
Considerations and decisions necessary as a project is first being considered.
NOT a “how-to” manual of protocols
Website: http://www.uwyo.edu/bm p-water/
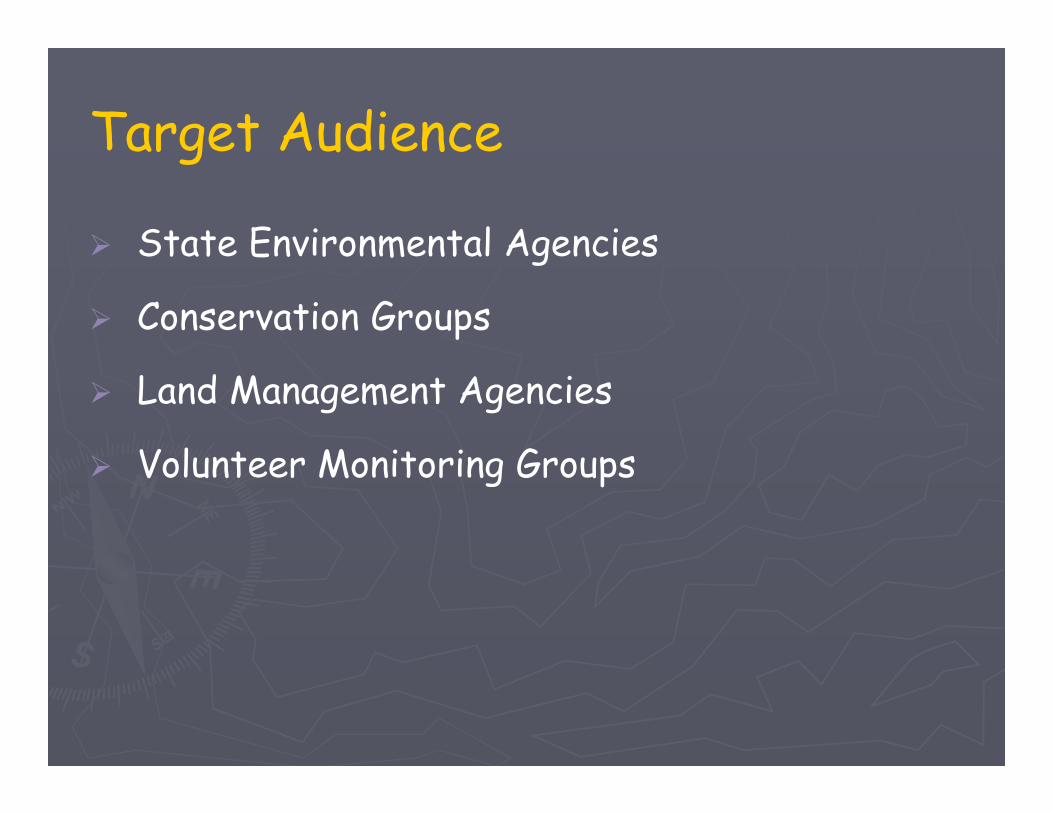
Target Audience
State Environmental Agencies
Conservation Groups
Land Management Agencies
Volunteer Monitoring Groups
Long term trends?
PDES compliance?
Educational?
Assessment for impairment?
Track response from an implementation?
What is your monitoring objective?
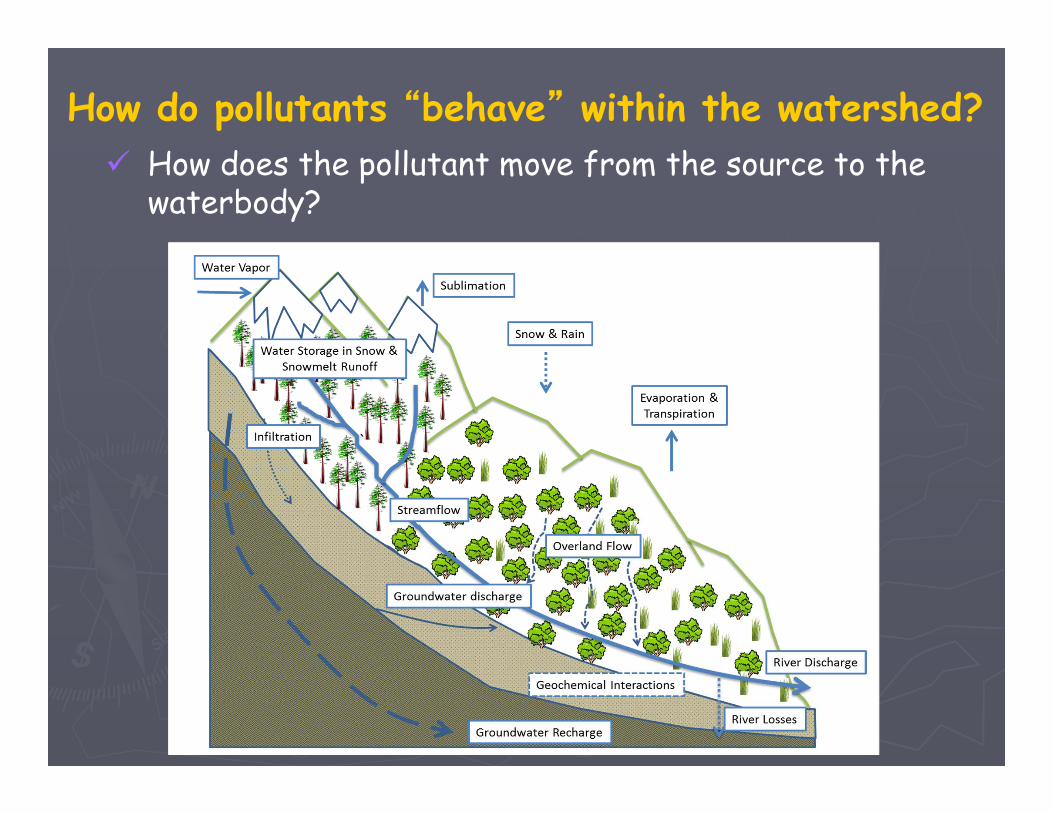
How does the pollutant move from the source to the waterbody?
How do pollutants “behave” within the watershed?
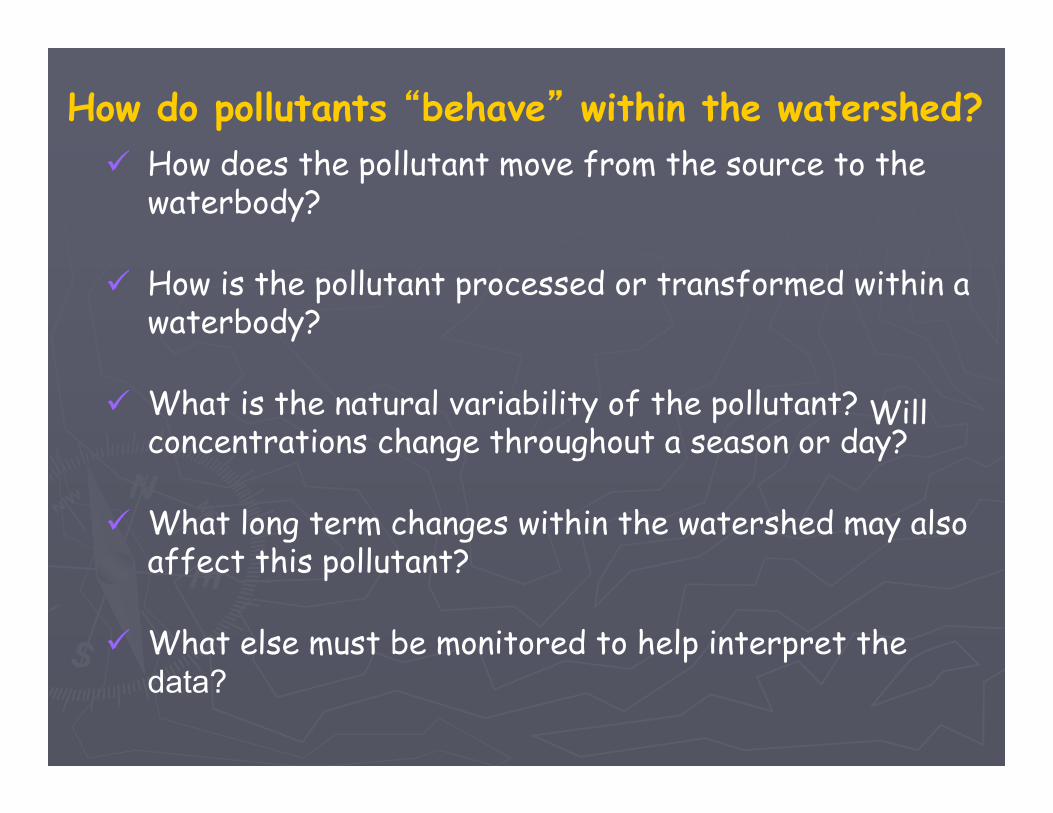
How does the pollutant move from the source to the waterbody?
How is the pollutant processed or transformed within a waterbody?
What is the natural variability of the pollutant? Will concentrations change throughout a season or day?
What long term changes within the watershed may also affect this pollutant?
What else must be monitored to help interpret the data?
How do pollutants “behave” within the watershed?
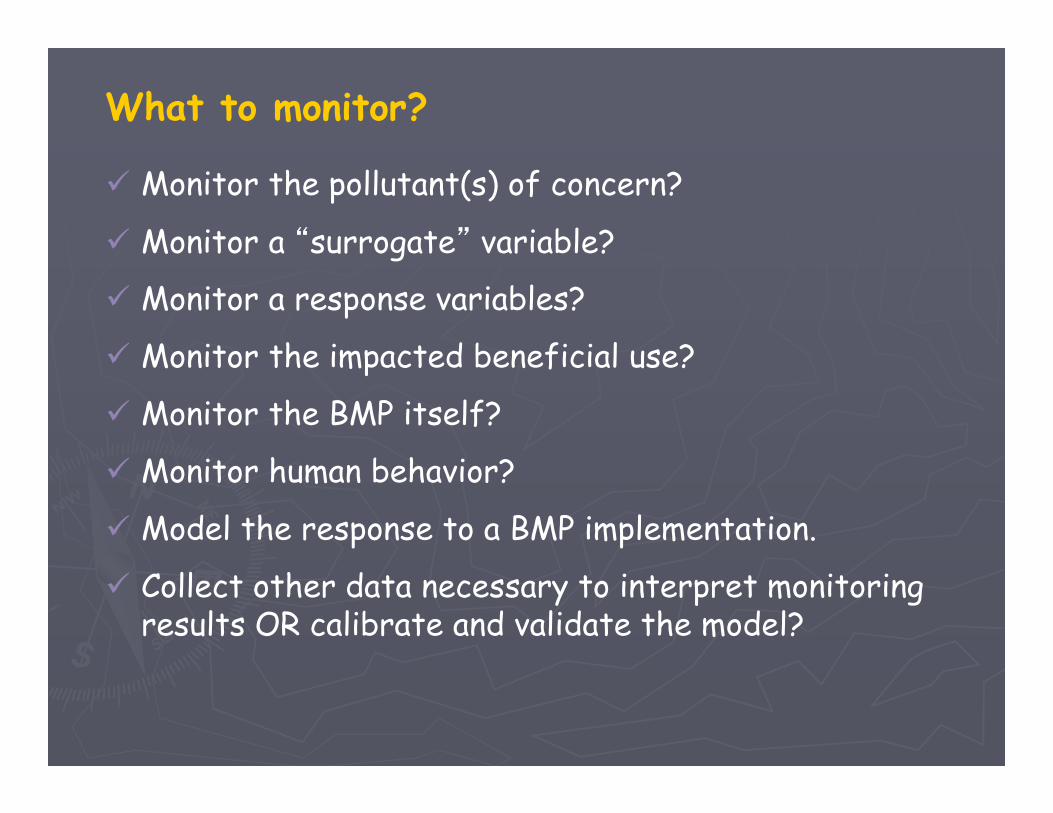
Monitor the pollutant(s) of concern?
Monitor a “surrogate” variable?
Monitor a response variables?
Monitor the impacted beneficial use?
Monitor the BMP itself?
Monitor human behavior?
Model the response to a BMP implementation.
Collect other data necessary to interpret monitoring results OR calibrate and validate the model?
What to monitor?
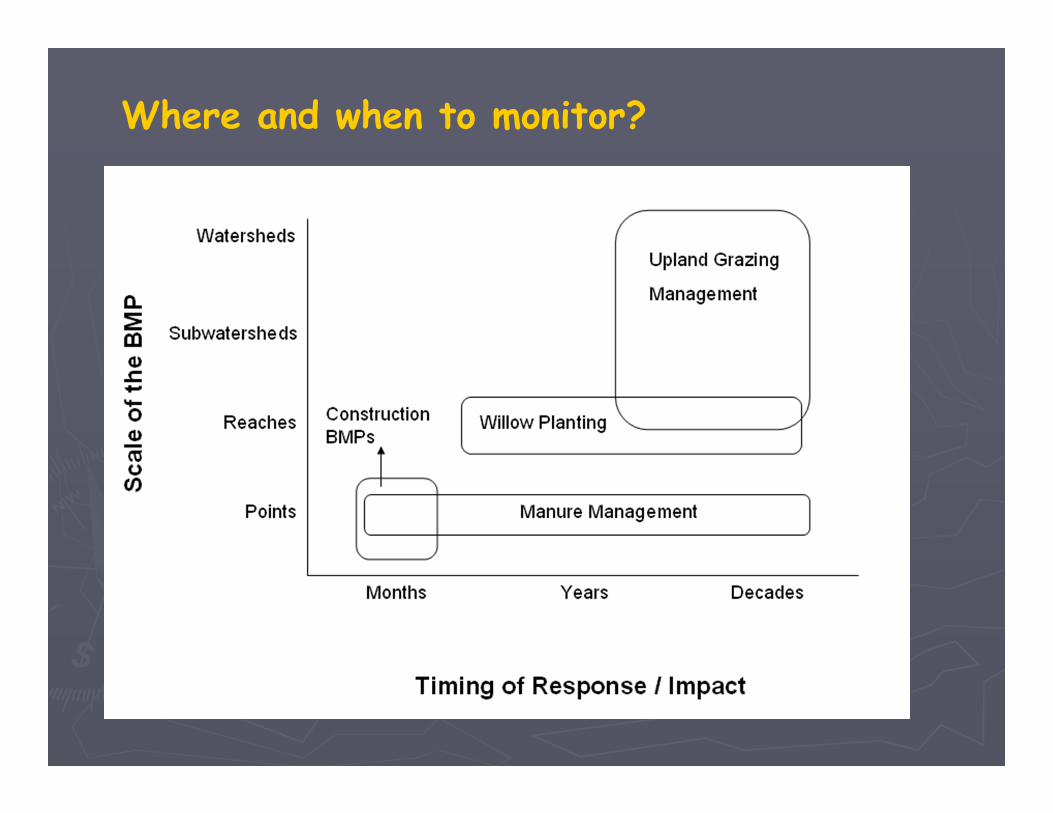
Where and when to monitor?
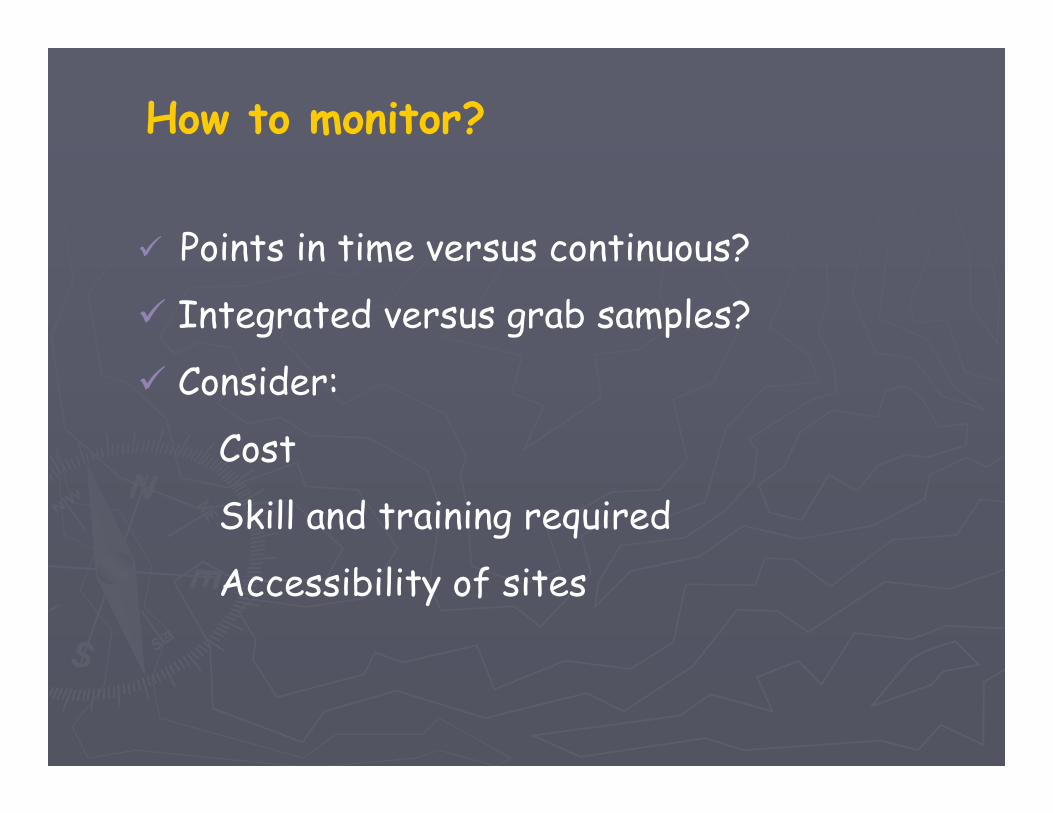
How to monitor?
Points in time versus continuous?
Integrated versus grab samples?
Consider:
Cost
Skill and training required
Accessibility of sites
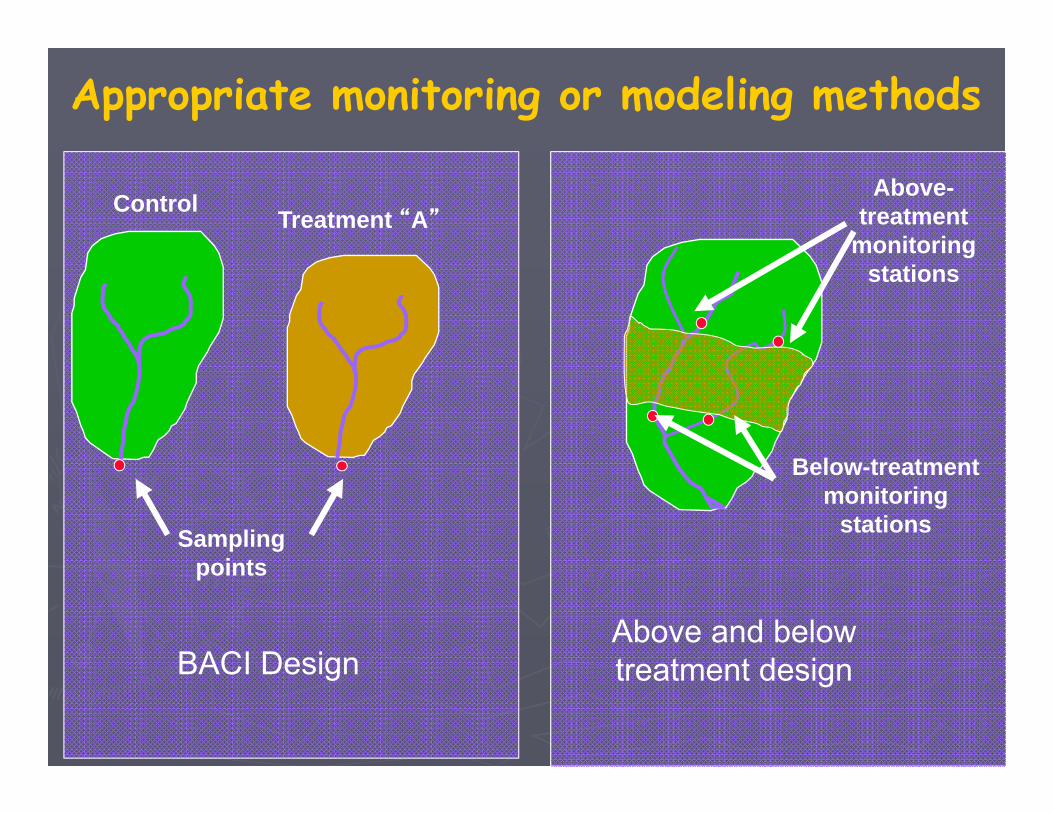
Sampling points
Control Treatment “A”
BACI Design Above and below treatment design
Below-treatment monitoring
stations
Above-treatment
monitoring stations
Appropriate monitoring or modeling methods
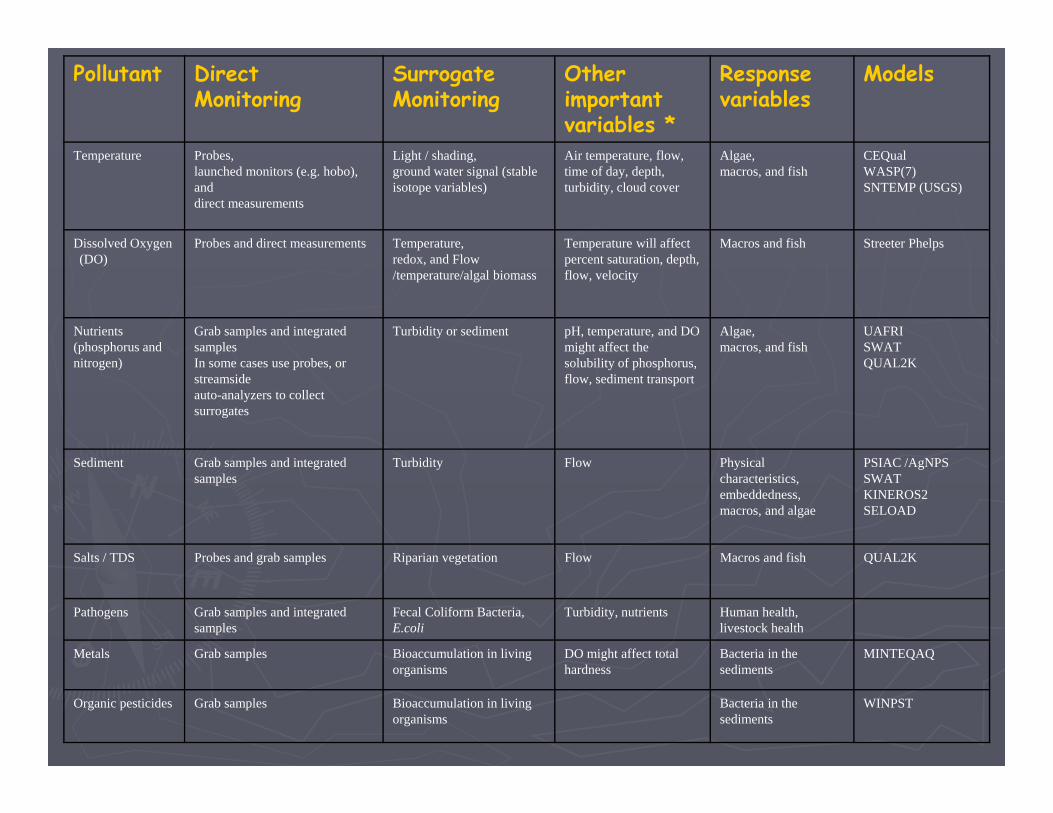
Pollutant Direct Monitoring
Surrogate Monitoring
Other important variables *
Response variables
Models
Temperature Probes, launched monitors (e.g. hobo), and direct measurements
Light / shading, ground water signal (stable isotope variables)
Air temperature, flow, time of day, depth, turbidity, cloud cover
Algae, macros, and fish
CEQual WASP(7) SNTEMP (USGS)
Dissolved Oxygen (DO)
Probes and direct measurements Temperature, redox, and Flow /temperature/algal biomass
Temperature will affect percent saturation, depth, flow, velocity
Macros and fish Streeter Phelps
Nutrients (phosphorus and nitrogen)
Grab samples and integrated samples In some cases use probes, or streamside auto-analyzers to collect surrogates
Turbidity or sediment pH, temperature, and DO might affect the solubility of phosphorus, flow, sediment transport
Algae, macros, and fish
UAFRI SWAT QUAL2K
Sediment Grab samples and integrated samples
Turbidity Flow Physical characteristics, embeddedness, macros, and algae
PSIAC /AgNPS SWAT KINEROS2 SELOAD
Salts / TDS Probes and grab samples Riparian vegetation Flow Macros and fish QUAL2K
Pathogens Grab samples and integrated samples
Fecal Coliform Bacteria, E.coli
Turbidity, nutrients Human health, livestock health
Metals Grab samples Bioaccumulation in living organisms
DO might affect total hardness
Bacteria in the sediments
MINTEQAQ
Organic pesticides Grab samples Bioaccumulation in living organisms
Bacteria in the sediments
WINPST
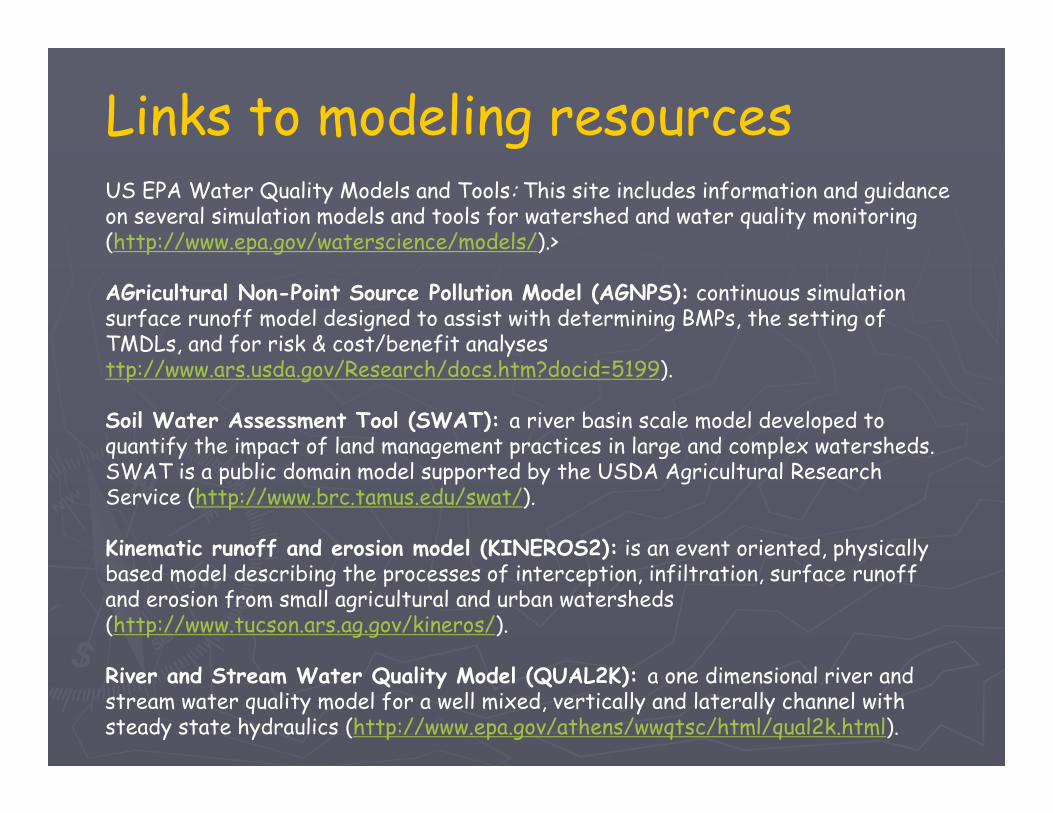
Links to modeling resources US EPA Water Quality Models and Tools: This site includes information and guidance on several simulation models and tools for watershed and water quality monitoring (http://www.epa.gov/waterscience/models/).>
AGricultural Non-Point Source Pollution Model (AGNPS): continuous simulation surface runoff model designed to assist with determining BMPs, the setting of TMDLs, and for risk & cost/benefit analyses ttp://www.ars.usda.gov/Research/docs.htm?docid=5199).
Soil Water Assessment Tool (SWAT): a river basin scale model developed to quantify the impact of land management practices in large and complex watersheds. SWAT is a public domain model supported by the USDA Agricultural Research Service (http://www.brc.tamus.edu/swat/).
Kinematic runoff and erosion model (KINEROS2): is an event oriented, physically based model describing the processes of interception, infiltration, surface runoff and erosion from small agricultural and urban watersheds (http://www.tucson.ars.ag.gov/kineros/).
River and Stream Water Quality Model (QUAL2K): a one dimensional river and stream water quality model for a well mixed, vertically and laterally channel with steady state hydraulics (http://www.epa.gov/athens/wwqtsc/html/qual2k.html).
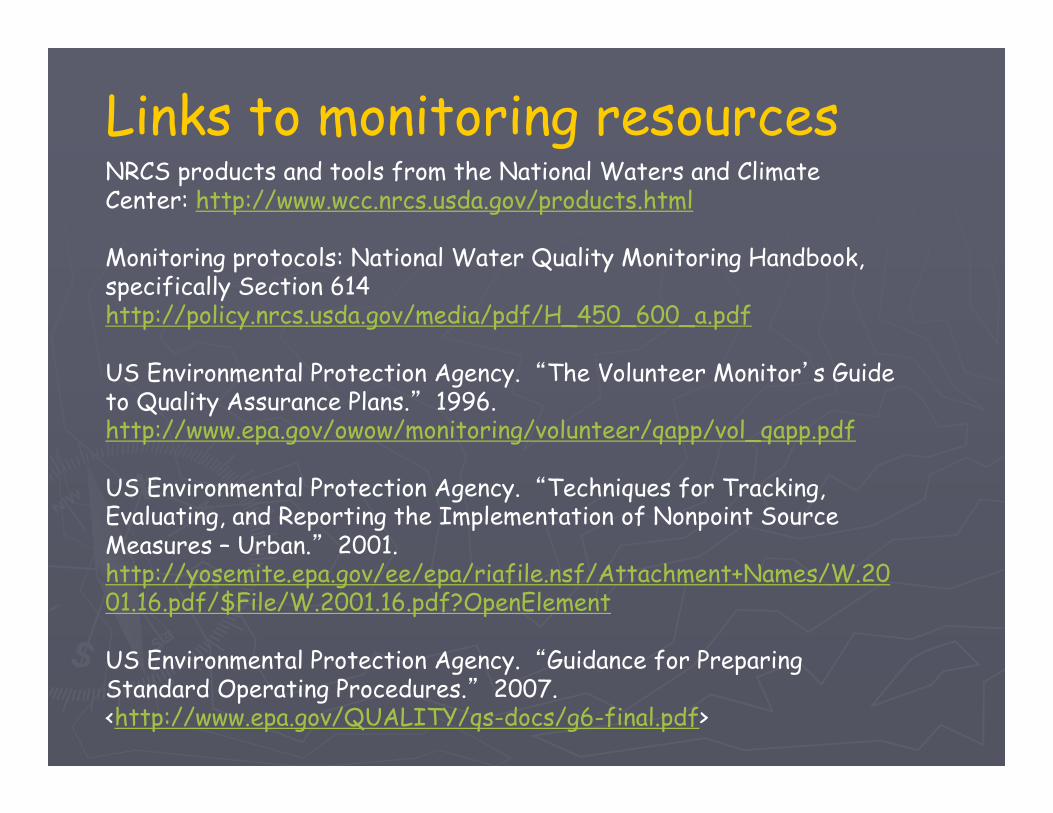
Links to monitoring resources NRCS products and tools from the National Waters and Climate Center: http://www.wcc.nrcs.usda.gov/products.html
Monitoring protocols: National Water Quality Monitoring Handbook, specifically Section 614 http://policy.nrcs.usda.gov/media/pdf/H_450_600_a.pdf
US Environmental Protection Agency. “The Volunteer Monitor’s Guide to Quality Assurance Plans.” 1996. http://www.epa.gov/owow/monitoring/volunteer/qapp/vol_qapp.pdf
US Environmental Protection Agency. “Techniques for Tracking, Evaluating, and Reporting the Implementation of Nonpoint Source Measures – Urban.” 2001. http://yosemite.epa.gov/ee/epa/riafile.nsf/Attachment+Names/W.20 01.16.pdf/$File/W.2001.16.pdf?OpenElement
US Environmental Protection Agency. “Guidance for Preparing Standard Operating Procedures.” 2007. <http://www.epa.gov/QUALITY/qs-docs/g6-final.pdf>
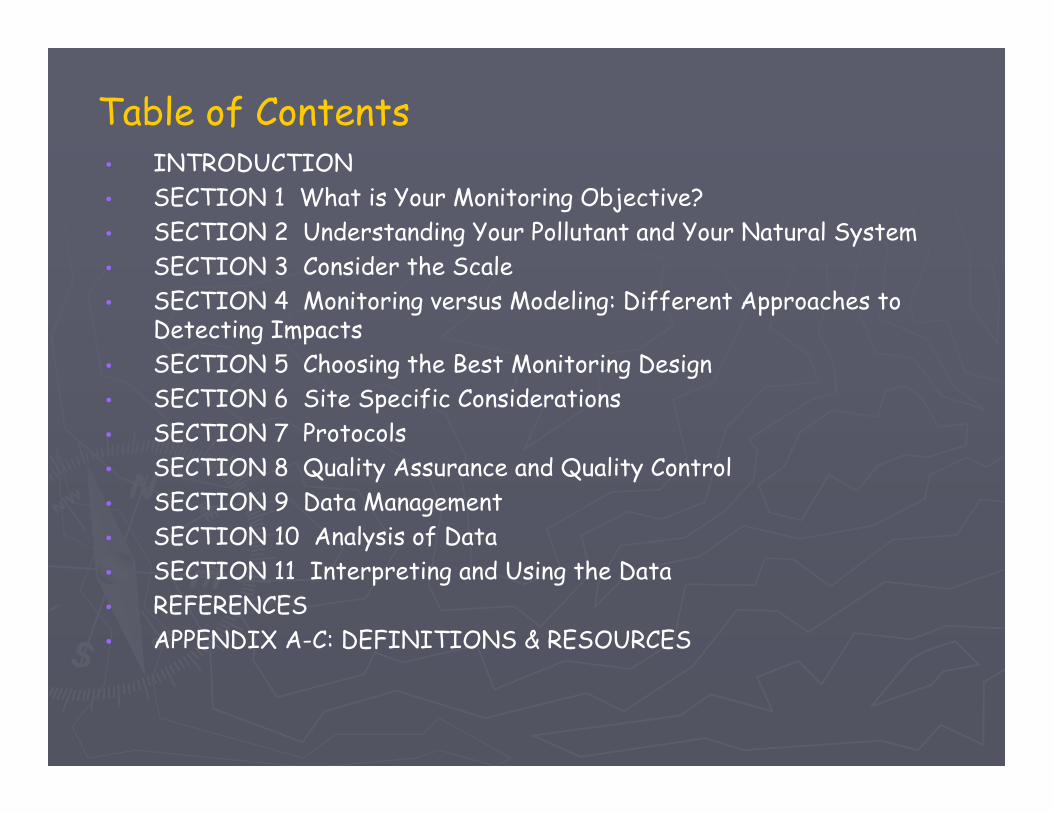
Table of Contents • INTRODUCTION • SECTION 1 What is Your Monitoring Objective? • SECTION 2 Understanding Your Pollutant and Your Natural System • SECTION 3 Consider the Scale • SECTION 4 Monitoring versus Modeling: Different Approaches to
Detecting Impacts • SECTION 5 Choosing the Best Monitoring Design • SECTION 6 Site Specific Considerations • SECTION 7 Protocols • SECTION 8 Quality Assurance and Quality Control • SECTION 9 Data Management • SECTION 10 Analysis of Data • SECTION 11 Interpreting and Using the Data • REFERENCES • APPENDIX A-C: DEFINITIONS & RESOURCES
Additional Resources - Tools • Check list
• identify KEY components of a monitoring program
• Decision Tree • non- linear process – very interactive
• Web Version of the Guidance Document: • active links to the information and references in
the Guidance Document
http://www.uwyo.edu/bmp-water/
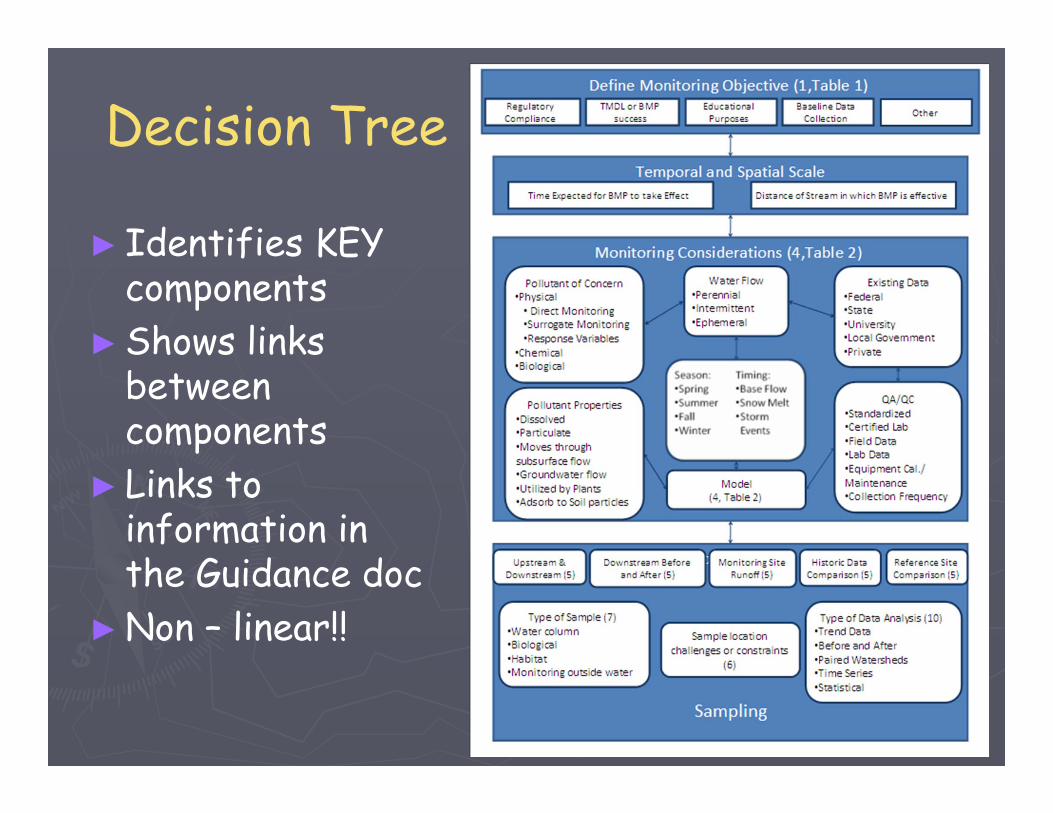
Decision Tree
► Identifies KEY components
► Shows links between components
► Links to information in the Guidance doc
► Non – linear!!
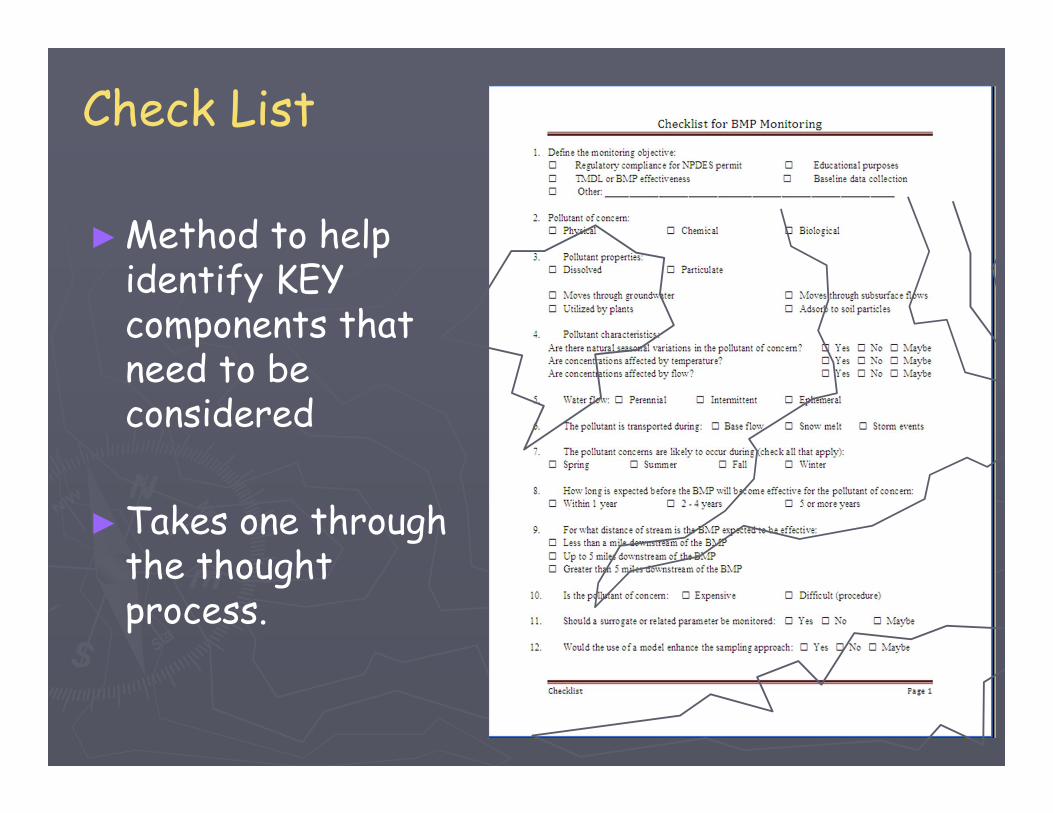
Check List
► Method to help identify KEY components that need to be considered
► Takes one through the thought process.
The road to more effective monitoring….
Monitoring plans require careful thought before anything is implemented.
Consider how the data will be used to demonstrate change.
Use your understanding of the watershed and how the pollutants of concern behave to target monitoring most effectively.
Use different approaches for different BMPs.
Keep project goals in mind when monitoringBMPs
Monitor at an appropriate scale
Keep time lags in mind
Be selective, consider individual situations
Monitor surrogates when appropriate
Control or measure human behaviors / other watershed changes.
Questions?
