effective protection and comparative advantage … · effective protection and comparative...
TRANSCRIPT
240 Vol. 7
EFFECTIVE PROTECTION AND COMPARATIVE
ADVANTAGE IN NEW ZEALAND'S FOREST ENTERPRISES:
A COMMENT
R. K. GRANT Forest Research Institute, New Zealand Forest Service, Rotorua
(Received for publication 9 February 1977)
ABSTRACT Analysis of data collected for the period 1965-66 suggests that, with the
recent high price for export logs, New Zealand's comparative advantage currently lies in the export log trade rather than in a wood processing industry. Consequently no system of differential stumpages favouring wood processing can be justified on the grounds of tariff compensation.
INTRODUCTION In two recent independent reports on the New Zealand economy, New Zealand's
system of industrial protection, through tariffs and direct import control, is said to lead to an inefficient distribution of resources (IBRD, 1968; p. 14: OECD, 1975; p. 46) which in turn has restricted the ability of manufacturing industry to play an important role in widening the country's export base. For this reason it can be argued that the assessment of the protection afforded an industry by the tariff and import control structure, and the identification of any comparative advantage, is of first importance in any planned restructuring of the economy.
With the recent expansion in forest planting there is an opportunity for forest industries to play a considerable role in export diversification (O'Neill, 1974). In large part this expansion is because forests are able to earn high returns on the capital invested. These high returns have only been demonstrated on nominal silvicultural regimes where the end-use of the forest output is known well before utilisation commences (Grant, 1976), and if a forest is to be grown correctly so that it can earn these high returns, it is necessary to define the end product well in advance of utilisation. Selecting desirable forest products requires a knowledge of any comparative advantages within the industries producing the alternative products.
Consequently, assessing the impact of industrial protection and assessing any comparative advantage amongst New Zealand's forest-based enterprises1 is both a pre-requisite to efficient forest management, and essential to the economy, if the greatest benefit from diversification into forestry is to be gained.
The two previous assessments of comparative advantage in forest industries produce an apparent conflict. Fenton (1972) demonstrated that (at 1968 costs and prices) growing forests for the log export trade was both highly profitable and, up to the
1 Log exporting is regarded as an industry in this context.
N.Z. J. For . Sci. 7(2): 240-9 (1977).
No. 2 Grant — Effective Protection and Comparative Advantage 241
forest ride, had a low domestic cost per export dollar earned. Because wood processing for export necessarily includes most of the import cost of the export log trade, and must also bear the (much higher) import cost of the processing2, the criterion "the domestic cost of foreign exchange" strongly favours log exports. It has been argued that ranking industries by the criterion "domestic cost of foreign exchange" will indicate the comparative advantages of the industries (IBRD, 1968). Therefore, the analysis of Fenton (op. cit.) suggests that New Zealand's comparative advantage within the forest industries lies in the export log trade.
On the other hand, Donnelly (1974) has suggested that by forcing industries to purchase their inputs at higher than world market prices, either from protected domestic industry or by importing under a tariff, exporting industries are forced to suffer "a cost of protection of domestic industry" which is not balanced by protection on their products (since these are exported). Thus forest processing industries producing for export are said to be restricted in the stumpages they can afford to pay in a way the export log industry is not.
Donnelly (op. cit.), in a preliminary analysis, has suggested that the "cost of protection" in 1974 to the pulp and paper industry was equivalent to ". . . at least $7.40/m3 of wood input". Compared with the average stumpage of all Forest Service exotic timber sales in 1974 of $2.25/m3 (N.Z. Forest Service, 1975) this cost of protection is considerable and Donnelly (op. cit.) suggests that if firms were compensated for the combined cost of protection and tariffs it would be profitable to grow wood for pulping. More importantly, incorporating these items in the analysis of comparative advantage would significantly reduce the estimates of the domestic cost of foreign exchange earned by wood processing.
Obviously there is some merit in both arguments and this paper is an attempt to resolve the apparent conflict.
SELECTING A CRITERION It is apparent that using the criterion "domestic cost of net exports" when ranking
the sawmilling, pulp and paper making, and export log industries by their comparative advantage ignores the cost of protection of domestic inputs and the cost of tariffs on imports. Since these items will have differing impacts on the international competitiveness of each industry it is necessary to incorporate them in any criterion used to rank industries by their comparative advantage.
One criterion which includes both the cost of domestic protection and the cost of tariffs in an attempt to measure the ability of an industry to compete in a free trade situation, is the rate of effective protection3. For this reason ranking industries by their effective rates of protection is considered the better indicator of their comparative advantage within a country's domestic industry (Balassa and Schydlowsky, 1968; Balassa, 1971 p. 338).
There are several concepts of effective protection (Corden, 1966). The simplest
2 The 1965-66 Input-Output table shows that imports were 16.7% of gross value of output of the pulp and paper industry, 6.1% of sawmilling industry's output and 8.5% of the gross value of output of forestry and logging.
3 The effective rate of protection is the increased cost of domestic inputs due to the protection of the supplying industries less the value of protection on its own output. This is expressed as a percentage of the value added in manufacture.
242 New Zealand Journal of Forestry Science Vol. 7
considers only the protection cost of the tariff structure, the import licensing system, subsidies and commodity taxes. This assumes that the prices of non-traded goods and services4 are given, the exchange rate is fixed; and it is the concept used by Donnelly (op. cit.) in deriving his estimates.
However, the existence of effective protection of domestic industry ensures that the exchange rate is over-valued compared with a free trade situation. Effective rates of protection calculated at current exchange rates will therefore over-estimate the extent of protection of individual industries. Thus in estimating the absolute cost of protection and in deriving the absolute rate of effective protection (the net effective protection) it is necessary to incorporate the exchange rate adjustment required to bring the economy to balance of payments equilibrium under free trade conditions.
There is also considerable discussion about the protection afforded non-traded inputs. They are variously held to have no effective protection (Balassa, 1971); to have the rates of protection of the industries in which they are used (Corden, 1966); and to have an effective protection derived from the premise that the protection on an input is the same whether it is an input to either the trading or non-trading sector (Elkan, 1972).
Of these, Corden's treatment of non-traded inputs is the only system providing an inviolate ranking of industries by their effective rates of protection for all exchange rates. Although rankings for both Balassa's and Elkan's treatment of non-traded inputs may change with the exchange rate, any changes are likely to be minor. For this work Elkan's method is preferred, primarily because "Elkan-based" estimates of the nominal protection accorded non-traded inputs are available for New Zealand.
Given these (and other) assumptions5 it is possible to define the effective rate of protection of an industry in terms of the proportion of the output which is input from other industries, the excess in domestic costs of these inputs over world market prices, and the excess of domestic price over world price of the industry's6 output.
4 Non-traded goods and services are manufacturing inputs which are not traded internationally (electricity, retail and wholesale trade, transport, construction, etc.).
5 Evans (1972) has demonstrated that this criterion (which assumes no change in the mix of inputs in a production process and a constant level of output) might be inaccurate if changes in the mix of inputs to some production processes occur as a result of adopting free trade; such changes in the mix of inputs would necessarily affect the level of output of other industries. However, since the present analysis is largely concerned with export sales from new plant, the use of outputs from forest industries in other domestic industries is not envisaged. In these circumstances the "partial equilibrium" criterion described in the text is likely to be a good indicator of comparative advantage.
6 Following the notation of Elkan (op. cit.) the effective protection of industry is: 1 - X a ,
i + ti 2 1 + t3. = inputs from industry j into industry i (protected prices) as proportion of the
value of output of industry i. = excess of domestic prices of output of industry i over world market prices expressed as a percentage of the world price. = excess of domestic prices of inputs from industry j over world market
prices expressed as a percentage of world prices.
where a.. =
t, =
tj =
No. 2 Grant — Effective Protection and Comparative Advantage 243
DERIVING THE COSTS OF PROTECTION Standardised Input Coefficients
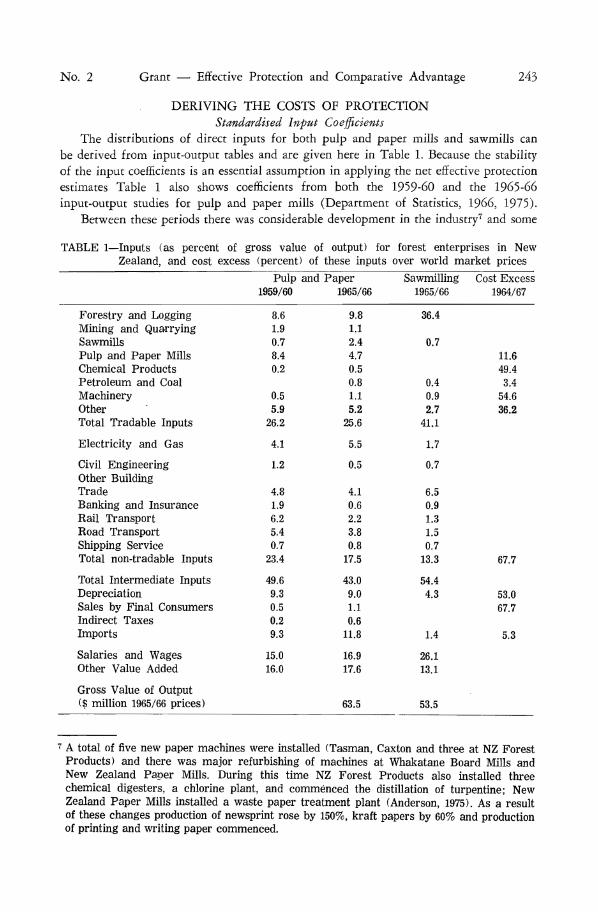
The distributions of direct inputs for both pulp and paper mills and sawmills can be derived from input-output tables and are given here in Table 1. Because the stability of the input coefficients is an essential assumption in applying the net effective protection estimates Table 1 also shows coefficients from both the 1959-60 and the 1965-66 input-output studies for pulp and paper mills (Department of Statistics, 1966, 1975).
Between these periods there was considerable development in the industry7 and some
TABLE 1—Inputs (as percent of gross value of output) for forest enterprises in New Zealand, and cost excess (percent) of these inputs over world market prices
Forestry and Logging Mining and Quarrying Sawmills Pulp and Paper Mills Chemical Products Petroleum and Coal Machinery Other Total Tradable Inputs
Electricity and Gas
Civil Engineering Other Building Trade Banking and Insurance Rail Transport Road Transport Shipping Service Total non-tradable Inputs
Total Intermediate Inputs Depreciation Sales by Final Consumers Indirect Taxes Imports
Salaries and Wages Other Value Added
Gross Value of Output ($ million 1965/66 prices)
Pulp and Paper 1959/60
8.6 1.9 0.7 8.4 0.2
0.5 5.9
26.2
4.1
1.2
4.8 1.9 6.2 5.4 0.7
23.4
49.6 9.3 0.5 0.2 9.3
15.0 16.0
1965/66
9.8 1.1 2.4 4.7 0.5 0.8 1.1 5.2
25.6
5.5
0.5
4.1 0.6 2.2 3.8 0.8
17.5
43.0 9.0 1.1 0.6
11.8
16.9 17.6
63.5
Sawmilling 1965/66
36.4
0.7
0.4 0.9 2.7
41.1
1.7
0.7
6.5 0.9 1.3 1.5 0.7
13.3
54.4 4.3
1.4
26.1 13.1
53.5
Cost Excess 1964/67
11.6 49.4 3.4
54.6 36.2
67.7
53.0 67.7
5.3
7 A total of five new paper machines were installed (Tasman, Caxton and three at NZ Forest Products) and there was major refurbishing of machines at Whakatane Board Mills and New Zealand Paper Mills. During this time NZ Forest Products also installed three chemical digesters, a chlorine plant, and commenced the distillation of turpentine; New Zealand Paper Mills installed a waste paper treatment plant (Anderson, 1975). As a result of these changes production of newsprint rose by 150%, kraft papers by 60% and production of printing and writing paper commenced.
244 New Zealand Journal of Forestry Science Vol. 7
significant changes in the distribution of inputs of pulp and paper mills. In general, both tradable inputs (including imports) and energy increased in importance at the expense of non-tradable inputs. This can probably be attributed in part to economies arising from the increase in the scale of operations and in part to the increased depth of manufacture between the two periods. However, the differences between the two sets of coefficients illustrate the uncertainty involved in estimating the effect of the tariff structure on future pulp industries.
There is even greater uncertainty about the relevance of the sawmilling input coefficients given in Table 1 to any further sawmilling operation. In many respects the sawmilling industry in New Zealand has failed to keep pace with world technology. The industry is characterised by a large number of small mills. In the few larger mills equipment is often old, and in those mills which are integrated with pulp and paper plants sawmilling is regarded as a necessary adjunct to the main operations. Early prospects of the benefits of integration do not appear to have been realised. Consequently, there is a considerable possibility that the future sawmilling operations designed for export will adopt modern technology and become more capital intensive and less labour intensive.
Cost Excess Rates From comparisons of world and domestic prices, Elkan (1972) defined average
rates of cost-excess of domestic prices over world market prices during 1964-67 for each of twenty-five sectors of production. From these he also estimated cost-excess rates for unattributed manufacturing inputs, non-tradable inputs and depreciation. In using these cost-excess rates to calculate the cost of protection to the forest industries it is necessary to assume both that the forest industry's input from other sectors is typical of the demand for these other sectors' output, and that the prices charged are the same for all. In fact, the pulp and paper industry is one of New Zealand's largest industries and it would be reasonable to expect it to enjoy some economies of scale in purchasing. These could substantially reduce the cost-excess rate for some inputs.
The only input where economies of scale in purchasing can be identified is the cost of electricity. While the cost to the pulp and paper industry has not been published a reasonable estimate of the cost would be that it is similar to the steel industry, which has similar power demands. If this is so, then contrary to earlier opinion (IBRD, 1968; p. 43), the pulp and paper industry apparently suffers no disadvantage.
Cost of electricity (cents/kWh) to the pulp and paper industry — Canada 1968 0.489 (Canadian currency) 0.469 (N.Z. currency)
1972 0.530 (Canadian currency) 0.442 (N.Z. currency) U.S.A. 1967 0.716 (U.S.A. currency) 5.526 (N.Z. currency)
1971 0.804 (U.S.A. currency) 0.705 (N.Z. currency) New Zealand 1970-71 (inferred) 0.417 (N.Z. currency) (Sources: Canadian Ministry of Industry, Trade and Commerce, 1974; U.S. Department of Commerce, 1975; N.Z. Department of Electricity, 1971)
Accordingly the cost-excess rate for electricity has been set to zero.
It is difficult to make predictions about future cost-excess rates, but because of probable economies of scale in the pulp and paper industry the cost-excess rates used here can probably be regarded as maxima for the exchange rate then prevailing.
No. 2 Grant — Effective Protection and Comparative Advantage 245
Exchange rates While there can be a great deal of discussion about both the existence and the
appropriateness of a single equilibrium exchange rate (Balassa and Schydlowsky, 1968) it is clear that the exchange rate used should not reflect any short-term fluctuations in the balance of trade. Over the last fifteen years New Zealand has suffered considerable fluctuations in its terms of trade although these have not always been reflected in the exchange rate8. Since the equilibrium exchange rate is closely linked with any movement in the terms of trade it is hard to nominate a single exchange rate as an "equilibrium rate", even for free trade conditions. Estimates of the absolute cost of effective protection to an exporting industry should, therefore, be tested to sensitivity over a range of rates. Accordingly, both the exchange rate extant when the data was collected 1965-66 (US$1,385), the current (January, 1976) exchange rate (US$1.05), and Scobie and Johnson's equilibrium exchange rate9 (US$0.78) are used. Conveniently these encompass the range of exchange rates over the last fifteen years.
Export Incentives
As future forest utilisation plants will be producing for export, and selling in unprotected markets, they will qualify for export incentives. Currently, twenty-five percent of any increase in export sales is tax deductible10. Because of the way the increase in exports is calculated, new enterprises exporting their output will continue to receive tax refunds from this source for six years.
To compare the monetary value of the export incentives with the annual cost of protection it is necessary to convert the export incentives to an equivalent annuity. This immediately raises the problem of selecting a discount rate and determining the duration of the annuity.
In New Zealand it has been estimated that the opportunity-cost of capital in the private sector during 1974 was between 12% and 15% (Battersby and Smallbone, 1974) and Rose (1974) suggested that the discount rate used in assessing projects in the private sector ". . . could well be of the order of 15%, and that certainly the average could be expected to be well in excess of 10 percent". In order to be conservative in estimating the impact of export incentives a 15 percent discount rate is used.
There can be less certainty in selecting the term of the annuity, and the 10 year term used is arbitrary. However, at such high interest rates the annuity is relatively
8 Fenton and Dick (1972) comment that one of the criteria suggested by Treasury in 1971 was to weight the value of foreign exchange by 10%.
9 Scobie and Johnson (1974) suggest that in 1969 when NZ$1.00 = US$1.12 New Zealand's currency was over-valued by 30% because of trade restrictions; that is, in their estimation the equilibrium exchange rate under free trade in 1969 was NZ$1.00 = US$0.78. However in 1969 the terms-of-trade index was 88 (1957 = 100) and there is no indication that the equilibrium exchange rate would have been the same for 1966 (terms-of-trade index 107) or for 1975 (terms-of-trade index 75).
10 Increase in export sales is based on the difference between current exports and average annual exports made during the first three of the last seven years (Inland Revenue Department, 1975). Currently export incentives are restricted to manufacturing industries. They are therefore not available for exports of unprocessed primary products such as meat, wool, butter and logs.
246 New Zealand Journal of Forestry Science Vol. 7
insensitive to lengthening the term. Thus, doubling the term to 20 years only reduces the annuity by 20% while halving the term to 5 years increases the annuity by 50%.
Given these factors, the impact of changes in the rate of company taxation and the rate of export incentive on the value of the export incentive annuity (equivalent to value of export incentives; based on a 10-year term and 15% interest rate, and expressed as percentage of Gross Value of Output) is as follows:
Incentive rate (%) Rate of maximum company tax (%) 45 50 55
20 5.9 7.4 8.9 25 6.6 8.4 10.0 30 7.3 9.1 10.9
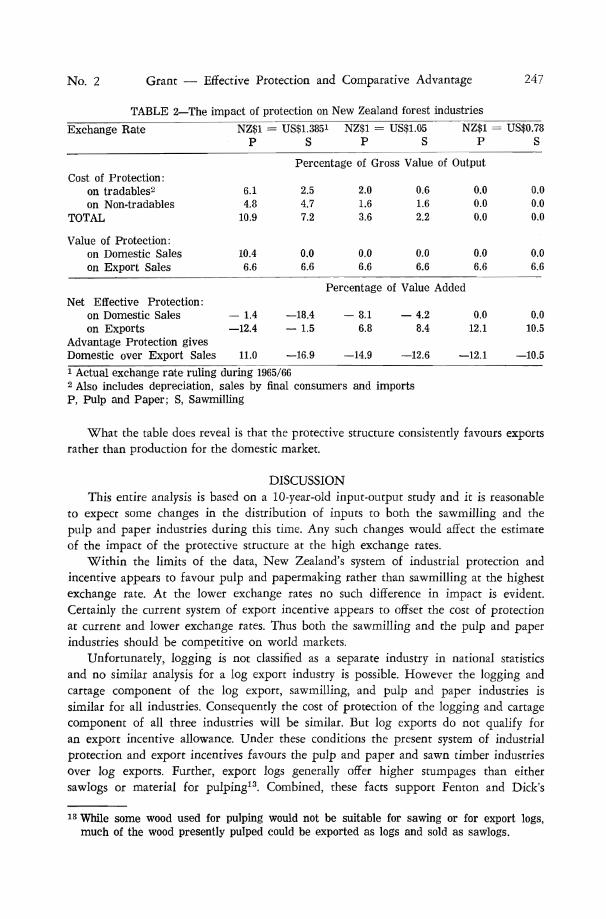
The Net Costs of Protection From the previous assumptions, estimates of the cost of industrial protection can be
derived for both the pulp and paper and the sawmilling industries (Table 2). At Scobie and Johnson's equilibrium exchange rate (NZ$1.00 = US$0.78) none of the inputs to the pulp and paper and sawmilling industries incur a cost of protection. A feature of the results at the other exchange rates is the way in which the estimates of both the costs of protection and the rates of net effective protection are dominated by the assumptions used. If, for example, non-tradable goods and services, such as banking, building, insurance and transport, are no more expensive in New Zealand than in other countries, then both industries would have benefited from the protective structure for all combinations of exchange rates and markets. Alternatively, if the term of the export incentive annuity was reduced to seven years the pulp and paper industry would not suffer a net cost of protection in the export market at the 1965/66 exchange rate. In addition, there is considerable uncertainty in the input coefficients, suggesting that a much different set of proportional inputs would exist under free trade. For these reasons the absolute value of the figures in Table 2 must be regarded with considerable scepticism and comments should be limited to comparative statistics.
With this qualification in mind it is apparent that the figures for 1965/66 support Donnelly's contention (op. cit.) that the system of industry protection is a net cost to the pulp and paper industry on both the domestic and export markets at the 1965/66 exchange rate11. However, Donnelly's claim that the system of protection puts the pulp and paper industry at a disadvantage to the sawmilling industry in competing for wood (op. cit.) is not substantiated. In fact, Table 2 shows that any advantage the protective structure offers is dependent on the exchange rate selected. Only at high exchange rates (which are unlikely to be equilibrium rates within the current range of movement of the terms of trade) would a stumpage differential favouring pulp and paper mills be justified on tariff compensation grounds12.
11 However, Donnelly's estimate that the cost of protection to the pulp and paper industry is ". . . at least $7.40/m3 of wood input" (op. cit.) is high. Even conceding that the whole of the net cost of protection can be charged to stumpage the impact would range between a cost of $1.54/m3 and a subsidy of approximately $5.00/m3 depending on the equilibrium exchange rate.
12 In fact, Table 4 shows that at the equilibrium exchange rate neither the sawmilling nor the pulp and paper industry suffer a cost of protection on any of their inputs. Consequently the question of stability of the input coefficients raised earlier is irrelevant in determining the net effective protection accorded the two industries.
No. 2 Grant — Effective Protection and Comparative Advantage 247
TABLE 2—The impact of protection on New Zealand forest industries Exchange Rate
Cost of Protection: on tradables2
on Non-tradables TOTAL
Value of Protection: on Domestic Sales on Export Sales
Net Effective Protection: on Domestic Sales on Exports
Advantage Protection gives Domestic over Export Sales
NZ$1 = P
6.1 4.8
10.9
10.4 6.6
— 1.4 —12.4
11.0
= US$1.3851
S NZ$1 =
P US$1.05
S NZ$1 =
P
Percentage of Gross Value of Output
2.5 4.7 7.2
0.0 6.6
2.0 1.6 3.6
0.0 6.6
0.6 1.6 2.2
0.0 6.6
0.0 0.0 0.0
0.0 6.6
Percentage of Value Added
—18.4 — 1.5
—16.9
— 8.1 6.8
—14.9
— 4.2 8.4
—12.6
0.0 12.1
—12.1
US$0.78 S
0.0 0.0 0.0
0.0 6.6
0.0 10.5
—10.5 1 Actual exchange rate ruling during 1965/66 2 Also includes depreciation, sales by final consumers and imports P, Pulp and Paper; S, Sawmilling
What the table does reveal is that the protective structure consistently favours exports rather than production for the domestic market.
DISCUSSION This entire analysis is based on a 10-year-old input-output study and it is reasonable
to expect some changes in the distribution of inputs to both the sawmilling and the pulp and paper industries during this time. Any such changes would affect the estimate of the impact of the protective structure at the high exchange rates.
Within the limits of the data, New Zealand's system of industrial protection and incentive appears to favour pulp and papermaking rather than sawmilling at the highest exchange rate. At the lower exchange rates no such difference in impact is evident. Certainly the current system of export incentive appears to offset the cost of protection at current and lower exchange rates. Thus both the sawmilling and the pulp and paper industries should be competitive on world markets.
Unfortunately, logging is not classified as a separate industry in national statistics and no similar analysis for a log export industry is possible. However the logging and cartage component of the log export, sawmilling, and pulp and paper industries is similar for all industries. Consequently the cost of protection of the logging and cartage component of all three industries will be similar. But log exports do not qualify for an export incentive allowance. Under these conditions the present system of industrial protection and export incentives favours the pulp and paper and sawn timber industries over log exports. Further, export logs generally offer higher stumpages than either sawlogs or material for pulping13. Combined, these facts support Fenton and Dick's
13 While some wood used for pulping would not be suitable for sawing or for export logs, much of the wood presently pulped could be exported as logs and sold as sawlogs.
248 New Zealand Journal of Forestry Science Vol. 7
(op. cit.) conclusions that with the existing industry structure New Zealand's comparative advantage lies in the export log trade. Accordingly this analysis does not support a stumpage differential between export logs, logs for sawmilling, and material for pulp and paper manufacture.
This is contrary to the findings of Donnelly (1974) and the difference can be attributed to Donnelly's failure to include export incentives in his analysis and to his failure to calculate the costs of protection at the equilibrium exchange rate.
However the existence of difference in the impact of industrial protection on the cost of production of forest products does not in itself justify a policy of tariff compensation (see Harris (1975) and Lloyd (1975) for a discussion of the appropriateness of tariff compensation to Australian agriculture). Consequently this paper does not imply that a structure of differential stumpages in favour of export logs should be implemented. Rather it has demonstrated that differential stumpages in favour of material for pulping cannot presently be justified on the grounds of tariff compensation.
REFERENCES ANDERSON, K. L. 1975: A history of the pulp and paper industry in New Zealand. N.Z. For.
Serv., For. Res. Inst., Econ. Silv. Rep 82 (unpubl.). BALASSA, B. 1971: "The Structure of Protection in Developing Countries." John Hopkins
Press, Baltimore USA, p. 375. BALASSA, B. and SCHYDLOWSKY, D. M. 1968: Effective tariffs, domestic cost of foreign
exchange, and the equilibrium exchange rate. J. Political Economy 76: 348-60. BATTERSBY, J. R. and SMALLBONE, L. J. T. 1974: The Discount Rate for Project
Evaluation in Government. Mimeograph. CANADIAN MINISTRY OF INDUSTRY, TRADE AND COMMERCE 1974: Annual Census
of Manufactures: pulp and paper mills 1972. CORDEN, W. M. 1966: The structure of a tariff system and the effective protective rate.
J. Political Economy 74(3): 221-37. DEPARTMENT OF STATISTICS 1966: ' 'Inter-industry Study of the New Zealand Economy
1959-60," Part 1. Government Printer, Wellington. 1975: "Inter-industry Study of the New Zealand Economy 1965-66," Part 2, Government Printer, Wellington.
DONNELLY, P. T. 1974: Log exports or additional domestic processing. Paper presented to Forestry Development Conference 19-21 November, Forestry Development Council.
ELKAN, P. G. 1972: Industrial protection in New Zealand 1952 to 1967. N.Z. Inst. Econ. Research, Tech. Memorandum No. 15.
EVANS, H. D. 1972: "A General Equilibrium Analysis of Protection," p. 216. North-Holland, London.
FENTON, R. 1972: Import costs and overseas earnings of sawlog and export log afforestation. N.Z. J. For. Sci. 2(3): 369-77.
GRANT, R. K. 1976: Impact of uncertain end-use on wood costs and its implications for forest planning. N.Z. J. For. 21(1): 58-67.
HARRIS, S. 1975: Tariff Compensation: sufficient justification for assistance to Australian agriculture. Aust. J. agr. Econ. 19(3): 131-45.
IBRD 1968: "The World Bank Report on the New Zealand Economy," p. 157. Government Printer, Wellington.
INLAND REVENUE DEPARTMENT 1975: Land and Income Tax Amendment Act (No. 3) (mimeograph).
LLOYD, P. J. 1975: Tariff compensation: an undesirable policy. Aust. J. Agr. Econ. 19(3): 146-53.
NEW ZEALAND ELECTRICITY DEPARTMENT 1971: "Annual Statistics in Relation to Electric Power Development and Operation." Government Printer, Wellington.
No. 2 Grant — Effective Protection and Comparative Advantage 249
NEW ZEALAND FOREST SERVICE 1975: "Statistics of the Forests and Forest Industries of New Zealand to 1974. Government Printer, Wellington.
OECD 1975: "Economic Surveys: New Zealand," p. 95. Organisation for Economic Cooperation and Development, France.
O'NEILL, G. M. 1974: Forestry production and planning targets. Paper presented to the Forestry Development Conference 19-21 November. Forestry Development Council, Wellington.
ROSE, W. D. 1974: The Determination of a Discount Rate. Mimeograph. SCOBE, G. M. and JOHNSON, P. R. 1974: Protection and Exchange Rate. An analysis of
the New Zealand foreign exchange market. Econ. Record 50(132): 534-53. US DEPARTMENT OF COMMERCE 1975: 1972 Census of Manufacturers: Pulp, Paper, and
Board Mills.