effect of wall geometry on the behaviour of reinforced soil walls
TRANSCRIPT

ELSEVIER
Geotextiles and Geomembranes 14 (1996) 521 541 © 1997 Elsevier Science Limited
All rights reserved. Printed in Ireland 0266-1144/96 $15.00
P I I : S 0 2 6 6 - 1 1 4 4 ( 9 6 ) 0 0 0 2 0 - 9
Effect of Wall Geometry on the Behaviour of Reinforced Soil Walls
S. K. Ho a & R. Kerry R o w e b
"Department of Construction, Hong Kong Technical College (Tsing Yi), 20 Tsing Yi Road, Tsing Yi, New Territories, Hong Kong
bGeotechnical Research Centre, Department of Civil Engineering, University of Western Ontario, London, Canada N6A 5B9
ABSTRACT
The effect of geometric parameters such as reinforcement length, number of layers of reinforcement, distribution of reinforcement and wall height on the forces developed in the reinforcement is examined. It is shown that the forces developed are largely independent of reinforcement length for reinforcement to wall height ratios equal to or greater than 0.7. For truncated reinforce- ment schemes with a ratio of less than 0.7, the forces in the reinforcement increase as the length of the reinforcement decreases. The number of layers of reinforcement was not found to significantly affect the total force required for equilibrium provided the reinforcement stiffness density was the same. The analysis provides theoretical support for the common practice of using truncated reinforcement with equal vertical spacing and length equal to 70% (or greater) of the wall height, i~ 1997 Elsevier Science Ltd. All rights reserved.
I N T R O D U C T I O N
Observations from monitored laboratory model walls (Andrawes et al., 1990a) and field phototypes (Fannin & Hermann, 1991) suggest that wall geometry (i.e. length of reinforcement, distribution of reinforcement, height of wall, etc.) affects the behaviour of reinforced soil systems. However, the published data are largely restricted to individual cases and because of the
521

522 S. K. Ho, R. K. Rowe
differences apart from geometry it is difficult to clearly isolate the geometric effects. In particular, there has been relatively little discussion of the mechanism associated with changes in the stresses in the reinforced soil and forces in the reinforcement. Similarly, there is a paucity of numerical results reported in the literature relating to the geometric aspects of the problem.
Thus, the objective of this paper is to numerically examine the effects of reinforcement length, number of layers of reinforcement, distribution of reinforcement and wall height on the behaviour of reinforced soil walls with particular emphasis on the stresses developed in the reinforced soil mass and the forces in the reinforcement.
Attention will be focused on the behaviour of a full facing panel wall that was assumed to have a fixed (hinged) toe and to be constructed on a rigid non-yielding foundation. The backfill soil was assumed to be cohesionless (i.e. c = 0 kN/m 2) and free draining, and only gravity loading was consid- ered. The reinforcement was assumed to be planar and the shear resistance along all soil/reinforcement interfaces was assumed to be purely frictional. The reinforcement/soil interface friction angles against pull-out of the rein- forcement from the soil, and against direct sliding of the reinforcement on the soil were assumed to be equal.
NUMERICAL MODELLING
The analysis of the reinforced soil walls was performed using a finite element program AFENA (Carter & Balaam, 1985) which was modified to allow modelling of the reinforced soil wall considered in this study. Figure 1 shows the wall geometry and finite element mesh adopted. The finite element mesh typically consisted of basically 4237 nodes and 2483 elements. This relatively fine mesh was adopted following numerous analyses with coarser meshes and was selected because it provided multiple layers of elements between rein- forcement layers. The mesh was also designed so that essentially the same mesh could be used for different cases, thereby minimizing mesh dependency when there was a change in the geometry of the problem like an increase in the number of layers of reinforcement or an increase in the reinforcement length, etc.
The backfill and retained fill were modelled using eight-noded isopara- metric elements following an investigation which evaluated the relative performance of different finite element types for use in modelling reinforced soil walls (Ho, 1993). The fill was assumed to be an elastic-perfectly plastic cohesionless material with a Moh~Coulomb failure criterion with a friction angle q~ = 35 °, a non-associated flow rule with a dilatancy angle ~ - 6 + and a unit weight 7 = 20kN/m. To capture the nonlinear stress-dependent

Behaviour of reinforced soil walls 523
L = 4.25 m
,~--Wall A 4 5 + ~b/2
face 7 ~
/ Rankine .~-- failure plane
/ .m--- Reinforcement Zone 1 / (typ) /
¢/
~ - Ground surface
/ /
/ Zone 2a /
/
/ /
~ Zero force line /
/
Zone 3
- L" 8 (Retained fill) v = l m
L
End of reinforcement
~ Stiff foundation
15.0 m
I L~$1 ml i l l l l i l l i l l l l l l l m t ~ l l l l l l l i l l i l l l l l l l l l l l l l l l l l l l l r A i l l l i l l i l l l l i l R l u U n n l i l l l l l l l n l l g U l U l l l l l l l l l n i u l l l l l I l l l l l n l l l l l l l l l l l l l l l l l l l i l i I I I I l l l l U l l n l l l l l ' l l l l l l l l l l l l l B l l I l l n i l l l l l I l I l l l l l l l l l l l l l l l l l l l l I l J l l l l l l l l l l l l l l l l l i l l l l l l l l n l l n l l l i l l m l n l i i l l l l l n l l l i l l i l l l l U n l R I l l l l l l l l l l i n l l l l l l l l l l l l l U l l i i l i I l l m l l l l l l l l l l l l l l l l l l l l l l l l l l l l B I l l n l l l l l l l l l l l l l n l l l l l l l l l l l i l l l I i l l l l U l l l l l l l i l l i l l l l l l l l l l l l l l l
I l l l l l l l l l l l l l l l l U l l l l l l l l l l l l n l l l I l l l l I l l l l l l l l l l l i l l l l l l l l l l l l l l n l l l l l l i l l l l l l l l l i l n l l i m l l n l l l l l l l l I l l l l l U l U l l l n l i l l l l l l i l l i l l l l l l l l I l l l l l l l i l l l l l l l l l l l l l l l l l l l l l n l l i l l l l l l l l l l l l l l U l l l l l l l l l l l l l l l U l l l l l l l l l l l l l l l l l l l l U l l i l l n l l l l l l m l n i l l l l l l l l U l l l l U l U l l n l l l l l l l l l l l m l l i l l I l l l l l l l n l l l l l l U l l i l l U l l l l l i m l l I l l l l i l l l U l l U l l l l l l l l l l l i l l l l l l U l l ! l l l l l l l l i l i m l l l l l l l l l i l l l l l l l l U l l [ l l i l l l i l l l l l l l l l l n l l l l l l l l l l l l l l l
Stiff foundation
Fig. 1. (a) Wall geometry, (b) finite element mesh.
increase in fill stiffness, Janbu's equation (1963) was used to update Young's modulus of the fill, E, during the analysis [i.e. E / P a = K(o.3/Pa)m], where K = 460 and m = 0.5 are empirical parameters, Pa is the atmospheric pres- sure and o3 is the effective minor principal stress. Poisson's ratio was taken to be v = 0-3.
The reinforcement was modelled using linear elastic bar elements with negligible compressive strength. A reinforcement stiffness J = 2000 kN/m
524 S. K. Ho, R. K. Rowe
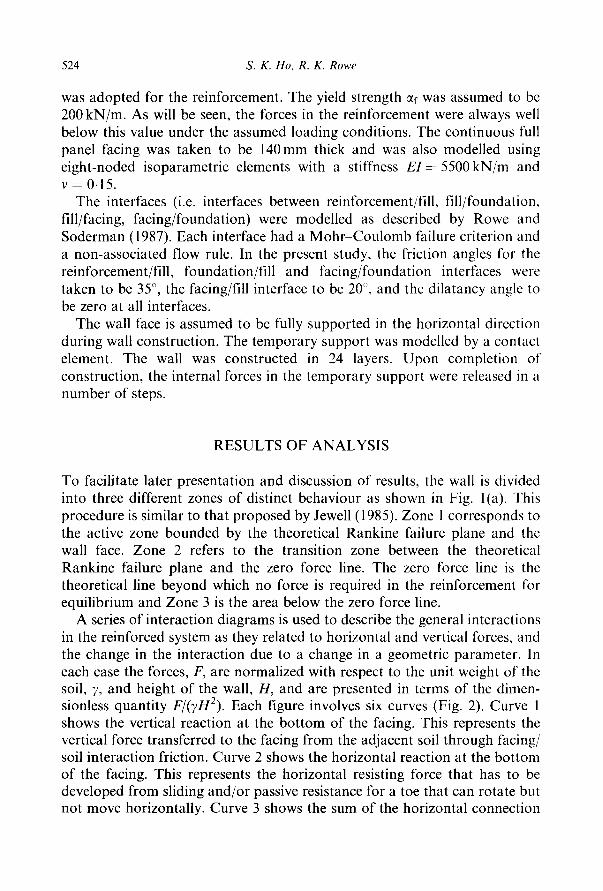
was adopted for the reinforcement. The yield strength ~f was assumed to be 200 kN/m. As will be seen, the forces in the reinforcement were always well below this value under the assumed loading conditions. The continuous full panel facing was taken to be 140mm thick and was also modelled using eight-noded isoparametric elements with a stiffness El--5500kN/m and v = 0.15.
The interfaces (i.e. interfaces between reinforcement/fill, fill/foundation, fill/facing, facing/foundation) were modelled as described by Rowe and Soderman (1987). Each interface had a Mohr-Coulomb failure criterion and a non-associated flow rule. In the present study, the friction angles for the reinforcement/fill, foundation/fill and facing/foundation interfaces were taken to be 35 °, the facing/fill interface to be 20 ~ , and the dilatancy angle to be zero at all interfaces.
The wall face is assumed to be fully supported in the horizontal direction during wall construction. The temporary support was modelled by a contact element. The wall was constructed in 24 layers. Upon completion of construction, the internal forces in the temporary support were released in a number of steps.
RESULTS OF ANALYSIS
To facilitate later presentation and discussion of results, the wall is divided into three different zones of distinct behaviour as shown in Fig. l(a). This procedure is similar to that proposed by Jewell (1985). Zone 1 corresponds to the active zone bounded by the theoretical Rankine failure plane and the wall face. Zone 2 refers to the transition zone between the theoretical Rankine failure plane and the zero force line. The zero force line is the theoretical line beyond which no force is required in the reinforcement for equilibrium and Zone 3 is the area below the zero force line.
A series of interaction diagrams is used to describe the general interactions in the reinforced system as they related to horizontal and vertical forces, and the change in the interaction due to a change in a geometric parameter. In each case the forces, F, are normalized with respect to the unit weight of the soil, 7, and height of the wall, H, and are presented in terms of the dimen- sionless quantity F/(~,H2). Each figure involves six curves (Fig. 2). Curve 1 shows the vertical reaction at the bottom of the facing. This represents the vertical force transferred to the facing from the adjacent soil through facing/ soil interaction friction. Curve 2 shows the horizontal reaction at the bottom of the facing. This represents the horizontal resisting force that has to be developed from sliding and/or passive resistance for a toe that can rotate but not move horizontally. Curve 3 shows the sum of the horizontal connection

g-.
Fig . 2.
0.00
0.24 -
0.20 -
0.16 - -
0.12 - -
0.08
0.04
0.00 0.00
Behaviour of reinforced soil walls
0.25 0.50 0.75 1.00 1.25
I I I I I Vertical force . . . . Coulomb wedge
\ - L/H decreases with depth , • \
Note: ~b = 35* ~brs = 35* 8 = 20 ° ~/= 20 kN/m 3
H = 6 m J = 2 0 0 0 k N / m S v = 1 m n = 6
1 . 5 0 0.12
- - 0.08
\
' 0.04
0.00
Horizontal force - - - - Rankine
i ~ • . . . . Coulomb wedge
t ~ ~ _ L/H decreases with depth - - - - - "
w - - •
O
I I I I I 0.25 0.50 0.75 1.00 1.25
L / H
• 1: Vertical reaction at toe of wall ra 2: Horizontal reaction at toe of wall o 3: Sum of force at facing/rninforcement joint • 4 : Sum of maximum force in reinforcement V 5: Sum of 2 and 3 (total force required for external equilibrium of facing) • 6: Sum of 2 and 4 (total force required for internal equilibrium of reinforced
soil block)
Interaction diagram for the effect of reinforcement length ratio (L/H).
525
loads between the facing and the layers of reinforcement. Curve 4 shows the sum of the maximum forces in the reinforcement layers. Curve 5 is the sum of curves 2 and 3. This is equivalent to the total horizontal resistance against the lateral soil thrust acting on the facing and represents the total horizontal force required for external equilibrium of the facing. Curve 6 is the sum of curves 2 and 4. This is equivalent to the total horizontal force required for internal equilibrium of the reinforced soil block. The interaction diagrams
526 S. K. Ho, R. K. Rowe
(Fig. 2) also show the magnitude of the anticipated vertical and horizontal forces acting at the facing inferred from Coulomb active wedge analysis and the inferred total force required for internal equilibrium assuming a Rankine active state of stress.
Effect of reinforcement length (L)
The effect of reinforcement length L was examined by considering different lengths of reinforcement while the height H of the wall was kept constant. The range of L/H examined varied from 1.25 to 0.3. In the absence of the toe resistance, the lower limit (L/H = 0.3) is the minimum L/H ratio required to provide external stability of the reinforced soil block against overturning and sliding failure for the backfill soil friction angle of 35 ° assumed in these analyses.
In most cases, the reinforcement length at each level was the same. However, a special case in which the reinforcement length at each level was assumed to extend up to the zero force line (except for the lowest layer where 1 m was used) was also examined.
As shown in Fig. 2, as long as L/H is greater than about 0.7, which is the typical recommended ratio used in current design practice subject to a mini- mum L of 2.4 m being required (AASHTO, 1992), there is only slight variation in all the forces required for equilibrium. In particular, the distributions of the maximum force in the reinforcement [Fig. 3(a)] and the connection load between the facing and the reinforcement [Fig. 3(b)] do not show any signifi- cant variation. For these cases (i.e. L/H >~ 0-7), calculations based on Coulomb active wedge analysis provide a good estimate of the forces trans- ferred to the facing (curves 1 and 5, Fig. 2) while the total horizontal force required for internal equilibrium of the reinforced soil block (curve 6, Fig. 2) is well predicted by Rankine active state of stress. In addition, results from the special case in which the reinforcement at each level was assumed to extend up to the zero force line are similar to those cases where the reinforcement lengths are uniform at each level and where the L/H ratio is greater than or equal to 0.7. This suggests that, from force equilibrium considerations, it is not neces- sary to extend the reinforcement beyond the zero force line at each level.
However, when the ratio L/H is decreased below 0.7, there is a substantial increase in all the forces required for equilibrium as shown in Fig. 2. When L/H is small, the lateral thrust pushes the reinforced soil block from behind and produces a moment about the toe of the wall, inducing higher vertical and horizontal stresses towards the front of the wall than at points further back from the facing. The vertical stress may increase beyond the theoretical overburden value (i.e. av = 7h) despite the presence of the resistance from facing/soil interface friction as will be seen in a later section. Inspection of

Behaviour of reinforced soil walls 527
Fig. 3.
1.0
0.8
0.6
0.4
0.2
0 . 0
Max. force in rein.
I I
(a)
K a
\ -- __ K o
\ \ - - - Coulombwedge
N (b = 20*)
L ~ N X N \
20 40 60
Tma x (kN/m)
Note: & = 35 ° ~rs = 35° H f f i 6 m Sv=lm + decreases with depth
T O (kN/m) 20 40
I I
N N i ~ \
Connection load
8 = 2 0 " ~t = 2 0 k N / m 3
n = 6 J = 2 0 0 0 k N I m
L / H
V 0 . 4
O 0 . 7 0 8
t3 1 . 2 5
A Varies+
N \
\ \
I \
60 1.0
- 0 . 8
- 0 . 6
- 0 . 4
- 0 . 2
0 . 0
The effect of reinforcement length ratio (L/H) on (a) maximum force in reinforce- ment (Tmax), and (b) connection load between facing and reinforcement (To).
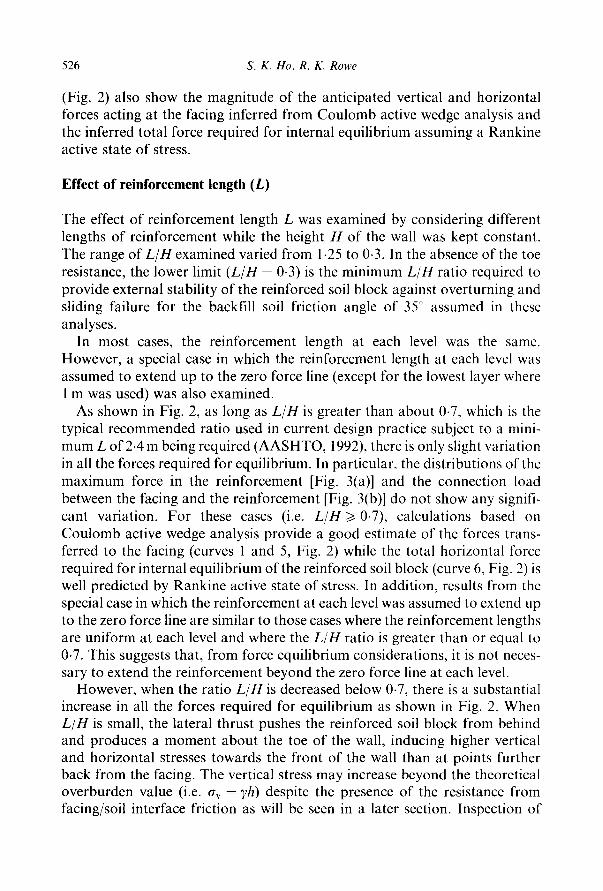
the stress state of the reinforced soil (i.e. the principal stress ratio) indicates that the reinforced soil is in a general state of plastic failure. For the granular cohesionless soil considered in this case, the ratio of horizontal to vertical stress, (K = ah/av) cannot be less than the active Rankine lateral earth pres- sure coefficient, Ka [where K a = ( l - s i n q S ) / ( l + s i n ~ ) ] . Hence, for low values of L/H, the horizontal stress must also increase (Fig. 4) with the vertical stress in order to satisfy the failure criterion. As a consequence, both the maximum force in the reinforcement, and the load connecting the facing and the reinforcement increase when the reinforcement length to wall height ratio, L/H, is relatively small (see for example the case with L/H = 0.4 in Fig. 3). The reason that the Rankine active state of stress and Coulomb active wedge analysis give poor results for the total force required for equi- librium is that the lateral thrust behind the reinforced soil block is not considered in these analytical solutions.
In summary, the effect of the lateral thrust behind the reinforced soil block should not be overlooked when the reinforcement length to wall height ratio is relatively small, since this situation will result in much higher force in the reinforcement than would be anticipated. The results presented here also provide good justification for the current design approach that recommends a minimum reinforcement length with L/H = 0.7.
5 2 8 S. K. Ho, R. K. Rowe
0 20 6.0 ~ I
4.0 -
g 3.0 --
a=
2.0
1 . 0 -
0 . 0
40 60 80 100 120
I I I I I
I [ 20 40
140 160
I I
L e v e l 6
L/H
V 0.4 o 0.708
[] 1.25
3 ' H
60 80 100 120 140 160
(~H ( k P a )
N o t e : +rs = ~P --" 35° ~' = 20 kN/m 3 H = 6 m
S v -- I m 8 = 20 ° J = 2000 kN/m n = 6
F i g . 4.
180 1.0
- - 0 . 8
- - 0.6
e-
- - 0 . 4
- - 0.2
0.0 180
Effect of reinforcement length ratio (L/H) on the horizontal stress distribution ah at wall face.
Effect of the number of reinforcement layers (n)
In the design of reinforced soil walls, there are alternatives in choosing the number of reinforcement layers to be used based on consideration of the reinforcement strength (or stiffness) requirements and construction require- ments (e.g. soil lift thickness, interface frictional property between reinfor- cement soil). There may be different configurations of the reinforcement that provide the same total capacity in terms of force and stiffness density. However, this raises the question as to whether these different configurations will result in any difference in behaviour.
To investigate this effect, analyses were performed assuming different numbers of layers of reinforcement (i.e. n = 4, 6 and 12) but with the same wall height H of 6 m and stiffness density ~ = J/Sv = 2000 kN/m 2.
As is evident from Fig. 5, for the same wall height H and constant reinforcement stiffness density ~2, the use of a different number of rein- forcement layers n results in negligible variation in the total force (curve 6) and sum of maximum force in reinforcement (curve 4) required for internal equilibrium of the reinforced soil block. Similarly, the horizontal force transferred to the toe is only slightly affected. However, the use of a larger number of reinforcement layers (i.e. n = 12 in this case) results in a substantial decrease in the total connection loads (curve 3), the total horizontal force required for external equilibrium of the facing (curve 5),

Behaviour of reinforced soil walls 529
F ig . 5.
0.20
0.16
0 . 1 2
0.08
0 . 0 4
0.00
Vertical force
Note: dp = 35 ° dots = 35 °
H = 6 m L/H = 0.708
. . . . Coulomb wedge - 0.08
. . . . . . . . . . . . . . . = 0 . 0 4
= 20 ° ~ = 20 kN/m 3
J/S v = 2000 kN/m 2
0.00
w R a n k i n e
. . . . Coulomb wedge
Horizontal force
v ' ~ - - - - ~ v •
. . . . . . .
v
El
I I I I I I I No. of 4 6 12 l a y e r s (n)
• I : V e r t i c a l r e a c t i o n at toe of wall [:1 2: Horizontal reaction at toe of wall o 3: Sum of force at facing/reinforcement joint • 4: Sum of maximum force in reinforcement V 5: Sum of 2 a n d 3 (total force required for external equilibrium of facing) • 6: Sum of 2 and 4 (total force required for internal equilibrium of reinforced
soil block)
Interaction diagram for the effect of number of layers of reinforcement (n).
as well as some reductions in the vertical force transferred to the facing (curve 1).
A larger number of layers of reinforcement (i.e. closer spacing of reinfor- cement) results in more stress transfer to the reinforcement from the soil, but this increase in stress transfer appears to be confined to the vicinity of the facing. Thus, despite local variation in horizontal stress distribution due to the use of different numbers of reinforcement layers, the average horizontal stress acting on the wall face and the sum of the connection forces decreases

530 S. K. Ho, R. K. Rowe
as the number of reinforcement layers is increased. Similar results have been observed in laboratory model walls as reported by Andrawes et al. (1990b).
These results confirm that for the same wall height and stiffness density, the use of a different number of layers of reinforcement resulted in the same maximum equivalent stress in reinforcement (i.e. Tmax/Sv) although the horizontal stress acting on the facing and the connection loads can be reduced by using more layers of reinforcement.
Effect of reinforcement distribution
To examine the effects of using different reinforcement distribution schemes on the stresses in the reinforced soil and the force in the reinforcement, three alternative schemes in addition to a uniform distribution (i.e. uniform rein- forcement length and spacing) were considered as shown in Fig. 6. In all situations, the number of layers of reinforcement, reinforcement stiffness and total quantity of reinforcement were assumed to be the same.
Scheme A is the standard configuration where a uniform reinforcement distribution was used with L/H= 0.7 and with equal vertical spacing between reinforcement (i.e. Sv = 1 m in this case). In Scheme B, the vertical spacing between reinforcement is the same as in Scheme A but longer rein- forcement was used at the top of the wall (i.e. L/H-- 1.0) and shorter rein- forcement was used at the bottom (i.e. L/H = 0.4). Scheme C is the opposite of Scheme B. In Scheme D, a uniform length was used, but the vertical spacing was assumed to decrease inversely with depth along the lines suggested by Jewell and Woods (1984).
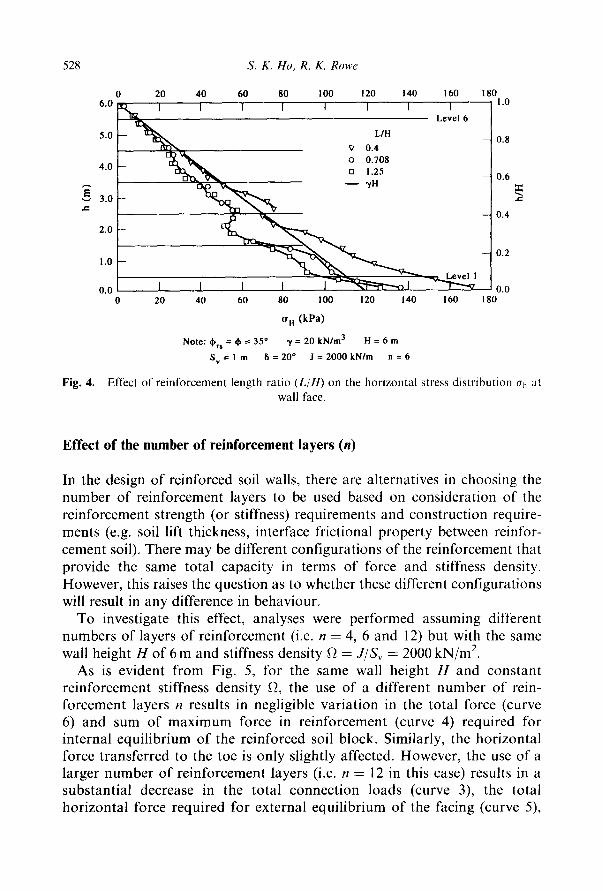
As is evident from Figs 6 and :~, adopting different reinforcement distri- bution schemes results in quite substantial variations in the force in the reinforcement and the stresses in the reinforced soil, especially when comparing the results from Schemes A and B with those from Schemes C and D.
The results from Scheme A and Scheme B are quite similar. In Scheme B, the reinforcement length at each level is close to the zero force line and is similar to the special case examined earlier where the reinforcement was assumed to extend up to the zero force line. It has been shown that this special case yields results typically similar to those cases where the reinfor- cement distribution is uniform and the reinforcement length to wall height ratio L/H is equal to or greater than 0.7 as in Scheme A.
Compared to Scheme A or B, the bottom of the reinforced soil block in Scheme C or D is more heavily reinforced, either because the reinforce- ment is longer (Scheme C) or the reinforcement stiffness density is higher (Scheme D). In contrast, the top of the reinforced soil block in both Schemes C and D is under-reinforced because of shorter reinforcement

Behaviour of reinJorced soil walls 531
m
0.20
0 .16
0.12
0 .08
0 .04
0 .00
Ver t i ca l fo rce . . . . C o u l o m b w e d g e
N o t e : qb = 35 ° ¢brs = 35 ° 6 = 20 ° "y = 20 k N / m 3
H = 6 m I = 2000 k N I m S v = I m n = 6
Hor i zon ta l fo rce - - - R a n k i n e
. . . . C o u l o m b w e d g e
v . . . .
• • V V
. . . . . . V-- . . . . . . . . . . . . . •- .• . . . . . .
V 0
• • 0
O o
L ~____ l ine
(A) o (B) ~ Q (C) (D)
I 1 I I I S c h e m e A B C D
- - 0 .08
- - 0 . 04
0 .00
Fig . 6.
• I : Ver t i ca l r eac t ion at t o e of wal l Q 2: Hor i zon ta l r eac t ion at toe of wal l O 3: S u m o f fo r ce at f a c i n g / r e i n f o r c e m e n t j o i n t • 4: S u m o f m a x i m u m fo rce in r e i n f o r c e m e n t V 5: S u m o f 2 and 3 ( total fo rce r equ i r ed fo r ex te rna l e q u i l i b r i u m o f f a c i n g )
• 6: S u m o f 2 and 4 ( total fo rce r e q u i r e d fo r in te rna l e q u i l i b r i u m o f r e i n f o r ced soi l b lock )
Interaction diagram for the effect of reinforcement distribution.
length (Scheme C) and lower reinforcement stiffness density (Scheme D). Scheme D is based on the premise that since the Rankine active earth pressure increases linearly with depth the reinforcement density should mirror this increase.
When the bottom of the soil block is heavily reinforced, the effect of the foundation becomes less significant and its share of the total horizontal load required for equilibrium is smaller (i.e. smaller horizontal load is transferred to the bottom of the facing) as is evident from Fig. 6, curve 2.
532
1.0
0.8
0.6
0.4
0.2
0 .0
Fig. 7.
S. K. Ho, R. K. Rowe
10 20 30 40 50 60 1.0
x ~ r ~ ~ S c h e m e - 0.8
- - - 7 B
~ ' ~ - - u l o m b O C - 0.6 - - * ~ " ~ 3 ~ - wedge A D
~ . . ( ~ - 2 0 )
_ \ . - 0 ,
- - ~ ' ~ - - 0.2
x
0 10 20 30 40 50 60
cr h ( k N / m 2)
Note: ~b = 35 ° dOr s = 35 ° 5 = 20 ° ~ -- 20 k N / m 3 H = 6 m
S v = 1 m n = 6 J = 2 0 0 0 k N / m
Effect of reinforcement distribution on horizontal stress distribution at wall face.
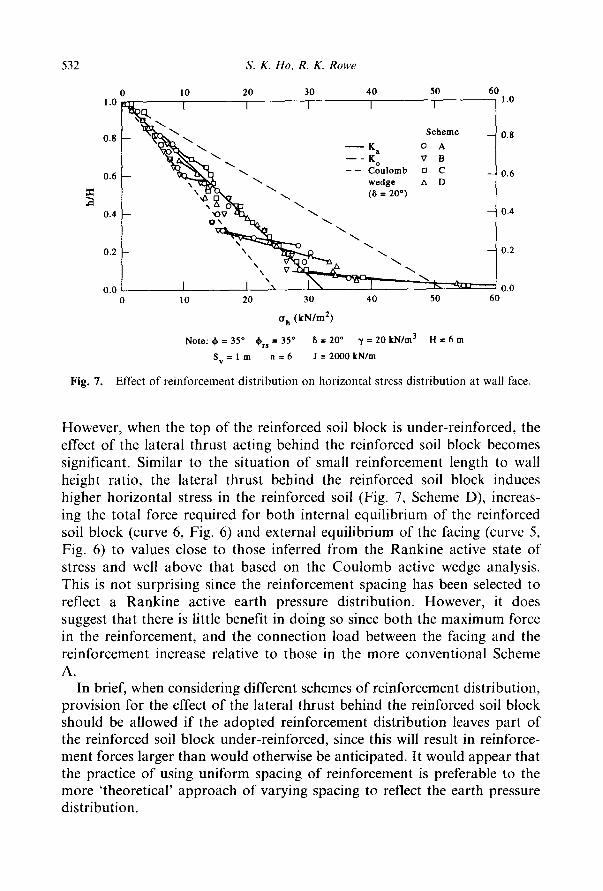
However, when the top of the reinforced soil block is under-reinforced, the effect of the lateral thrust acting behind the reinforced soil block becomes significant. Similar to the situation of small reinforcement length to wall height ratio, the lateral thrust behind the reinforced soil block induces higher horizontal stress in the reinforced soil (Fig. 7, Scheme D), increas- ing the total force required for both internal equilibrium of the reinforced soil block (curve 6, Fig. 6) and external equilibrium of the facing (curve 5, Fig. 6) to values close to those inferred from the Rankine active state of stress and well above that based on the Coulomb active wedge analysis. This is not surprising since the reinforcement spacing has been selected to reflect a Rankine active earth pressure distribution. However, it does suggest that there is little benefit in doing so since both the maximum force in the reinforcement, and the connection load between the facing and the reinforcement increase relative to those in the more conventional Scheme A.
In brief, when considering different schemes of reinforcement distribution, provision for the effect of the lateral thrust behind the reinforced soil block should be allowed if the adopted reinforcement distribution leaves part of the reinforced soil block under-reinforced, since this will result in reinforce- ment forces larger than would otherwise be anticipated. It would appear that the practice of using uniform spacing of reinforcement is preferable to the more 'theoretical' approach of varying spacing to reflect the earth pressure distribution.

Behaviour of reinforced soil walls 533
Effect of wall height H
The effect of wall height H was examined by considering three alternative wall heights (i.e. 3 m, 6 m and 9 m) but keeping the reinforcement length to wall height ratio constant (i.e. L / H = 0.7). In addition, cases with different reinforcement stiffness density for each set of variable wall heights were examined.
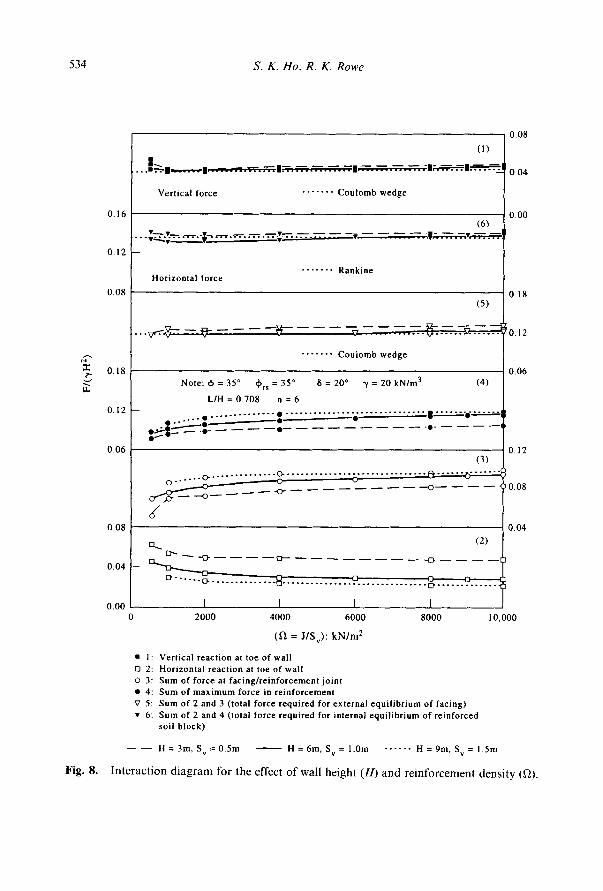
Figure 8 summarizes the general interactions relating to the vertical force and horizontal force required for equilibrium of the reinforced soil system for all the cases studied relating to wall height. Despite the changes in wall height and in reinforcement stiffness density, the vertical force transferred to the facing (curve 1, Fig. 8), the total horizontal force required for external equilibrium of the facing (curve 5, Fig. 8) and the total force required for internal equilibrium of the reinforced soil block (curve 6, Fig. 8) remain practically constant, and as previously indicated for the 6 m wall, agree well with those inferred from the Coulomb active wedge analysis and Rankine active state of stress, respectively. These results suggest that global equili- brium of the reinforced system is largely independent of the height of the structure for the cases analyzed. However, the wall height affects the manner in which the horizontal force required for equilibrium is distributed to the foundation (i.e. the toe resistance) and the reinforcement layer or the connection between the facing and the reinforcement as is evident from Fig. 8 (curves 2 and 3) and Fig. 9.
The results shown in Fig. 8 indicate that reinforcement stiffness density has a significant effect on the horizontal force transferred to the bottom of the facing. The results also indicate that for a given stiffness density, the effect of the foundation stiffness decreases as the height of the wall is increased.
When the height of the wall is low (H = 3 m), a larger portion of the total horizontal force is shared by the toe resistance and hence a much smaller normalized load F is transferred to the reinforcement [Fig. 9(a)] than for the higher walls ( H = 6m and 9m). More importantly, the distribution of maximum force in the reinforcement and at the connection between the facing and the reinforcement shows significant variation with wall height. For example, in the case of a low wall (i.e. H = 3 m) the maximum force in the reinforcement appears to decrease with depth, which is quite different from the case of a higher wall (e.g. H = 6 m). This decrease in maximum reinforcement force with depth is quite similar to that observed in a 3-m-high laboratory prototype wall monitored by Bathurst et al. (1989). The numer- ical results demonstrated that the need to satisfy static equilibrium is the primary reason for this variation in distribution of maximum reinforcement force with wall height.
5 3 4 S. K. Ho, R. K. Rowe
F i g . 8 .
0 .16
0 .12
0 .08
e , i
rv 0 .18
0 .12
0 .06
0.08
0.04
0 .00
0.08
(1)
. . | ~ I - - I ~ I : . . . . . . . . . . . . . I . . . . . . . . . . . . : : I=.77".. 2 1 ~ I
I
Ver t ica l fo rce . . . . . . . C o u l o m b w e d g e
(6) . . . , ' . . ~ , . ~ . ~ . ; ~ . . . . . . . . =-. ~ - - . . . , . . . . . . . ,:..-:-:..--.,-...-::..--:!
. . . . . . . R a n k i n e Hor i zon t a l fo rce
(5)
- - - v ~ ' 3 " - - - : ~ - - .~ - - - ~ . . . . . . . . ~ - - - : - - - - ~
. . . . . . . C o u l o m b w e d g e
Note : ,;5 = 35 ° +rs = 35° 6 = 20 ° ~/= 20 k N / m 3 (4)
L /H = 0 .708 n = 6
. . . • . . . . . . . . . . . . . - e . . . . . . . . . . . " -~_" ~.- . . . . . . . . . . . . ",.| . . . . . . "~ . . . . . .
.=i==: : - ' - - : "-
(3)
. . c . . . . . . . . . . . . . . . o. . . . . . . . . . . . . . . . . . . . . . . . . . . . . ~ . . . . . ~- . . . . .
J
1 [ I 0 2000 4000 6000
( ~ = J / S v ) : k N l m 2
• 1: Ver t i ca l r eac t ion at toe o f wal l t3 2: Hor i zon ta l r eac t ion at toe o f wal l o 3: S u m of fo rce at f a c i n g / r e i n f o r c e m e n t j o i n t • 4: S u m o f m a x i m u m force in r e i n f o r c e m e n t ~' 5: S u m o f 2 and 3 ( total fo rce r equ i r ed for ex te rna l e q u i l i b r i u m o f f a c i n g ) • 6: S u m of 2 and 4 (total fo rce r equ i red for in ternal e q u i l i b r i u m of r e i n f o r c e d
soi l b lock)
I 0 .04
0 0 0
0 1 8
;0 .12
0,06
0 ,12
~0.08
0.04
~ . . (2)
. . . . . . ~ . . . . . . . . . . . . - - ~ . . . . . . . . . . . . . . . ? . . . . . . . . . . . . . . . g . . . . . . 9 . : . . . .
I 8000 l 0 ,000
- - - - H = 3 m , S v = 0 . 5 m H = 6 m , S v = 1.0m . . . . . . H = 9 m , S v = 1.5m
I n t e r a c t i o n d i a g r a m f o r t h e e f f e c t o f w a l l h e i g h t ( H ) a n d r e i n f o r c e m e n t d e n s i t y (~2).

Behaviour of reinforced soil walls 535
F i g . 9.
M a x . s t r e s s i n r e i n .
l.O ~ I I
(a)
0.6
0.4
0.2
0.0
K a
~ \ - - - - C o u l o m b
~ \ wedS2o°)
20 40
Tmax/S v (kNIm 2)
Note: tb = 35 ° ~tJ = 35°
= JIS v -- 2000 kNIm 2
/ 60
To/S v (kNIm 2)
20 40
I I
(b) H S v
\ v 3m 0.Sm
' ~ \ O6m 11150: \ \ ra9m
ff I'", \ \\ I \
C o n n e c t i o n load (stress)
8 = 20 ° ~ = 20 kN/m 3 L/H = 0.708
n = 6
60 1.0
- 0 . 8
- 0 . 6
- 0 . 4
- 0.2
0.0
Effect of wall height (H) on (a) maximum force in reinforcement (Trnax); (b) connec- tion load between facing and reinforcement (To).
In summary, for walls where the toe condition may be considered to be hinged, the effect of wall height will be more significant for low walls. In particular, the distribution of maximum force in the reinforcement for low walls will generally be different from that for high walls.
H O R I Z O N T A L STRESS DISTRIBUTION AT BACK OF R E I N F O R C E D SOIL BLOCK
Typical horizontal stress distributions at the back of the reinforced soil block for each group of geometric parameters examined are presented in Figs 10- 13.
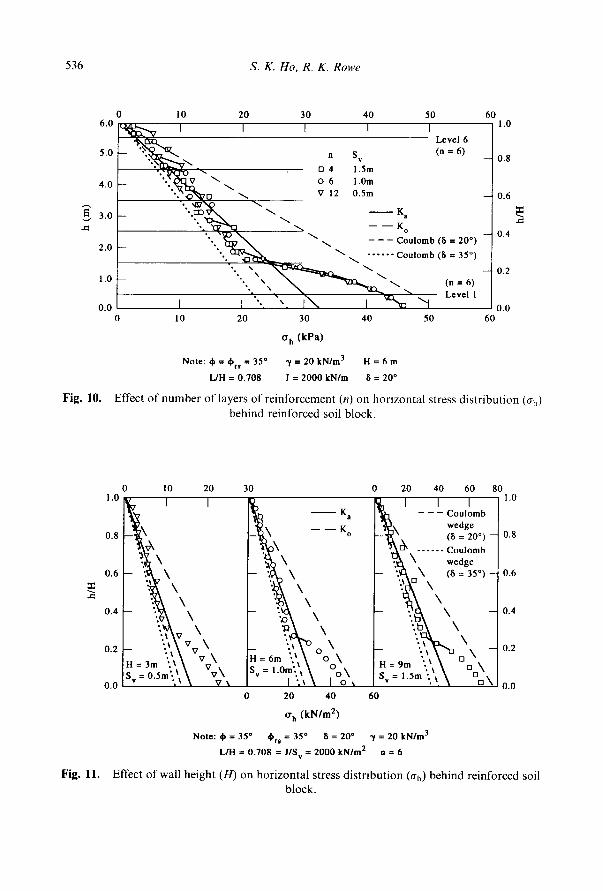
The magnitude of horizontal stress at the back of the reinforced soil block depends on the position of the end of the reinforced soil block relative to the zero force line. For those cases where the reinforcement length to wall height ratio is 0.7, but where there is variation in the number of layers of reinfor- cement, the reinforcement spacing or the wall height, there is little variation in the horizontal stress distribution (e.g. Figs 10 and 11). The stress distri- bution for these cases is typically similar to that calculated from a Coulomb active wedge analysis for the upper 70% of the wall. Below this, the hori- zontal stresses increase rapidly and approach the at-rest state. It should be
536 S. K. Ho, R. K. Rowe
0 6 . 0 .
5.0
4.0
g 3.0
2.0
1.0
0.0
10 20 30 40 50
- " . ' . . ~ . "..xsh~-"-.v\
I I I I Level 6
Sv (n = 6) n 13 4 1.5m
"" ~ ~ o 6 l.Om • . t3 ~- v 12 0.Sm _
- - - - r%
- - - C o u l o m b ( 6 = 2 0 ° ) --
~" . . . . . . Coulomb (8 = 35 °)
i ' . (n = 6)
] ,,,,.1 Level 1
10 20 30 40 50
O" h ( k P a )
Note: 4~ = 6rs = 35 ° 3' = 20 kN/m 3 H = 6 m
L/H = 0.708 J = 2000 kN/m 8 = 20 °
60 1.0
0.8
0.6
0.4
0.2
0.0 60
Fig. 10. Effect of number of layers of reinforcement (n) on horizontal stress distribution (ah) behind reinforced soil block.
0 10 20 30 0 20 40 60 80
1.o iv,, I I Iv,., I~ I I I I l.O I ~b~.~ I~L~ Ka I ~ -Coulomb I
' "" K I '1~\ wedge / 0 8 o = 20o> t 0 8
...... : ° : ° r / 0"6 ]-- : i ~ \ \ I-- \ ~ \ \ 1 - - " . ~ r n \ \ (8 = 35°) 1 0"6
0 2 v 0 2 • ° O \ \ "
0.0 o t~ \ 0.0 0 20 40 60
O" h (kN/m 2)
N o t e : ~b = 35 ° ~brs = 35 ° 8 = 20 ° ~t = 20 kN/m 3
L/H = 0.708 = J/S v = 2000 kN/m 2 n = 6
Fig. 11. Effect of wall height (H) on horizontal stress distribution (Crh) behind reinforced soil block•

Behaviour of reinforced soil walls 537
0 6.0
5.0
4.0
3.0
2.0
1.0
0.0
10 20 30 40
I I I
.i.x. x x ~ °° \
50
I Level 6
K I
D K ,
-- -- -- Coulomb ({i = 20*)
. . . . . . Coulomb (ll = 35*)
~ o A
• . . x : " , - ~ t ~ ~ A D(S v ~ " varies)
"%'. ~" Level I
• . , \ I - * ~ r ~ \ t-. I I ". ~ I 10 20 30 40 50
~ n ( k P a )
Note: 4~ n = 4~ = 35* ~t = 20 kNIm 3 H = 6 m
S v = l m ~ = 2 0 ° J = 2 0 0 0 k N / m n = 6
60 1.0
- - 0 . 8
- - 0 . 6
- 0 . 4
- 0.2
0.0 6O
Fig . 12. Effect of reinforcement distribution on horizontal stress distribution (O'h) behind reinforced soil block.
4.0
~_~ 3.0
2.0
t .0
0.0
F i g . 13.
0 10 6.0
5.0 - - .~ ,~xr - t r~
20 30 40 50 60 1.0
I I I I Level 6
- - . .
L/H
V 0.4 O 0.708 o 1.25
\ \ K,
". x o ~ " . ~ ~ ~- Coulomb (8 = 2 0 0 ) -
. . . . . .
"'" . ~ . ~ . ~ . . - *'. x ~ Level 1
10 20 30 40 50
- - 0 . 8
0.4
0.2
0.0 60
0 h ( k P a )
N o t e : 4~ = 4~rj = 35 ° "Y = 20 kN/m 3 H = 6 m
J = 2 0 0 0 k N / m S v = l m 8 = 2 0 ° n = 6
Effect of reinforcement length ratio (L/H) on horizontal stress distribution (~rh) b e h i n d r e i n f o r c e d so i l b l o c k .
0.6
538 S. K. Ho, R. K. Rowe
noted that in those cases where the L/H ratio is not uniform with depth (i.e. Schemes B and C in Fig. 12), the end of the reinforced soil block is inde- terminate. For these cases, the stresses shown are those at the same location as in Schemes A and D, and hence care is required in comparing the results since some reinforcement terminates before this point and some extends beyond this point.
Analyses were conducted to examine the effect of varying L/H ratio while keeping uniform reinforcement distribution at each level. As shown in Fig. 13, the horizontal stress acting behind the reinforced soil block increases as the ratio of L/H increases. This is because the end of the reinforced soil block is farther away from the zero force line and into the more stable zone [zone 3 in Fig. l(a)] where the stresses tend towards the at-rest earth pres- sures. Conversely, when the L/H ratio is small, the end of the reinforced soil block is largely in zones 1 and 2 (i.e. above the zero force line) and the horizontal stress is correspondingly smaller, tending towards the Coulomb active wedge stress distribution.
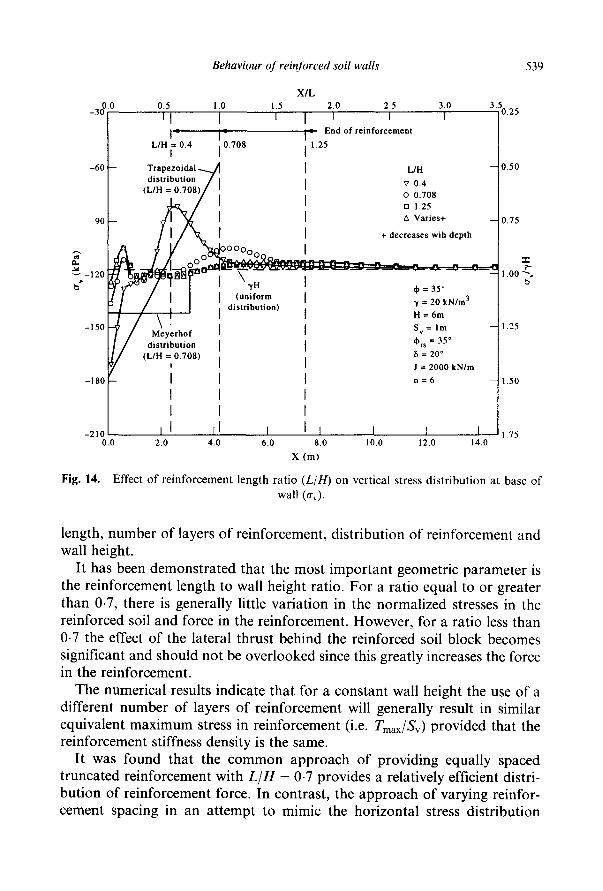
VERTICAL STRESS DISTRIBUTION AT BASE OF WALL
Generally, the vertical stress distribution at the base of the wall is not greatly affected by geometric parameters except in those cases where the reinforce- ment length to wall height ratio is exceedingly small (Fig. 14). When L/H = 0-4, there is a significant increase in the magnitude of vertical stress close to the wall face and a decrease near the back of the reinforced block due to the action of the lateral thrust behind the reinforced soil block. It should be noted that for reasons of clarity in Fig. 14 only the Meyerhof and trapezoidal distributions corresponding to the case where L/H--0-7 are shown. Comparing with numerical results, the Meyerhof distribution provides reasonably close prediction of maximum foundation bearing pres- sure when the ratio L/H is large (i.e. L/H >~ 0.7) as shown in Fig. 14, but gives poor prediction when the ratio L/H is relatively small. This is probably because when L/H is small i.e. L/H <~ 0.4) Meyerhof's assumption that the reinforced soil block acts as a rigid body ceases to be valid due to the large internal deformation in the reinforced soil block.
CONCLUSIONS
Numerical simulations have been performed to provide insight concerning the effects of variation of wall geometry on the behaviour of reinforced soil walls. The geometric parameters considered included the reinforcement
Behaviour of reinforced soil walls 539
X/L - 3 ~0"0v 0.5 i .0 1.5
L/H 1= 0.4 I 0.708
- 6 0 Trapezoidal @ distribution / I
(L/H = 0 . 7 0 8 ) / '
(uniform distribution)
-150 Meyerhof
distribution (L/H --i 0.708)
I
2.0 2.5 3.0 3'5".25v I
End of reinforcement
1.25
L/H
'7 0,4 O 0.708 O 1.25 ,x Varies+
+ decreases wih depth
d~=35 ° = 20 kN/m 3
H = 6 m
S v = l m
~brs = 35 ° ~ = 2 0 °
J = 2000 kN/m
n = 6
- 0.50
- - 0.75
,v,
1.00 b
1.25
1.50
-210 [ [ I I I [ 1.75 0.0 2.0 4.0 6.0 8.0 10.0 12.0 14.0
X ( m )
Fig. 14. Effect of reinforcement length ratio (L/H) on vertical stress distribution at base of wall (a~).
length, number of layers of reinforcement, distribution of reinforcement and wall height.
It has been demonstrated that the most important geometric parameter is the reinforcement length to wall height ratio. For a ratio equal to or greater than 0-7, there is generally little variation in the normalized stresses in the reinforced soil and force in the reinforcement. However, for a ratio less than 0.7 the effect of the lateral thrust behind the reinforced soil block becomes significant and should not be overlooked since this greatly increases the force in the reinforcement.
The numerical results indicate that for a constant wall height the use of a different number of layers of reinforcement will generally result in similar equivalent maximum stress in reinforcement (i.e. Tmax/Sv) provided that the reinforcement stiffness density is the same.
It was found that the common approach of providing equally spaced truncated reinforcement with L/H = 0-7 provides a relatively efficient distri- bution of reinforcement force. In contrast, the approach of varying reinfor- cement spacing in an attempt to mimic the horizontal stress distribution
540 S. K. Ho, R. K. Rowe
proved to be less efficient and is not recommended for the type of wall examined here. Varying reinforcement length to have all reinforcement extend to the zero force line did not provide any significant improvement in force distribution relative to the truncated reinforcement for L/H = 0.7.
For low walls with a fixed (hinged) toe, the effect of wall height is signifi- cant. In general, when the wall height decreases the equivalent maximum stress (i.e. Tmax/Sv) in the reinforcement also decreases. Thus, care is required in empirically extrapolating findings from low ( ~< 3 m) walls to the behaviour of high walls ( t> 6 m).
In general, the vertical stress distribution at the base of the wall face is not sensitive to the geometric parameters examined provided that the reinforce- ment length to wall height ratio is greater than or equal to 0.7. High vertical stresses were calculated close to the wall face for values of L/H ~_ 0.4.
Considering all the aspects relating to stresses and forces, in particular, the absolute maximum force in reinforcement, connection load between facing and reinforcement, horizontal stress at wall face and vertical bearing stress on the foundation, the numerical results suggest that the opt imum wall geometry would be one with a uniform L/H ratio of the order of 0-7 and equal spacing between reinforcement. When choosing the number of rein- forcement layers to be used (assuming the same reinforcement stiffness density), construction cost and practical limitation in fill lift thickness need to be considered.
A C K N O W L E D G E M E N T
The research reported in this paper was supported with funds from the Natural Sciences and Engineering Research Council of Canada under grant A1007.
REFERENCES
AASHTO (1992). Standard Specifications Jor Highway Bridges (15th Edition). American Association of State Highway and Transportation Officials.
Andrawes, K. Z., McGown, A. & Ahmad, F. (1990a). Influence of lateral boundary movements on earth pressure. Performance of Reinforced Soil Structures (Proceedings of the International Conference). Thomas Telford, pp. 359-364.
Andrawes, K. Z., Loke, K. H., Yeo, K. C. & Murray, R. T. (1990b). Application of boundary yielding concept to full scale reinforced and unreinforced soil walls. Performance of Reinforced Soil Structures (Proceedings of the International Conference). Thomas Telford, pp. 79-83.

Behaviour of reinforced soil walls 541
Bathurst, R. J., Benjamin, D. J. & Jarrett, P. M. (1989). An instrumented geogrid reinforced soil wall. Proc. 12th Int. Conf. Soil Mech. Found. Eng., Rio de Janeiro. A. A. Balkema, The Netherlands, pp. 1223-1226.
Carter, J. P. & Balaam, N. P. (1985). AFENA - - A General Finite Element Algorithm - - User's Manual. School of Civil Engineering, University of Sydney, Sydney, Australia.
Fannin, R. J. & Hermann, S. (1991). Creep measurement of polymeric reinforcement. Proc. Geosynthetic '91 Conf., Atlanta, USA, pp. 561-573.
Ho, S. K. (1993). A numerical investigation into the behaviour of reinforced soil walls. PhD Thesis, University of Western Ontario, London, Canada. 408 pp.
Janbu, N. (1963). Soil compressibility as determined by oedometer and triaxial tests. Proc. European Conf. on Soil Mech. and Foundation Eng., Wiesbaden, Germany, Vol. 1, pp. 19-25.
Jewell, R. A. (1985). Limit equilibrium of reinforced soil walls. Proc. l l t h Int. Conf. Soil Mech. Found. Eng., San Francisco, Vol. III, pp. 1705-1708.
Jewell, R. A. & Woods, R. I. (1984). Simplified design charts for steep reinforced slopes. Paper presented to the North West Geotechnical Group, Symposium on Reinforced Soil, UMIST, 18 pages.
Rowe, R. K. & Soderman, K. L. (1987). Very soft soil stabilization using high strength geotextiles: the role of finite element analysis. Geotextiles and Geomembranes, 6, 53-81.