effect of urban soil compaction on infiltration rate · effect of urban soil compaction on...
TRANSCRIPT

Reproduced with permission of the copyright owner. Further reproduction prohibited without permission.
Effect of urban soil compaction on infiltration rateGregory, J H;Dukes, M D;Jones, P H;Miller, G LJournal of Soil and Water Conservation; May/Jun 2006; 61, 3; ProQuest Research Librarypg. 117
. •· ---.~j
RESEARCH-~~ . . . - ... ~ . ').:A
Effect of urban soil compaction on infiltration rate J.H. Gregory, M.D . Du kes, P.H. Jon es, and G.L. Miller
ABSTRACT: Inadve rtent soil compac tion at th e urb an lot sca le is a pro cess that redu ces
infilt ra tion rates, which ca n lead to inc reased stormwater runoff. Th is is particularly importan t in low im pact development strategies wh ere stormwater is intended to infiltrate rath er th an flow throu gh a tradition a l s tormwate r network to a detention bas in . The effect of compaction on infiltration ra tes on sandy soils in North Central Florida was measured with a double ring infiltrometer on urban constru ction sites and across va rious levels of compaction. Average non -compacted infiltration rates ranged from 377 to 634 mm hr·' (14.8 to 25.0 in hr') for natura l fo rest, from 637 to 652 mm hr·' (25. 1 to 25 .7 in hr ·') fo r pl a nte d forest, and 225 mm hr·' (8.9 in
hr·') for pastu re sites. Average infiltration rates on compacted so ils ranged 8-175 mm hr·' (0.3·6.9 in hr-'), 160 to 188 mm hr ' (6.3 to 7-4 in hr·'), and 23 mm hr ' (0.9 in hr·') for the same respective sites. Although there was wide variability in infiltration rates across both compacted and non-compacted sites, construction ac tivity or compaction treatments reduced infi ltration rates 70 to 99 percent.
Maximu m compaction as measured with a cone penetrometer occu rred in the 20 to 30 em (7.9 to 11.8 in) depth range. When studying the effect of different levels of compaction due to light and heavy constru ction equi pment, it was not as important how heavy the equipment was but wh eth er compaction occurred at all. Infi ltration rates on compacted soils were generally much lower than the
design storm infiltration rate of 254 mm hr' (10.0 inches hr') for the 1oo-yr, 24-hr storm used in the region. This implies that construction activity in th is region increases the potential for runoff and the need for large stormwate r conveyance networks not on ly due to the increase in impervious area associated with development but also because the compacted pervious area effectively approaches the infiltra tion behavior of an impervious surface.
Keywords: Co mpaction , cone index, double rin g, infilt rat ion, LID, low impact development, penetrometer, stormwater
Urban areas in Florida are rapidly expanding, with Florida accounting for approximately 11 percent of all new homes constructed in the United States in 2003
(U.S. Census Bureau, 2004). Soil compaction is associated with this urban development. ompac tion ca n be the intenti onal compacting of a site to increase the structural strength of the so il or it ca n be inadvertentl y caused by the use of heavy equipment and gradin g of lots. oil compac tion affects the physica l properti es of so il by increasing its strength and bu lk density, decreasing its porosity, and forcing a smaller distr ibution of pore sizes with in the soil. These changes affect the way in whi ch air and water move through the soil and th e abil ity of
roots to grow in the soil ( R CS, 2000; l"l...i chard eta!. , 2001 ) .
C hanges to the way that air and water move withi n the soil ca n afFect infi ltration ra te. A decrease in in fi ltration rate will result in increased ru noff volume, greater fJ ooding potential and reduced groun dwa ter recharge within watersheds. Compaction has a significant infl uence on so il hydrauli c properti es such as soil water retention, soil water diffusiviry, unsa tu rated hydraul ic cond uctivity and sa turated hydrauli c conductivity (Horton cr a!. , 1994). T hese hydrau lic properties in turn govern infil tration rates.
T he infi ltrati on of stormwater within urban areas is an important process being pro moted as part of a new storm water man-
agement stratq,•y. Thi~ management stra tegy is often referred to as low impact development, which aims to reduce th e volum es and pea ks of runoff to predevelopment levels (Price George's Coun ty, 1999). Pro moting infiltration is one of th e primary meth ods for achieving this goa l. The quantifi ca ti on of th e effect of compac tion on infiltration rates is therefore, an importa nt task.
Quantifying the effect of compaction in urban areas has gefl(:rall y consisted of surveys that have measured infiltration rates and th en related these measured infiltration rates to b nd development, bnd types, or levels of compac ti on. R esearch into th e effects of so il compac ti on on infi ltrati on rate has been cond ucted in Pennsylva nia (Felton and Lu ll , 1963; Hamilton and Waddin gton, 1999), Wisconsin (Kelling and Peterso n. 1975), North Ca rolina (Kays, 1980) and Alabama (Pitt ct a!. , 1999). These studi es have shown that so il infi ltration rates arc nq,ra ti vely affected by th e compaction as~oc i a tcd with urban development. However, th ese studies did not relate specific levels of compacti on to infiltration rate. Although development is occurr ing at a rapid pace in Florida, studies have not been conducted to cha1-acterize in fi ltra tion rates as affected by compaction during development activities. It is often assumed tl1at infi ln-ation rate fa r exceeds precipitation rate due to the coarse soils found in many areas of the state. The hypothesis of this research is that compaction during typical construction p1-actices resul t in a substantial reduction in infiln-a tion 1-a te on sandy s ils.
The objectives of this research were to : I) quantify the effect of compaction due to construction activities on infiltJ-ation 1-a tes of typical urban development sires on sandy soils in
orth entldl Florida, and 2) determine the effect of va rious levels of comp~cti on on in fi ln·a tion 1-ates of sandy urban development sires as compared to uncompacted infi ltration 1-a tes.
Justin H. Gregory is a former graduate research assistant in the Agricultural and Biological Engi ·
neering Department at the University of Florida in
Gainesville, Florida. Michael D. Dulles is the corre
sponding author and assistant professor in the
Agricultural and Biological Engineering Department
at the University of Florida in Gainesville, Florida.
Pierce H. Jones is a professor and director of the
program for resource efficient communities at the
University of florida in Gainesville, Florida. Grady
L. Miller is an associate professor in the Environ·
mental Horticulture Department at the University of
Florida in Gainesville, Florida.
I Mil 2006 VOLU ME 61 NUM BER 3 1 117

Reproduced with permission of the copyright owner. Further reproduction prohibited without permission.
Materials and Methods Compactiorr drr e to co rrstructiorr actirlities.
ire descripriorr. A natural, mixed wood fo rest sire in the M adera subdi visio n of Gain esville, Flo rida was cho en as a resea rch sire . Lo ts 2,
3, 4 , 8, and 12 o f th e Madera developm ent were chosen because th ey were undisturbed lots that had nor been clea red or subj ected to vehi cle traffi c. Lor 24 of th e Madera deve lopment was chose n beca u e it was used as an access to a detenti on po nd and fo r parking heavy consrmcrio n vehicles. As a result, this lo r was made up o f areas rhar had been com
pacted due to constructi o n vehicle traffi c next to areas that were undisturbed due ro the wooded conditio ns. Madera lots 2, 3, 4, 8, 12, and 24 w ill be referred to as natural wooded lots A, B, , D, E, and F. The so il class ifica ti o n fo r this area is a Bo nn eau fin e sand (An:ni c Paleudulr; USDA , 1985) and according to data in the literature is 89.3 percent sa nd , ·1 0 .6 percent si lt, has a fi eld capacity of 1 .9 percent by volum e, and has a sa turated hydraulic c nductivity of I 03 mm hr-1 in the top 23 em ( arlisle er al. , 1989).
The M entone develo pment of Gainesv iLl e, Flo rida was also chosen as a research site. The predevelopmenr vege tatio n was planted slash pin e (Pi1111s ellio/lir), w hich was at least I 0 years o ld . o m pactio n testing was ca rried
o ut o n lo t 8 18 and lot 857 . Lo t 8 18 was ch sen because it was a lo t that had been partially cleared to all w access fo r th e constructio n of o ne o f th e detenti o n po nds. Lo r 857 was chosen becau e it had been used ro park heavy co nstructio n equipm ent and was used by con tru cti on vehicl es as a sho rtcut between adjacent stree ts. 13o rh lots were made up of areas that had been compacted and areas th at were undisturbed similar to M adera lo r 2-1 (lo t F) as described previo usly. M entone lo ts 857 and 8 18 w ill be referred to as planted fo rest lots G and H . The so il o n lots , and H are class ified as an Apop ka fin e sa nd (Gr ssareni c Paleudult; U DA , 1985) and according to data in th e lite rature is 96 .2 per
cent sa nd, 1.8 percent silt, has a fi eld capacity of 11 .7 percent by volum e, and has a sa turated hydraulic condu ctivity o f 197 mm / hr in th e top 20 em ( arlisle et al. , 1989) .
ndistnrbed it!ftltrariorr rates. Fro m I ecember 2002 through February 2003, predevelopment infiltratio n rates were measured o n wooded lots A, B, , and E. Six teen infiltrati o n tests and ixteen bulk density and gravimetri c so il m o isture content measurements were condu cted on each of these lots in areas that
118 JOURNAL OF SOIL AND WATER CONSERVATION MlJ 2006 I
wo uld eventuall y be landscaped after home constru ctio n . Infiltration rates were m easured usin g a con tant head do ubl e ring infil tro meter with inner and o uter ring diam eters o f15 em (5 .9 in) and 30 em (11.8 in) that was
inserted to a depth o f approx imately I 0 em (3 .9 in). The constant head was maintain ed
w ith a M ari e tte siph o n and the vo lume of water required to maintain th is head was m easured at a o ne-minute inte rval. A detailed descriptio n of th e infiltratio n apparatus is described by Gregory et al. (2005). The infiltrati o n tests were conducted for at least 40
min (infi ltration rates were found to become constant typica lly w ithin th e first I 0 minutes of th e rest or less) . C umulative infiltration was plo tted again t time and th e data was fitted to th e Philip 's infi ltratio n equatio n as fo llows,
I = Kt + St 112 (1)
w here, I cumulative infiltratio n depth
(mm), K = saturated hydrauli c co nductivity
( mm h r-1),
r rime (hr), and S so il water sorptivity (mm hr-1
).
Values o f the parameters K and can be
fo und by regressing the cumulati ve infil tration data co Llected in the fi eld to Equatio n I (Lal an I Vandoren , 1990) . T he parameter K fiu m the Philips infi ltration equation was used as an approximatio n for th e steady stare infiltration rate ( how et al. , 1988) . The infiltratio n rates reported in this paper are the K parameter fium the Philips in ftltration equatio n.
oil bulk density and gravim etric mo isture content were m easu red usin g a standard intac t core method in th e top 5 em o f (2 in) soi l after any decayin g o rgan ic matter was
removed. Vo lum etri c mo isture content was th en determin ed as th e produ ct o f th l: bu lk density and the gravim etric mo isture content (A TM , 2002a; Blake and H arrge, 1986; ASTM , 2002b; Gardn er, 1986) . The cone index (A AE, 2000) was also m easured nea r the infi ltratio n measurement lo cations using a Spectrum TM SC900 So il C ompaction
Meter ( pectrum Technologies, Inc., Plainfi eld, ILlin o is), which recorded cone index in in crenH.:nts o f 2 .5 em (1 in) up to 45 em (17 .7 in). A standard cone (A AE , 2000) was used to determin e cone index . Fi ve co ne index
measurements were made nea r th e loca tion o f each infiltrometer rest.
Post der;e/optnent it!ftltrarion rates. Post development infiltration te ts were carried out o n natural wooded lot A in May 2004 sin ce this was th e only lo t with a finished home dur in g the rim e of this stud y. Infi ltration rates were
measured at fo ur location on the turf area in th e front ya rd and fo ur sites on the turf area
in th e backya rd . These in fi ltration tests and cone index measurem ents were ca rried o ut using the procedure de cribed previou ly.
ide-by-side testi11g. lnfilmttion, cone index, and bulk den ity measurements were conducted on the natural wooded lot F and the plant
ed forest lots G and H . The testing was carried out February through July 20 3. On each lot, six sites were selected for paired measurement testing. Each sire con isted of a location that was undisturbed and a location that had been traffi cked by construction vehicles. T here was a ma ximum distance of 2 m (6.6 ft) between the paired measurem ent locations at each site. On the planted forest lor H the cone index was measured at on ly four of th e sites due to interferen ce of clearing operations on the other two site . A parti cle size distribution analysis was condu cted using the hydrometer method on five so il samples collected randomly (from the top I 0 em) on each lor (Gee and Bauder, 19 6) . A t- test was used to compare the paired infil
tration rate and bulk density measurem ents. E_ffects of compaction le11el 0 11 iujlltratiou.
rates. Site rlescriptio11. An existing pasture at th e University of Florida Plant cien ce Research and Education Unit nea r C itra, Flo rida was used for a compaction trial. The pasture area had been subjected to traffi c parti cular to this land use for at least 20 year . This ire represents pa tures in Flo rida that are being converted to residential subdivi ions and will be referred to as th e pasture site in this paper. The so il has been mapped as a Ca ndler fin e sa nd (LamelJic Quartzip amments; Buster, 1979), w h ich is composed f 96.4 percent sand, 2 .0 percent silt, and has a fi e ld capacity of 6 .2 perce nt by volum e in the
top 25 em (Carli sle et al. , 1989) . Col/trolled contpacrioll . A controlled com
paction trial was ca rried o ut on the pasture sire in February 2004. An area of the pasture approximately 5 m (16.4 fr) long by 2.5 m (8 .2 ft) wide was cleared of the top 10 em (3 . 9 in) of g rass roots (a typ ical practi ce on constructio n sites) . Th is area was th en divided into sixtee n plo ts each 0 .6 111 (2 .0 ft) by 1 .2 m (3 .9 fr). Four levels o f compaction trea tments were th en applied in a Latin Square experi-
Reproduced with permission of the copyright owner. Further reproduction prohibited without permission.
mental design. A Mikasa GX 100 (MT-65H) (Mikasa angyo o., Ltd .) 'jumping j ack' type compactor was used to appl y different levels o f compacti o n. The compacto r was moved about th e plo ts in a steady manner to achieve a unifo rm level o f compactio n. The four levels o f o mpactio n were zero minutes of compaction (contro l), a half- minute of com pac tion , three minutes of compaction and ten minutes o f compaction. Infiltratio n rate, bu lk density, so il moisture content, and c ne index were measured o n each plo t by m ethods described pn.:vio u•dy. Also, a Proctor density test (A TM , 2002c) was conducted on a so il sa mpl e fi·om th.: sire. The .:xperimenta! procedure was then repeated in an undisturbed area o n lot I) after remova l o f the top I 0 em (3.9 in) o f orga nic material and soil. Thus, the t\¥0 common areas being developed in
o rth entral Fl o rida were represented by these two sites. The results from the two I ca tio ns wer.: analyzed using the LM procedure with an analysis of va riance (A OVA;
A , 20 1 ). un can's Multiple R ange Test at the 95 percent confidence interval was used to find signifi cant differences between the trea tment means.
Vehic11lnr compnaio11. A pa ture area at the Plant cience R esearch and ducati o n Unit was selec ted and a mechanica l grader wa
used to rem ove the top I 0 em (3.9 in) of g rass and so il fi·om three plots eac h abo ut 18 m (59 .0 ft) lo ng and 1.2 m (3.9 ft) wide. It took approximately fo ur pass.:s o f the grader to remove the grass roots and so il and ca re was taken to .:nsure that the grader traveled in the same wheel tracks for each pass, thus ensuring that th ere was minimal compac tio n within the plots.
Three vehicles that arc commo nly used in urban constructio n were used fo r th e vehicular compaction trial. These vehi cles were an all - wheel drive aterpillar 41 6 13 backh oe weighing 6.3 M g (7 .1 t) with a front tire pressure o f 206 k Pa (30 psi) and a rear tire pressure o f 3 10 kPa (45 psi), a dump tru ck with a fro nt axle weight of 6 .0 M g (6.7 r), a to tal load o f 18 .4 M g (20 .6 t) o n th e two r.:ar axles and tire pressures of31 0 kPa (45 psi) and a pickup tru ck with a front axle load o f I . I M g ( I .2 to ns), a rea r axle load o f 0 .8 M g (0 . 9 tons) and a tire pressure o f 275 kPa (40 psi) . Each vehi cle was driven, at walking speed, alo ng a plot with one wh eel running down th e middle o f th e plot and the other outside of th e plot. inc passes of each vehicle were made in the plots. Fo ur measurements of
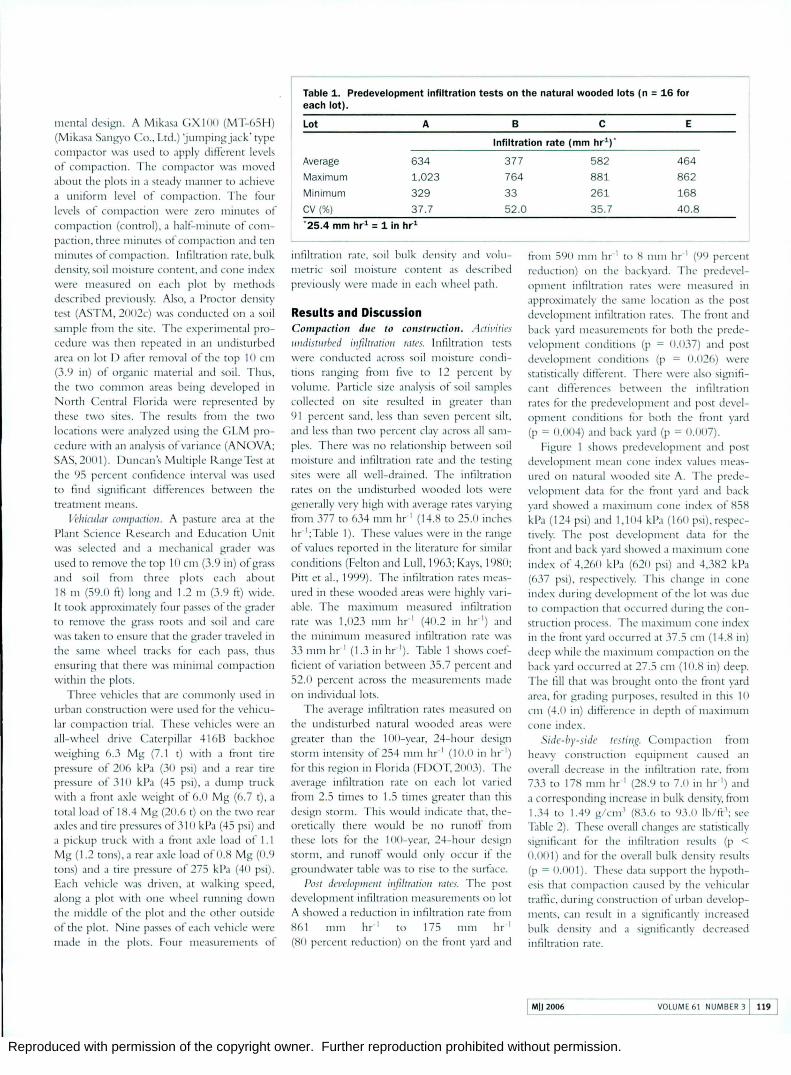
Table 1. Predevelopment Infiltration tests on the natural wooded lots (n = 16 for each lot).
lot A B c E
Infiltration rate ( mm hr1 ) ·
Average 634 377 Maximum 1,023 764 Minimum 329 33 cv (%) 37 .7 52.0 ' 25.4 mm hr1 = 1 in hr1
infiltration r~re , ~oi l bu lk demity and volumetric soil mo isture content as d.:scribcd previo usly were made in each wheel path .
Results and Discussion Compaction due to coustmctiou. Aai11itirs 1111dist11rbed it!filrmrioll mres. Infi ltrati o n tests were conducted ac ross soi l mo isrur.: condi tio ns ranging fi·om fi ve to 12 percent by volume. Particle size analys is o f soi l samples co llected on site resulted in greater than 9 1 percent sand, less than seven percent silt, and less than rwo percent clay across all sa mples. There wa no relati o n hip between so il mo isture and infiltrati o n rate and the testing sites were all well -drained . The infiltrati o n rare on the undisturbed wooded lots were gen erally very hi gh with average rates va rying from 377 to 634 mm hr-1 ( 14.8 to 25 .0 inches hr-1 ;Table I) . These value were in th e range o f value reported in the literature fo r similar conditions (Felton and Lu ll , 1963; I<ays , 1980; Pi rt er a!. , 1999). The infi ltration rates measured in the e wooded area were highly va ri abl e. The maximum measured infiltrati o n ra te wa I ,023 mm hr-1 (40 .2 in hr-1
) and the minimum measured infiltratio n rate was 33 mm hr-1 (1.3 in hr-1) . Table I shows co.:ffi cient of variation between 35.7 percem and 52.0 percem across the mea urements made o n individual lots.
The average infiltration rates measured o n th e undisturbed natural wooded areas were greater than the I 00- year, 24- ho ur design sto rm imcnsity o f 254 111111 hr-1 ( I 0 .0 in hr-1
)
fo r this regio n in Florida (FI)OT, 2003). The average infiltratio n rate on eac h lot va ri ed fi·om 2.5 times to 1.5 time greater than this dt.:sign storm. This would indi cate that, th eoreti ca lly th ere would be no runo ff fi·om these lots for the I 00-year, 24- ho ur design torm , and runoff wo uld nly occur if the
gro undwater table \ as to rise to the sw-fac<.: . Posr developmetll i1!filtmtio11 mres. The pm r
developmem infi ltration measu remems on lot A showed a reduction in infiltratio n rate from 86 1 mm hr-1 to 175 mm hr-1
(80 percem r<.:duction) o n the fi·ont yard and
582 464 881 862 261 168
35.7 40.8
from 590 mm hr 1 to 8 mm hr 1 (99 percem redu ctio n) o n th <.: backyard . The pr<.:devd opmem infiltration rates wert.: mea~ur<.:d in approximately the sa me loca tio n as th e post devel opment infiltrati on rates. The fi·om and back ya rd m <.:asur<.:m<.:nts fo r both the predevelo pmem conditi o ns (p = 0.037) and post develo pment conditio ns (p = 0 .026) were statisti ca lly diflerent. There were also signifi ca m differences betwee n th e infiltrati o n rates fo r the predevelo pmellt and post development conditio ns fo r both the fro nt ya rd (p = 0 .004) and back ya rd (p = 0 .007) .
Figure I show~ predcvelo pmem and post develo pment mea n cone index va lu es m ea -urcd o n natural wooded sire A. The predevelopmem data fo r the fi·om yard and bac k ya rd showed a maximum con<: ind <.:x of 858 kPa ( 124 p i) and I, I 04 kPa ( 160 p~ i ), respective ly. The post dcvelo pmem data fo r the fro nt and back ya rd showed a max imum cone
index o f 4,260 k !la (620 psi) and 4 ,382 kPa (637 psi), respect ive ly. This chang<: in cone index during dewlo pmcm of the lo t was due to compac ti o n that occurred during th e contru crio n proces~. The maximum cone index
in the fi·o nt yard occurred at 37.5 cm ( 14.8 in) deep whil<.: th<.: maximum compactio n on th e back ya rd occurred at 27 .5 em (1 0.8 in) deep. The fill that was b ro ught o nto the front ya rd area , fo r grading purposes, resulted in this I 0 cm (4 .0 in) difference in depth of maximum cone index .
ide-by-side tcs tiiiJ!. o mpac ti o n fro m heavy constru ctio n eq uip m<.:nt ca used an overall dcc rea~e in the infiltratio n rare. fiu m 733 to 178 mm hr-1 (28.9 to 7.0 in hr-1
) and
a corre po ndin g increase in bulk density, fi·om I .34 to 1 .49 g/ cm 1 (H3.6 to 93.0 lb/ fr\ see Table 2). The~c overall changes arc statistica lly signifi cant fo r the infiltratio n r.:sul ts (p < 0.001) and fo r the overall bulk densi ty results (p = 0 .00 I). Th.:s<.: data suppo rt the hypothes is that compactio n ca us.:d by th e vehicular traffi c, durin g co nstru ctio n o f urban developments , can re~ul t in a signi fica ntly in creased bulk density and a ign ifica ntly decrea ed infiltratio n rare.
I M!J 2006 VOLUME 61 NUMBER 3 1 119

Reproduced with permission of the copyright owner. Further reproduction prohibited without permission.
Figure 1 Predevelopment and post development cone index values for natural wooded lot A, where error bars represent one standard deviat ion . Note that 1 inch = 2.54 em and 1 psi = 6.89 kPa.
Cone index (kPa)
0 500 1000 1500 2000 2500 3000 3500 4000 4500 5000 0 .. -;--:.....
e 5 u
10 Q) u 15 ca 't :I 20 Ill
-~ . ~" ~ "\. .........
ltQ;:i "';...: -;--.... ~
~ ---tt4-li ~
---...:. -I ll, &, I
'"" "' \. -....._, ~ 25 Q -a; 30 .c
........... ..7 0 0 -- -...,..
0 0 -.. "'>. -.c 35 .... c. Q) 40 c
" 00 ..........
I I .i. i:l I I 1 I ~. ti_l I /
-----45
· · · ''' · · Front yard . Predevelopment · · · El · • · Back yard · Predevelopment
--tr-- Front yard · Post development --e-- Back yard · Post development
The natural wooded area was no t subject to vehicl e traffi c. The planted fo rest would have been subjected to planting and harvesting activiti es involving heavy equipm ent that would have cau ed some compaction. The ignifi ant difference (p = 0.00 ) between
the mean undi turbed infiltrati n ra tes on the natu ral wooded ire (908 mm hr· 1
; 35.7 in hr-1
) and the planted fo rest ites (631 mm hr· 1; 24.8 in hr-1) was therefo re expected; however, there wa no ignifica nt di ffe rence ben.veen the undisturbed bul k densities (p =
.144). T he lack of a significant di ffe rence in bulk densities could be due to th e soil core sa mple being c llec ted in th e top 10 em (3.9 in) of the soi l pro fil e after clea ring of th e urface o rganic materiaL The effect f compaction i greatest at depths below 30 em (11.8 in) (Hakans on and Petelkau, 1994); the soil sam ples collected in the top 10 em (3.9 in) wou ld n t how this effect. Figu re 2 shows the differen e between average cone
index value on the natural wooded lot and th e planted fo rest lots. The greate t effect of compaction occurred between 25 em (9.8 in) and 32.5 em (12.8 in).
It is also interesting to note that after compacti on there was no statistical di ffe rence (p = 0.746) in th e infil tration rates and bulk densities measured on the natu ra l wooded lo t o r those measured on the planted fo rest lots (p = 0 .563). T his indicates that although these sites had di ffe rent undisturbed in fi ltration rates, compac tion du e to construction tra ffi c resulted in no significant difference in infi ltration rates.
From Figure 2 it should be no ted that there wa a d ifference between the magn itudes of the cone index graphs fi·om the natu ra l wooded lo t and the planted fore t lots. The natural wooded lo t had maxi mum cone index values of1 ,071 kPa (156 psi) and 1,965 kPa (286 p i) for und isturbed and distu rbed area tests , respectively. On the planted fo rest
lots, maximum cone index values were 1,914 to 3,74 1 kPa (279 to 545 psi) fo r th e same respective testing condi tion . Thi evidence supports th e theory that the planted fl rest lot had undergone compactio n in the past, whi ch decreased th e undisturbed infi ltration rates compared to the natural wooded lo t.
Effect of compactiorr level orr irrfiltratio rr rates. Coli/ rolled C0 111 pactio11 . T he results of the A OVA conducted on infi ltration rate and soil bu lk density da ta (Figure 3), on both the pasture and wooded subplots bowed that there was a ignifi cant difference between th e non-compacted infi ltratio n rates on the pasture (225 nun / hr; 8 . 9 inches/ hr) and on the wooded area (487 mm hr-1; 19.2 in hr-1).
However, th e two locati ons had the same textural soil classifi ca tions (sand; 91 percent sand, Jess than nin e percent ilt, and Jess than four perce nt clay aero s ali samples) and the same non- compacted mea n bulk densities (1.49 g/ cm3; 93.0 lb/ fr3) . There wa no significant effect due to spatial va riation in soil (p>0.33) within each experimental locati n . Sta tistically significa nt differences were not fo und between the mean infi ltration rates of 65 mm hr· 1 (2.6 in hr-1), 30 mm hr· 1 (1.2 in hr-1) and 23 mm hr-1 (0 .9 in hr-1) th at occurred after 30 second , three minutes, and I 0 minutes of c mpac tion on the pa ture. T his result suggests that compac tion over the various levels imposed in this study did no t substantiaLl y decrease the in fi ltra ti on ra te. Therefore, over th e ra nge f compacti on that we considered, the soil was either compacted o r non-compacted in terms of th e effect on infi ltration rate. A simi lar trend wa observed with the data from the wooded site; h wever, a statistica lly signi fica nt di ffe rence was found between the 30-second trea011ent (79 mm hr· 1; 3.1 in hr-1) and the 10-minute treatm ent (20 mm hr-1; 0.8 in hr-1).
T he mea n bul k densities after 10 minutes of compacti on were signifi cantly different
Table 2 . Average Infiltration rates, bulk density, coefficient of variation (In parentheses with units of percent) and paired t-test probability from natural wooded lot F, planted forest lots G and H (n = 6 for each lot and each compaction level except where noted).
Mean Infiltration rate (mm hr1 )" Bulk density (gjcm3)T Lot Undisturbed ( %) Compacted (%) p value Undisturbed (%) Compacted (%) p value
Ht 637 (22 .7) 187 (52 .4) 0 .003 1.20 (17.2) 1.48 (5.0) 0 .009
G 652 (26.9) 160 (52 .0) <0 .001 1.40 (6 .5) 1.52 (9.3) 0.110
F 908 (23 .2) 188 (50 .1) 0 .001 1.42 (4 .1) 1.47 (7.1) 0.252
Average 733 (28 .8) 178 (49 .1) <0 .001 1.34 (12.1) 1.49 (7.1) 0.001
· 25.4 mm hr1 = 1 In hr1
t 1 gjcm3 = 62.4 lbj ft3
t n = 4 for compacted testing on this lot since two sites were destroyed due to land clearing.
120 IOUR NAL OF SOIL AND WATE R CONSERVATION MIJ 2006

Reproduced with permission of the copyright owner. Further reproduction prohibited without permission.
f n~~2 l Average cone index values (n = 6 for F and G; n = 4 for H) for und isturbed and compacted sites in naturally wooded areas and a planted forest, error bars represent one standard deviation. Note that 1 inch = 2.54 em and 1 psi = 6.89 kPa.
.-... E (,)
Cl) (,)
~ ::I (/)
~ 0 Qj .c .::. ~ Cl)
c
E (,)
Cl) (,)
~ ::I (/)
~ 0 Qj .c .::. ~ Cl)
c
E (,)
Cl) (,)
~ ::I (/)
~ 0 Qj .c .::. ..... c.
L
Cone index (kPa)
0 500 1000 1500 2000 2500 3000 3500 4000 4500 5000 0 ~ 5 t'-*1
10 ~-15 20 25 30 35 40 45 v
Cone index (kPa)
0 500 1000 1500 2000 2500 3000 3500 4000 4500 5000 0 ·~f:= 5 · ~~-~E:~k~=::~s:::;;;:~=---~(~bl~P~I anted fo rest, lot G
10 ~ v-15 :~~~~r 20 25 30 35 40 v. ' ,-rv
45 ~---------------------~
Cone index (kPa)
0 500 1000 1500 2000 2500 3000 3500 4000 4500 5000 0 '"'i"'--
1~ E~=...,.,~~~s~-=--_, 15 ~~~~y~-~~
(c) Planted forest , lot H
20 25 30 35 40 45 ~----------------------~
I·. ·X· .. Uncompacted -----.:;--Compacted I
bc:twc:c:n the: pa,turc: and the wooded loca
tions (Figure 3) . This ca n be: c:xpbined beca use: th e: m ax imum Proctor dens ity of I .HlJ g/ cn1 1 ( 11 7.lJ lb/ fr1
) on the: woodc:d si te: compared to the 111axi1 num Proctor densi ty
of I .H3 g/ ern 1 ( I 14.2 lb/ fr') for the: pasture.
indi ca tes that the: woodc:d ' ite can be com pacted to a grcatc:r bu lk density. Th e: bulk dc: nsiry of the: pasture: so il after I 0 minute: of
co mpac tio n was 1.73 g/ cm 1 ( I OH.O lb/ ft 1) .
thi s equatcs to approximate ly lJS percc:nt of the: m ax imum l' rocto r dc:mity and the bulk
demiry o f the 'oil .lt the: woodcd .uc:.1 atrc:r I 0 minute: o f compactio n was 1.7lJ g/ c 111 1
( 111 .7 lb/ fr 1). w hi ch also equates to lJ5 pcr
cc:m of th e: 111ax i1num ll roctor de: miry.
The cone index thro ugho ut the pro file:
o n th e no n-compactc:d wooded area was
lower thJn the cone indc:x m e.l\ Ured o n the: no n-comp.lc ted pa, ture (Fi gure 4). The
n1 ax i1num .wer.1gc co ne: index o n the: non
C0111pac ted wooded \ubplots was 1.213 k l' .1
( 177 psi) at 42.5 Clll ( I 6 . 7 in) .tml the maxi-111U I11 average cone indcx o n the: non-
I Table 3. Correlation and probability vall ues (p) between average cone index (CI)
at 2.5 em depth Increments and average surface infiltration rates, as measured on the compacted and undisturbed locations on natural wooded lot F, planted forest lot G and H.
Pearson correlation
Depth (em) coef. (r) p
0.0 -0.581 0.227
2.5 -0 .757 0.081
5.0 -0.807 0 .052
7.5 -0 .804 0 .054
10.0 -0.818 0.047
12.5 -0.826 0.043
15.0 -0 .815 0.048
17.5 -0.817 0.047
20.0 -0.811 0.050
22.5 -0.785 0.064
25.0 -0.756 0.082
27.5 -0.753 0.084
30.0 -0.727 0 .102
32.5 -0.705 0.118
35.0 -0.691 0.129
37.5 -0.675 0.141
40.0 -0. 704 0.118
co111p.1ctcd pa\ture \ ubpl ot' w.l'> 4. 145 kl'a
(603 psi ) at 37.5 cm ( 14.H in). The pasture was subjc:ctc:d to co 111p.1Ct io n (c.n rsed by livc:
\ tock and Vl'h iclc:s) in th e p.l\t that probably co ntributed to the incre.tsl'll cone i11dcx.
1-l owc:vc: r. th e: ditli: re ncc: in co ne· index
bc:tween th e: p.l\turc: and the \\ 'Ootkd site:
occurred at dcpths gre.uc:r than the: I 0 em
(3 .<J in) usc·d for \a mplin g bulk de n\ ity. On
th e: woodc:d sitc:s, an incrc:asc: in avc ra gc: cone
indc:x was ncgativc:ly corrc: l.uc: d with infiltra
tion rate: (Table: 3) . The: stro ngc\t corrcbti o n
occurred bc:rwc:c:n I 0 and 20 em (3.<J and 7.lJ in) depths (p < ().05), further indi c.uing
th .n co mp act ion occ urs bel ow I 0 c 1n (3.<J in ) depth.
I i·himlar (( liiiJ irlrri<>ll . l~1blc: 4 \Uillm,l ri zc:'>
the: m ea n infiltr.lti o n ratL'S .md bulk demit)• tbt.l co ll c:ctc:d in the: wheel rut\ crc:.nc:d dur
ing the vc:hicul.tr co mp.Kti o n tri.tl. The: A OVA indi cated no signiti c.1nt diHl:rc:ncc: bct:wccn mean intiltr.ltio n r.ltL' ' in th e: b.Kkhoc: tr.Kks .md in the pi ck up tr.tck\ , alth o ugh th e b.tckhoc tr.tck\ did show .1 numc:rically
lower 111ean intiltr.uion rate (S<J 1111n hr 1: 2.3 in hr 1) than the pi ckup (6H n1111 hr 1: 2.7
i11 hr 1). IJo th th e: backhoe .md pickup re\ulted
in signifi ca ntl y highe r m c.1 11 infiltration rate' th ,m the du111p tru ck (23 111111 hr 1: O.<J in hr~ 1 ).
There were 11 0 ' igniti c.1nt ditll: re 11 ces
MIJ 2006 VOLUME 6 1 NUMBER 3 1 121

Reproduced with permission of the copyright owner. Further reproduction prohibited without permission.
Figure3 l Average infiltration rate and bu lk density measurements (n: 4) from a pasture and naturally wooded site. Standard deviations are ind icated by error bars, while means that are not significantly different (a : o.os) are grouped by the same letter. To, To.s, T3 and T1o represent co mpaction trea tments of o, o.s. 3 and 10 minutes with a portable compaction device, respectively. Note that 25-4 em : 1 inch an d 1 g/ cml : 62-4 lb / ftl .
600
a ~ 500 I.. .c E E 400
4) -Ia 300 ... r::::: b 0 :;;
200 Ia ... -i; r::::: 100
de e
0 TO T0 .5 T3 T10
1.85 a
1.80 -"' brl-b
E 1.75 u .........
b be
"0.0 1.70 ._.. --
>- ---·c;; 1.65 c r::::: 4) 'C 1.60 .::s: T ::I
1.55 Dl d
1.50 d r T
1.45 I J_ I l l TO T0 .5 T3 T10
D Pastu re D Wooded
Table 4. Mean infiltrat ion rate and bulk densit y result f rom t ests conducted in the wheel ru t s of a dump t ruck, backhoe and pickup after nine passes ove r a g raded pasture . Means that were not significantly different were grouped with the same letter (n = 4 for each vehicle).
Infiltration rate (mm hr 1 ) '
Dump truck
Back hoe
Pickup
· 25.4 mm hr 1 = 1 inch hr 1
t 1 gj cm3 = 62.4 lbj ft3
t Coefficient of variat ion .
23b
59 a
68a
[1lll JOURNAL OF SOIL AND WATER CONSERVATION MIJ 2006]
cv (%)t
43 .9
14.1
23 .1
Bulk density cv (gj cml )t (%)
1.68a 2 .3
1 .61a 1.9
1.61a 2.5
between th e m ea n bul k densities fo r th e three
treatments, alth ugh the du m p truck did re<;ult in a nunH.: ri ca lly higher mean bu lk
demiry ( 1.6H g/ cm 1; I 0-t.S lb / fr1) than the
backh oe and pickup ( 1.6 1 g/ cm '; 100.5
lb/ fr1). Th e b ck o f a significa nt diffe rence
betwee n th e m ea n bul k densities, aga in m ay
be due w the bu lk density be ing determined
fi·o m <;o il 'ample' collected in th e to p I () cm
(3.9 in) of th e 'io il pro file , since compacti o n
rend'i w occur below 10 cm (3 .9 in) as has
been 'i hown previo usly .
Summary and Conclusion o il compactio n was shown w have a nega
tive effect o n inti ltratio n rates of 'o il' in no rth ce ntral Flo rida. On these sandy soils, th e
lowest leve l of com pac tio n resulted in si!,,'11i f
ica ntly lower infiltrati o n rate'i; th e refo re, any
am ount o f compactio n must be avo ided o n
the'e 'o ils if runoff fi·om de e lo pm ent 'i ites is w be minimi zed. H owever, it was show n
that th ere could be a 'iignifi ca m diffe rence
betw een the effect o f compac ti o n caused by
rela ti ve ly light co nstructi o n eq uipm ent (i.e. a
backh oe and pi ckup) and ve ry heavy equip
m ent (i.e. a fully loaded dump truck). Fo r the
purpose<; of de term ini ng potential infilt ratio n rate'i, so ils co uld be classifi ed as e ithe r CO ill
pac ted o r no n-compacted . This cb <;s ifi ca tio n
of th e compactio n of a soil could have a 'i ign ifica m affect o n hydro logio l and
'wrmwater m odeling , parti cularly fo r low impac t development proj ec ts w here the o il
infiltrati o n rates an.: cr it ica l since infiltration is J key co mp o ne m of th e sro rnl\va t<.: r ne t wo rk. Accurate infiltratio n rate info rmatio n
i'i <1l 'o important in tr:~ ditiona l run ff estima
tio n fi·o m urban areas because undisturbed so il
infiltratio n rates arc typi ca ll y assumed fo r pervio us a1-cas. O verestimatio n o f th e so il
in fi ltratio n ra te would result in an underesti
mati on of the runo ff fi-om a pecified area and <1 rc,ul t.mt undere'itimatio n of a nooding evenr.
To 111 aimain predevelo pmenr in fi ltrati o n r.ltes o n a lo t, area' o f the developm ent sho uld be left undisturbed . D em arca ting areas o f the
develo pm ent ro preve nt compacti o n o f th e 'o il wo uld hl:ip maintain predevelu pn1 ent inti ltr<Hio n r<lte,_ Special effo rt<; 'i ho uld also
be made to leave natural areas, undi 'i tu rbed as th e<;e areas we re o;hown w have the highest
infiltrati o n rate'i. ! ~edu c ing the u e of any
equipment o n the lo r as much a<; possible
would <1 l'o hel p limit th e reductio n in infil
tr<Hi o n rates ca used by compac tio n .
M ea,uring in fi ltratio n rates i' a lens'l:hy procedure co mpared w m easurin g co ne
index . Therefo re, cone index could be used
ro quick ly .mel eHicicnrly identi fy area o f

Reproduced with permission of the copyright owner. Further reproduction prohibited without permission.
Figure 4 Average con e index values for each level of compact ion (n = 4) at th e pasture and th e wooded sites. To, To.s , T3 and T1o represent compaction treatments of o, o.s, 3 and 10 minutes with a portable compaction device, respect ive ly. Note that 1 inch= 2.54 em and 1 psi= 6.89 kPa.
Cone index (kPa)
0 1000 2000 3000 4000 5000 0
E 5 .....,__·-f".~ ..... ---- a) Pasture . ·+·. ->fr-(,) 10 '• + ... - "'-"tr-~--==:.s · -
Q) 15 +· .. ·+. . - ..:; . - .- :)! (,)
!'a 't: 20 -~ ·-x ::I '/S- __ :A 1/) 25 ::
30 t --0 Qj
35 _.e.
.D ~--.c 40
--..t:, .... fs.-c.
t:r-- -----~ Q) 45 0
50
Cone index (kPa)
0 1000 2000 3000 4000 5000 0
~ 5 ~.j- .... _ b) Wooded E --~-(,) 10 . ·+.:...--b--.- .-*
·.+. -- - --ts--..:..: ·>f- ._ Q) 15 (,) + -~ ' % + 'fr_ X. . !'a 't: 20 + - &. - ·x ::I -f
~~ 1/) 25 .+ ::
30 ; t' 0 + .1!5. Qj
35 +' -8. --.D +' k --.c
40 ./!s. --....
.~:s. --c. Q) 45 A" 0 !!,.
50
I~TO ··· + ·· T0.5 --{r- T3 -· X · - TlO
.1 develop nu: nt th.H haw been exposed to co111p.1ctio n .md .1re thu ' comri buti ng to decn.:.1,ed infiltration r.lte'>.
Acknowledgements Speci.li th.mb .1re g iwn to J)an ny l3 u rch fo r
hi ' help in putting together the equipn 1c11t needed fo r intiltr.nion tests and 13re llt
Addi ,on for hi, help in co11ducting infi ltra
tion tL''>t). T hi' re\ea rch was ' upportecl by the Florid.1 Agri cultur.li Experi mellt ratio n
• 1nd .1 gr.mt fi·om St. Jo hm R iver Water M .1n ~1gcnH~ nt l)i,trict .mel approved for
publi cation .1'> j o urn .1 l Seric' N o. l"t- 1 0532.
References Cited Arnnrr.nr '-,ouL·t~ ofA~ r h. ultur. tl l.:.ngn H.'L'" (A'-lAE). 2000. \ o il
n ul L' )lL'llt'lrt}lll l'tLT.A "'-JAL ~t.t n d.rrd, No. '-,.liJ.J. AnrLTIC.I II
)on~..·~ ot"Agn cu hur;tl l~ nglllL'L' I"\. ">t.Jo''-'Jlh. MKhr~ur .
AmnK.Hl '-,ouL·r~ uf TL·,t urg .L!Id M.Hnr.l l' (A'-;1 M ). 2002.1.
\t.111d.ml lL''t lllL'thod lilr d~..· n,ll~ of ,oJ! 111 pl.i t-t' h\ dlt'
dr1w-q l1ndn ntt•thod . AllltU,Ii IJm•l.. tt fASl M ~t.l ll d ,Jrd'
11-UIX No. I):!'JJ7-t10. Alllnll.lll ~Ol"lt't~ nf Jt.·,ung .111d
1\ l.u tTI.tk Wt·,t ( OIJ , JH Jhotl..t' ll. l't' lllt,y ln iJI .L
Arnt'rJt.lll ")out·r~ of ~l l_·,un~ .md IVI.II tTI.i l' {A~ I M). 2002h.
~t.1 11d .J rd lt''l lll t' thod tlu·l.!hor:ltiU'Y d t•tt•n JtJII.Iflnll 11fw.lt l'l'
(Moht\11\') Co!Hl'nt o f 'o1l .111d rocl.. h~ nl.l". l11: Annu.tl
Uoo l.. o f A~TM ~t.llld.mb 0-J .IIX. Anll'rJLI II ~out·ty of
~l t·,t Jilg .u1d M.lttTI.Ik Wt'\t ( ~OIJ,hoiHKI.. t• lt . l lt' llll'~ h.1n1.1 .
Antt' rl t.lll ")onl't~ ofTt·,ung ,llld M .HtTI.lh (A~ I M ). 200~l.
~t.tnd.ml lt'' t lllt'thod, l(n l,!hor.lhH'\' nunp.lttlonth.Jr.tc
tt·n .. ur' of ,oJ! u' 1ng \ t.llld.ml dlim II ~.-HIll fr- lhf tt 1 ((J! H l
I..N- n1 ln 1)1_ 1}(1'JX- IHI .Annu.JI Uonl.. of A\ r f\ 1. ")t.tnd.mJ,
t14 .11X . Anlt'l'lt.lll ..,out·t~ ol k 'ung .111d M .Ht' l'l .lk Wt·,t
( 'omhohotl..l'n. Pt'll lh\ h .HJI.I .
lll.tl.c. C .lt. .111d J. l I. I l.tl'l ~•· I '!K(, I lull. dell"" l'p .lr •. l .. l7C. /11 : Mt· thmJ, ol 'oil .1 11 .1h , I,, 1'.1rt I A ..,A f\ lonogr.•ph No.
'J. Anlt'rll.lll Agnuw1m ..,tlllt..'l\ , t\Lillt,on. \rhuHI,IIl
l hhtt'l'.-1 . 1 ~ I'J7'). ~tu l 'llr\l'\ t>l 1\ Lii'H ill ( tHIIH\ , I hmd.1 ..,,,,\
Coll't'n".lllon ._,t·n In'. W,t,Jungtoll , I><_
( '.tr!J,Jc.V.W .. I. ._,mlt·l... M I ( 'o lh m. l (_ ll.inllnond. ,1nd
\V.( ;_ ll.trn.. . I 1JH 1J ( ' h.1r.tt tt'l'\/,ltiOil d.tt.l hu 'dt't'lt'd
1\ond.! 't>lk ..,oil '-,t..Jt'lltt' itt''t'.llt h lt t'JhU t No_ ~{') I
U lll \t' I' ~Jt\ of l lond.1. lll ,Lit!Ht' ol I nod .tnd Agntu ltur,ll
")n l" lll' l''· (; ,Hil t''' Ilk·. ll01rd.1.
(_ ' Ito\\, V.. I ). M.udntt'ltt .. 11 1d I \.1\' I 'JXX ")ulNirt.ltt'
w.lti .. T.I'p. I! 11J- II!I . h1. Appht·d h\drolo!--." fvh( ;r,l\\ ll dl.
Inc. Nt..'\' Vorl... Nt'\\ Vorl..
l l'hon. I ~M .. 111d 11. \\ '. l ull. 1~ud ")uhurh.uJ h~dmlo~~
t'.Hl 1111prmt' \\,ltn,hcd u utdUIOih l'p- 1) ,,
1)4 / 11 Puhltt..
Wnrl.., No. 1J4 .
I lund,! lkp.tnlllt'llt ul l r,lmpmt,IIJOII (1\ )() 1) ~OOJ
I )r.nn.lgt..' llt.llllt.il . 1\o nd.! I kp.u Ullt' IH olli ,lll'JlOI't ,l l iOII.
(_ ) tlin· ot' l> t•, Jgn. dr.ull.l,!-:l' 't'tiHIIl. l.dl.di .l"t't' . l lnnd.L
C.mlnl'r. W I I. I'JXf, . W.llt'l' UHllt' Jlt Pp. 41).\ =)44 !11. f\1t•thod,
o(,od . !II , II ~, J ,, I '.Irt I. A'-,A Monog1 .1ph No_ 1) Arllt'llt... \11
A~mno111~ ..,Ut lt'l\. M.JdhtHI, \\·l,t tlll,lll
Cn·. C .W .. 1nd j.\V. B.HJdl'r JIJHft. l'.mhlt· 'lit' .111.!1''" l'p. JX.'-411 . /11 . t'Vkthod, ol ,ud .m.Lh''' · l'.1 n I A~A Mon ogr.1ph No. •J Allll'l'll.lll AgltHiolll\ ..,OLit't\,
M .u.Jt ,on.\VJ,UIIl,lll
Crq.~ory. J. l l .. M .n I >ul.. t·'· C I J\ ld k·J .. !lld P I! Jonl',,
21 H 15. An.dy'1' ol douhlt- -nng llllihr.tuon tl't hnl tlliL''
.ual d l·,dopnlt'Jll nl .1 '1111plt· .tliiOJll.Hll \\,Itt'!' ddJ\t' n
"Y'tt' lll . Apphl'll lurlgr.•" \tll' lln' A,.ul.•hk .n . Imp : """·PLIIHIII,IJJ.Igl'llll' lltllt'l\\orl.. _olg pub .lh g lll
dt· - ~0115 r111g .
II.LI...in\\on. I. .md I I. Pt"tdl...itt JI)I).J Ht'llt'lih ol hntll t'd ·" It·
lo.1d . Jlp. 47'J-:i110 . l11 ..,oil tolnp.lttHHJ 111 thlJl produt
tJon .l:ht·,· rtT "-)tJl'lltt' B_V.,Anl, ll'lli.Hn. t•t htTI.Uilh
l l.untl ton. C .W .111 d l lV. W.1ddtngton I'N~J . lntilu,Juon r.Ht''
0 11 l'l''Jdl'Jltl.i\ J.i\\ II\ Ill ll'lll!,tl J't·tlll'\ h,l\11.1 J1111 11 .11 o j
\o il .111d \V.!It' l' ( 'on,l'I'\,IIIIHI :i.JC'):=if•l =j(•X
I Ionon. R. .. M .D. An l..t·m .. utd IC It Alln1.11 .1' \ 111) I I th:t" of
i...-omp.it'tJon Oil ,oJ! h~ dr.ndit propnt!t'' Pp. 1- 1) 1110. h1
")m\ t..'O illJl.lli iOil Ill lTOf' J'IUdULtJOil J- J'It'\ lt'l' \t lt'llll'
B. V.. All l,tl'rd.ull, Nl·tl lnl.ttHh
K .1~". IU . llJKO. Ild.nJolhiHp ul ton.·,t dt..,IIUltJon .111d ._.,.t d1,n1r
h,Jnu· to lttll'\.'. l't..'d tloodmg 111 thl· ' uhurh.111 Nonh ( .uul111.1
Plt'dnJmu . l'p. II X-112:i lwf\km1poln.m ln.•t• hnpnl\l'lllt'lll
Alh.uKt' l'nK"t't'dlllh" No. J Rut~l'l'\, t'" _kl'ol'\
KL"Ihng. K .. 1m\ A. l1ctt'Nnl. I'P=) Urh.u1 1.1\\tl llllih .-.ltttlll r.Ht''
.llld ll• rtdl?t'J' l'lll!tltl.J(l''l'' Utldt•r 'lllllli,ltt'd l.llllt ,d\ 11p. J4K
J52. /11 : ._,oil ")ut'lllt' ._,Otlt't\ tll Alllt'l'lt,l Pru\t't'llillh" No
.W. ~oil ~l- l l'nn· \out·t~ o t Anrnr~.. .•. f\.\.1dho11. \rl,ulll'IIL
I .d. R. .. 111d I ).M .V.indort'll l 4N11. lnthh.' lllt' ol1:1 \t',li' olton
tlllliOih torn prodmuun h~ thrt'l' ull.igl' lllt'dtod' o n
\\,ltl'r llllihr.UIOII li.u t \\11 .. o.J, 111 ()/tin "uti .111d I dl .lgl'
ltt''t'.lrch 1 (, :7 1-S-L
Pttt. it .. it . ll.tri'I"Jn. (_ · I kn1 '· I )_ .\m-. .111d I (_ ) ' (_ Ollll lT
1 ')i)t) . lntiltr.ltlOil thruugh dl,nulwd urh.n1 ,nJ!, .111d t 0111
pn,t- .nnt•mkd ,od dll·l h 011 nn1oll qu.dlt\ .md ljtl.uliH\
No.l: I'A (.oo l l ~ !HI Olf• S lmml/llllt'IH.tl l' rott'ttHHI
A~t'llt~. ()!litt' ol Rnt',Lltlt .111d l h•,t·lop llll' l\1 ,
W.hhmgton. I),( ·
Jl rnKt' Ct•orgl'·, Coullt\ I1Jt}•) l o\\ unp.l l t dt•\dnplllt'lll
dt•, Jgn .. u-.Hl'gll'~: An nuq~l .!ll'd dt•,Jgn .tppro.ll h M.ll') 1.111d I h·p.u tlllt' lll ol I m ll'lHltll t' llt.ll ltt•,o mll..'
l' rngr.Hth .md l' l.HHIIII,!-: I )1\I,HHJ , l,ugo. i\l.inl.llld
ll 1th.1rd . C .. I. Cmhiii.J I ..,ilion. A liill .l lld .. 111d J (•Ut' rtf
~0111 . l: lll•tt ul tO lliJ'.htltHI nn ,o.J poro,lt\
Con~t'lllll'lll't'' Oil h\di .Luht propnnn hn npl'.ltl
Journ.il of '-,nil ")llt'lllt' =)2 11) SX
)A). 2001. ._,A._, u,~..T\ Cllldt· ._,t,itl,llt ' \ t•t,•n•• X.112 ._,A")
ln ,tl tllt l..'. I Ill . C,tn , Ntu th ( .uolin .1
~006 VOLUM E 61 NUMBER 3 ~

Reproduced with permission of the copyright owner. Further reproduction prohibited without permission.
U.~. Ct·nsm Uur~.1u . 200-1. U.~. Nt'\\ pn,~ndy o" nt·d hou\mg
til lit\ . luthonz~o.·d by ... t .ll~o.· : 2t MIJ. M.mut:1nunn~. Mn11ng .u1d COihlfliCliOil ~t. lli'oli C, , W.hillllglOII D.C .: u.~. C t'lhlh
Uur~.111. Av.ul .ihl~ .n: Imp:! \\'\\ \\ .U'II\ll\.gov ·t omt /
www/ (lJ\t.ncplt'Ch.m .pd(.Acct...,, t.d 4 Jlllll' 21)(15. U.S. I )cp.lrliiH~ Ill orAgncuhun· N.llural l t~\Olll\.' l"'\ ( ' oll\l' f\ ",lliOII
SavK~ (USDA- R.CS). 21HMI. Urh.1n \otl l'OIIIJUl'tJo n .
Urb.1n Tt•l hmc ll Nott• No. 2. U.!'> . lkp.lrtnh,' llt of Agncuhtlrc. N.uural ltt"\(>Ull:l..., C o iJ\t'f\ ',lllOn ) tT\'Il'l'. ~ml
Qu.1lny lll'mtlltt'.Auhmn,Al.ib.uJlJ . U.S. l) t:p.artmt•m of A~ncultur~ S01l Con..,t• rv.Hwll ~ t: rVKt'
(USDA-~CS). I'IHS. ~m l <un·cy of Al.lchu.1 Coullt)'· Hond,1. U.S. Dt:p.lrtlll t' IH o f Agn cuhurt:. ~o il
Const: rv,Hion S t' n 'l l'l', W,i, Jun g:ton. D.C .
New!
Soil and Water Conservation Society
Environmental Management
Glossary
Fourth Edition
includes 1,000 new words!
To order and for more information go to: www.swcs.org
124 IOURNAL OF SOIL AND WATER CONSERVATION MIJ 2006]
Soil carbon pools in central Texas: Prairies, restored grasslands, and croplands K.N. Potter and J.D. Derner
ABSTRACT: Establishment of perennial grasses on degraded so il s has been suggested as a means to improve so il qual ity and sequester carbon in the so il. Particulate organic carbon may be an important component in the increased so il carbon content. We measured particulate organic carbon [defined as organic carbon in the 53 to 2000 ~m (0.002 to o.o8 in) size fraction]
and mineral associated organic carbon (defined as the less than 53 ~m (o.oo2 in) size fract ion) at three locations in central Texas. Each location had a never-tilled native grassland site, a long
te rm agricu ltural site and a restored grassland on a previously ti lled site. Organ ic carbon pool sizes varied in the surface 40 em (16 in) of native grassland, restored grasslands and agricul tural soils. Th e native grasslands contained the largest amounts of total organic ca rbon , wh ile the restored grass lands and agricultural soils conta ined sim ilar amounts of total organic carbon. Both particu late organic carbon and mineral associated carbon pools were reduced beyond the depth of tillage in the restored grass and agricultural so ils compared to the native grassland
so ils . The restored grassland so il s had a larger particulate organic carbon con tent than the agr icul tural so ils, but the in crease in particulate organic carbon was limited to th e su rface 5 em (2 in) of so il. Trends in particulate organic carbon accumulat ion over time from nine to 30 years
were not significant in this study.
Keywords: Particulate organic carbon (POC), native grass land, soi l quality, mineral associated carbon (MAC), total organ ic carbon (TOC)
Soil organic matter is a heterogeneous mixture of organic substances that has an important role in determining soil productivity. For modelin g purposes, it has been benefi cial to separate soil orga nic 111atter into separate pools that have difle n:nt fun ctions and degradation rates in th e so il. Howewr, in practi ce, it has been diffi cult tO separate soil orga ni c matter into pools similar to the conceptual pools proposed by th e modeling community. Techniques developed tO iso la te soil orga nic matter pools include chemical, densiometry, and size Fi·acti onation methods. Cambardella and Elliott ( 1992) developed a technique based upon size Fi-actionation that isolates the orga ni c siz.c fi·action between 52 to 2000 ~u11 (0.002 to 0.08 in), which they c:\lled particulate organic matter. he particuJan: organic matter pool has been related to
nutrient minc1-ali za tion ( , Parry et al. , 2000; and I~ Salas et al. , 2003), vegetation type (forest, 13arrios et al. , 1997; and crop, 13rcmer et al. , 1995), so il carbon content under va ri us tillage
practices (Needclman et al. , 1999; Wander and 13idart, 2000) , and soil quality change (h anz.luebbers and Arshad, 1997; Wander et al. , 1998; Chan, 1997) .
The particulate organi c matter Fi·action, of whi ch the ca rbon content is referred to as th e parti culate orga ni c ca rbon, appea rs to be more sensitive tO changes in management prac ti ces th an tOtal orga ni c ca rbon ( ambardella and Elliott, 1992; Ncedelman et al. , 1999; Wander and 13idart, 2000; 13owman et al., 1999). Parti culate o rga ni c ca rbon content often changes more rapidly than the tOtal orga nic ca rbon comem with a change in management. This difference may be a result of differential decomposition rates under vari ous manage ment and climatic conditi ons
l(en Potter is soil scientist with the U.S. Depart
ment of Agriculture Grassland, Soil, and Water
Research Laboratory in Temple, Texas. Justin D. Derner is a rangeland scienti st with the U.S .
Department of Agriculture, High Plains Grassland
Research Station in Cheyenne, Wyoming.