effect of strain rate and density on dynamic behaviour of syntactic foam
TRANSCRIPT
Composite Structures 86 (2008) 314–327
Contents lists available at ScienceDirect
Composite Structures
journal homepage: www.elsevier .com/locate /compstruct
Effect of strain rate and density on dynamic behaviour of syntactic foam
Ph. Viot a,*, K. Shankar b, D. Bernard c
a LAMEFIP – ENSAM – Esplanade de Arts et Métiers, 33405 Talence Cedex, Franceb School of Aerospace, Civil and Mechanical Engineering, University of New South Wales, Australian Defence Force Academy, Canberra, ACT 2600, Australiac Institut de Chimie de la Matière Condensée de Bordeaux, 33608 PESSAC, France
a r t i c l e i n f o
Article history:Available online 25 July 2008
Keywords:Composite sandwichCoreSyntactic foamFlywheelHigh strain rateCompressive impact
0263-8223/$ - see front matter � 2008 Elsevier Ltd. Adoi:10.1016/j.compstruct.2008.07.021
* Corresponding author. Tel.: +33 5 56 84 53 62; faE-mail address: [email protected]: http://www.lamef.bordeaux.ensam.fr (Ph. Vio
a b s t r a c t
The final objective of this study is to improve the mechanical behaviour of composite sandwich structuresunder dynamic loading (impact or crash). Cellular materials are often used as core in sandwich structuresand their behaviour has a significant influence on the response of the sandwich under impact. Syntacticfoams are widely used in many impact-absorbing applications and can be employed as sandwich core. Tooptimize their mechanical performance requires the characterisation of the foam behaviour at high strainrates and identification of the underlying mechanisms.
Mechanical tests were conducted on syntactic foams under quasi-static and high strain rate compres-sion loading. The material behaviour has been determined as a function of two parameters, density andstrain rate. These tests were complemented by experiments on a new device installed on a flywheel. Thisdevice was designed in order to achieve compression tests on foam at intermediate strain rates. Withthese test machines, the dynamic compressive behaviour has been evaluated in the strain rate rangeup [6.7 � 10�4 s�1, 100 s�1].
Impact tests were conducted on syntactic foam plates with varying volume fractions of microspheresand impact conditions. A Design of Experiment tool was employed to identify the influence of the threeparameters (microsphere volume fraction, projectile mass and height of fall) on the energy response. Mic-rotomography was employed to visualize in 3D the deformation of the structure of hollow spheres toobtain a better understanding of the micromechanisms involved in energy absorption.
� 2008 Elsevier Ltd. All rights reserved.
1. Introduction
Since 1950’s glass microspheres have been commercially pro-duced and employed in the marine, off-shore, automotive, sportingand building industries for weight reduction applications such asbuoyancy aids, paint fillers, marine putties, golf and bowling ballcores, light weight furniture, tile grout, caulk, polymer concreteand so on, primarily due to their light weight and low cost of man-ufacture. Today glass microspheres of a variety of sizes andstrengths are available from a number of manufacturers, makingthem attractive for potential usage in light weight structural appli-cations by embedding them in a resinous matrix to create syntacticfoam. Therefore in recent years there have been a number of stud-ies investigating mechanical properties of glass microsphere syn-tactic foam as well as sandwich panels employing syntactic foamas core material. Compared to microspheres made of other materi-als such as ceramic, glass microspheres offer the distinct advantageof lower density, and comparable crushing strengths, offering thepossibility of higher strength per unit weight, albeit at a cost.
ll rights reserved.
x: +33 5 56 84 53 66.m.fr (Ph. Viot).t).
The quasi-static mechanical behaviour of glass microspheresyntactic foam as well as their fracture and failure modes underuniaxial and biaxial tension, compressive loading and three pointbending have been investigated by a number of investigators in re-cent years compression with and without polymer fibre reinforce-ments [1–8]. Several studies have also been conducted on fractureproperties and impact behaviour [9–11]. More recently the dy-namic behaviour of glass microsphere syntactic foam under vary-ing strain rates has been investigated by [12,13]. They conductedtests using the Split Hopkinson Pressure Bar to determine dynamicresponse of glass microsphere syntactic foam under uniaxial com-pression as well as with radial confinement and developed consti-tutive models with strain rates and damage effects based on theirexperimental results. However their studies were confined to onlysyntactic foam of a single density. The present work aims to studythe influence of variation in microsphere volume fraction andstrain rate on the impact and dynamic compressive behaviour ofsyntactic foam. The mechanical behaviour of glass microspheresyntactic foam was studied to identify the performance of this kindof material to absorb energy during a dynamic loading. One of themain objectives of this work is to optimize the hollow sphere vol-ume fraction of the syntactic foam to obtain the highest dissipatedenergy as a function of the loading conditions. This optimisation
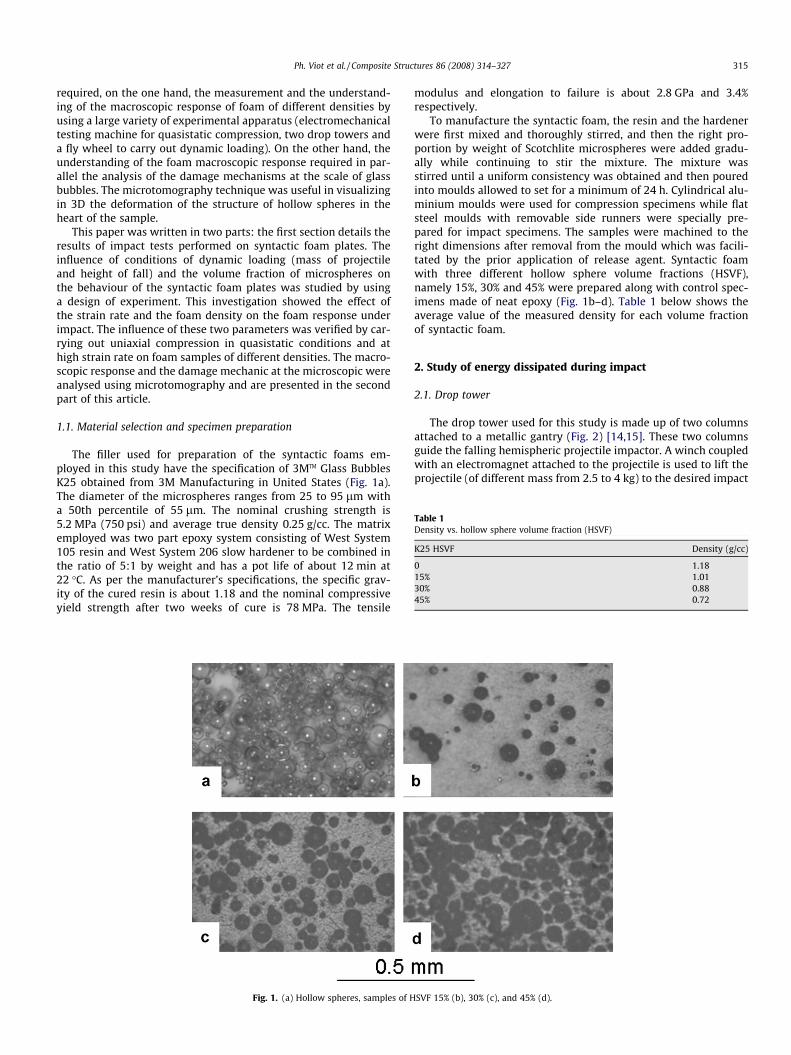
Table 1Density vs. hollow sphere volume fraction (HSVF)
K25 HSVF Density (g/cc)
0 1.1815% 1.0130% 0.8845% 0.72
Ph. Viot et al. / Composite Structures 86 (2008) 314–327 315
required, on the one hand, the measurement and the understand-ing of the macroscopic response of foam of different densities byusing a large variety of experimental apparatus (electromechanicaltesting machine for quasistatic compression, two drop towers anda fly wheel to carry out dynamic loading). On the other hand, theunderstanding of the foam macroscopic response required in par-allel the analysis of the damage mechanisms at the scale of glassbubbles. The microtomography technique was useful in visualizingin 3D the deformation of the structure of hollow spheres in theheart of the sample.
This paper was written in two parts: the first section details theresults of impact tests performed on syntactic foam plates. Theinfluence of conditions of dynamic loading (mass of projectileand height of fall) and the volume fraction of microspheres onthe behaviour of the syntactic foam plates was studied by usinga design of experiment. This investigation showed the effect ofthe strain rate and the foam density on the foam response underimpact. The influence of these two parameters was verified by car-rying out uniaxial compression in quasistatic conditions and athigh strain rate on foam samples of different densities. The macro-scopic response and the damage mechanic at the microscopic wereanalysed using microtomography and are presented in the secondpart of this article.
1.1. Material selection and specimen preparation
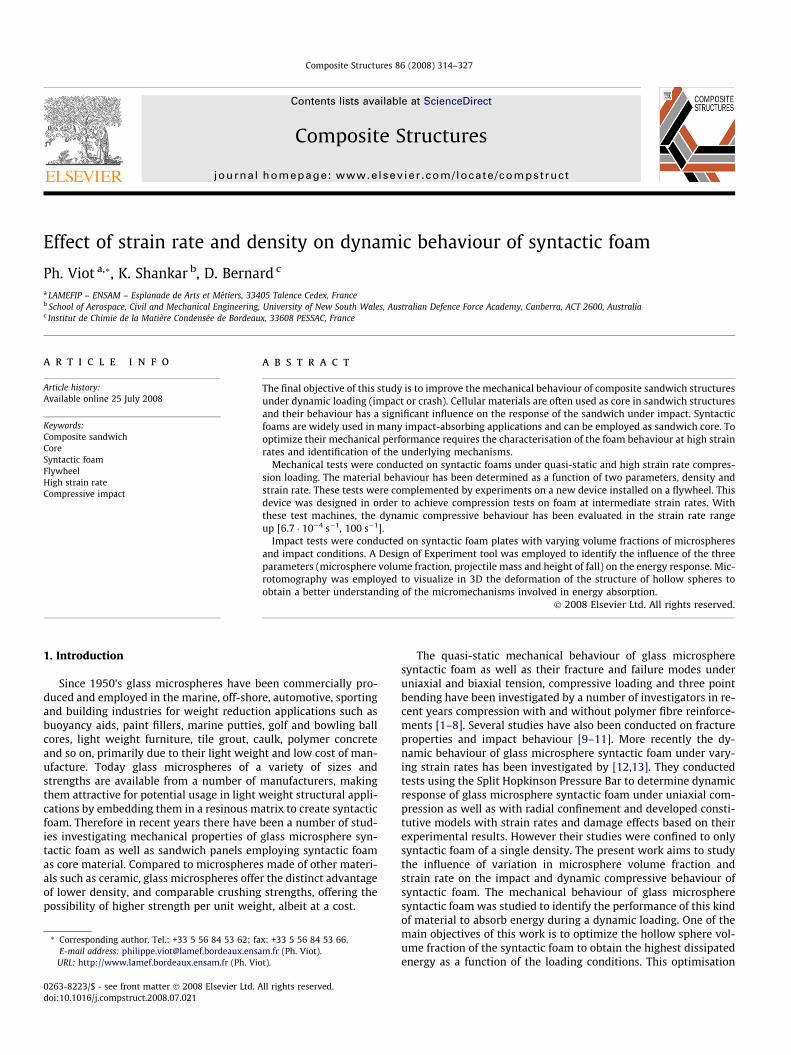
The filler used for preparation of the syntactic foams em-ployed in this study have the specification of 3MTM Glass BubblesK25 obtained from 3M Manufacturing in United States (Fig. 1a).The diameter of the microspheres ranges from 25 to 95 lm witha 50th percentile of 55 lm. The nominal crushing strength is5.2 MPa (750 psi) and average true density 0.25 g/cc. The matrixemployed was two part epoxy system consisting of West System105 resin and West System 206 slow hardener to be combined inthe ratio of 5:1 by weight and has a pot life of about 12 min at22 �C. As per the manufacturer’s specifications, the specific grav-ity of the cured resin is about 1.18 and the nominal compressiveyield strength after two weeks of cure is 78 MPa. The tensile
Fig. 1. (a) Hollow spheres, samples of H
modulus and elongation to failure is about 2.8 GPa and 3.4%respectively.
To manufacture the syntactic foam, the resin and the hardenerwere first mixed and thoroughly stirred, and then the right pro-portion by weight of Scotchlite microspheres were added gradu-ally while continuing to stir the mixture. The mixture wasstirred until a uniform consistency was obtained and then pouredinto moulds allowed to set for a minimum of 24 h. Cylindrical alu-minium moulds were used for compression specimens while flatsteel moulds with removable side runners were specially pre-pared for impact specimens. The samples were machined to theright dimensions after removal from the mould which was facili-tated by the prior application of release agent. Syntactic foamwith three different hollow sphere volume fractions (HSVF),namely 15%, 30% and 45% were prepared along with control spec-imens made of neat epoxy (Fig. 1b–d). Table 1 below shows theaverage value of the measured density for each volume fractionof syntactic foam.
2. Study of energy dissipated during impact
2.1. Drop tower
The drop tower used for this study is made up of two columnsattached to a metallic gantry (Fig. 2) [14,15]. These two columnsguide the falling hemispheric projectile impactor. A winch coupledwith an electromagnet attached to the projectile is used to lift theprojectile (of different mass from 2.5 to 4 kg) to the desired impact
SVF 15% (b), 30% (c), and 45% (d).
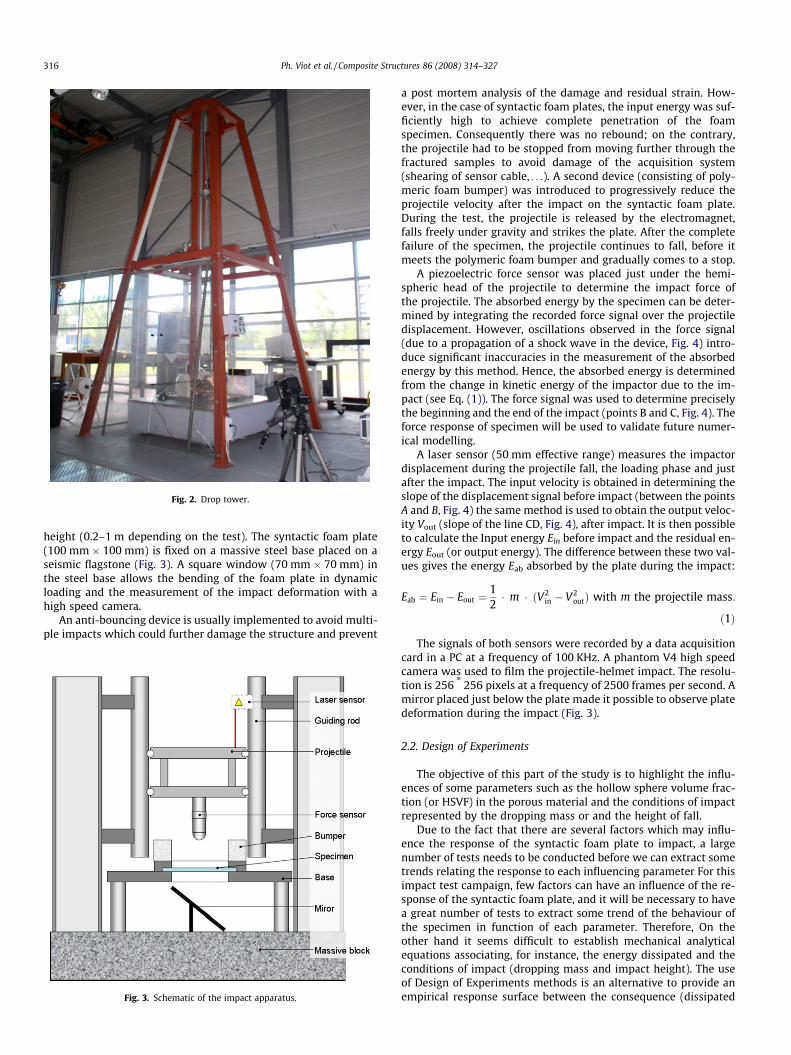
Fig. 2. Drop tower.
316 Ph. Viot et al. / Composite Structures 86 (2008) 314–327
height (0.2–1 m depending on the test). The syntactic foam plate(100 mm � 100 mm) is fixed on a massive steel base placed on aseismic flagstone (Fig. 3). A square window (70 mm � 70 mm) inthe steel base allows the bending of the foam plate in dynamicloading and the measurement of the impact deformation with ahigh speed camera.
An anti-bouncing device is usually implemented to avoid multi-ple impacts which could further damage the structure and prevent
Fig. 3. Schematic of the impact apparatus.
a post mortem analysis of the damage and residual strain. How-ever, in the case of syntactic foam plates, the input energy was suf-ficiently high to achieve complete penetration of the foamspecimen. Consequently there was no rebound; on the contrary,the projectile had to be stopped from moving further through thefractured samples to avoid damage of the acquisition system(shearing of sensor cable, . . .). A second device (consisting of poly-meric foam bumper) was introduced to progressively reduce theprojectile velocity after the impact on the syntactic foam plate.During the test, the projectile is released by the electromagnet,falls freely under gravity and strikes the plate. After the completefailure of the specimen, the projectile continues to fall, before itmeets the polymeric foam bumper and gradually comes to a stop.
A piezoelectric force sensor was placed just under the hemi-spheric head of the projectile to determine the impact force ofthe projectile. The absorbed energy by the specimen can be deter-mined by integrating the recorded force signal over the projectiledisplacement. However, oscillations observed in the force signal(due to a propagation of a shock wave in the device, Fig. 4) intro-duce significant inaccuracies in the measurement of the absorbedenergy by this method. Hence, the absorbed energy is determinedfrom the change in kinetic energy of the impactor due to the im-pact (see Eq. (1)). The force signal was used to determine preciselythe beginning and the end of the impact (points B and C, Fig. 4). Theforce response of specimen will be used to validate future numer-ical modelling.
A laser sensor (50 mm effective range) measures the impactordisplacement during the projectile fall, the loading phase and justafter the impact. The input velocity is obtained in determining theslope of the displacement signal before impact (between the pointsA and B, Fig. 4) the same method is used to obtain the output veloc-ity Vout (slope of the line CD, Fig. 4), after impact. It is then possibleto calculate the Input energy Ein before impact and the residual en-ergy Eout (or output energy). The difference between these two val-ues gives the energy Eab absorbed by the plate during the impact:
Eab ¼ Ein � Eout ¼12� m � ðV2
in � V2outÞ with m the projectile mass:
ð1Þ
The signals of both sensors were recorded by a data acquisitioncard in a PC at a frequency of 100 KHz. A phantom V4 high speedcamera was used to film the projectile-helmet impact. The resolu-tion is 256 * 256 pixels at a frequency of 2500 frames per second. Amirror placed just below the plate made it possible to observe platedeformation during the impact (Fig. 3).
2.2. Design of Experiments
The objective of this part of the study is to highlight the influ-ences of some parameters such as the hollow sphere volume frac-tion (or HSVF) in the porous material and the conditions of impactrepresented by the dropping mass or and the height of fall.
Due to the fact that there are several factors which may influ-ence the response of the syntactic foam plate to impact, a largenumber of tests needs to be conducted before we can extract sometrends relating the response to each influencing parameter For thisimpact test campaign, few factors can have an influence of the re-sponse of the syntactic foam plate, and it will be necessary to havea great number of tests to extract some trend of the behaviour ofthe specimen in function of each parameter. Therefore, On theother hand it seems difficult to establish mechanical analyticalequations associating, for instance, the energy dissipated and theconditions of impact (dropping mass and impact height). The useof Design of Experiments methods is an alternative to provide anempirical response surface between the consequence (dissipated
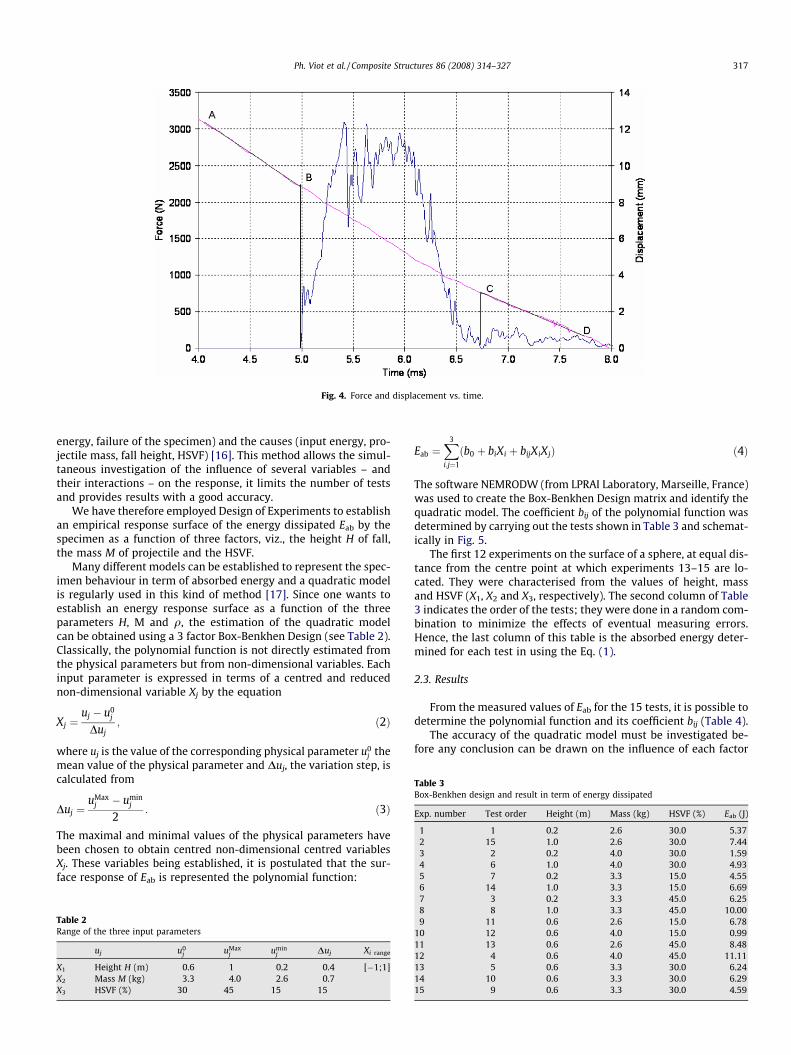
Fig. 4. Force and displacement vs. time.
Table 3Box-Benkhen design and result in term of energy dissipated
Exp. number Test order Height (m) Mass (kg) HSVF (%) Eab (J)
1 1 0.2 2.6 30.0 5.372 15 1.0 2.6 30.0 7.443 2 0.2 4.0 30.0 1.594 6 1.0 4.0 30.0 4.935 7 0.2 3.3 15.0 4.55
Ph. Viot et al. / Composite Structures 86 (2008) 314–327 317
energy, failure of the specimen) and the causes (input energy, pro-jectile mass, fall height, HSVF) [16]. This method allows the simul-taneous investigation of the influence of several variables – andtheir interactions – on the response, it limits the number of testsand provides results with a good accuracy.
We have therefore employed Design of Experiments to establishan empirical response surface of the energy dissipated Eab by thespecimen as a function of three factors, viz., the height H of fall,the mass M of projectile and the HSVF.
Many different models can be established to represent the spec-imen behaviour in term of absorbed energy and a quadratic modelis regularly used in this kind of method [17]. Since one wants toestablish an energy response surface as a function of the threeparameters H, M and q, the estimation of the quadratic modelcan be obtained using a 3 factor Box-Benkhen Design (see Table 2).Classically, the polynomial function is not directly estimated fromthe physical parameters but from non-dimensional variables. Eachinput parameter is expressed in terms of a centred and reducednon-dimensional variable Xj by the equation
Xj ¼uj � u0
j
Duj; ð2Þ
where uj is the value of the corresponding physical parameter u0j the
mean value of the physical parameter and Duj, the variation step, iscalculated from
Duj ¼uMax
j � uminj
2: ð3Þ
The maximal and minimal values of the physical parameters havebeen chosen to obtain centred non-dimensional centred variablesXj. These variables being established, it is postulated that the sur-face response of Eab is represented the polynomial function:
Table 2Range of the three input parameters
uj u0j uMax
j uminj Duj Xi range
X1 Height H (m) 0.6 1 0.2 0.4 [�1;1]X2 Mass M (kg) 3.3 4.0 2.6 0.7X3 HSVF (%) 30 45 15 15
Eab ¼X3
i;j¼1
ðb0 þ biXi þ bijXiXjÞ ð4Þ
The software NEMRODW (from LPRAI Laboratory, Marseille, France)was used to create the Box-Benkhen Design matrix and identify thequadratic model. The coefficient bij of the polynomial function wasdetermined by carrying out the tests shown in Table 3 and schemat-ically in Fig. 5.
The first 12 experiments on the surface of a sphere, at equal dis-tance from the centre point at which experiments 13–15 are lo-cated. They were characterised from the values of height, massand HSVF (X1, X2 and X3, respectively). The second column of Table3 indicates the order of the tests; they were done in a random com-bination to minimize the effects of eventual measuring errors.Hence, the last column of this table is the absorbed energy deter-mined for each test in using the Eq. (1).
2.3. Results
From the measured values of Eab for the 15 tests, it is possible todetermine the polynomial function and its coefficient bij (Table 4).
The accuracy of the quadratic model must be investigated be-fore any conclusion can be drawn on the influence of each factor
6 14 1.0 3.3 15.0 6.697 3 0.2 3.3 45.0 6.258 8 1.0 3.3 45.0 10.009 11 0.6 2.6 15.0 6.78
10 12 0.6 4.0 15.0 0.9911 13 0.6 2.6 45.0 8.4812 4 0.6 4.0 45.0 11.1113 5 0.6 3.3 30.0 6.2414 10 0.6 3.3 30.0 6.2915 9 0.6 3.3 30.0 4.59

Fig. 5. Location of the tests in the space (X1, X2, X3).
Table 4Coefficient values for the Eab response
Coefficients Value
b00 7.01b01 2.55b02 0.71b03 2.10b11 �0.51b22 �1.04b33 3.35b12 0.44b13 1.56b23 0.69
318 Ph. Viot et al. / Composite Structures 86 (2008) 314–327
on the Eab response. This preliminary study can be done by analy-sing the associated variance. Fig. 6a and b present the variance cal-culated in the centre of the domain (for H = 0.6 m, M = 3.3 kg andq = 30%). The accuracy of the model is satisfying in its central zone.
Fig. 6. Variance presented (a) in the plane X1–X2 (corresponding to hei
However, at the edge of the domain and more particularly in itscorners, the variance values show that the model is less consistent.In fact, the accuracy is better in the central zone because three testswere done in the centre of the domain whereas only one test wasdone in each corner.
The coefficients b0i and bii of the polynomial function have beendetermined. The comparison of their values reveals the influence ofeach factor on the absorbed energy. On the one hand, in comparingseparately the coefficients b0i and bii, it is shown the hollow spherevolume fraction (or X3) has a large influence on the Eab response(compared to the other factors mass and height) since the twoassociated coefficients b03 and b33 are higher. It is more delicateto estimate the preponderance of a factor between the two param-eters (mass and height); the analysis of the plotted response couldbe useful to estimate their influence. On the other hand, the coef-ficients bij (with different values for i and j) indicate the couplingbetween the three factors. The coefficient b12 is lower than thetwo others b13 and b23. In consequence the effect on the absorbedenergy of the coupling between the mass and the height is less sig-nificant in comparison the influence of the coupling mass – HSVFor height – HSVF. These remarks can be confirmed by analysingthe response surface plotted as a function of couple of factors.
The sensitivity of the energy Eab to the factors mass and heightcan be studied in Fig. 7 which is plotted for a constant HSVF valueof 30%. The influence of the mass is low for each level of height(and in consequence, for each level of input energy). On the con-trary, the effect of the height on the energy Eab is significant. Thematerial being constituted of a viscoplastic resin and glass bubbles,it seems thus the strain rate dependant behaviour of the matrix ishighlighted in this case since the increase in the fall height induceshigher strain rates. Finally, for higher input energy correspondingto maximal values of mass and height, the energy dissipatedreaches a maximum value too.
The influence of the height (or of the impact velocity) on the en-ergy Eab can be verified for each hollow sphere volume fraction. Itis shown (Fig. 8) that for each density, the higher the height, thegreater the dissipated energy. It is particularly evident for HSVFclose to 45%. The sensitivity of the energy to the density is remark-able: the energy is mostly dissipated for lower and higher volumefraction of microspheres. This first remark is also particularly evi-dent in studying the energy response in the plane HSVF/ mass(Fig. 9). Between these extreme values, the energy Eab reaches aminimal value which depends also on the height factor: the mini-mal energy Eab is reached for a glass bubble volume fraction close
ght–mass); (b) in the plane X3–X2 (corresponding to HSVF–mass).
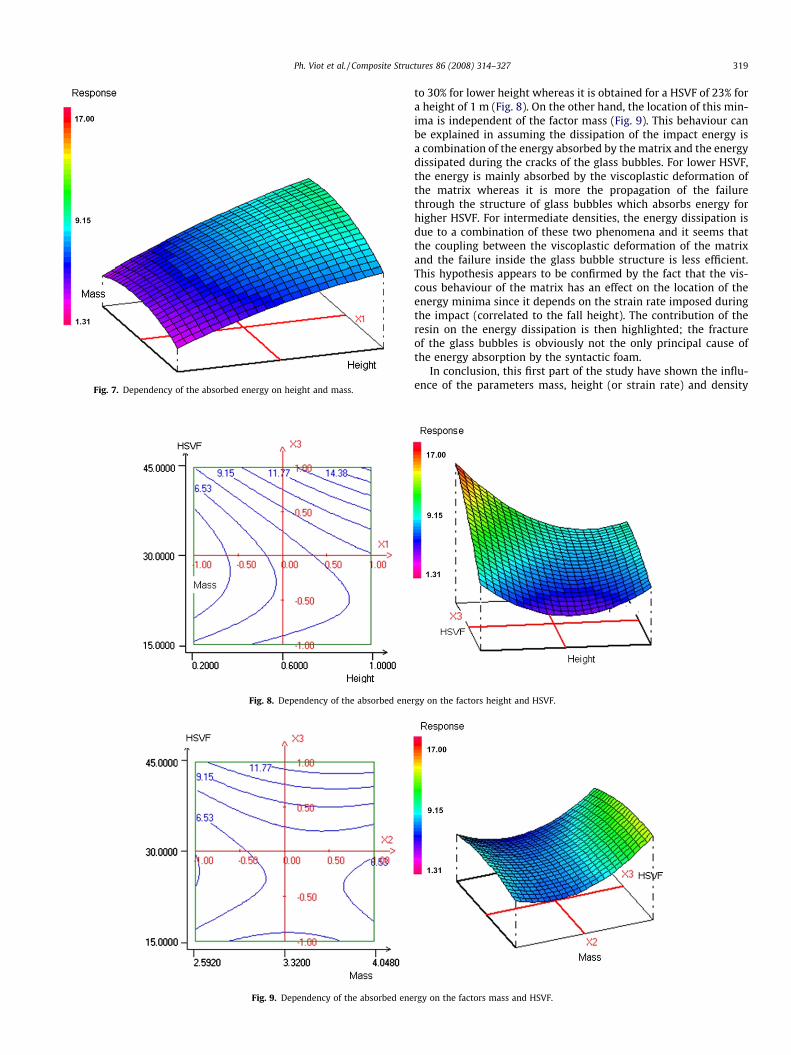
Fig. 7. Dependency of the absorbed energy on height and mass.
Fig. 8. Dependency of the absorbed ene
Fig. 9. Dependency of the absorbed ene
Ph. Viot et al. / Composite Structures 86 (2008) 314–327 319
to 30% for lower height whereas it is obtained for a HSVF of 23% fora height of 1 m (Fig. 8). On the other hand, the location of this min-ima is independent of the factor mass (Fig. 9). This behaviour canbe explained in assuming the dissipation of the impact energy isa combination of the energy absorbed by the matrix and the energydissipated during the cracks of the glass bubbles. For lower HSVF,the energy is mainly absorbed by the viscoplastic deformation ofthe matrix whereas it is more the propagation of the failurethrough the structure of glass bubbles which absorbs energy forhigher HSVF. For intermediate densities, the energy dissipation isdue to a combination of these two phenomena and it seems thatthe coupling between the viscoplastic deformation of the matrixand the failure inside the glass bubble structure is less efficient.This hypothesis appears to be confirmed by the fact that the vis-cous behaviour of the matrix has an effect on the location of theenergy minima since it depends on the strain rate imposed duringthe impact (correlated to the fall height). The contribution of theresin on the energy dissipation is then highlighted; the fractureof the glass bubbles is obviously not the only principal cause ofthe energy absorption by the syntactic foam.
In conclusion, this first part of the study have shown the influ-ence of the parameters mass, height (or strain rate) and density
rgy on the factors height and HSVF.
rgy on the factors mass and HSVF.
320 Ph. Viot et al. / Composite Structures 86 (2008) 314–327
on the energy dissipation of a plate under impact. The hollowsphere volume fraction and the fall height (or strain rate) havesignificant influence on the response of the plate (in terms of ab-sorbed energy). The influence of the mass factor is not significant.An analysis of the response surface has also shown the dissipa-tion of the impact energy is a coupling between the viscoplasticdeformation of the matrix and the failure propagation of theglass bubble structure. The glass bubble failure is mainly signifi-cant for higher HSVF whereas the energy absorption is mainlygoverned by resin deformation for low volume fraction ofmicrospheres.
These preliminary results confirm that the behaviour of syntac-tic foam structures under dynamic loading depends on the densityof the constitutive material and the strain rate imposed during theloading. The second part of this study tends to confirm the influ-ence of these two factors (density and strain rate) on the materialbehaviour at macroscopic scale and also at the scale of the glassbubble structure. Compression tests were carried out on differentmachines to determine the macroscopic behaviour and the tech-nique of microtomography has been developed to study the micro-structure of the syntactic foam before and after loading.
Fig. 10. Quasi-static uniaxial compre
Fig. 11. Quasi-static uniaxial compr
3. Behaviour study
3.1. Quasi static behaviour
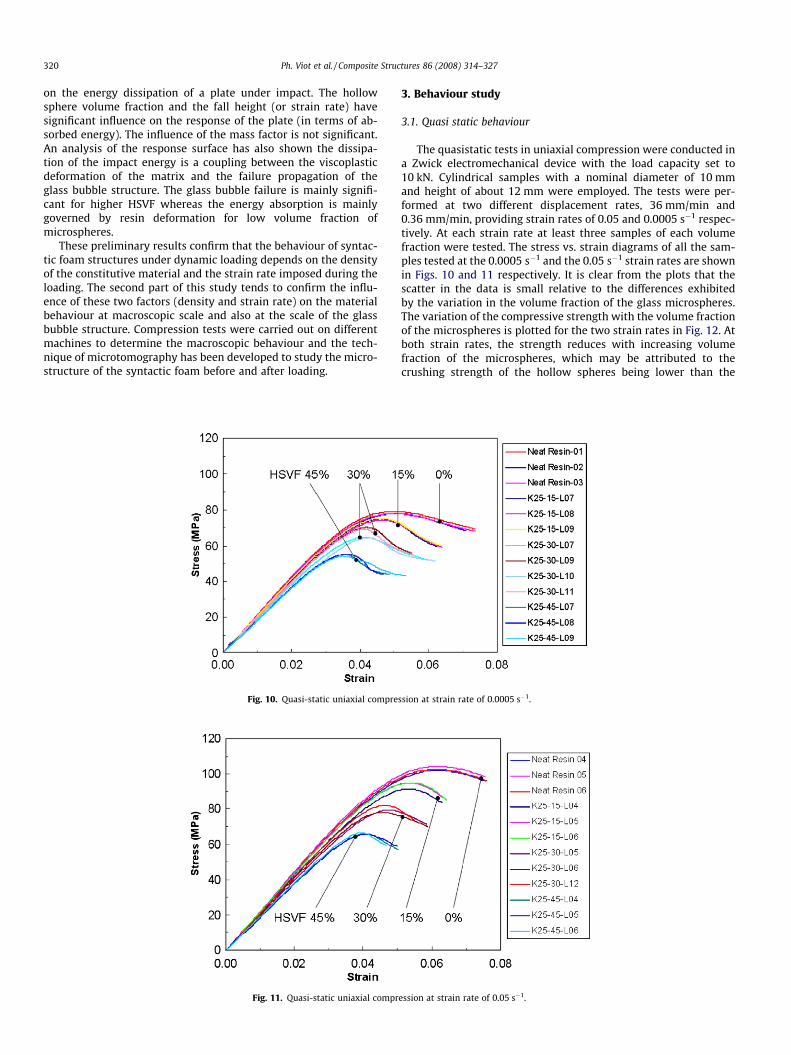
The quasistatic tests in uniaxial compression were conducted ina Zwick electromechanical device with the load capacity set to10 kN. Cylindrical samples with a nominal diameter of 10 mmand height of about 12 mm were employed. The tests were per-formed at two different displacement rates, 36 mm/min and0.36 mm/min, providing strain rates of 0.05 and 0.0005 s�1 respec-tively. At each strain rate at least three samples of each volumefraction were tested. The stress vs. strain diagrams of all the sam-ples tested at the 0.0005 s�1 and the 0.05 s�1 strain rates are shownin Figs. 10 and 11 respectively. It is clear from the plots that thescatter in the data is small relative to the differences exhibitedby the variation in the volume fraction of the glass microspheres.The variation of the compressive strength with the volume fractionof the microspheres is plotted for the two strain rates in Fig. 12. Atboth strain rates, the strength reduces with increasing volumefraction of the microspheres, which may be attributed to thecrushing strength of the hollow spheres being lower than the
ssion at strain rate of 0.0005 s�1.
ession at strain rate of 0.05 s�1.
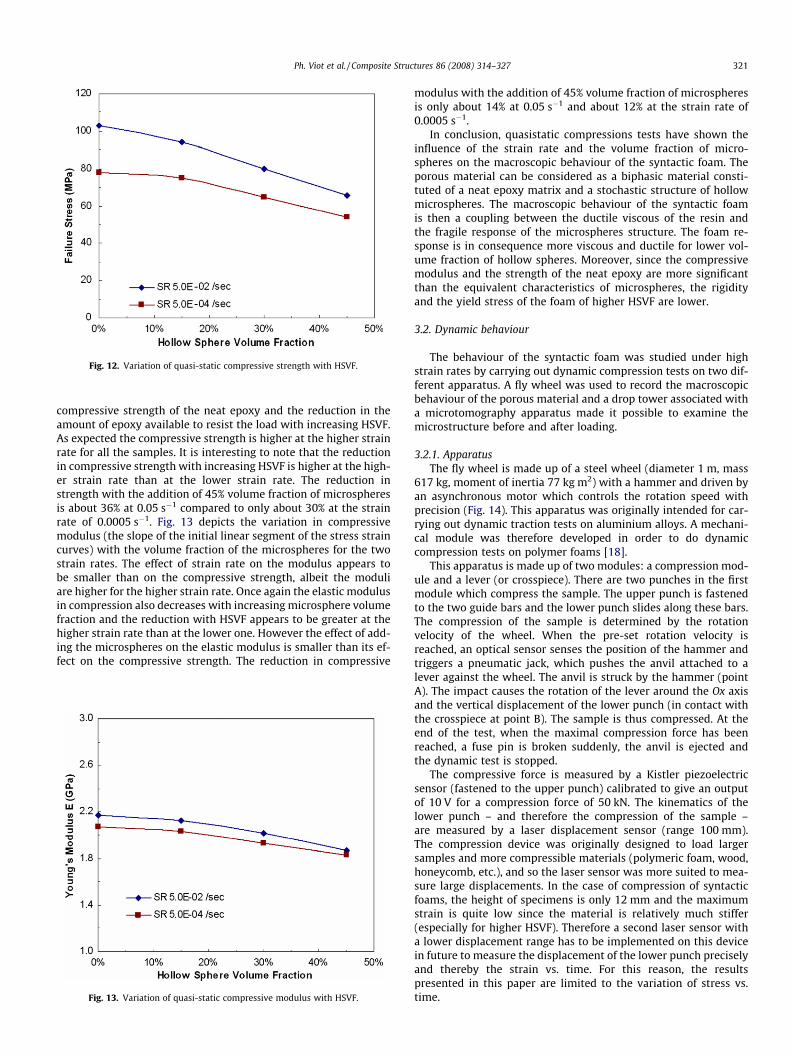
Fig. 12. Variation of quasi-static compressive strength with HSVF.
Ph. Viot et al. / Composite Structures 86 (2008) 314–327 321
compressive strength of the neat epoxy and the reduction in theamount of epoxy available to resist the load with increasing HSVF.As expected the compressive strength is higher at the higher strainrate for all the samples. It is interesting to note that the reductionin compressive strength with increasing HSVF is higher at the high-er strain rate than at the lower strain rate. The reduction instrength with the addition of 45% volume fraction of microspheresis about 36% at 0.05 s�1 compared to only about 30% at the strainrate of 0.0005 s�1. Fig. 13 depicts the variation in compressivemodulus (the slope of the initial linear segment of the stress straincurves) with the volume fraction of the microspheres for the twostrain rates. The effect of strain rate on the modulus appears tobe smaller than on the compressive strength, albeit the moduliare higher for the higher strain rate. Once again the elastic modulusin compression also decreases with increasing microsphere volumefraction and the reduction with HSVF appears to be greater at thehigher strain rate than at the lower one. However the effect of add-ing the microspheres on the elastic modulus is smaller than its ef-fect on the compressive strength. The reduction in compressive
Fig. 13. Variation of quasi-static compressive modulus with HSVF.
modulus with the addition of 45% volume fraction of microspheresis only about 14% at 0.05 s�1 and about 12% at the strain rate of0.0005 s�1.
In conclusion, quasistatic compressions tests have shown theinfluence of the strain rate and the volume fraction of micro-spheres on the macroscopic behaviour of the syntactic foam. Theporous material can be considered as a biphasic material consti-tuted of a neat epoxy matrix and a stochastic structure of hollowmicrospheres. The macroscopic behaviour of the syntactic foamis then a coupling between the ductile viscous of the resin andthe fragile response of the microspheres structure. The foam re-sponse is in consequence more viscous and ductile for lower vol-ume fraction of hollow spheres. Moreover, since the compressivemodulus and the strength of the neat epoxy are more significantthan the equivalent characteristics of microspheres, the rigidityand the yield stress of the foam of higher HSVF are lower.
3.2. Dynamic behaviour
The behaviour of the syntactic foam was studied under highstrain rates by carrying out dynamic compression tests on two dif-ferent apparatus. A fly wheel was used to record the macroscopicbehaviour of the porous material and a drop tower associated witha microtomography apparatus made it possible to examine themicrostructure before and after loading.
3.2.1. ApparatusThe fly wheel is made up of a steel wheel (diameter 1 m, mass
617 kg, moment of inertia 77 kg m2) with a hammer and driven byan asynchronous motor which controls the rotation speed withprecision (Fig. 14). This apparatus was originally intended for car-rying out dynamic traction tests on aluminium alloys. A mechani-cal module was therefore developed in order to do dynamiccompression tests on polymer foams [18].
This apparatus is made up of two modules: a compression mod-ule and a lever (or crosspiece). There are two punches in the firstmodule which compress the sample. The upper punch is fastenedto the two guide bars and the lower punch slides along these bars.The compression of the sample is determined by the rotationvelocity of the wheel. When the pre-set rotation velocity isreached, an optical sensor senses the position of the hammer andtriggers a pneumatic jack, which pushes the anvil attached to alever against the wheel. The anvil is struck by the hammer (pointA). The impact causes the rotation of the lever around the Ox axisand the vertical displacement of the lower punch (in contact withthe crosspiece at point B). The sample is thus compressed. At theend of the test, when the maximal compression force has beenreached, a fuse pin is broken suddenly, the anvil is ejected andthe dynamic test is stopped.
The compressive force is measured by a Kistler piezoelectricsensor (fastened to the upper punch) calibrated to give an outputof 10 V for a compression force of 50 kN. The kinematics of thelower punch – and therefore the compression of the sample –are measured by a laser displacement sensor (range 100 mm).The compression device was originally designed to load largersamples and more compressible materials (polymeric foam, wood,honeycomb, etc.), and so the laser sensor was more suited to mea-sure large displacements. In the case of compression of syntacticfoams, the height of specimens is only 12 mm and the maximumstrain is quite low since the material is relatively much stiffer(especially for higher HSVF). Therefore a second laser sensor witha lower displacement range has to be implemented on this devicein future to measure the displacement of the lower punch preciselyand thereby the strain vs. time. For this reason, the resultspresented in this paper are limited to the variation of stress vs.time.
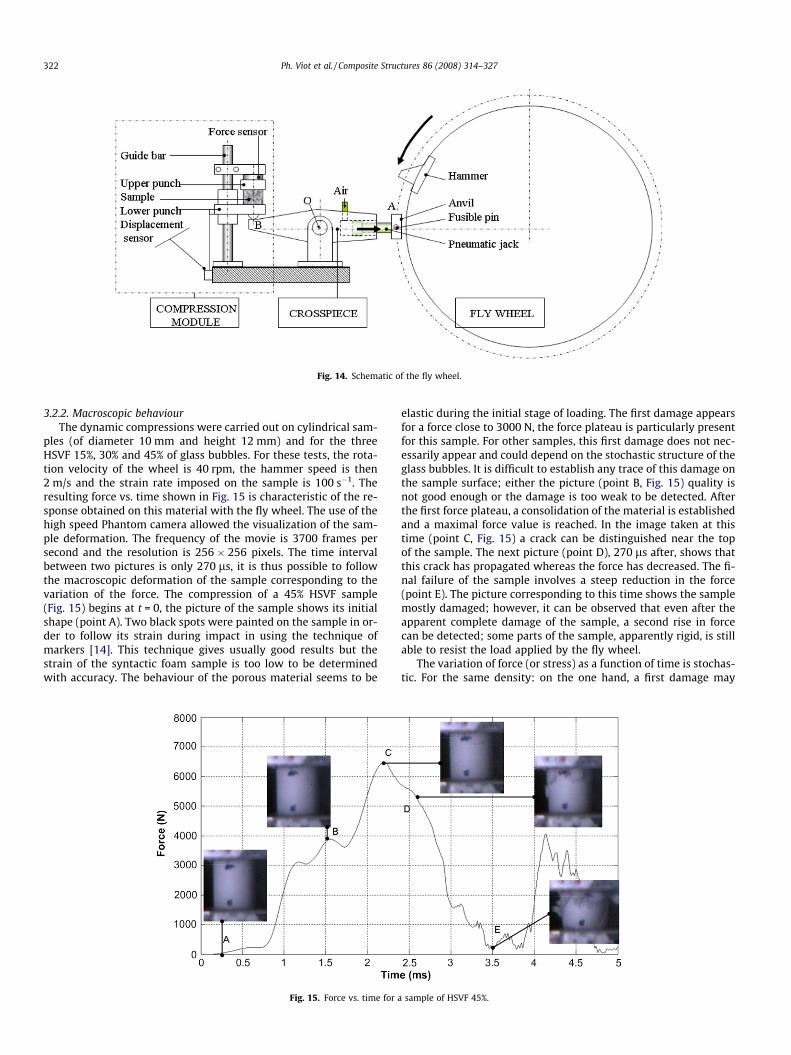
Fig. 14. Schematic of the fly wheel.
322 Ph. Viot et al. / Composite Structures 86 (2008) 314–327
3.2.2. Macroscopic behaviourThe dynamic compressions were carried out on cylindrical sam-
ples (of diameter 10 mm and height 12 mm) and for the threeHSVF 15%, 30% and 45% of glass bubbles. For these tests, the rota-tion velocity of the wheel is 40 rpm, the hammer speed is then2 m/s and the strain rate imposed on the sample is 100 s�1. Theresulting force vs. time shown in Fig. 15 is characteristic of the re-sponse obtained on this material with the fly wheel. The use of thehigh speed Phantom camera allowed the visualization of the sam-ple deformation. The frequency of the movie is 3700 frames persecond and the resolution is 256 � 256 pixels. The time intervalbetween two pictures is only 270 ls, it is thus possible to followthe macroscopic deformation of the sample corresponding to thevariation of the force. The compression of a 45% HSVF sample(Fig. 15) begins at t = 0, the picture of the sample shows its initialshape (point A). Two black spots were painted on the sample in or-der to follow its strain during impact in using the technique ofmarkers [14]. This technique gives usually good results but thestrain of the syntactic foam sample is too low to be determinedwith accuracy. The behaviour of the porous material seems to be
Fig. 15. Force vs. time for a
elastic during the initial stage of loading. The first damage appearsfor a force close to 3000 N, the force plateau is particularly presentfor this sample. For other samples, this first damage does not nec-essarily appear and could depend on the stochastic structure of theglass bubbles. It is difficult to establish any trace of this damage onthe sample surface; either the picture (point B, Fig. 15) quality isnot good enough or the damage is too weak to be detected. Afterthe first force plateau, a consolidation of the material is establishedand a maximal force value is reached. In the image taken at thistime (point C, Fig. 15) a crack can be distinguished near the topof the sample. The next picture (point D), 270 ls after, shows thatthis crack has propagated whereas the force has decreased. The fi-nal failure of the sample involves a steep reduction in the force(point E). The picture corresponding to this time shows the samplemostly damaged; however, it can be observed that even after theapparent complete damage of the sample, a second rise in forcecan be detected; some parts of the sample, apparently rigid, is stillable to resist the load applied by the fly wheel.
The variation of force (or stress) as a function of time is stochas-tic. For the same density: on the one hand, a first damage may
sample of HSVF 45%.
Ph. Viot et al. / Composite Structures 86 (2008) 314–327 323
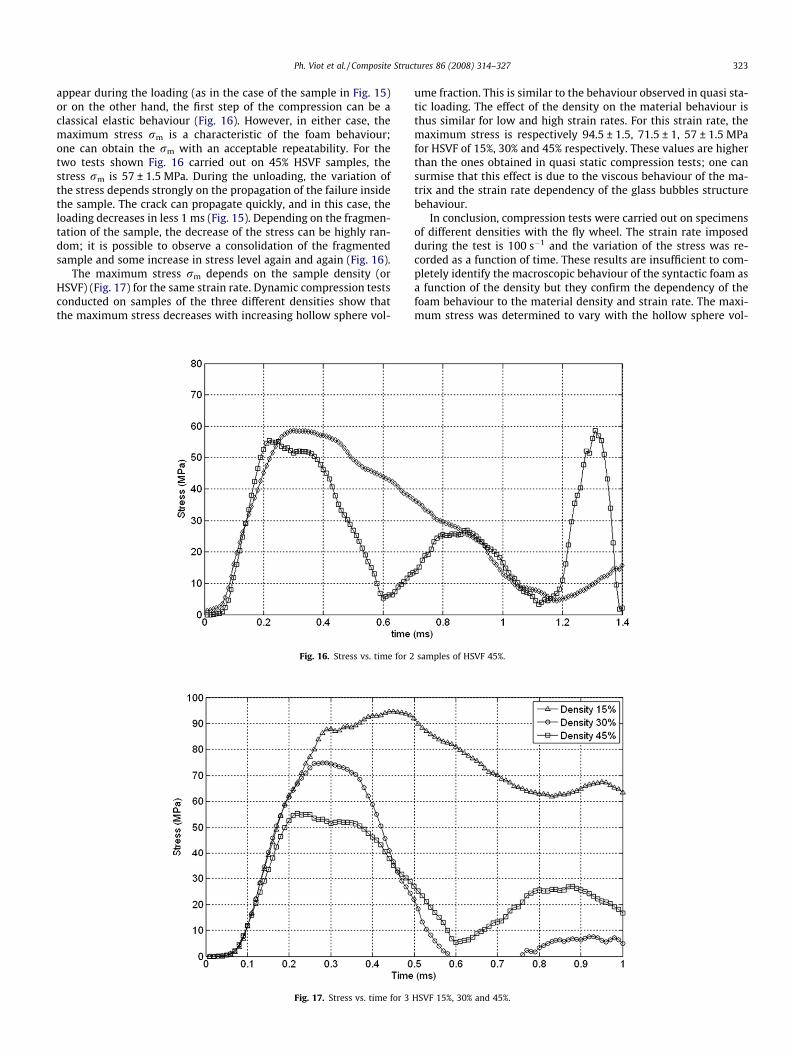
appear during the loading (as in the case of the sample in Fig. 15)or on the other hand, the first step of the compression can be aclassical elastic behaviour (Fig. 16). However, in either case, themaximum stress rm is a characteristic of the foam behaviour;one can obtain the rm with an acceptable repeatability. For thetwo tests shown Fig. 16 carried out on 45% HSVF samples, thestress rm is 57 ± 1.5 MPa. During the unloading, the variation ofthe stress depends strongly on the propagation of the failure insidethe sample. The crack can propagate quickly, and in this case, theloading decreases in less 1 ms (Fig. 15). Depending on the fragmen-tation of the sample, the decrease of the stress can be highly ran-dom; it is possible to observe a consolidation of the fragmentedsample and some increase in stress level again and again (Fig. 16).
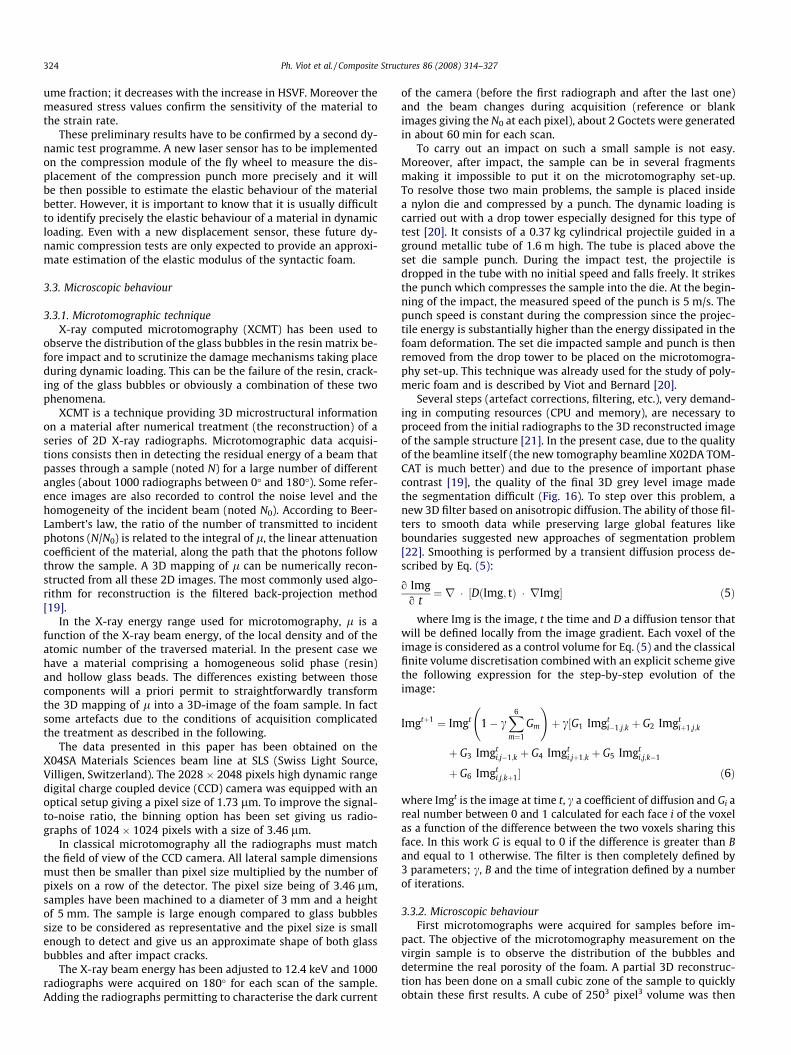
The maximum stress rm depends on the sample density (orHSVF) (Fig. 17) for the same strain rate. Dynamic compression testsconducted on samples of the three different densities show thatthe maximum stress decreases with increasing hollow sphere vol-
Fig. 16. Stress vs. time for 2
Fig. 17. Stress vs. time for 3
ume fraction. This is similar to the behaviour observed in quasi sta-tic loading. The effect of the density on the material behaviour isthus similar for low and high strain rates. For this strain rate, themaximum stress is respectively 94.5 ± 1.5, 71.5 ± 1, 57 ± 1.5 MPafor HSVF of 15%, 30% and 45% respectively. These values are higherthan the ones obtained in quasi static compression tests; one cansurmise that this effect is due to the viscous behaviour of the ma-trix and the strain rate dependency of the glass bubbles structurebehaviour.
In conclusion, compression tests were carried out on specimensof different densities with the fly wheel. The strain rate imposedduring the test is 100 s�1 and the variation of the stress was re-corded as a function of time. These results are insufficient to com-pletely identify the macroscopic behaviour of the syntactic foam asa function of the density but they confirm the dependency of thefoam behaviour to the material density and strain rate. The maxi-mum stress was determined to vary with the hollow sphere vol-
samples of HSVF 45%.
HSVF 15%, 30% and 45%.
324 Ph. Viot et al. / Composite Structures 86 (2008) 314–327
ume fraction; it decreases with the increase in HSVF. Moreover themeasured stress values confirm the sensitivity of the material tothe strain rate.
These preliminary results have to be confirmed by a second dy-namic test programme. A new laser sensor has to be implementedon the compression module of the fly wheel to measure the dis-placement of the compression punch more precisely and it willbe then possible to estimate the elastic behaviour of the materialbetter. However, it is important to know that it is usually difficultto identify precisely the elastic behaviour of a material in dynamicloading. Even with a new displacement sensor, these future dy-namic compression tests are only expected to provide an approxi-mate estimation of the elastic modulus of the syntactic foam.
3.3. Microscopic behaviour
3.3.1. Microtomographic techniqueX-ray computed microtomography (XCMT) has been used to
observe the distribution of the glass bubbles in the resin matrix be-fore impact and to scrutinize the damage mechanisms taking placeduring dynamic loading. This can be the failure of the resin, crack-ing of the glass bubbles or obviously a combination of these twophenomena.
XCMT is a technique providing 3D microstructural informationon a material after numerical treatment (the reconstruction) of aseries of 2D X-ray radiographs. Microtomographic data acquisi-tions consists then in detecting the residual energy of a beam thatpasses through a sample (noted N) for a large number of differentangles (about 1000 radiographs between 0� and 180�). Some refer-ence images are also recorded to control the noise level and thehomogeneity of the incident beam (noted N0). According to Beer-Lambert’s law, the ratio of the number of transmitted to incidentphotons (N/N0) is related to the integral of l, the linear attenuationcoefficient of the material, along the path that the photons followthrow the sample. A 3D mapping of l can be numerically recon-structed from all these 2D images. The most commonly used algo-rithm for reconstruction is the filtered back-projection method[19].
In the X-ray energy range used for microtomography, l is afunction of the X-ray beam energy, of the local density and of theatomic number of the traversed material. In the present case wehave a material comprising a homogeneous solid phase (resin)and hollow glass beads. The differences existing between thosecomponents will a priori permit to straightforwardly transformthe 3D mapping of l into a 3D-image of the foam sample. In factsome artefacts due to the conditions of acquisition complicatedthe treatment as described in the following.
The data presented in this paper has been obtained on theX04SA Materials Sciences beam line at SLS (Swiss Light Source,Villigen, Switzerland). The 2028 � 2048 pixels high dynamic rangedigital charge coupled device (CCD) camera was equipped with anoptical setup giving a pixel size of 1.73 lm. To improve the signal-to-noise ratio, the binning option has been set giving us radio-graphs of 1024 � 1024 pixels with a size of 3.46 lm.
In classical microtomography all the radiographs must matchthe field of view of the CCD camera. All lateral sample dimensionsmust then be smaller than pixel size multiplied by the number ofpixels on a row of the detector. The pixel size being of 3.46 lm,samples have been machined to a diameter of 3 mm and a heightof 5 mm. The sample is large enough compared to glass bubblessize to be considered as representative and the pixel size is smallenough to detect and give us an approximate shape of both glassbubbles and after impact cracks.
The X-ray beam energy has been adjusted to 12.4 keV and 1000radiographs were acquired on 180� for each scan of the sample.Adding the radiographs permitting to characterise the dark current
of the camera (before the first radiograph and after the last one)and the beam changes during acquisition (reference or blankimages giving the N0 at each pixel), about 2 Goctets were generatedin about 60 min for each scan.
To carry out an impact on such a small sample is not easy.Moreover, after impact, the sample can be in several fragmentsmaking it impossible to put it on the microtomography set-up.To resolve those two main problems, the sample is placed insidea nylon die and compressed by a punch. The dynamic loading iscarried out with a drop tower especially designed for this type oftest [20]. It consists of a 0.37 kg cylindrical projectile guided in aground metallic tube of 1.6 m high. The tube is placed above theset die sample punch. During the impact test, the projectile isdropped in the tube with no initial speed and falls freely. It strikesthe punch which compresses the sample into the die. At the begin-ning of the impact, the measured speed of the punch is 5 m/s. Thepunch speed is constant during the compression since the projec-tile energy is substantially higher than the energy dissipated in thefoam deformation. The set die impacted sample and punch is thenremoved from the drop tower to be placed on the microtomogra-phy set-up. This technique was already used for the study of poly-meric foam and is described by Viot and Bernard [20].
Several steps (artefact corrections, filtering, etc.), very demand-ing in computing resources (CPU and memory), are necessary toproceed from the initial radiographs to the 3D reconstructed imageof the sample structure [21]. In the present case, due to the qualityof the beamline itself (the new tomography beamline X02DA TOM-CAT is much better) and due to the presence of important phasecontrast [19], the quality of the final 3D grey level image madethe segmentation difficult (Fig. 16). To step over this problem, anew 3D filter based on anisotropic diffusion. The ability of those fil-ters to smooth data while preserving large global features likeboundaries suggested new approaches of segmentation problem[22]. Smoothing is performed by a transient diffusion process de-scribed by Eq. (5):
o Imgo t
¼ r � ½DðImg; tÞ � rImg� ð5Þ
where Img is the image, t the time and D a diffusion tensor thatwill be defined locally from the image gradient. Each voxel of theimage is considered as a control volume for Eq. (5) and the classicalfinite volume discretisation combined with an explicit scheme givethe following expression for the step-by-step evolution of theimage:
Imgtþ1 ¼ Imgt 1� cX6
m¼1
Gm
!þ c½G1 Imgt
i�1;j;k þ G2 Imgtiþ1;j;k
þ G3 Imgti;j�1;k þ G4 Imgt
i;jþ1;k þ G5 Imgti;j;k�1
þ G6 Imgti;j;kþ1� ð6Þ
where Imgt is the image at time t, c a coefficient of diffusion and Gi areal number between 0 and 1 calculated for each face i of the voxelas a function of the difference between the two voxels sharing thisface. In this work G is equal to 0 if the difference is greater than Band equal to 1 otherwise. The filter is then completely defined by3 parameters; c, B and the time of integration defined by a numberof iterations.
3.3.2. Microscopic behaviourFirst microtomographs were acquired for samples before im-
pact. The objective of the microtomography measurement on thevirgin sample is to observe the distribution of the bubbles anddetermine the real porosity of the foam. A partial 3D reconstruc-tion has been done on a small cubic zone of the sample to quicklyobtain these first results. A cube of 2503 pixel3 volume was then
Ph. Viot et al. / Composite Structures 86 (2008) 314–327 325
chosen in order to visualize, for the first time, the bubble distribu-tion and the deformation mechanisms.
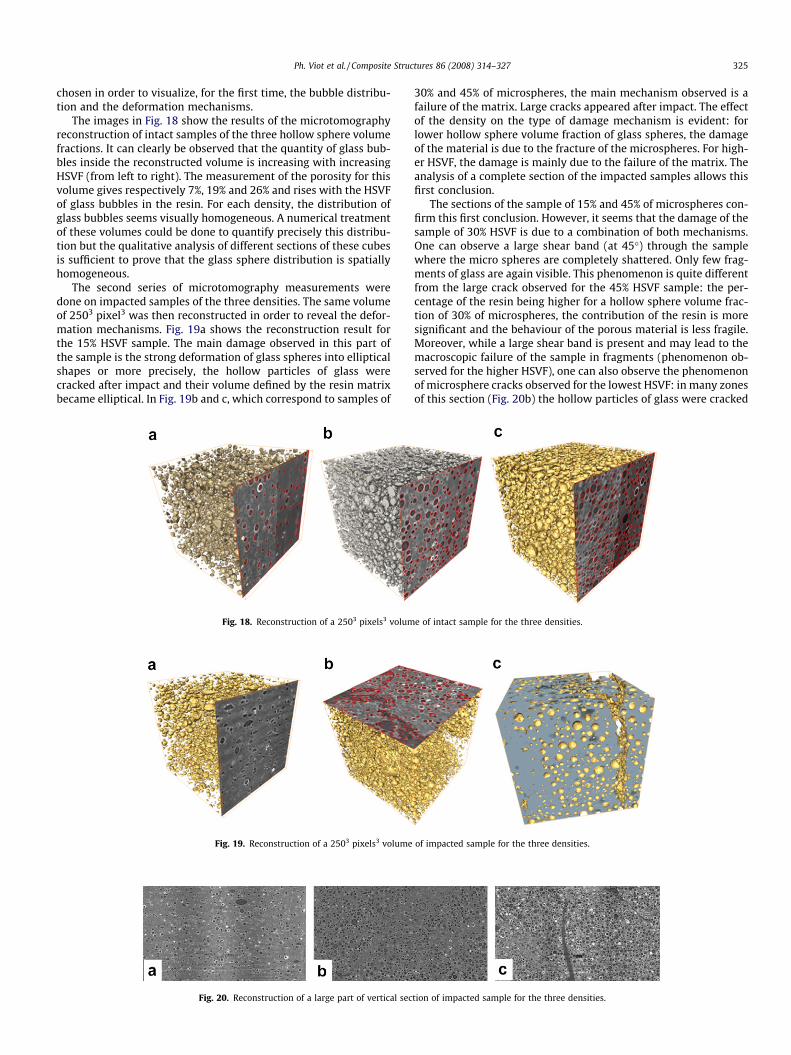
The images in Fig. 18 show the results of the microtomographyreconstruction of intact samples of the three hollow sphere volumefractions. It can clearly be observed that the quantity of glass bub-bles inside the reconstructed volume is increasing with increasingHSVF (from left to right). The measurement of the porosity for thisvolume gives respectively 7%, 19% and 26% and rises with the HSVFof glass bubbles in the resin. For each density, the distribution ofglass bubbles seems visually homogeneous. A numerical treatmentof these volumes could be done to quantify precisely this distribu-tion but the qualitative analysis of different sections of these cubesis sufficient to prove that the glass sphere distribution is spatiallyhomogeneous.
The second series of microtomography measurements weredone on impacted samples of the three densities. The same volumeof 2503 pixel3 was then reconstructed in order to reveal the defor-mation mechanisms. Fig. 19a shows the reconstruction result forthe 15% HSVF sample. The main damage observed in this part ofthe sample is the strong deformation of glass spheres into ellipticalshapes or more precisely, the hollow particles of glass werecracked after impact and their volume defined by the resin matrixbecame elliptical. In Fig. 19b and c, which correspond to samples of
Fig. 18. Reconstruction of a 2503 pixels3 volum
Fig. 19. Reconstruction of a 2503 pixels3 volume
Fig. 20. Reconstruction of a large part of vertical sec
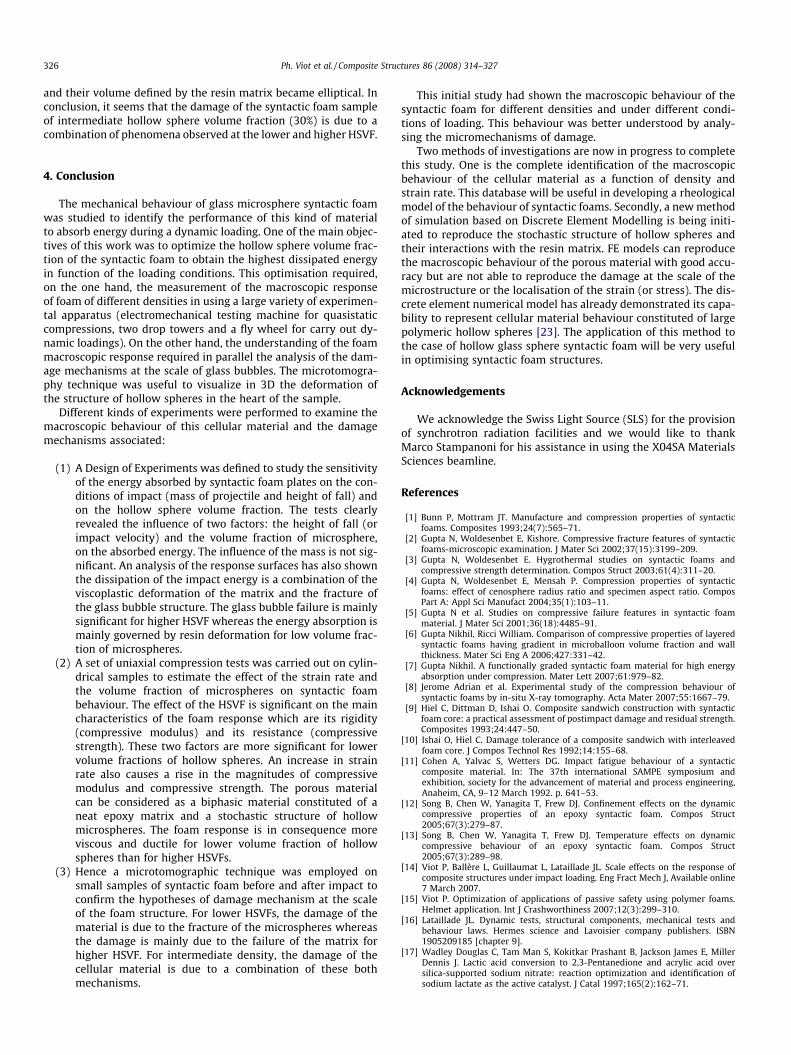
30% and 45% of microspheres, the main mechanism observed is afailure of the matrix. Large cracks appeared after impact. The effectof the density on the type of damage mechanism is evident: forlower hollow sphere volume fraction of glass spheres, the damageof the material is due to the fracture of the microspheres. For high-er HSVF, the damage is mainly due to the failure of the matrix. Theanalysis of a complete section of the impacted samples allows thisfirst conclusion.
The sections of the sample of 15% and 45% of microspheres con-firm this first conclusion. However, it seems that the damage of thesample of 30% HSVF is due to a combination of both mechanisms.One can observe a large shear band (at 45�) through the samplewhere the micro spheres are completely shattered. Only few frag-ments of glass are again visible. This phenomenon is quite differentfrom the large crack observed for the 45% HSVF sample: the per-centage of the resin being higher for a hollow sphere volume frac-tion of 30% of microspheres, the contribution of the resin is moresignificant and the behaviour of the porous material is less fragile.Moreover, while a large shear band is present and may lead to themacroscopic failure of the sample in fragments (phenomenon ob-served for the higher HSVF), one can also observe the phenomenonof microsphere cracks observed for the lowest HSVF: in many zonesof this section (Fig. 20b) the hollow particles of glass were cracked
e of intact sample for the three densities.
of impacted sample for the three densities.
tion of impacted sample for the three densities.
326 Ph. Viot et al. / Composite Structures 86 (2008) 314–327
and their volume defined by the resin matrix became elliptical. Inconclusion, it seems that the damage of the syntactic foam sampleof intermediate hollow sphere volume fraction (30%) is due to acombination of phenomena observed at the lower and higher HSVF.
4. Conclusion
The mechanical behaviour of glass microsphere syntactic foamwas studied to identify the performance of this kind of materialto absorb energy during a dynamic loading. One of the main objec-tives of this work was to optimize the hollow sphere volume frac-tion of the syntactic foam to obtain the highest dissipated energyin function of the loading conditions. This optimisation required,on the one hand, the measurement of the macroscopic responseof foam of different densities in using a large variety of experimen-tal apparatus (electromechanical testing machine for quasistaticcompressions, two drop towers and a fly wheel for carry out dy-namic loadings). On the other hand, the understanding of the foammacroscopic response required in parallel the analysis of the dam-age mechanisms at the scale of glass bubbles. The microtomogra-phy technique was useful to visualize in 3D the deformation ofthe structure of hollow spheres in the heart of the sample.
Different kinds of experiments were performed to examine themacroscopic behaviour of this cellular material and the damagemechanisms associated:
(1) A Design of Experiments was defined to study the sensitivityof the energy absorbed by syntactic foam plates on the con-ditions of impact (mass of projectile and height of fall) andon the hollow sphere volume fraction. The tests clearlyrevealed the influence of two factors: the height of fall (orimpact velocity) and the volume fraction of microsphere,on the absorbed energy. The influence of the mass is not sig-nificant. An analysis of the response surfaces has also shownthe dissipation of the impact energy is a combination of theviscoplastic deformation of the matrix and the fracture ofthe glass bubble structure. The glass bubble failure is mainlysignificant for higher HSVF whereas the energy absorption ismainly governed by resin deformation for low volume frac-tion of microspheres.
(2) A set of uniaxial compression tests was carried out on cylin-drical samples to estimate the effect of the strain rate andthe volume fraction of microspheres on syntactic foambehaviour. The effect of the HSVF is significant on the maincharacteristics of the foam response which are its rigidity(compressive modulus) and its resistance (compressivestrength). These two factors are more significant for lowervolume fractions of hollow spheres. An increase in strainrate also causes a rise in the magnitudes of compressivemodulus and compressive strength. The porous materialcan be considered as a biphasic material constituted of aneat epoxy matrix and a stochastic structure of hollowmicrospheres. The foam response is in consequence moreviscous and ductile for lower volume fraction of hollowspheres than for higher HSVFs.
(3) Hence a microtomographic technique was employed onsmall samples of syntactic foam before and after impact toconfirm the hypotheses of damage mechanism at the scaleof the foam structure. For lower HSVFs, the damage of thematerial is due to the fracture of the microspheres whereasthe damage is mainly due to the failure of the matrix forhigher HSVF. For intermediate density, the damage of thecellular material is due to a combination of these bothmechanisms.
This initial study had shown the macroscopic behaviour of thesyntactic foam for different densities and under different condi-tions of loading. This behaviour was better understood by analy-sing the micromechanisms of damage.
Two methods of investigations are now in progress to completethis study. One is the complete identification of the macroscopicbehaviour of the cellular material as a function of density andstrain rate. This database will be useful in developing a rheologicalmodel of the behaviour of syntactic foams. Secondly, a new methodof simulation based on Discrete Element Modelling is being initi-ated to reproduce the stochastic structure of hollow spheres andtheir interactions with the resin matrix. FE models can reproducethe macroscopic behaviour of the porous material with good accu-racy but are not able to reproduce the damage at the scale of themicrostructure or the localisation of the strain (or stress). The dis-crete element numerical model has already demonstrated its capa-bility to represent cellular material behaviour constituted of largepolymeric hollow spheres [23]. The application of this method tothe case of hollow glass sphere syntactic foam will be very usefulin optimising syntactic foam structures.
Acknowledgements
We acknowledge the Swiss Light Source (SLS) for the provisionof synchrotron radiation facilities and we would like to thankMarco Stampanoni for his assistance in using the X04SA MaterialsSciences beamline.
References
[1] Bunn P, Mottram JT. Manufacture and compression properties of syntacticfoams. Composites 1993;24(7):565–71.
[2] Gupta N, Woldesenbet E, Kishore. Compressive fracture features of syntacticfoams-microscopic examination. J Mater Sci 2002;37(15):3199–209.
[3] Gupta N, Woldesenbet E. Hygrothermal studies on syntactic foams andcompressive strength determination. Compos Struct 2003;61(4):311–20.
[4] Gupta N, Woldesenbet E, Mensah P. Compression properties of syntacticfoams: effect of cenosphere radius ratio and specimen aspect ratio. ComposPart A: Appl Sci Manufact 2004;35(1):103–11.
[5] Gupta N et al. Studies on compressive failure features in syntactic foammaterial. J Mater Sci 2001;36(18):4485–91.
[6] Gupta Nikhil, Ricci William. Comparison of compressive properties of layeredsyntactic foams having gradient in microballoon volume fraction and wallthickness. Mater Sci Eng A 2006;427:331–42.
[7] Gupta Nikhil. A functionally graded syntactic foam material for high energyabsorption under compression. Mater Lett 2007;61:979–82.
[8] Jerome Adrian et al. Experimental study of the compression behaviour ofsyntactic foams by in-situ X-ray tomography. Acta Mater 2007;55:1667–79.
[9] Hiel C, Dittman D, Ishai O. Composite sandwich construction with syntacticfoam core: a practical assessment of postimpact damage and residual strength.Composites 1993;24:447–50.
[10] Ishai O, Hiel C. Damage tolerance of a composite sandwich with interleavedfoam core. J Compos Technol Res 1992;14:155–68.
[11] Cohen A, Yalvac S, Wetters DG. Impact fatigue behaviour of a syntacticcomposite material. In: The 37th international SAMPE symposium andexhibition, society for the advancement of material and process engineering,Anaheim, CA, 9–12 March 1992. p. 641–53.
[12] Song B, Chen W, Yanagita T, Frew DJ. Confinement effects on the dynamiccompressive properties of an epoxy syntactic foam. Compos Struct2005;67(3):279–87.
[13] Song B, Chen W, Yanagita T, Frew DJ. Temperature effects on dynamiccompressive behaviour of an epoxy syntactic foam. Compos Struct2005;67(3):289–98.
[14] Viot P, Ballère L, Guillaumat L, Lataillade JL. Scale effects on the response ofcomposite structures under impact loading. Eng Fract Mech J, Available online7 March 2007.
[15] Viot P. Optimization of applications of passive safety using polymer foams.Helmet application. Int J Crashworthiness 2007;12(3):299–310.
[16] Lataillade JL. Dynamic tests, structural components, mechanical tests andbehaviour laws. Hermes science and Lavoisier company publishers. ISBN1905209185 [chapter 9].
[17] Wadley Douglas C, Tam Man S, Kokitkar Prashant B, Jackson James E, MillerDennis J. Lactic acid conversion to 2,3-Pentanedione and acrylic acid oversilica-supported sodium nitrate: reaction optimization and identification ofsodium lactate as the active catalyst. J Catal 1997;165(2):162–71.

Ph. Viot et al. / Composite Structures 86 (2008) 314–327 327
[18] Viot P, Beani F, Lataillade JL. Polymeric foam behaviour under dynamiccompressive loading. J Mater Sci 2005;40(22):5829–37. doi:10.1007/s10853-005-4998-5.
[19] Baruchel J, Buffière JY, Maire E, Merle P, Peix G. X-ray tomography in materialscience. Paris: Hermès Sciences Pub.; 2000.
[20] Viot P, Bernard D, Plougonven E. Polymeric foam deformation under dynamicloading by the use of the microtomographic technique. J Mater Sci 2007.doi:10.1007/s10853-006-1422-8 (online 2007).
[21] Bernard D. 3D quantification of pore scale geometrical changes usingsynchrotron computed micro tomography. Oil Gas Sci Technol2005;60(5):747–62.
[22] Weickert J. Anisotropic diffusion in image processing. Stuttgart: Teubner-Verlag; 1998.
[23] Viot P, Iordanoff I, Bernard D. Multi-scale description of polymeric foambehaviour: a new approach by discrete element modelling. Polym Sci Serie A2008;50(6):679.