effect of soil matric potential based …€¦ · international journal of food, agriculture and...
TRANSCRIPT
International Journal of Food, Agriculture and Veterinary Sciences ISSN: 2277-209X (Online)
An Open Access, Online International Journal Available at http://www.cibtech.org/jfav.htm
2014 Vol. 4 (3) September-December, pp. 120-132/Ahuja and Khurana
Research Article
© Copyright 2014 | Centre for Info Bio Technology (CIBTech) 120
EFFECT OF SOIL MATRIC POTENTIAL BASED IRRIGATION
SCHEDULING ON WATER USE EFFICIENCY OF POTATO
*Sanjeev Ahuja and Khurana D.S.
Department of Vegetable Science, Punjab Agricultural University, Ludhiana 141004, India
*Author for Correspondence
ABSTRACT A field investigation was conducted with the objective to determine effect of soil matric potential based
irrigation scheduling on water use efficiency under furrow-ridge irrigation system in sandy loam soil
during 2011-12 and 2012-13. Three levels of soil matric suction (S); 20, 35 & 50 kPa at three installation
depths (D) of tensiometer i.e. 20, 30 & 40 cm and a control (traditional practice) were replicated thrice in
RCBD. Among all the treatments, highest dry tuber yield was recorded in S35D20 treatment during both
the years. This treatment showed significantly higher marketable tuber yield which was statistically at par
with S20D20 treatment which had produced highest tuber yield during both the years. Treatment S35D20
treatment registered more than double WUE and WUEi (averaged over two years) as compared to that of
control treatment along saving of 49 % irrigation water. Thus, treatment S35D20 was adjudged the best
treatment for irrigation scheduling in the region.
Keywords: Furrow-ridge Irrigation System, Soil Water Tension, Marketable Tuber Yield, Tuber Dry
Weight, Water Use Efficiency
INTRODUCTION India is the second largest producer of potatoes after China in the world with 45 million tonnes of potato
production, which is 12 % of potatoes produced in the world (Anonymous, 2013a). India has taken a
massive stride by doubling its potato production in the last two decades.
Potato seems to be most frequently irrigated among the major winter season crops as furrow irrigation is
the most prevalent method of irrigation to potato and the ground water/ canal water is easily available for
irrigation purpose under Indo-Gangetic plains. Potato crop requires 7-8 light irrigations under ridge-
furrow planting method under North-Western plains of India (Anonymous, 2013b). Earlier studies in the
region have shown that water is the most important regulating factor for potato production and precise
irrigation scheduling had increased the yield in addition to the increased water use efficiency (Kumar et
al., 2007; Kumar et al., 2009; Singh et al., 2012). This crop prefers adequate moisture in the root zone
owing to its shallow root system as well as for the maintenance of low soil strength, which are conducive
for the development and enlargement of tuber.
The ground water resources are being depleted at fast rate in the North-Western plains of India due to
excessive utilization for irrigation purpose. The water scarcities have been forecasted in agriculture and
non agriculture sectors with changing climate (Hira, 2009). Moreover, there is increased demand of water
for organic and non organic agriculture sector, thereby making it necessary to conduct more research on
irrigation schedule on crops.
Tensiometer is a commonly used instrument to determine the soil moisture status by measuring soil
matric potential. It symbolizes the force necessary for plant roots to extract water from the soil. Numerous
studies using tensiometers to measure SMP and for scheduling irrigation to potato have been reported
(Shae et al., 1999; Kang et al., 2004; Wang et al., 2007; Wang et al., 2011). Medici et al., (2014)
suggested that irrigated plants should be grown between 10 and 20 kPa SWT and at the maturity stage; a
higher SWT (20–35 kPa) might be advisable to improve fruit quality and WUE without the risk of
reducing yield.
The previous investigations in the region have mostly used weather based irrigation scheduling, for
evaluating soil water availability for the plants (Panigrahi et al., 2001; Kumar et al., 2009; Singh et al.,
2010; Singh et al., 2012; Tyagi et al., 2012; Singh and Sood, 2013; Verma et al., 2013). Our efforts were
International Journal of Food, Agriculture and Veterinary Sciences ISSN: 2277-209X (Online)
An Open Access, Online International Journal Available at http://www.cibtech.org/jfav.htm
2014 Vol. 4 (3) September-December, pp. 120-132/Ahuja and Khurana
Research Article
© Copyright 2014 | Centre for Info Bio Technology (CIBTech) 121
to study the SMP based irrigation scheduling in the region. Thus, it was decided to conduct
comprehensive investigation based on SWT for precise irrigation scheduling to the potato crop under
furrow-ridge irrigation method. The study was undertaken with an objective to determine the effect of soil
matric potential based irrigation scheduling on water use efficiency and tuber yield.
MATERIALS AND METHODS
Site, Climate and Soil The investigation was undertaken on a typic Ustipsamment soil at Vegetable Research Farm, Department
of Vegetable Science, Punjab Agricultural University, Ludhiana (Punjab), for two potato growing seasons
(October to January) in 2011-12 and 2012-13. The climate of Ludhiana is subtropical, semi-arid with an
annual rainfall of 755 mm. Major part of the annual rainfall is concentrated between June to September
months and only 50 to 55 mm rainfall occur during the potato growing season (October-January). Soil
type was sandy loam with composition of 69 % sand, 19% silt and 12% clay. Some physico-chemical
characteristics observed from 15 cm thick soil before the planting of potato were: pH 7.7, electrical
conductivity: 0.16 dS m−1
, organic C 3.3 g kg−1
, 0.5 M NaHCO3 extractable P (Olsen et al., 1954) 5.75
mg kg−1
and K (Pratt, 1965) 160 mg kg−1
in the year 2011, and pH: 7.9, EC: 0.24 dS m−1
, OC: 3.5 g kg−1
,
extractable P: 8 mg kg−1
and K: 172.5 mg kg−1
during the year 2012. So, it was a low fertility soil. The
groundwater table was approximately 50 m below the soil surface.
Table 1: Physical characteristics of soil before planting potato in the year 2011 and 2012
Soil depth
(cm)
Bulk density
(g cm-3
)
Saturated
conductivity
(cm hr-1
)
Unsaturated conductivity (cm hr-1
) Infiltration
rate (cm hr-
1) Suction I (2cm) Suction II (4cm)
Year 2011 2012 2011 2012 2011 2012 2011 2012 2011 2012
0-15 1.40 1.37 305.0 310.0 103.0 104.0 33.5 33.0 6.93 7.03
15-30 1.55 1.51 136.0 140.0 27.0 28.0 11.0 10.0
30-45 1.60 1.65 143.0 144.0 15.5 14.0 14.0 13.0
45-60 1.64 1.72 113.0 115.0 25.0 23.0 24.0 22.5
Experimental Design and Crop Management
Area planned for experiment was pre-irrigated before planting tubers except the control plots. Potato was
planted on 18th October and 16
th October respectively, during 2011 and 2012. The experiments were
conducted in randomized complete block design (RCBD) which was replicated thrice. Plots were
measuring 10.0 m × 5.2 m (gross plot size) comprising seven ridges each followed by a furrow, spaced at
60 cm distance during both the years. Pre-sprouted seed tubers with a mean weight of approximately 45 g
were planted 0.2 m apart, on ridges separated from each other by 0.6 m (equivalent to a maintaining a
plant density of 8.33 plants m-2
). Two metre wide border was kept between two adjacent plots as well
from irrigation channel to prevent unwanted water seepage. Disease free tubers of an early bulking
cultivar, Kufri Pukhraj comprised the plant material. Treatments consisted: S20D20, S35D20, S50D20, S20D30,
S35D30, S50D30, S20D40, S35D40, S50D40 and a control (traditional/farmers practice), where ‘S’ is
suction/tension level of tensiometers installed in the soil at ‘D’ depth. Monitoring of dial vacuum gauge
tensiometers was started regularly for SMP reading after the complete emergence of the crop which were
installed between two plants and in the centre of the ridge in the middle potato row of each plot. Irrigation
was applied only when the soil water tension (SWT) reached its targeted value. Standard crop
management practices were followed commonly for each treatment as per the PAU package practices for
cultivation. Whole phosphorus at the rate of 135 kg ha-1
of Di-ammonium phosphate (18-46-0 NPK),
potassium at the rate of 103 kg ha-1
of Potassium chloride (0-0-60 NPK) and 50% nitrogen at the rate of
208 kg ha-1
of Urea fertilizer (46-0-0 NPK) was applied at planting. Remaining 50% Urea fertilizer (46-
0-0 NPK) was top dressed 25 days after planting followed by earthing up (operation of putting up soil
International Journal of Food, Agriculture and Veterinary Sciences ISSN: 2277-209X (Online)
An Open Access, Online International Journal Available at http://www.cibtech.org/jfav.htm
2014 Vol. 4 (3) September-December, pp. 120-132/Ahuja and Khurana
Research Article
© Copyright 2014 | Centre for Info Bio Technology (CIBTech) 122
around the ridge for broadening its base, three to four weeks after planting) of plants. Potato vines were
dehaulmed 90 days after planting and tubers were lifted 15 days after dehaulming.
Irrigation Treatments
Pre-plant irrigation measuring 5 cm was given to all plots except control plot. All plots received 5 cm of
common irrigation after planting, except control plots which received 11 cm irrigation to facilitate the
rooting and establishment of the crop for its complete emergence. After this common irrigation, rest
irrigation scheduling was done on the basis of soil matric suction as per the treatment requirement.
However, the control treatment received first irrigation 10 days after complete emergence and remaining
irrigations at an interval of 12 days (Table 2). An extra irrigation was given to control plots in both years
during the days when there were chances of frost occurrence. Thus seven irrigations were applied to
control plots during both the years. Only rainfall exceeding 5 mm within 25 hr was considered effective
and included in the calculations for total water use.
Soil matric potential was measured through 18 dial vacuum gauge tensiometers installed one each in a
plot in two replications. The average value of targeted SWT was used to schedule irrigation. The
observations of targeted SWT value were started on November, 4 in 2011, and November, 11 in 2012.
Tensiometers were examined for its proper functioning before installing in the field. One tensiometer per
treatment was installed in two replications in the mid of the two plants in the centre of fourth ridge to
avoid edge effects. The soil matric potential readings were observed daily between 8.00 a.m. and 9.30
a.m. to minimize the effect of temperature on the tensiometer reading and irrigation was applied thereafter
as per the need. Irrigations in many treatments were delayed when it rained, creating differences between
treatments in the total water application in the year, 2012.
Data Collection
Random samples of 100 g tubers were oven-dried at 65°C until constant weight was attained and further
weighed to determine tuber dry weight at harvest. At the time of tuber harvest, 50 plants from each plot
were harvested by selecting middle three rows of potatoes during both the years; the tubers were picked
manually as marketable tuber yield
The appraisals for dry tuber yield (kg ha-1
) were done by multiplying tuber dry weight per 100g with
marketable tuber yield. WUE (Kg m-3
) was calculated as the ratio of dry tuber yield (kg ha-1
) to the
amount of water (m3
ha-1
) applied to the crop (supplemental irrigation plus rainfall) during the potato
growing season as per the method suggested by Xie et al., (2012). The WUE calculated by this method
gives an indication of water productivity. While, WUEi (kg ha-1
mm-1
) was calculated as the ratio of
marketable tuber yield to the water applied through irrigation.
WUE = 𝑇𝑢𝑏𝑒𝑟 𝑑𝑟𝑦 𝑦𝑖𝑒𝑙𝑑
𝑇𝑜𝑡𝑎𝑙 𝑤𝑎𝑡𝑒𝑟 𝑎𝑝𝑝𝑙𝑖𝑒𝑑 where, total water applied = supplemental irrigation plus rainfall.
WUEi = 𝑀𝑎𝑟𝑘𝑒𝑡𝑎𝑏𝑙𝑒 𝑡𝑢𝑏𝑒𝑟 𝑦𝑖𝑒𝑙𝑑
𝐼𝑟𝑟𝑖𝑔𝑎𝑡𝑖𝑜𝑛 𝑤𝑎𝑡𝑒𝑟 𝑎𝑝𝑝𝑙𝑖𝑒𝑑
Meteorological Data
Meteorological data were recorded at meteorological station situated about 500 metre distance from the
experimental site. Weekly average temperature, relative humidity, sunshine and total rainfall and
evaporation were recorded during the potato growing period from 14th October to 27
th January for the year
2011-12 and 2012-13 (Figure 1 & Figure 2).
International Journal of Food, Agriculture and Veterinary Sciences ISSN: 2277-209X (Online)
An Open Access, Online International Journal Available at http://www.cibtech.org/jfav.htm
2014 Vol. 4 (3) September-December, pp. 120-132/Ahuja and Khurana
Research Article
© Copyright 2014 | Centre for Info Bio Technology (CIBTech) 123
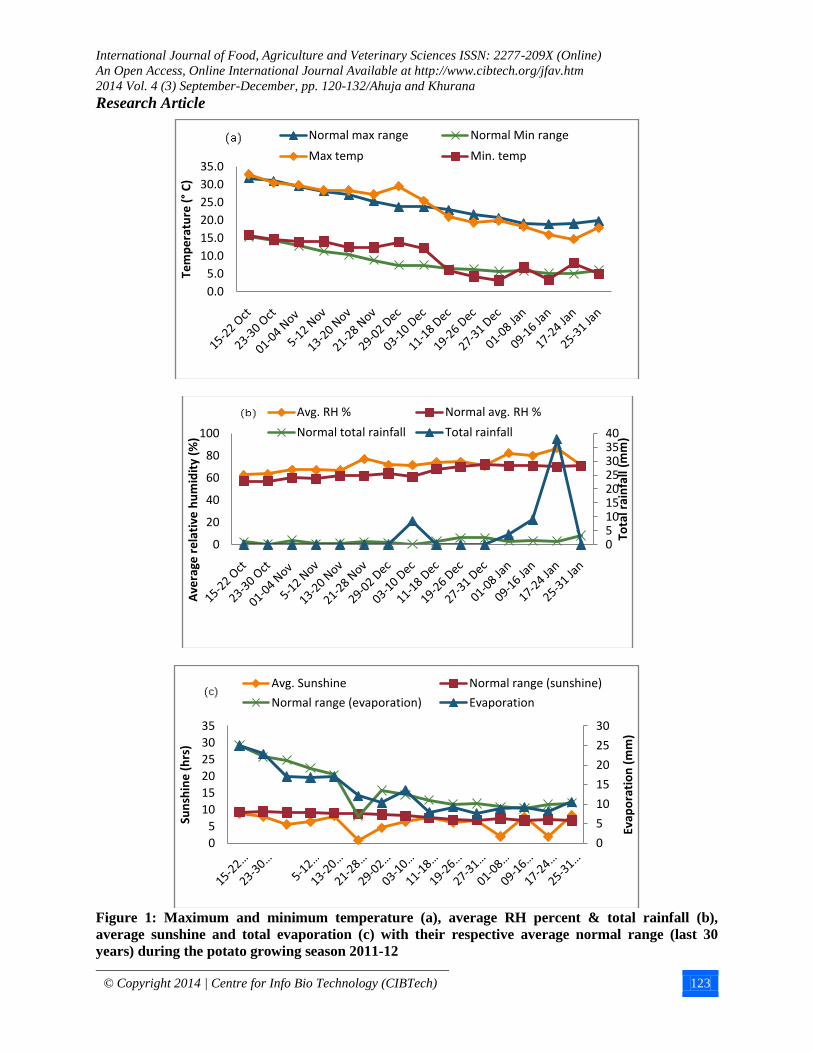
Figure 1: Maximum and minimum temperature (a), average RH percent & total rainfall (b),
average sunshine and total evaporation (c) with their respective average normal range (last 30
years) during the potato growing season 2011-12
0.0
5.0
10.0
15.0
20.0
25.0
30.0
35.0
Tem
pe
ratu
re (°
C)
Normal max range Normal Min range
Max temp Min. temp
0510152025303540
0
20
40
60
80
100
Tota
l rai
nfa
ll (m
m)
Ave
rage
re
lati
ve h
um
idit
y (%
)
Avg. RH % Normal avg. RH %
Normal total rainfall Total rainfall
0
5
10
15
20
25
30
0
5
10
15
20
25
30
35
Evap
ora
tio
n (
mm
)
Sun
shin
e (
hrs
)
Avg. Sunshine Normal range (sunshine)
Normal range (evaporation) Evaporation
International Journal of Food, Agriculture and Veterinary Sciences ISSN: 2277-209X (Online)
An Open Access, Online International Journal Available at http://www.cibtech.org/jfav.htm
2014 Vol. 4 (3) September-December, pp. 120-132/Ahuja and Khurana
Research Article
© Copyright 2014 | Centre for Info Bio Technology (CIBTech) 124
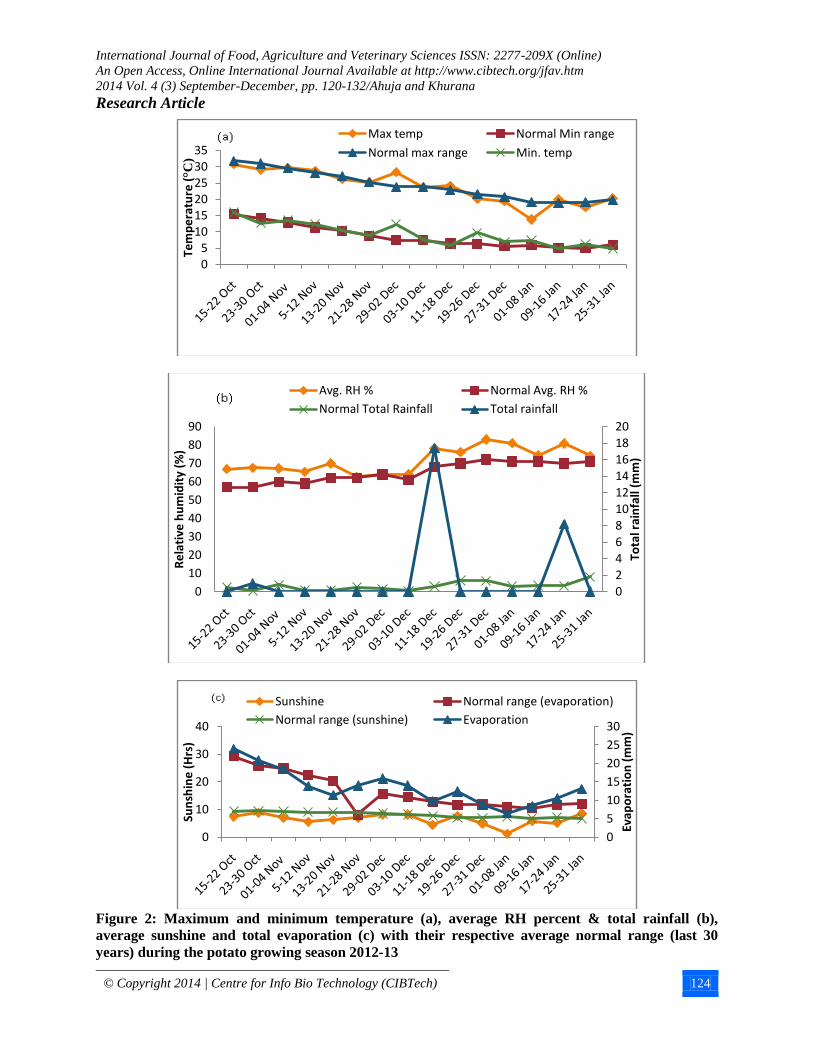
Figure 2: Maximum and minimum temperature (a), average RH percent & total rainfall (b),
average sunshine and total evaporation (c) with their respective average normal range (last 30
years) during the potato growing season 2012-13
05
101520253035
Tem
pe
ratu
re (°C
)
Max temp Normal Min range
Normal max range Min. temp
02468101214161820
0
10
20
30
40
50
60
70
80
90
Tota
l rai
nfa
ll (m
m)
Re
lati
ve h
um
idit
y (%
)
Avg. RH % Normal Avg. RH %
Normal Total Rainfall Total rainfall
0
5
10
15
20
25
30
0
10
20
30
40
Evap
ora
tio
n (
mm
)
Sun
shin
e (
Hrs
)
Sunshine Normal range (evaporation)
Normal range (sunshine) Evaporation
B
International Journal of Food, Agriculture and Veterinary Sciences ISSN: 2277-209X (Online)
An Open Access, Online International Journal Available at http://www.cibtech.org/jfav.htm
2014 Vol. 4 (3) September-December, pp. 120-132/Ahuja and Khurana
Research Article
© Copyright 2014 | Centre for Info Bio Technology (CIBTech) 125
Data Analysis Two years data were subjected to analysis of variance (ANOVA) (Gomez and Gomez, 2010) based on
PROC GLM (SAS software 9.1). Pooled analysis of data for two years was also conducted. Duncan’s
multiple range tests at p=0.05 was applied to compare the means of different treatments.
Temperature, Rainfall and Evaporation 2011-12: As illustrated in Figure 1 [(a) to (c)], the average
weekly air temperature was higher than that of normal (average of the last 30 years) from 4th November to
9th December but it was lower for rest of the growing period during 2011-12. Average relative humidity
remained higher during most of the potato growing season. Total rainfall was not uniformly distributed
during the period but it was higher during IInd
and IIIrd
week of January. There were three events of
effective rainfall (above 5mm) which summed up to 55.4 mm. The major portion of rain (38 mm)
occurred in the IIIrd
week of January (January, 15) which was not of much use to the growth and
development because potato plants were in late maturity stage as dehaulming was done on 16th of
January. Thus, rainfall of 17.4 mm was considered as effective precipitation for further calculations
purpose. Average sunshine remained considerably lower as compared to normal data. Total evaporation
remained lower compared to normal data during the period under consideration.
2012-13: During the 2012-13 potato growing period [Figure 2: (a) to (c)], the average temperature did not
vary significantly except during 1st and 2
nd week of January when it was comparatively lower than the
normal data. Total rainfall was not uniformly distributed and was lower than the normal range. There
were two events of effective rainfall measuring 17.4 mm and 8.2 mm of water in the IIIrd week of
December and IIIrd week of January. But the second event of rainfall occurred after dehaulming of potato
vines. Thus, only 17.4 mm of rainfall was considered for further calculation purpose. Average humidity
and average sunshine hrs followed the trend of previous year although the sunshine hours showed less
divergence from normal as compared to previous year. The average sunshine hours were comparatively
higher than the previous year. Total evaporation remained lower compared to normal except a few
incidences when it was higher than the normal.
RESULTS AND DISCUSSION
Irrigation Water Application and Soil Water Tension Dynamics
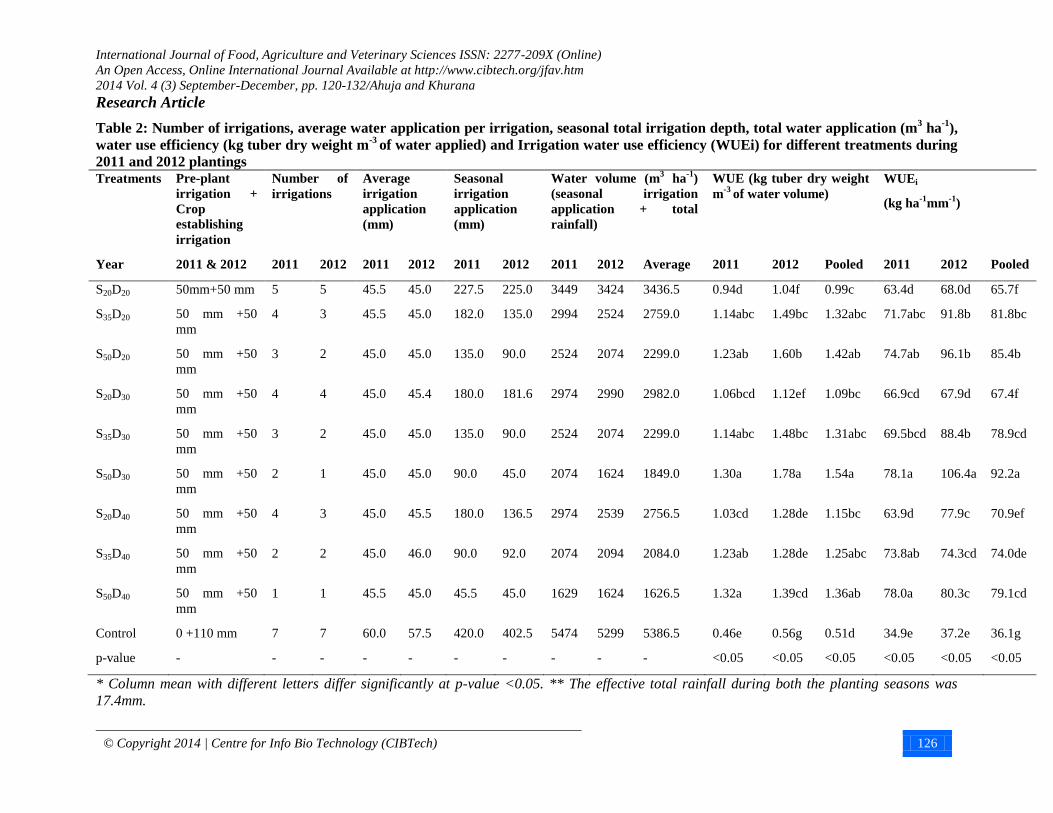
The number and amount of irrigation for different treatments during the potato growing seasons are
shown in Table 2. The depth of water for each irrigation event of treatments was constantly changing
during the growing season from 45 to 46 mm, the corresponding change was from 57.5 to 60 mm for
control. The targeted values of tensiometer recording were started at uniform moisture storage in all the
treatments (data not shown). The irrigation amount received after complete crop emergence by different
treatments varied as shown in the table 2. One major event of effective rainfall during the active growth
of crop (December, 2012) disturbed the targeted potentials on the corresponding days, thus less irrigation
water was supplied to S35D20, S50D20, S35D30, S50D30, and S20D40 treatments during 2012. The treatment
S50D40 received least amount of water during both the years due to lower SMP. Our results are consistent
with the findings of Wang et al., (2011), they also reported application of lower amount of irrigation
water at lower SMP. The control had received highest amount of irrigation water and experienced poor
soil aeration, which may ultimately have affected overall plant performance.
Water Use Efficiency (WUE) and Irrigation Water Use Efficiency (WUEi)
There was an increase in WUE ca. 186% and 183% in S50D40 and S50D30, respectively increased, with a
corresponding water saving of 70% and 62 % than that of control during the year 2011 (Table 2). During
the year 2012, S50D30 increased WUE by 218%, with a water saving of 69% which was followed by
S50D20 showing 186% increase in WUE along with and 61% water saving. The check treatment (control)
recorded lowest WUE due to highest amount of water volume consumed by control i.e. 5474 and 5299 m3
ha-1
during first and second year. The WUE in S35D20 was upto177% higher than control when data was
pooled over two years. The analysis of pooled data revealed that WUE followed the order of S50D30 >
S50D20 > S50D40> S35D20> S35D30> S35D40>S20D40 >S20D30> S20D20 > control.
International Journal of Food, Agriculture and Veterinary Sciences ISSN: 2277-209X (Online)
An Open Access, Online International Journal Available at http://www.cibtech.org/jfav.htm
2014 Vol. 4 (3) September-December, pp. 120-132/Ahuja and Khurana
Research Article
© Copyright 2014 | Centre for Info Bio Technology (CIBTech) 126
Table 2: Number of irrigations, average water application per irrigation, seasonal total irrigation depth, total water application (m3 ha
-1),
water use efficiency (kg tuber dry weight m-3
of water applied) and Irrigation water use efficiency (WUEi) for different treatments during
2011 and 2012 plantings
Treatments Pre-plant
irrigation +
Crop
establishing
irrigation
Number of
irrigations
Average
irrigation
application
(mm)
Seasonal
irrigation
application
(mm)
Water volume (m3 ha
-1)
(seasonal irrigation
application + total
rainfall)
WUE (kg tuber dry weight
m-3
of water volume)
WUEi
(kg ha-1
mm-1
)
Year 2011 & 2012 2011 2012 2011 2012 2011 2012 2011 2012 Average 2011 2012 Pooled 2011 2012 Pooled
S20D20 50mm+50 mm 5 5 45.5 45.0 227.5 225.0 3449 3424 3436.5 0.94d 1.04f 0.99c 63.4d 68.0d 65.7f
S35D20 50 mm +50
mm
4 3 45.5 45.0 182.0 135.0 2994 2524 2759.0 1.14abc 1.49bc 1.32abc 71.7abc 91.8b 81.8bc
S50D20 50 mm +50
mm
3 2 45.0 45.0 135.0 90.0 2524 2074 2299.0 1.23ab 1.60b 1.42ab 74.7ab 96.1b 85.4b
S20D30 50 mm +50
mm
4 4 45.0 45.4 180.0 181.6 2974 2990 2982.0 1.06bcd 1.12ef 1.09bc 66.9cd 67.9d 67.4f
S35D30 50 mm +50
mm
3 2 45.0 45.0 135.0 90.0 2524 2074 2299.0 1.14abc 1.48bc 1.31abc 69.5bcd 88.4b 78.9cd
S50D30 50 mm +50
mm
2 1 45.0 45.0 90.0 45.0 2074 1624 1849.0 1.30a 1.78a 1.54a 78.1a 106.4a 92.2a
S20D40 50 mm +50
mm
4 3 45.0 45.5 180.0 136.5 2974 2539 2756.5 1.03cd 1.28de 1.15bc 63.9d 77.9c 70.9ef
S35D40 50 mm +50
mm
2 2 45.0 46.0 90.0 92.0 2074 2094 2084.0 1.23ab 1.28de 1.25abc 73.8ab 74.3cd 74.0de
S50D40 50 mm +50
mm
1 1 45.5 45.0 45.5 45.0 1629 1624 1626.5 1.32a 1.39cd 1.36ab 78.0a 80.3c 79.1cd
Control 0 +110 mm 7 7 60.0 57.5 420.0 402.5 5474 5299 5386.5 0.46e 0.56g 0.51d 34.9e 37.2e 36.1g
p-value - - - - - - - - - - <0.05 <0.05 <0.05 <0.05 <0.05 <0.05
* Column mean with different letters differ significantly at p-value <0.05. ** The effective total rainfall during both the planting seasons was
17.4mm.
International Journal of Food, Agriculture and Veterinary Sciences ISSN: 2277-209X (Online)
An Open Access, Online International Journal Available at http://www.cibtech.org/jfav.htm
2014 Vol. 4 (3) September-December, pp. 120-132/Ahuja and Khurana
Research Article
© Copyright 2014 | Centre for Info Bio Technology (CIBTech) 127
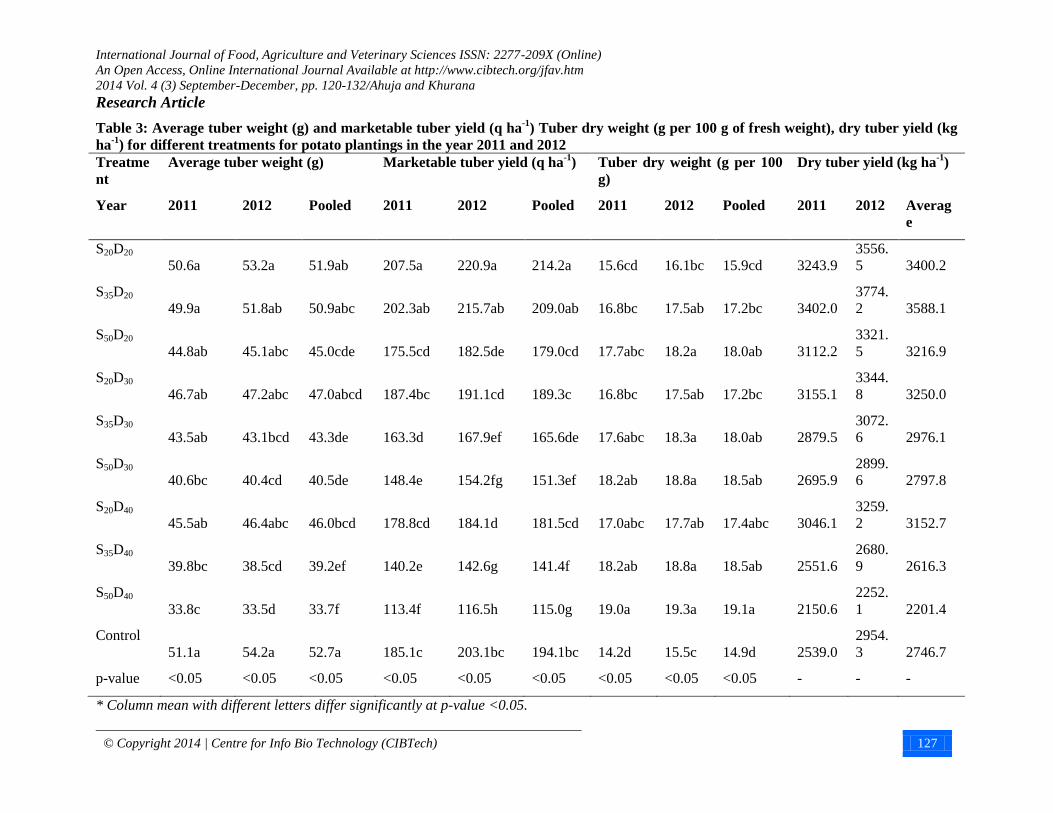
Table 3: Average tuber weight (g) and marketable tuber yield (q ha-1
) Tuber dry weight (g per 100 g of fresh weight), dry tuber yield (kg
ha-1
) for different treatments for potato plantings in the year 2011 and 2012
Treatme
nt
Average tuber weight (g) Marketable tuber yield (q ha-1
) Tuber dry weight (g per 100
g)
Dry tuber yield (kg ha-1
)
Year 2011 2012 Pooled 2011 2012 Pooled 2011 2012 Pooled 2011 2012 Averag
e
S20D20
50.6a 53.2a 51.9ab 207.5a 220.9a 214.2a 15.6cd 16.1bc 15.9cd 3243.9
3556.
5 3400.2
S35D20
49.9a 51.8ab 50.9abc 202.3ab 215.7ab 209.0ab 16.8bc 17.5ab 17.2bc 3402.0
3774.
2 3588.1
S50D20
44.8ab 45.1abc 45.0cde 175.5cd 182.5de 179.0cd 17.7abc 18.2a 18.0ab 3112.2
3321.
5 3216.9
S20D30
46.7ab 47.2abc 47.0abcd 187.4bc 191.1cd 189.3c 16.8bc 17.5ab 17.2bc 3155.1
3344.
8 3250.0
S35D30
43.5ab 43.1bcd 43.3de 163.3d 167.9ef 165.6de 17.6abc 18.3a 18.0ab 2879.5
3072.
6 2976.1
S50D30
40.6bc 40.4cd 40.5de 148.4e 154.2fg 151.3ef 18.2ab 18.8a 18.5ab 2695.9
2899.
6 2797.8
S20D40
45.5ab 46.4abc 46.0bcd 178.8cd 184.1d 181.5cd 17.0abc 17.7ab 17.4abc 3046.1
3259.
2 3152.7
S35D40
39.8bc 38.5cd 39.2ef 140.2e 142.6g 141.4f 18.2ab 18.8a 18.5ab 2551.6
2680.
9 2616.3
S50D40
33.8c 33.5d 33.7f 113.4f 116.5h 115.0g 19.0a 19.3a 19.1a 2150.6
2252.
1 2201.4
Control
51.1a 54.2a 52.7a 185.1c 203.1bc 194.1bc 14.2d 15.5c 14.9d 2539.0
2954.
3 2746.7
p-value <0.05 <0.05 <0.05 <0.05 <0.05 <0.05 <0.05 <0.05 <0.05 - - -
* Column mean with different letters differ significantly at p-value <0.05.
International Journal of Food, Agriculture and Veterinary Sciences ISSN: 2277-209X (Online)
An Open Access, Online International Journal Available at http://www.cibtech.org/jfav.htm
2014 Vol. 4 (3) September-December, pp. 120-132/Ahuja and Khurana
Research Article
© Copyright 2014 | Centre for Info Bio Technology (CIBTech) 128
The first treatment was significantly higher among all the treatments and next five treatments in the order
were statistically at par with each other. Similar trends of higher water use efficiency with the use of
lower volume of water were also obtained by Xie et al., (2012) in China.
The similar trends as for WUE were recorded for WUEi. Treatments S50D30 and S50D40 recorded highest
WUEi followed by S35D20 in 2011. While, S50D30 recorded highest WUEi followed by S50D20 and S35D20
in the year 2012. Similar to WUE, lowest values of WUEi were recorded in the control during both the
years. S35D20 recorded 105 and 147% higher WUEi than that of control treatment in 2011 and 2012,
respectively. Approximately similar range of WUE was obtained by Wang et al., (2011) except for the
lowest value obtained in our experiment for the control treatment. The values of WUE obtained by Kang
et al., (2004) was higher than values of WUEi obtained in our investigation which may be due to less
irrigation water consumed under drip irrigation system. The WUE (30.2 to 58.4 kg ha-1
mm-1
) obtained by
Panigrahi et al., (2001) was lower than WUEi in our experiment because they had obtained lower tuber
yield in their study.
Marketable Tuber Yield and Average Tuber Weight
Treatment S20D20 produced higher 6.5% marketable tuber yield in 2011 as compared to in the year 2012
and the corresponding rate for S35D20 was 6.6% (Table 3). Both of these treatments were targeted at lower
soil water suction measured in the upper soil layer as compared to the other treatments. The pooled
analysis of data also showed that treatments S20D20 and S35D20 recorded 86% and 82% higher marketable
tuber yield compared to the control. The marketable tuber yield for control treatment followed these two
best treatments. This was in fact reasonable because this treatment had received the highest amount of
irrigation water. In S50D40 treatment, lowest SWP was measured at 0.4 m soil depth and it had received
lowest amount of water volume during both the years. The tuber growth was restrained under this
treatment which may probably due to soil moisture deficit in the of root zone area. Our result agrees with
the findings of Wang et al., (2007). Kang et al., (2004) also found that there was continuous decrease in
the tuber yield as the soil matric potential increased from -25 kPa to -55 kPa. It was seen that potato yield
decreased with the drop in SMP from -20 kPa to -50 kPa at all the installation depths of tensiometer.
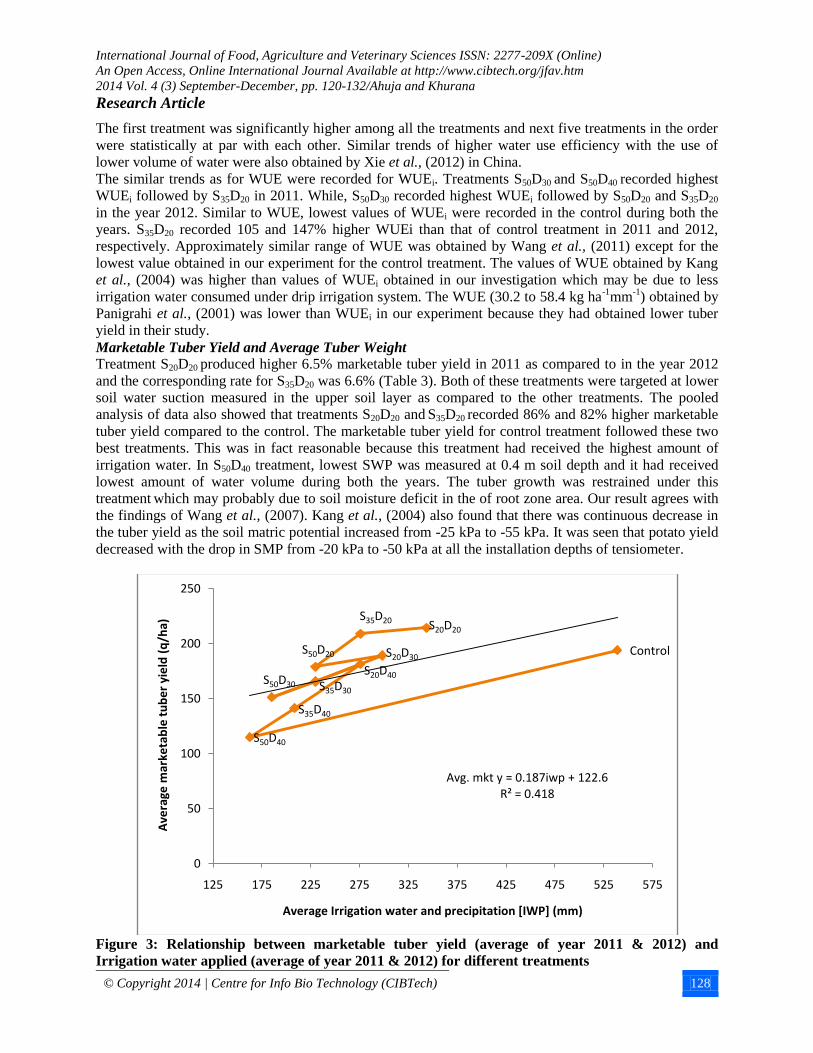
Figure 3: Relationship between marketable tuber yield (average of year 2011 & 2012) and
Irrigation water applied (average of year 2011 & 2012) for different treatments
S20D20
S35D20
S50D20 S20D30
S35D30S50D30
S20D40
S35D40
S50D40
Control
Avg. mkt y = 0.187iwp + 122.6R² = 0.418
0
50
100
150
200
250
125 175 225 275 325 375 425 475 525 575
Ave
rage
mar
keta
ble
tu
be
r yi
eld
(q
/ha)
Average Irrigation water and precipitation [IWP] (mm)
International Journal of Food, Agriculture and Veterinary Sciences ISSN: 2277-209X (Online)
An Open Access, Online International Journal Available at http://www.cibtech.org/jfav.htm
2014 Vol. 4 (3) September-December, pp. 120-132/Ahuja and Khurana
Research Article
© Copyright 2014 | Centre for Info Bio Technology (CIBTech) 129
The relationship between the average marketable tuber yield (avg. mkt y) and total irrigation water
applied (sum of Irrigation water and precipitation = iwp) for different treatments (Figure 3) is given by
the equation
Avg. mkt y (q/ha) = 0.187 iwp (mm) + 122.6
The value of coefficient of determination between these two variables was found to be 0.418. It was
observed that the marketable tuber yield increase with increase in irrigation water application. The
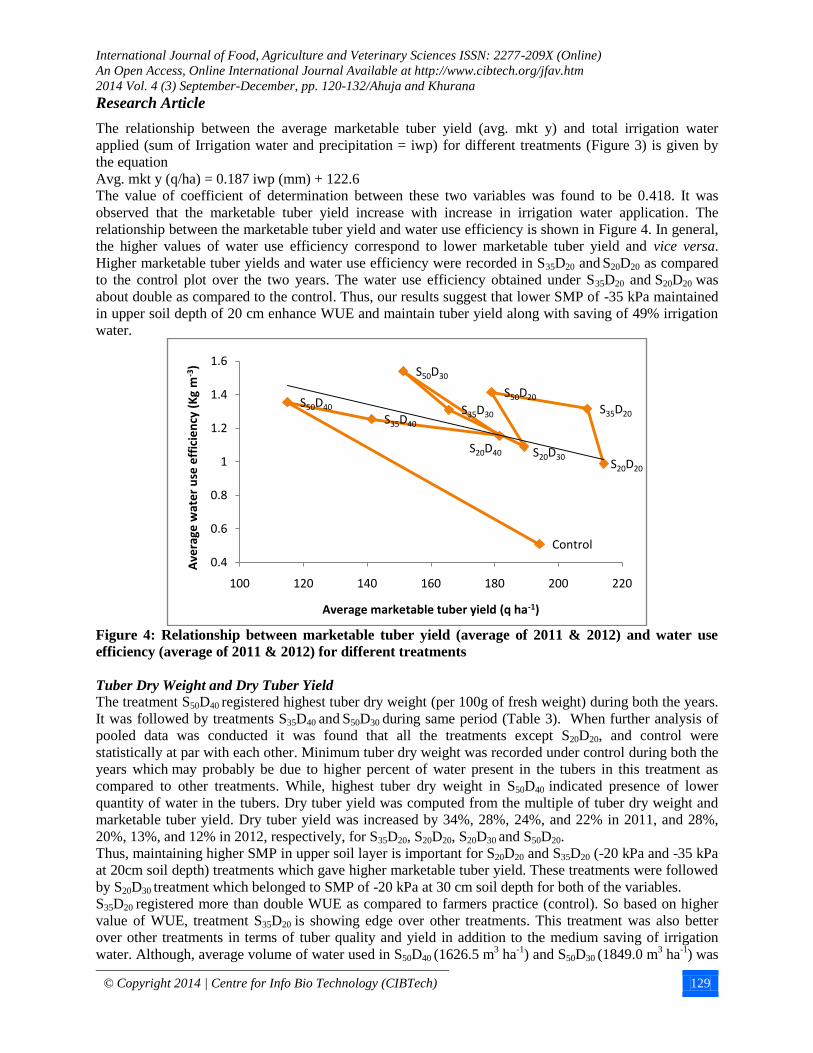
relationship between the marketable tuber yield and water use efficiency is shown in Figure 4. In general,
the higher values of water use efficiency correspond to lower marketable tuber yield and vice versa.
Higher marketable tuber yields and water use efficiency were recorded in S35D20 and S20D20 as compared
to the control plot over the two years. The water use efficiency obtained under S35D20 and S20D20 was
about double as compared to the control. Thus, our results suggest that lower SMP of -35 kPa maintained
in upper soil depth of 20 cm enhance WUE and maintain tuber yield along with saving of 49% irrigation
water.
Figure 4: Relationship between marketable tuber yield (average of 2011 & 2012) and water use
efficiency (average of 2011 & 2012) for different treatments
Tuber Dry Weight and Dry Tuber Yield
The treatment S50D40 registered highest tuber dry weight (per 100g of fresh weight) during both the years.
It was followed by treatments S35D40 and S50D30 during same period (Table 3). When further analysis of
pooled data was conducted it was found that all the treatments except S20D20, and control were
statistically at par with each other. Minimum tuber dry weight was recorded under control during both the
years which may probably be due to higher percent of water present in the tubers in this treatment as
compared to other treatments. While, highest tuber dry weight in S50D40 indicated presence of lower
quantity of water in the tubers. Dry tuber yield was computed from the multiple of tuber dry weight and
marketable tuber yield. Dry tuber yield was increased by 34%, 28%, 24%, and 22% in 2011, and 28%,
20%, 13%, and 12% in 2012, respectively, for S35D20, S20D20, S20D30 and S50D20.
Thus, maintaining higher SMP in upper soil layer is important for S20D20 and S35D20 (-20 kPa and -35 kPa
at 20cm soil depth) treatments which gave higher marketable tuber yield. These treatments were followed
by S20D30 treatment which belonged to SMP of -20 kPa at 30 cm soil depth for both of the variables.
S35D20 registered more than double WUE as compared to farmers practice (control). So based on higher
value of WUE, treatment S35D20 is showing edge over other treatments. This treatment was also better
over other treatments in terms of tuber quality and yield in addition to the medium saving of irrigation
water. Although, average volume of water used in S50D40 (1626.5 m3 ha
-1) and S50D30 (1849.0 m
3 ha
-1) was
S20D20
S35D20
S50D20
S20D30
S35D30
S50D30
S20D40
S35D40
S50D40
Control
0.4
0.6
0.8
1
1.2
1.4
1.6
100 120 140 160 180 200 220
Ave
rage
wat
er
use
eff
icie
ncy
(K
g m
-3)
Average marketable tuber yield (q ha-1)
International Journal of Food, Agriculture and Veterinary Sciences ISSN: 2277-209X (Online)
An Open Access, Online International Journal Available at http://www.cibtech.org/jfav.htm
2014 Vol. 4 (3) September-December, pp. 120-132/Ahuja and Khurana
Research Article
© Copyright 2014 | Centre for Info Bio Technology (CIBTech) 130
much lower than its usage in S35D20 (2759 m3 ha
-1) treatment. Highest saving of 70% irrigation water was
recorded in the S50D40 treatment followed by S50D30 (66%) as compared to traditional irrigation practice.
But, due to continuous soil moisture deficit the tuber yield was drastically reduced in the S50D40 and
S50D30 treatments probably in the present investigation. The treatment utilized 49% less irrigation water as
compared to the traditional irrigation practice in the region. The irrigation schedule of S35D20 treatment
created optimum soil environmental conditions for tuber growth and development through better water
and nutrient uptake. While, delayed irrigation at higher SWT for treatments S50D20, S50D30, and S50D40
may have caused lower soil moisture content in the root zone resulting in poor tuber growth and
development. Light irrigations for maintaining lower soil moisture tension in upper soil layer (S35D20) was
better than the frequent and heavier irrigations as practised by the farmers which lead to reduced WUE.
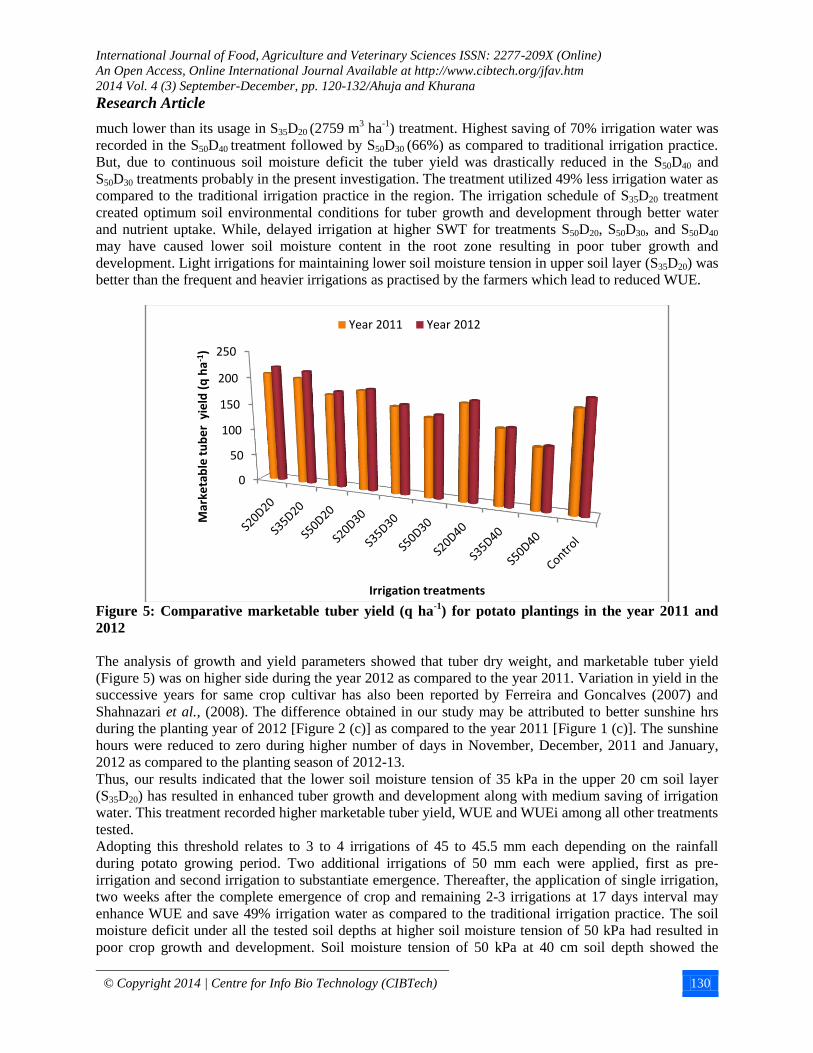
Figure 5: Comparative marketable tuber yield (q ha
-1) for potato plantings in the year 2011 and
2012
The analysis of growth and yield parameters showed that tuber dry weight, and marketable tuber yield
(Figure 5) was on higher side during the year 2012 as compared to the year 2011. Variation in yield in the
successive years for same crop cultivar has also been reported by Ferreira and Goncalves (2007) and
Shahnazari et al., (2008). The difference obtained in our study may be attributed to better sunshine hrs
during the planting year of 2012 [Figure 2 (c)] as compared to the year 2011 [Figure 1 (c)]. The sunshine
hours were reduced to zero during higher number of days in November, December, 2011 and January,
2012 as compared to the planting season of 2012-13.
Thus, our results indicated that the lower soil moisture tension of 35 kPa in the upper 20 cm soil layer
(S35D20) has resulted in enhanced tuber growth and development along with medium saving of irrigation
water. This treatment recorded higher marketable tuber yield, WUE and WUEi among all other treatments
tested.
Adopting this threshold relates to 3 to 4 irrigations of 45 to 45.5 mm each depending on the rainfall
during potato growing period. Two additional irrigations of 50 mm each were applied, first as pre-
irrigation and second irrigation to substantiate emergence. Thereafter, the application of single irrigation,
two weeks after the complete emergence of crop and remaining 2-3 irrigations at 17 days interval may
enhance WUE and save 49% irrigation water as compared to the traditional irrigation practice. The soil
moisture deficit under all the tested soil depths at higher soil moisture tension of 50 kPa had resulted in
poor crop growth and development. Soil moisture tension of 50 kPa at 40 cm soil depth showed the
0
50
100
150
200
250
Mar
keta
ble
tu
be
r y
ield
(q
ha
-1)
Irrigation treatments
Year 2011 Year 2012
International Journal of Food, Agriculture and Veterinary Sciences ISSN: 2277-209X (Online)
An Open Access, Online International Journal Available at http://www.cibtech.org/jfav.htm
2014 Vol. 4 (3) September-December, pp. 120-132/Ahuja and Khurana
Research Article
© Copyright 2014 | Centre for Info Bio Technology (CIBTech) 131
highest reduction in the crop growth and tuber yield implying water stress conditions. Traditional
irrigation practice had received highest quantity of water among all the treatments which may had caused
more than optimum soil water in the root zone resulting in reduced water and nutrient uptake owing to
decreased soil aeration as well tuber health deterioration in this treatment.
ACKNOWLEDGEMENT This is a Ph.D. work of the first author. Authors are thankful to the Punjab Agricultural University,
Ludhiana, for providing all the facilities for conduct of the research.
REFERENCES
Anonymous (2013a). Faostat. Available: http://faostat3.fao.org [Accessed 10 October 2014].
Anonymous (2013b). Package of practices for cultivation of Vegetable Crops. Punjab Agricultural
University, Ludhiana 96.
Ferreira TC and Goncalves DA (2007). Crop-yield/water-use production functions of potatoes
(Solanum tuberosum, L.) grown under differential nitrogen and irrigation treatments in a hot, dry climate.
Agricultural Water Management 90 45-55.
Gomez KA and Gomez AA (2010). Statistical Procedures for Agricultural Research (John wiley &
Sons; Inc) UK 672.
Hira GS (2009). Water management in northern states and food security of India. Journal of Crop
Improvement 23 136-57.
Kang Y, Wang FX, Liu HJ and Yuan BZ (2004). Potato evapotranspiration and yield under different
drip irrigation regimes. Irrigation Science 23 133–143.
Kumar P, Pandey SK, Singh SV and Kumar D (2007). Irrigation requirements of chipping potato
cultivars under west-central Indian plains. Potato Journal (Journal of Indian Potato Association) 34 193-
98.
Kumar S, Asrey R, Manual G and Singh R (2009). Microsprinkler, drip and furrow irrigation for
potato (Solanum tuberosum) cultivation in a semi-arid environment. Indian Journal Agricultural Sciences
79 165-69.
Medici LO, Reinert F, Carvalho DF, Kozak M and Azevedo RA (2014). What about keeping plants
well watered? Environmental and Experimental Botany 99 38-42.
Olsen S, Cole C, Watanabe F and Dean L (1954). Estimation of Available Phosphorus in Soils by
Extraction with Sodium Bicarbonate. USDA Circular No. 939 (US Gov. Print. Office) Washington, DC.
Panigrahi B, Panda SN and Raghuwanshi NS (2001). Potato water use and yield under furrow
irrigation. Irrigation Science 20 155-163.
Pratt PF (1965). Potassium. In: Methods of Soil Analysis: Part 2, edited by Black CA. Agronomy,
American Society of Agronomy, Madison, WI 9 1023–1031.
Shae JB, Steele DD and Gregory BL (1999). Irrigation scheduling methods for potatoes in the Northern
Great Plains. Transactions of ASAE 42 351-360.
Shahnazari A, Ahmadi SH, Laerke PE, Liu F, Plauborg F, Jacobsen SE, Jensen CR and Andersen
MN (2008). Nitrogen dynamics in the soil-plant system under deficit and partial root-zone drying
irrigation strategies in potatoes. European Journal of Agronomy 28 65-73.
Singh N and Sood MC (2013). Raised bed planting techniques for potato production under furrow and
sprinkler irrigation methods. Annals of Horticullture 6 45-48.
Singh N, Sood MC and Singh SP (2010). Optimizing irrigation water and nutrient requirement of potato
(Solanum tuberosum L.) under drip fertigation. Progressive Agriculture 10 192-195.
Singh N, Sood MC, Trehan SP, Lal SS and Singh SP (2012). Influence of irrigation and mulch on
growth, yield and economics of potato. Annals of Horticulture 5 41-46.
Tyagi VK, Thenua OVS, Kumar D and Singh N (2012). Effect of irrigation and cropping system on
potato (Solanum tuberosum) grown sole or intercropped with French bean (Phaseolus vulgaris). Indian
Journal of Agronomy 57 357-361.
International Journal of Food, Agriculture and Veterinary Sciences ISSN: 2277-209X (Online)
An Open Access, Online International Journal Available at http://www.cibtech.org/jfav.htm
2014 Vol. 4 (3) September-December, pp. 120-132/Ahuja and Khurana
Research Article
© Copyright 2014 | Centre for Info Bio Technology (CIBTech) 132
Verma SK, Idnani LK and Kumar A (2013). Irrigation and nitrogen management in potato (Solanum
tuberosum) and their residual effects on succeeding maize (Zea mays). Indian Journal of Agronomy 58
48-53.
Wang FX, Kang Y, Liu SP and Hou XY (2007). Effects of soil matric potential on potato growth under
drip irrigation in the North China Plain. Agricultural Water Management 88 3-42.
Wang FX, Wu XX, Shock CC, Chu LY, Gu XX and Xue X (2011). Effects of drip irrigation regimes
on potato tuber yield and quality under plastic mulch in arid Northwestern China. Field Crops Research
122 78–84.
Xie K, Wang Xiao-Xue, Zhang R, Gong X, Zhang S, Mares V, Gavilán C, Posadas A and Quiroz R
(2012). Partial root-zone drying irrigation and water utilization efficiency by the potato crop in semi-arid
regions in China. Scientia Horticulturae 134 20–25.