effect of soil, cover, slope, and rainfall factors on soil and phosphorus movement under simulated...
TRANSCRIPT

Effect of Soil, Cover, Slope, and Rainfall Factors on Soil and Phosphorus Movement UnderSimulated Rainfall Conditions1
D. A. MUNN, E. O. MCLEAN, A. RAMIREZ, AND T. J. LooAN2
ABSTRACT
Three soils were treated with phosphorus at 25, 125, and625 /ig P/g soil in bare and cropped microplots and subjectedto simulated rainfall. Five combinations of rainfall intensityand duration and microplot slope were used. Movement of soiland phosphorus from the microplots was measured. The quan-tity of runoff water, eroded solids, and P in the runoff in-creased with degree of slope and rainfall intensity. A highcorrelation (r = 0.997) was found between total P in therunoff from the bare plots and the quantity of soil eroded. Con-centrations of soluble P in runoff from the plots was sufficientto eutrophy empounded water. The soil was nearly saturatedwith water and the system was "closed" so that runoff andleachate from a given rain were inversely related. Hence, theplant cover which was very effective in reducing runoff volumeand soil erosion (as well as P losses) increased the quantity ofpercolating water. The increased percolation of water increasedthe P leached from cropped plots having uniformly mixed P.A well aggregated silty clay soil (Toledo) exhibited more in-filtration than coarser textured soils with less granular structure.
A modified Chang and Jackson fractionation of the sedimentsshowed the dominant P fractions and their increases with rateof P application to be directly related to extractable Fe and Alcontent, pH, and percentage base saturation of the originalsoils. There was no significant change in the amount of P inorganic form with rate of P application.
While considerable caution must be used in extrapolatingresults of this kind to field conditions, the simulated rainfall andmicroplot method may prove useful in the study of nutrientmovement by erosion and leaching under specified conditions.
Additional Index Words: erosion, runoff, leaching, phosphatefractionation and water pollution.
MANY STUDIES have been conducted on reactions of P inthe soil and characterizations of P in lake and stream
sediments. Black (1970) reviewed the role of soil and fer-tilizer P in water pollution and McCarty (1969) reviewedthe chemistry of P in lakes and streams. While agricultureis considered to be a major source of P and N in the nutri-ent enrichment of lakes, evaluation of the relative contribu-tions of industrial, municipal, suburban, and agriculturalsources by water sampling and hydrologic studies hasproven to be difficult.
Duley (1926) found the major loss of P in runoff to bein the form of eroded soil. Since that time several studieshave noted P losses through erosion under field conditions(Volk, 1945; Scarseth and Chandler, 1938; Rogers, 1941;
1 Published with the permission of the Director of the OhioAgr. Res. and Dev. Center as Journal Article no. 102-72. Dataare based on results reported in MS Theses, Graduate School,Ohio State Univ., March 1972, by the senior and second juniorauthors. Received Oct. 16, 1973. Approved Feb. 16, 1973.
2 Graduate Associate, Professor, former Graduate Assistant,and Assistant Professor, Dep. of Agronomy, Ohio State Univ.,and Ohio Agr. Res. and Dev. Center.
and Ensminger, 1952). Small amounts of erosion, particu-larly the < 2{i fraction, were found to be responsible formajor P losses. However, in many cases such field studiesused periodic soil analysis and P contents of crops removedas bases for estimating P losses by erosion.
In an effort to obtain quantitative information on P andsoil movement under specified rainfall conditions, threesoils were treated with P in bare and cropped microplotsand subjected to simulated rainfall. Runoff and leachatewere collected and analyzed for soluble and total P. Inor-ganic P in the eroded sediments was characterized by amodified Chang and Jackson fractionation procedure, andthe total organic P was determined.
MATERIALS AND METHODSThree Ohio soils (Rossmoyne silt loam, Toledo silty clay,
and Wauseon sandy loam) were selected for use in this study.These soils represent a spectrum of soil textures, sesquioxideand exchangeable base contents, pH, cation exchange capacity(CEC), and P levels (Table 1). Soil was collected from thesurface 0-20 cm after surface debris and vegetation had beenremoved. It was air dried and crushed between wooden rollersto pass a four-mesh screen.
Phosphorus applications were made to each soil at the rateof 25, 125, and 625 /*g P per g of dry soil. A 5-kg air-dry ali-quot of each soil was mixed with the appropriate amount ofreagent grade monocalcium phosphate for the entire microplot.Then the phosphate-treated aliquot was thoroughly mixed withthe remaining weight of soil.
Screen-bottomed boxes were constructed of pine lumbertreated with linseed oil. The boxes were 122 cm long, 30.4 cmwide, and 15.2 cm deep. The steel-screen bottoms were reen-forced with heavy steel mesh attached to the wooden walls toretain soil while premitting ready passage of percolating water.A removable wooden end was replaced by a sheet-metal endand trough for collection of runoff during the simulated raintreatments. Just prior to subjecting the microplots to simulatedrainfall, each was placed on a sand-filled, sheet-metal pan ofslightly larger dimensions than the box. This pan containedclean quartz sand and had a drain for collecting leachate. Aprotective flange and collar were placed over the top edge ofthe boxes during sprinkling to prevent water from running downthe outside of the box, causing bias in the amounts of leachatemeasured. This protective device also prevented spattering ofwater and soil over the edge of the boxes. Runoff and leachatewere collected in plastic containers.
A sprinkling device for the simulated rainfall was built likethat of the Purdue Sprinkling Infiltrometer, Bertrand and Parr(1961), and was calibrated to give 6.35 cm/hour and 12.7 cm/hour using Model 5B and 7LA nozzles at 25 and 10 psi, respec-tively. The sprinkler head was 274 cm above the surface of themicroplots. Calibration was done empirically at each rainintensity.
Two replicates of bare soil and soil cropped with wheat,Triticum aestivum L., were used for each combination of soiltype and phosphate level. Sixteen seeds were planted per rowin eight rows, 15 cm apart perpendicular to the length of themicroplot and to the direction of runoff flow. The bare andcropped microplots were both moistened to field capacity andmaintained in that state for 27 days. The plants were thinnedto 12 per row on the 14th day. On the 27th day after plantingthe seed, the boxes were placed on the sand-filled sheet-metalpans under the sprinkler, and carefully saturated as indicated
428

MUNN ET AL.: SOIL AND P MOVEMENT UNDER SIMULATED RAINFALL CONDITIONS 429
Table 1—Properties of soils used in the studiesProperty
pH (1:1 suspension)Bray PI available P (kg/ha)Extractable Al frng/g)
(Cltrate-Dlthlonlte)Extractable Fe (mg/g)
(Cltrate-Dlthlonlte)Base saturation (%)CEC (meq/100g)Total P (mg P/g)Inorganic P (mg P/g)Sand (%) (0.05-2 mm)Silt (%) (0.002-0. 05 mm)Clay (%) (8. 002 mm)Weight of soil (kg/mlcroplot)*Bulk density fe/cm* )*
Rossmoyne5.6
21.0
1.22
15.345.019.3
594.0312.0
12.369.917.858.0
1.18
Toledo6.8
14.0
0.51
14.375.036.2
569.0325.0
5.052.043.051.7
1.05
Wauseon7.5
96.0
0.48
10.193.018.5
908.0744.0
68.422.59.1
70.01.42
' Oven dry basis.
by the initiation of drainage. Sprinkling treatments were com-menced 24 hours later. The combinations of slope and rainfallintensities and durations listed in the order in which they wereapplied are:
(i) 1% slope, 6.35 cm/hour, 12 min (1.27 cm rain)(ii) 1% slope, 6.35 cm/hour, 24 min (2.54 cm rain)
(iii) 4% slope, 6.35 cm/hour, 24 min (2.54 cm rain)(iv) 1% slope, 12.7 cm/hour, 12 min (2.54 cm rain)(v) 4% slope, 12.7 cm/hour, 12 min (2.54 cm rain).
Following collection, the runoff was allowed to stand undis-turbed in the carboy for 21 hours, then the dilute supernatantclay suspension was siphoned off and measured by weighing.After shaking to assure uniformity, two 250-ml samples of thissuspension were taken for P analysis. Complete removal of theeroded soil (sediment) from the carboy was accomplished byseveral rinsings totaling approximately 200 ml of distilled wa-ter. The sediment was oven dried at HOC for 24 hours, weighed,and ground to pass a 10-mesh screen before subsequent analysis.Leachates were shaken to assure uniformity, and two 250-mlsamples were taken for P analysis.
After the five sprinkling treatments had been completed, thewheat plants were sampled for yield and P analysis, and a com-posite soil sample was taken from each box for available Panalysis.
Chemical and physical properties of the soils used in thesestudies are given in Table 1.
Samples of the runoff and leachate were digested with per-chloric acid and the total P content determined by the chloro-stannous-reduced molybdophosphoric blue color (in HC1)method of Jackson (1958, p. 134-146). Samples of the runoffand leachate were centrifuged at 2,500 rpm for 15 min and fil-tered through Whatman No. 42 paper. Soluble P in these sam-ples was then determined by the chlorostannous-reduced molyb-dophosphoric blue color (in H2SO4) method of Jackson (1958,p. 134-146). One-gram samples of the sediments were digestedwith perchloric acid and total P determined by the method ofTandon, Cescas, and Tyner (1968).
The phosphates in the eroded solids were fractionated ac-cording to the procedure of Chang and Jackson (1957) withthe following modifications: NH4Cl-extractable P was deter-mined and reductant-soluble P was not. Organic P was deter-mined by a strong-acid, high-temperature ignition method (G.T. Kaiser, 1970. A comparison of soil organic phosphorus inthe Ap horizon of twenty-three Ohio soils using two methodsof determination. M.S. Thesis, The Ohio State University, Col-umbus). The plant samples were ashed in a muffle furnace andthe ash taken up in dilute HC1. Phosphorus in the ash was deter-mined by the chlorostannous-reduced molybdophosphoric bluecolor (in HC1) method of Jackson (1958, p. 335-336).
RESULTS AND DISCUSSION
The wheat cover reduced the quantity of runoff waterand was extremely effective in reducing the erosion of soilparticles (Table 2). The 8 g of soil eroded from thecropped Rossmoyne four-square foot microplot was ap-
Table 2—Quantities of eroded solids, runoff water, and leach-ate from the microplots according to surface condition
(units per microplot) *Rossmoyne Toledo
Surface Eroded Runoff Eroded Runoff Eroded Runoffcondition solids water Leachate solids water Leachate solids water Leachatet
BareWheat
crop
g254.3
———liters——24.0 10.7
g142.9
———liters——25.7 11.7
g144.0
———liters——28.9 5.7
8.0 17.0 13.9 15.4 11.0 22.1 22.3 22.3 9.1* Total for all combinations of slope and rainfall Intensities and durations, and averagedfor duplicates of three levels of phosphate application.t Algae on the surface of certain plots of this soil gave erratic amounts of leachate andlow average values.
Table 3—Effect of rainfall intensity and slope on erosion ofthe bare microplots with 2.54 cm rain
intensity
6.356.35
12.712.7
Slope
i414
Rossmoyne
5.29.2
97.3140.0
Soil eroded*Toledo
2.74.8
59.573.7
Wauseon
3.73.5
57.573.5
* Average of all replications and phosphate treatments.
proximately 224 kg/ha (0.1 tons/acre) while the 254 gof soil eroded from the bare plot was about 6,700 kg/ha(3 tons/acre).
Numerous studies reviewed by Smith and Wischmeier(1962) have shown that dissipation of raindrop energy bya surface cover reduces erosion even with a constant vol-ume of surface flow. The wheat crop here tended to dissi-pate impact energy, to reduce velocity of flow, and toenhance infiltration (reducing volume of runoff). Sincethe microplots were saturated 24 hours prior to each rain(even though drainage, evaporation, and evapotranspirationby the crop removed some water), the nearly-saturated soilrepresented a "closed" system in which runoff and leachatewere inversely related.
It is evident from the data (Table 2) that texture of thesoils did not have primary effect on the amount of waterpercolating through these soils, since the soil of finest tex-ture (Toledo silty clay) had more leachate than either ofthe other two soils. This was a consequence of the highlygranular structure of this soil. In contrast, the coarse-tex-tured Wauseon sandy loam was completely structureless,and its very high fertility favored the growth of algae onthe surface of some plots—possibly like algal "bloom" inbodies of water. This growth on the soil surface interferedwith normal penetration of water and caused more runoffthan from the other two soils.
Rainfall intensity and slope were found to affect thequantity of soil eroded from the microplots (Table 3).Since rate of P applied did not significantly affect plantyield on a given soil and hence would not be expected toaffect amounts of soil eroded, the data were averaged forall rates of P applied. The differences in the quantity ofsoil eroded at 12.7 cm/hour intensity vs. 6.35 cm/hourintensity at constant slope were much greater for all threesoils than the differences in erosion from four vs. 1 % slopeat constant rainfall intensity. The effect of slope in termsof soil eroded per plot was much more pronounced at thehigher rainfall intensity. Smith and Wischmeier (1962) re-ported a good correlation between rainfall kinetic energy
430 SOIL SCI. SOC. AMER. PROC., VOL. 37, 1973
Table 4—Particulate phosphorus in runoff from bare micro-plots with 2.54 cm of rainfall
Participate phosphorus In runoff*
Intensity,cm/hr
6.356.35
12.712.7
Slope,%1414
Rossmoynemg/plot
7.011.9
101.9153.2
% totalt90.593.898.498.9
Toledomg/plot
4.59.3
73.682.6
% totalt93.591.397.898.0
Wauseonmg/plot
8.29.2
68.183.4
% totalt87.586.595.596.8
* Average for all replications and phosphate treatments,t Percentage particulate P is of total runoff P.
Table 5—Total phosphorus concentrations in eroded soil
Rate of PapplicationHgP/g soil
25125625
PhosphoruiRossmoyne
694923
1,270
3 contents of sediments*Toledo
900992
1,450
Wauseon
9261,0141,370
* Average for all replications and combinations of slope and rainfall.
and soil erosion, and poor correlations between rainfallintensity or duration, and erosion in field studies. Duleyand Hayes (1932) found the increases in erosion withsprinklers on small plots per unit change in slope increasedas soil surface slope increased.
The effects of slope and rainfall intensity on the move-ment of phosphate as particulate-P in the runoff (Table 4)were very similar to those for erosion of solid material dis-cussed above. Although amounts of particulate phosphorusvary with P treatment (Table 5), the values were averagedfor all three P treatments of a given soil so that they arecomparable with amounts of eroded soil (Table 3). It canbe seen that the percentage of P in the particulate form isgenerally highest for the higher rainfall intensity. However,rather than being an effect solely of intensity of rain, itshould be remembered that the preceding rains had alreadycarried away some of the more soluble phosphate as per-colate and runoff.
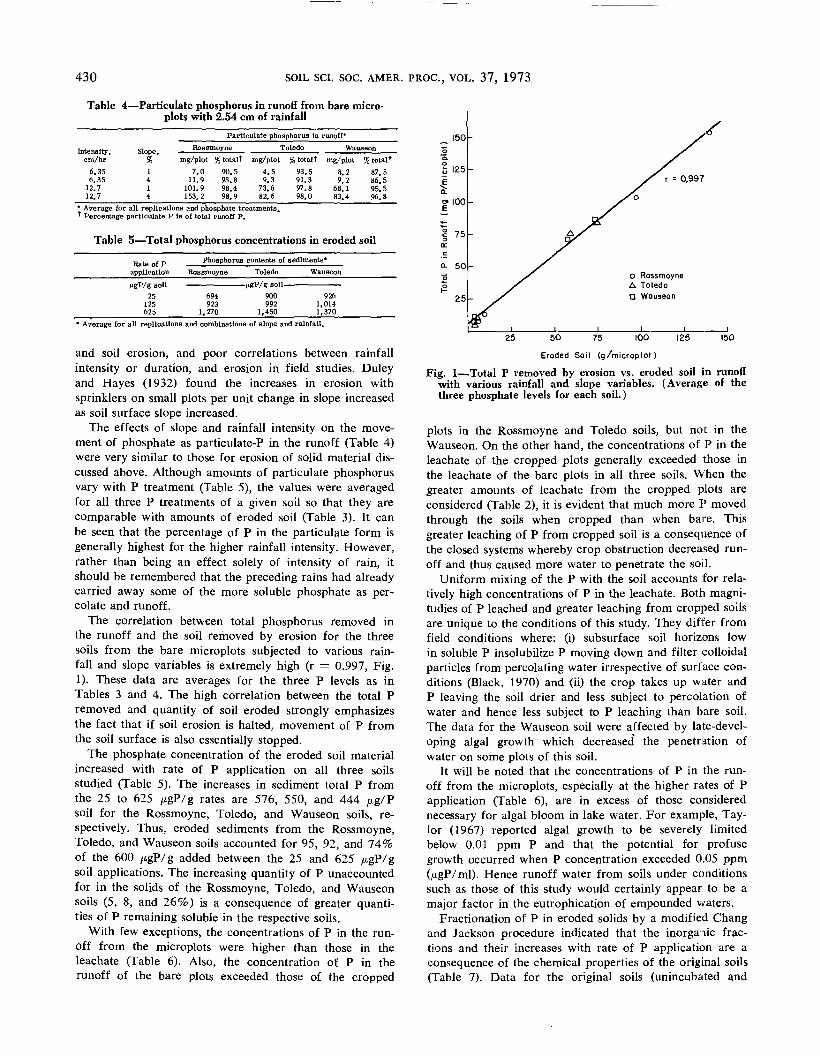
The correlation between total phosphorus removed inthe runoff and the soil removed by erosion for the threesoils from the bare microplots subjected to various rain-fall and slope variables is extremely high (r = 0.997, Fig.1), These data are averages for the three P levels as inTables 3 and 4. The high correlation between the total Premoved and quantity of soil eroded strongly emphasizesthe fact that if soil erosion is halted, movement of P fromthe soil surface is also essentially stopped.
The phosphate concentration of the eroded soil materialincreased with rate of P application on all three soilsstudied (Table 5). The increases in sediment total P fromthe 25 to 625 /tgP/g rates are 576, 550, and 444 /ig/Psoil for the Rossmoyne, Toledo, and Wauseon soils, re-spectively. Thus, eroded sediments from the Rossmoyne,Toledo, and Wauseon soils accounted for 95, 92, and 74%of the 600 MgP/g added between the 25 and 625 jugP/gsoil applications. The increasing quantity of P unaccountedfor in the solids of the Rossmoyne, Toledo, and Wauseonsoils (5, 8, and 26%) is a consequence of greater quanti-ties of P remaining soluble in the respective soils.
With few exceptions, the concentrations of P in the run-off from the microplots were higher than those in theleachate (Table 6). Also, the concentration of P in therunoff of the bare plots exceeded those of the cropped
Eroded Soil (g/microplot)
Fig. 1—Total P removed by erosion vs. eroded soil in runoffwith various rainfall and slope variables. (Average of thethree phosphate levels for each soil.)
plots in the Rossmoyne and Toledo soils, but not in theWauseon. On the other hand, the concentrations of P in theleachate of the cropped plots generally exceeded those inthe leachate of the bare plots in all three soils. When thegreater amounts of leachate from the cropped plots areconsidered (Table 2), it is evident that much more P movedthrough the soils when cropped than when bare. Thisgreater leaching of P from cropped soil is a consequence ofthe closed systems whereby crop obstruction decreased run-off and thus caused more water to penetrate the soil.
Uniform mixing of the P with the soil accounts for rela-tively high concentrations of P in the leachate. Both magni-tudies of P leached and greater leaching from cropped soilsare unique to the conditions of this study. They differ fromfield conditions where: (i) subsurface soil horizons lowin soluble P insolubilize P moving down and filter colloidalparticles from percolating water irrespective of surface con-ditions (Black, 1970) and (ii) the crop takes up water andP leaving the soil drier and less subject to percolation ofwater and hence less subject to P leaching than bare soil.The data for the Wauseon soil were affected by late-devel-oping algal growth which decreased' the penetration ofwater on some plots of this soil.
It will be noted that the concentrations of P in the run-off from the microplots, especially at the higher rates of Papplication (Table 6), are in excess of those considerednecessary for algal bloom in lake water. For example, Tay-lor (1967) reported algal growth to be severely limitedbelow 0.01 ppm P and that the potential for profusegrowth occurred when P concentration exceeded 0.05 ppm(iUgP/ml). Hence runoff water from soils under conditionssuch as those of this study would certainly appear to be amajor factor in the eutrophication of empounded waters.
Fractionation of P in eroded solids by a modified Changand Jackson procedure indicated that the inorganic frac-tions and their increases with rate of P application are aconsequence of the chemical properties of the original soils(Table 7). Data for the original soils (unincubated and

MUNN ET AL.: SOIL AND P MOVEMENT UNDER SIMULATED RAINFALL CONDITIONS 431
Table 6—Soluble inorganic phosphorus concentrations in run-off and leachate from the various microplots of soils bare
and cropped
Soil
Rossmoyne
Toledo
Wauseon
Rate of Papplication(igP/g soil
25125625
25125625
25125625
BareRunoff
0.0130.0490.5990.0180.0140.5540.0980.3320.523
microplotsLeachate
0.0110.0160.1080.0080.0070.1030.0080.0090.047
CropptRunoff
0.0160.0770.3300.0110.0070.3280.1950.4710.702
3d microplotsLeachate
0.0100.0110.6150.0110.0130.3990.0150.0830.214
* Average for two duplicated and the five sequential rains.
Table 7—Inorganic P fractions in the sediments at three ratesof F application
P extractedSoil
Rossmoyne
Toledo
Wauseon
P applied
Original sollt25
125625
Original soil25
125625
Original soli25
125625
NH.C1
3127
4034
139328
114118318
NH4P
365573
201233868
177183163189293
NaOH
9415621627672
107198283148135170182
H2S04
447276
140270156194236371262293289
Total
177295372657368305473789705674770
1,082* Averages for all replications and combinations of slope, rainfall, and soil cover.* Not a Zero P treatment, this is the P fractlonatlon of the soil as collected from thefield.
uncropped) are shown for comparison. The Rossmoyne, pH5.6 and highest in extractable Fe and Al, had a predomi-nance of NH4F- and NaOH-extractable P. The Wauseon,pH 7.5, 93% base saturated, and lowest in extractable Feand Al, was the highest in total P, in H2SO4-extractable P,and in Bray PI available P (Table 1) before the additionof superphosphate. With the addition of P the Wauseonshowed a large increase in the NH4C1- and NH4F-extract-able P fractions and exhibited the lowest capacity of thethree soils to sorb phosphates. The retention of phosphateby the same soils in column-leaching studies was found tofollow the order Rossmoyne > Toledo > Wauseon byLogan (T. J. Logan, 1971. The effects of phosphorus appli-cation rate, soil properties, and mode of leaching on themass movement and diffusion of applied phosphate in soilcolumns. Ph.D. Diss., The Ohio State University, Colum-bus). The Toledo, pH 6.8, was intermediate in extractableFe and Al. Sodium hydroxide- and NH4F-extractable Pwere the dominant fractions formed in this soil uponaddition of P.
The organic phosphorus in the eroded soils exhibited nosignificant change in quantity (at the 5% level) with rateof P application. The average levels of organic P, averagedfor the three rates of P application, were 300, 260, and 200/j.gP/g soil for the Rossmoyne, Toledo, and Wauseon soils,respectively.
The wheat crop did not exhibit a significant yield re-sponse to the increased rates of P application. There was anincrease in P concentration and total P content of the wheatwith rate of P application for each soil. A high correlation(r = 0.89) was found between P concentration in thewheat leaves and Bray PI available P in the soil sampledafter sprinkling was completed.
Finally, it should be stated that considerable cautionmust be used in the extrapolation of results of this kind tofield conditions. However, since the simulated rainfall andmicroplot technique employed in this study gave resultsthat are in general agreement with data reported from fieldplot studies, it seems fair to suggest that this may be a use-ful technique for investigation of nutrient movement byerosion and leaching under specified conditions. Numerousvariations in rainfall and slope conditions, placement andform of element, and type of cover might well be investi-gated by this technique. Also, the method should be readilyadaptable for using isotope labeling. Limited experience sofar indicates that problems associated with mechanicalmovement of the isotope-labeled soil during establishmentand growth of the plants exceed that associated with thesimulated rainfall per se.