effect of socio-economic variables on of computer literacy among university students
DESCRIPTION
Computer literacy is defined as the understanding of computer characteristics, capabilities, applications, as well as an ability to implement the skillful knowledge of computers. This present study is based on the small sample survey of Rajasthan university students and employees regarding the computer knowledge. A statistical analysis of socio-economic variables like sex (male & female), standard of education under graduate and post graduate, financial conditions and caste affecting the computer literacy of students is done. In this paper the whole study is based on primary data obtained by filling of questionnaireTRANSCRIPT
DOI: 10.15415/mjis.2013.12017
Mathematical Journal of Interdisciplinary Sciences
Vol. 1, No. 2, March 2013 pp. 97–102
©2013 by Chitkara University. All Rights
Reserved.
Effect of Socio-Economic Variables on of Computer Literacy Among University Students
Yogendar Kumar Verma
Department of Statistics, University of Rajasthan Jaipur, India
Email: [email protected]. in
Dr. Anil Kumar Bhardwaj
Department of Statistics, University of Rajasthan Jaipur, India
Email: [email protected]
Abstract
Computer literacy is defined as the understanding of computer characteristics, capabilities, applications, as well as an ability to implement the skillful knowledge of computers. This present study is based on the small sample survey of Rajasthan university students and employees regarding the computer knowledge. A statistical analysis of socio-economic variables like sex (male & female), standard of education under graduate and post graduate, financial conditions and caste affecting the computer literacy of students is done. In this paper the whole study is based on primary data obtained by filling of questionnaire
Keywords: literacy, computer literacy, ANOVA, t-statistic, Normal test, questionnaire.
IntroDUCtIon
For the study of assessment of computer literacy among the university students, a statistical questionnaire is developed by the staff members of statistics, in which 12 questions are related with socio-economics
and demographic variables of a student. 25 questions are constructed for the assessment of computer literacy among the university students.
It is fact that all the university students are either graduate or passed Ist year classes from the different faculties. For our study the above students are considered as our population. From this population, a sample of 283 students are taken as sample for our study.
These 283 students are of different classes and different faculties as well as male and female. Data are collected through unstructured questionnaire. The questionnaire we prepared by group of experts of the department. The coding of the questions are made and validity of questionnaire is taken into consideration. The reliability of the questionnaire is also calculated by cronbach`s Alpha, Guttmann, split half, coefficient which are 0.765 and 0.752 respectively.
Verma, Y. K. Bhardwaj, A. K.
98
Mathematical Journal of Interdisciplinary Sciences, Volume 1, Number 2, March 2013
After calculating the reliability of tools, the data is edited and then tabulated in the form of a 283X37 matrix.
1 Analysis of knowledge of computer literacy according to sex
In the data, total no. of male are taken 182 and female are 101.Since in the University, number of male students are more then female students, so the males are taken more then females in the samples. The total score of male is 3543 and total score of females is 1745. The mean score for male 19.46 and mean sore for female is 17.27.
For comparison regarding the whole university the null hypothesis is taken as there is no significance different of the knowledge of computer literacy between male and female or
0 1 2:Η µ = µ
Where H0 represent the notation of null hypothesis and µ
1is the knowledge
of computer literacy of male and µ2 is the
knowledge of computer literacy of
female. The alternative hypothesis is H1: µ
1≠ µ
2, where H
1 denotes alternative
hypothesis. It is fact that our data is considered as large sample data so; Z test is applied for comparison between two population means. By using the formula of Z statistics is
x y S n n√− −Ζ= − +21 2( ) / (1 / 1 / )
where x– is the mean score of computer literacy of male,
y– is the mean score of computer literacy of female.
S n n x x y y− −= + − ∑ − +∑ −2 2 21 2 1 11 / ( 2)[ ( ) ( ) ]
n1 and n
2 are two sample sizes of male and female.
The calculated value of Z is 26.155 and the tabulated value of Z at 5% level of significance is 1.96. Since calculated value Z is greater than the tabulated value of Z, so we reject the null hypothesis at 5% level of significance. Hence it is calculated that there is a significant difference between male and female regarding the computer literacy.
2. Analysis of knowledge of computer literacy according to UG and PG level
In the data, total no. of UG students are taken 122 and PG students are 161. The total score of UG students is 2316 and total score of PG students is 2972.
Effect of Socio-econimic variables
on of Computer Literacy among
university Students
99
Mathematical Journal of Interdisciplinary Sciences, Volume 1, Number 2, March 2013
The mean score for UG students is 18.98 and mean sore for PG students is 18.45.
For comparison regarding the whole university students null hypothesis is taken as there is no significance different of the knowledge of computer literacy between UG students and PG students.
0 1 2:Η µ = µ
Where µ1is the knowledge of computer literacy of UG students and µ
2 is the
knowledge of computer literacy of PG students. The alternative hypothesis is H
1:µ
1≠ µ
2. It is fact that our data is considered as large sample data so; Z test
is applied for comparison between two population means.The calculated value of Z is 0.488 and the tabulated value of Z at 5% level
of significance is 1.96. Since calculated value Z is smaller than the tabulated value of Z, so we accept the null hypothesis at 5% level of significance. Hence it is concluded that there is no significant difference between UG students and PG students regarding the computer literacy.
3. Analysis of knowledge of computer literacy according to Income tax Payee and non Payee level
In the data, total number of students belonging to Income tax payee parents is taken 98 and Income tax non payee parents are 185. Since in the University, number of students belonging to Income tax non payee parents are more then Income tax payee parents, so the sample are taken almost in the proportional ratio. The total score of Income tax non payee parents of students is 3465 and total score of Income tax payee parents of students is 1813. The mean score these students are 18.72 and 18.5 respectively.
For comparison regarding the whole university the null hypothesis is taken as there is no significance different of the knowledge of computer literacy between students of families and students of Income tax non payee families. The null hypothesis taken is
0 1 2:Η µ = µ against the alternative
1 1 2:Η µ ≠ µ
µ1is the knowledge of computer literacy of students belonging to Income
tax payee families and µ2
is the knowledge of computer literacy of students
belonging to non Income tax payee families. It is fact that our data is considered as large sample data so; Z test is applied for comparison between two population means.
Verma, Y. K. Bhardwaj, A. K.
100
Mathematical Journal of Interdisciplinary Sciences, Volume 1, Number 2, March 2013
The calculated value of Z is 4.3815 and the tabulated value of Z at 5% level of significance is 1.96. Since calculated value Z is greater than the tabulated value of Z, so we reject the null hypothesis at 5% level of significance. Hence it is concluded that there is a significant difference between Income tax payee parents of students and Income tax payee parents of students regarding the computer literacy.
4 Analysis of knowledge of computer literacy according to Caste
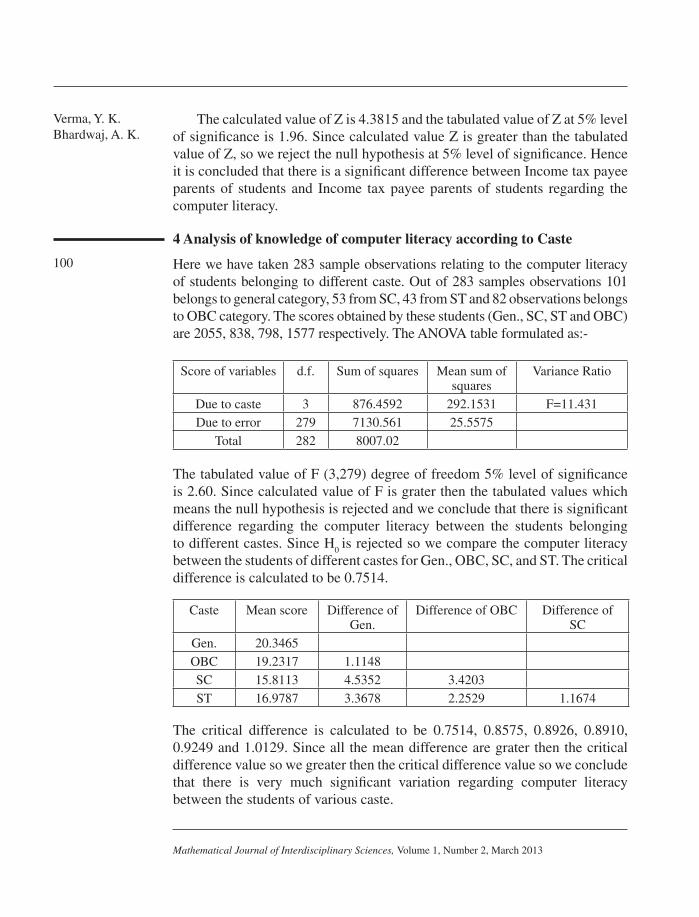
Here we have taken 283 sample observations relating to the computer literacy of students belonging to different caste. Out of 283 samples observations 101 belongs to general category, 53 from SC, 43 from ST and 82 observations belongs to OBC category. The scores obtained by these students (Gen., SC, ST and OBC) are 2055, 838, 798, 1577 respectively. The ANOVA table formulated as:-
Score of variables d.f. Sum of squares Mean sum of squares
Variance Ratio
Due to caste 3 876.4592 292.1531 F=11.431Due to error 279 7130.561 25.5575
Total 282 8007.02
The tabulated value of F (3,279) degree of freedom 5% level of significance is 2.60. Since calculated value of F is grater then the tabulated values which means the null hypothesis is rejected and we conclude that there is significant difference regarding the computer literacy between the students belonging to different castes. Since H
0 is rejected so we compare the computer literacy
between the students of different castes for Gen., OBC, SC, and ST. The critical difference is calculated to be 0.7514.
Caste Mean score Difference of Gen.
Difference of OBC Difference of SC
Gen. 20.3465OBC 19.2317 1.1148SC 15.8113 4.5352 3.4203ST 16.9787 3.3678 2.2529 1.1674
The critical difference is calculated to be 0.7514, 0.8575, 0.8926, 0.8910, 0.9249 and 1.0129. Since all the mean difference are grater then the critical difference value so we greater then the critical difference value so we conclude that there is very much significant variation regarding computer literacy between the students of various caste.
Effect of Socio-econimic variables
on of Computer Literacy among
university Students
101
Mathematical Journal of Interdisciplinary Sciences, Volume 1, Number 2, March 2013
ConCLUSIonS
The present study is based on the primary data collected from the Rajasthan university students and employees belonging to different socio-economic conditions. It is observed from the analysis of the data that factors like sex, financial condition level of education and caste play a dominating factor on the computer literacy of the students. The result show that the computer literacy rate of male students is high than that of female students. Students belonging to general caste and better financial background families show highly computer literacy rate than others.
rEfErEnCES
Idowu, B., Adagunodo, R., & Idowu, B. (2004). Gender difference in computer literacy among Nigerian undergraduate students: A case study of Obafemi Awolowo University students, Nigeria. The African Symposium: An Online Educational Research Journal 4,(3).
Lynch, C. (1998). Information literacy and information technology literacy: New components in the curriculum for a digital culture. Coalition for Networked Information.
Tella, A., & Mutula, S.M. (2008). Gender difference in computer literacy among undergraduate students at the University of Botswana: implication for library use. Malaysian Journal of Library & Information Science 13 (1): 59-76. www.collegeeducation.rajasthan.gov.in.
Yogendar Kumar Verma, Research Scholar, Department of Statistics, University of Rajasthan Jaipur, India
Dr. Anil Kumar Bhardwaj, Assistant Professor, Department of Statistics, University of Rajasthan Jaipur, India
