effect of salinity on water stress, growth and yield of...
TRANSCRIPT
Effect of salinity on water stress, growth and yield of broadbean
Katerji N., van Hoorn I.W., Hamdy A., Bouzid N., El Sayed Mahrous S., Mastrorilli M.
in
Katerji N. (ed.), Hamdy A. (ed.), van Hoorn I.W. (ed.), Mastrorilli M. (ed.). Mediterranean crop responses to water and soil salinity: Eco-physiological and agronomicanalyses
Bari : CIHEAMOptions Méditerranéennes : Série B. Etudes et Recherches; n. 36
2002pages 1-15
Article available on line / Article disponible en ligne à l’adresse :
--------------------------------------------------------------------------------------------------------------------------------------------------------------------------
http://om.ciheam.org/article.php?IDPDF=5002167
--------------------------------------------------------------------------------------------------------------------------------------------------------------------------
To cite th is article / Pour citer cet article
--------------------------------------------------------------------------------------------------------------------------------------------------------------------------
Katerji N., van Hoorn I.W., Hamdy A., Bouzid N., El Sayed Mahrous S., Mastrorilli M. Effect of salin ity
on water stress, growth and yield of broadbean. In : Katerji N. (ed.), Hamdy A. (ed.), van Hoorn I.W.
(ed.), Mastrorilli M. (ed.). Mediterranean crop responses to water and soil salinity: Eco-physiological and
agronomic analyses. Bari : CIHEAM, 2002. p. 1-15 (Options Méditerranéennes : Série B. Etudes et
Recherches; n. 36)
--------------------------------------------------------------------------------------------------------------------------------------------------------------------------
http://www.ciheam.org/http://om.ciheam.org/
Options Méditerranéennes Série B n. 36
Effect of salinity on water stress,growth and yield of broadbeans
N. Katerji,1 J.W. van Hoorn2, A. Hamdy3, N. Bouzid4,S. El-Sayed Mahrous3 and M. Mastrorilli4
Agricultural Water Management, 21 (1992)107-117
AbstractKaterji, N., van Hoorn, J.W., Hamdy, A., Bouzid, N., EI-Sayed Mahrous,and Mastrorilli, M., 1992. Effect of salinity on water stress, growth andyield of broadbeans.
Broadbeans were grown on clay in tanks and irrigated with waterof three different levels of salinity. During the experiment, soilsalinity, determined from the salt balance and soil water samples,showed a gradual increase. The water stress of the broadbeanswas determined by measuring the predawn leaf water potential,the stomatal conductance and the differences in radiationtemperature between the treatments. Growth was measured asleaf area and dry-matter production and, finally, the yield and itscomponents were determined. The three water stress parametersand the two growth parameters showed good coherence, with allparameters indicating systematic differences between the salinetreatments and the control. At increasing salinity water potential ofthe leaf and the stomatal conductance decreased, the difference in
1 INRA, Station de Bioclimatologie, Thiverval-Grignon, France2 Department of Hydrology, Soil Physics and Hydraulics, Agricultural University Wageningen,
Netherlands3 Istituto Agronomico Mediterraneo, Valenzano (Bari), Italy4 Istituto Sperimentale Agronomico, Bari, ItalyCorrespondence to: J.W. van Hoorn, Dept. of Hydrology, Soil Physics and Hydraulics,Agricultural University Wageningen, The Netherlands.
Effect of salinity on water stress, growth and yield of broadbeans
Options Méditerranéennes Série B n. 362
radiation temperature increased, and the leaf area, dry matterproduction and yield were reduced.
Introduction
The salinity of irrigation water as a cause of yield reduction has been thesubject of many investigations. The salinity effect seems to depend alsoon other factors such as soil properties, climate, cultural practices andwater management. Whereas many data are available with regard to theeffect of salinity on crop yield, a great deal less is known about thephysiological processes during growth. Studies concerning the effect oncrop yield are generally not combined with studies on crop physiology,the first group being conducted in the field and the second mainly inthe laboratory. The salinity effect on the water stress of the plant, itsgaseous exchanges and its metabolism has been analysed over shortperiods (see for example Osmond and Greenway, 1972; Longstreth andStrain, 1977; Passera and Albuzio, 1978; Walker et al., 1983; Yeo et al.,1985; West et al., 1986; Bowman and Strain, 1987). This paper presentsthe results of a study on broadbeans in which the observations of theeffect of salinity on the water stress of plants are combined withobservations on growth and yield, in order to arrive at a betterunderstanding of their salt tolerance.
Experimental procedure
Set-up
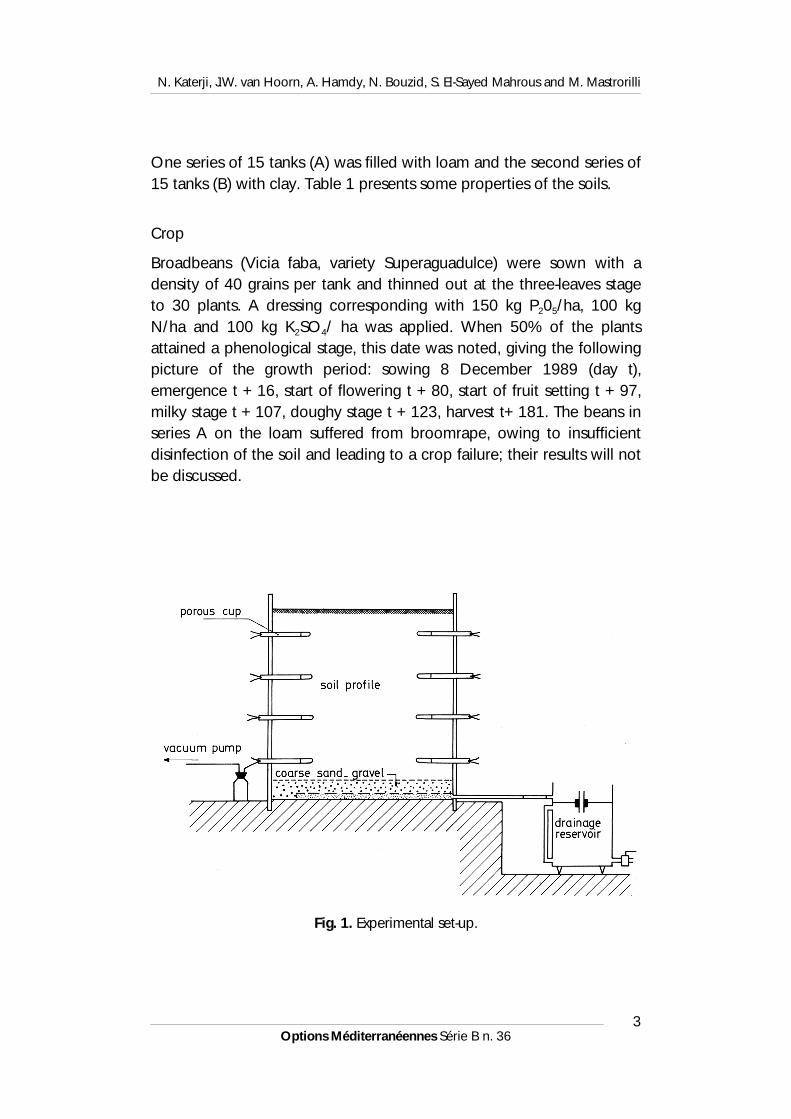
The experiment was conducted at the Mediterranean AgronomicInstitute of Bari in southern Italy from December 1989 till June 1990.The set-up consisted of 30 tanks of reinforced fibre glass with adiameter of 1.20 m and a depth of 1. 20 m. A layer of coarse sand andgravel, 0. 10 m thick, was covered by a repacked soil profile of 1 m. Atthe bottom of the tank a pipe serving as drainage outlet connected thetank with a drainage reservoir (Fig. 1). The set-up was covered at aheight of 4 in by a sheet of transparent plastic to protect the assemblyagainst precipitation.
N. Katerji, J.W. van Hoorn, A. Hamdy, N. Bouzid, S. El-Sayed Mahrous and M. Mastrorilli
Options Méditerranéennes Série B n. 363
One series of 15 tanks (A) was filled with loam and the second series of15 tanks (B) with clay. Table 1 presents some properties of the soils.
Crop
Broadbeans (Vicia faba, variety Superaguadulce) were sown with adensity of 40 grains per tank and thinned out at the three-leaves stageto 30 plants. A dressing corresponding with 150 kg P205/ha, 100 kgN/ha and 100 kg K2SO4/ ha was applied. When 50% of the plantsattained a phenological stage, this date was noted, giving the followingpicture of the growth period: sowing 8 December 1989 (day t),emergence t + 16, start of flowering t + 80, start of fruit setting t + 97,milky stage t + 107, doughy stage t + 123, harvest t+ 181. The beans inseries A on the loam suffered from broomrape, owing to insufficientdisinfection of the soil and leading to a crop failure; their results will notbe discussed.
Fig. 1. Experimental set-up.
Effect of salinity on water stress, growth and yield of broadbeans
Options Méditerranéennes Série B n. 364
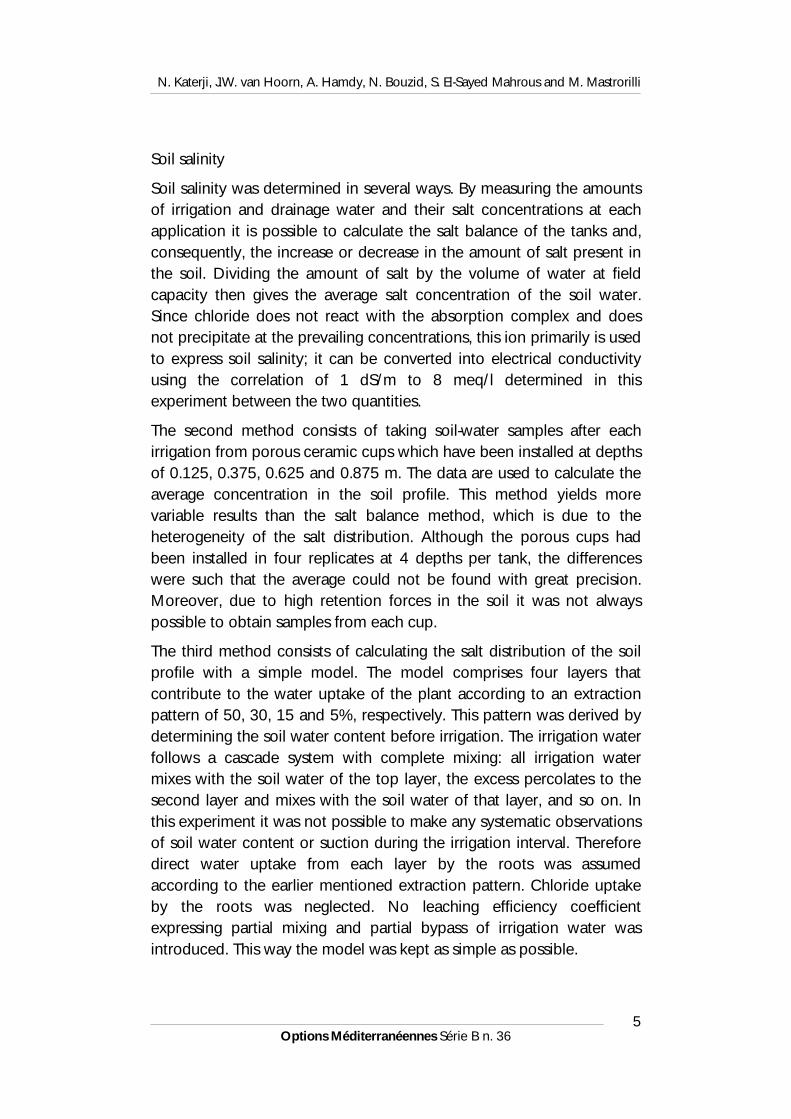
Irrigation
Series B, consisting of 15 tanks filled with clay, was divided into threegroups of five tanks and irrigated with water of three different qualities:local fresh water with an EC of 0.9 dS/m as a control (treatment C), andtwo kinds of saline water (treatments S2 and S4) with EC values of 2.1and 4 dS/m, obtained by adding NaCI, CaCl2 and MgSO4 to freshwater. Table 2 presents the composition of the water used for irrigation.
At the start of the experiment fresh water was applied to all treatments2 days after sowing so as to bring the soil water content up to fieldcapacity. Afterwards different kinds of water were applied. At eachirrigation surplus water was added in order to provide leaching. Theaverage leaching fraction was about 0.2.
Table 1
Soil properties
Soil Particle size in % of mineral parts CaC03
(%)% water(v/v)
Bulk density(kg/dm3)
mµ2< mµ502 − mµ50> pF2.0 pF4.2
Loam 19 49 32 25 36.3 20.4 1.45
Clay 47 37 16 5 42.0 24.0 1.45
Table2
Composition of irrigation waters (meq/1)
Treatment Ca 2+ Mg 2+ Na+ K+ Cl- −3HCO −2
4SO EC (dS/m) SAR
C 6.5 3.5 2.9 0.1 3.8 8.0 1.3 0.9 1.3
S2 10.0 5.0 8.9 0.3 13.8 8.0 2.4 2.1 3.2
S4 18.0 6.0 15.1 0.3 30.0 8.0 1.4 4.0 4.4
N. Katerji, J.W. van Hoorn, A. Hamdy, N. Bouzid, S. El-Sayed Mahrous and M. Mastrorilli
Options Méditerranéennes Série B n. 365
Soil salinity
Soil salinity was determined in several ways. By measuring the amountsof irrigation and drainage water and their salt concentrations at eachapplication it is possible to calculate the salt balance of the tanks and,consequently, the increase or decrease in the amount of salt present inthe soil. Dividing the amount of salt by the volume of water at fieldcapacity then gives the average salt concentration of the soil water.Since chloride does not react with the absorption complex and doesnot precipitate at the prevailing concentrations, this ion primarily is usedto express soil salinity; it can be converted into electrical conductivityusing the correlation of 1 dS/m to 8 meq/ l determined in thisexperiment between the two quantities.
The second method consists of taking soil-water samples after eachirrigation from porous ceramic cups which have been installed at depthsof 0.125, 0.375, 0.625 and 0.875 m. The data are used to calculate theaverage concentration in the soil profile. This method yields morevariable results than the salt balance method, which is due to theheterogeneity of the salt distribution. Although the porous cups hadbeen installed in four replicates at 4 depths per tank, the differenceswere such that the average could not be found with great precision.Moreover, due to high retention forces in the soil it was not alwayspossible to obtain samples from each cup.
The third method consists of calculating the salt distribution of the soilprofile with a simple model. The model comprises four layers thatcontribute to the water uptake of the plant according to an extractionpattern of 50, 30, 15 and 5%, respectively. This pattern was derived bydetermining the soil water content before irrigation. The irrigation waterfollows a cascade system with complete mixing: all irrigation watermixes with the soil water of the top layer, the excess percolates to thesecond layer and mixes with the soil water of that layer, and so on. Inthis experiment it was not possible to make any systematic observationsof soil water content or suction during the irrigation interval. Thereforedirect water uptake from each layer by the roots was assumedaccording to the earlier mentioned extraction pattern. Chloride uptakeby the roots was neglected. No leaching efficiency coefficientexpressing partial mixing and partial bypass of irrigation water wasintroduced. This way the model was kept as simple as possible.
Effect of salinity on water stress, growth and yield of broadbeans
Options Méditerranéennes Série B n. 366
The calculated salt distribution after irrigation can be compared with thedistribution obtained from the soil water samples, and the average saltconcentration of the soil profile can be compared with theconcentrations obtained from the other two methods.
Water stress of the plant
To characterize the water stress of the plant three parameters wereused: the predawn leaf-water potential, the stomatal conductance andthe difference in radiation temperature between the saline treatmentsand the control.
The first parameter is measured when equilibrium between soil andplant is approached, whereas the two other parameters are indicatorsfor the actual water supply of the plant under dynamic conditions ofhigh water stress, e.g., around midday solar time in bright sunshine(Katerji et al., 1987).
The predawn leaf-water potential was determined at dawn beforesunrise on leaves of the upper part of the canopy. At eachdetermination, 10 leaves per treatment, equally distributed over the 5tanks, were taken and the potential was immediately measured in apressure chamber at the experimental setup.
The stomatal resistance was always determined at midday with adiffusion porometer, also on the 10 leaves for each treatment equallydistributed over the 5 tanks.
The difference in radiation temperature between the treatments wasdetermined at midday by 10 measurements equally distributed over 5tanks of each treatment, using a portable radiation thermometer withdirect reading (Mikron1). In order to avoid the effect of soil temperature,the angle of incidence of the instrument was about 300 and allmeasurements were done in the same direction with respect to the sun.
All measurements were made at intervals of about 5 days, from day t +62 until harvest, although not always at the same day.
1Trade names are given for the benefit of the reader and do not imply endorsement orpreferential treatment of the product by the authors and their institutions.
N. Katerji, J.W. van Hoorn, A. Hamdy, N. Bouzid, S. El-Sayed Mahrous and M. Mastrorilli
Options Méditerranéennes Série B n. 367
Growth and yield
The leaf area and dry matter were determined on all treatments at thefollowing phenological stages: 3 leaves, flowering, fruit setting, doughystage, 27 leaves and drying of pods. For these parameters 10 plants,equally distributed over the 5 tanks of each treatment, were first takenfor measuring the leaf area with the apparatus "LAH-Licor 1300" andthen for measuring the dry matter by drying at 80°C for 24 hours.
The yield was determined as the average grain production of the 5tanks. Besides the total yield, the following yield components weremeasured on 30 plants per treatment: the number and weight of podsper plant and the number and weight of grains per plant.
Statistical treatment
Significant differences in the development of the parameters and theplants between the various treatments were determined from theaverage values at 0.05 and 0.01 confidence levels.
Experimental results
Soil salinity
Table 3 presents the average chloride concentration of soil water of thelayer 0-100 cm found from the three methods described previously. Theconcentration increases during the irrigation season, as can be expectedwhen a non-saline soil is irrigated with saline water. The three methodsyield quite similar results, only the concentration of the soil watersamples of treatment S4 from 28 April onwards remained lower thanthose indicated by the other methods.
The chloride concentration of a solution can be converted into electricalconductivity (EC, dS/m) by dividing the chloride concentration (inmeq/ l) by 8 and into the electrical conductivity of the saturation extract(ECe dS/m) by dividing the concentration by 16, assuming that EC of soilwater equals 2×ECe (Ayers and Westcot, 1985). So the average valuesof 21.2 and 38.2 meq/ l correspond with ECe values of 1.3 and 2.4 dS/m,respectively.
Effect of salinity on water stress, growth and yield of broadbeans
Options Méditerranéennes Série B n. 368
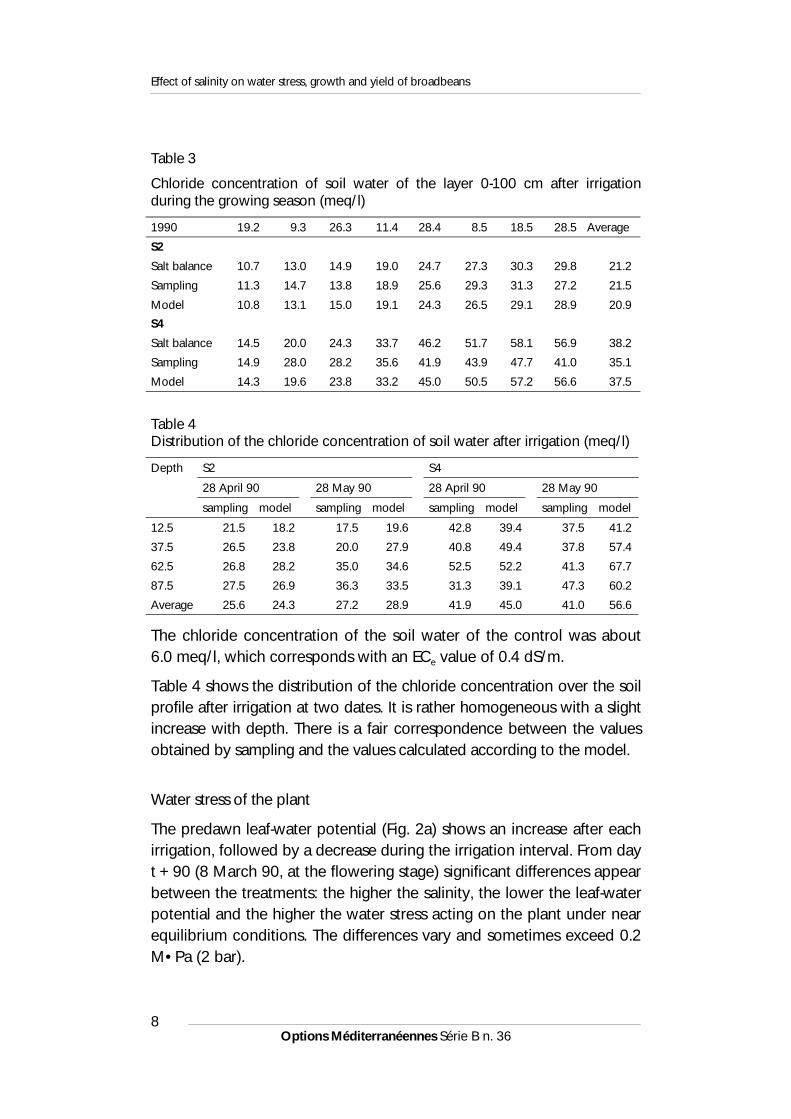
Table 3
Chloride concentration of soil water of the layer 0-100 cm after irrigationduring the growing season (meq/ l)
1990 19.2 9.3 26.3 11.4 28.4 8.5 18.5 28.5 Average
S2
Salt balance 10.7 13.0 14.9 19.0 24.7 27.3 30.3 29.8 21.2
Sampling 11.3 14.7 13.8 18.9 25.6 29.3 31.3 27.2 21.5
Model 10.8 13.1 15.0 19.1 24.3 26.5 29.1 28.9 20.9
S4
Salt balance 14.5 20.0 24.3 33.7 46.2 51.7 58.1 56.9 38.2
Sampling 14.9 28.0 28.2 35.6 41.9 43.9 47.7 41.0 35.1
Model 14.3 19.6 23.8 33.2 45.0 50.5 57.2 56.6 37.5
Table 4Distribution of the chloride concentration of soil water after irrigation (meq/ l)
Depth S2 S4
28 April 90 28 May 90 28 April 90 28 May 90
sampling model sampling model sampling model sampling model
12.5 21.5 18.2 17.5 19.6 42.8 39.4 37.5 41.2
37.5 26.5 23.8 20.0 27.9 40.8 49.4 37.8 57.4
62.5 26.8 28.2 35.0 34.6 52.5 52.2 41.3 67.7
87.5 27.5 26.9 36.3 33.5 31.3 39.1 47.3 60.2
Average 25.6 24.3 27.2 28.9 41.9 45.0 41.0 56.6
The chloride concentration of the soil water of the control was about6.0 meq/ l, which corresponds with an ECe value of 0.4 dS/m.
Table 4 shows the distribution of the chloride concentration over the soilprofile after irrigation at two dates. It is rather homogeneous with a slightincrease with depth. There is a fair correspondence between the valuesobtained by sampling and the values calculated according to the model.
Water stress of the plant
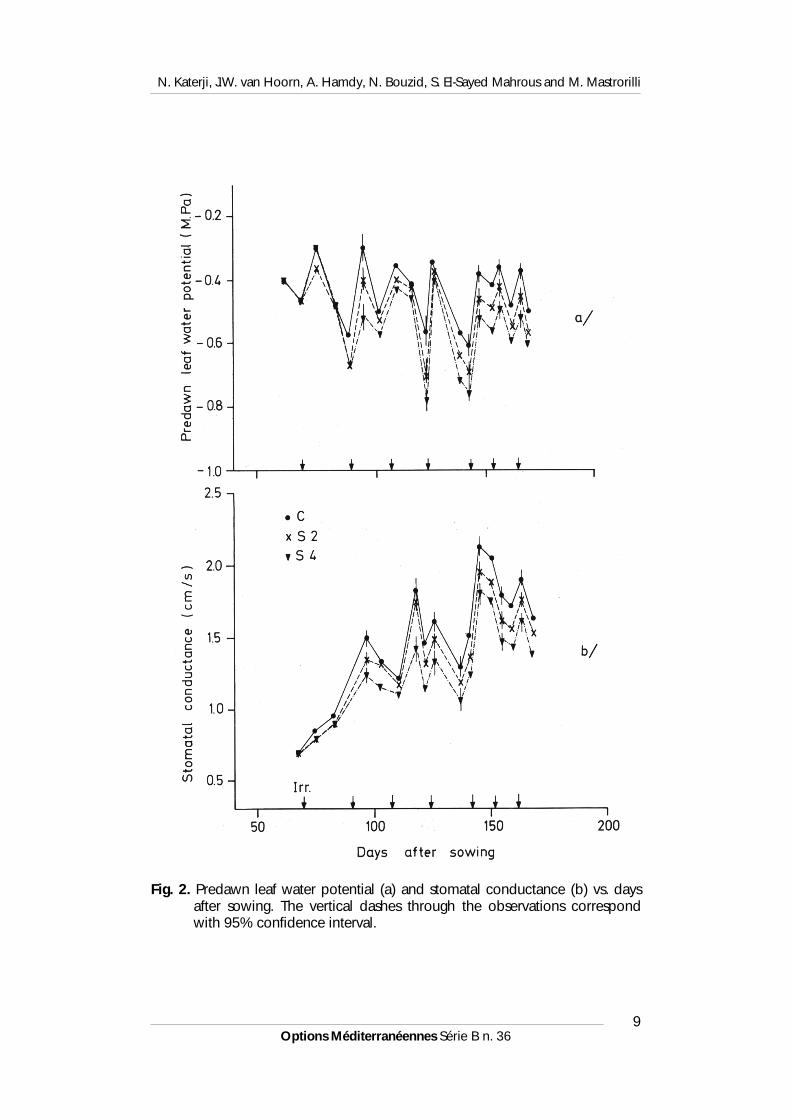
The predawn leaf-water potential (Fig. 2a) shows an increase after eachirrigation, followed by a decrease during the irrigation interval. From dayt + 90 (8 March 90, at the flowering stage) significant differences appearbetween the treatments: the higher the salinity, the lower the leaf-waterpotential and the higher the water stress acting on the plant under nearequilibrium conditions. The differences vary and sometimes exceed 0.2M• Pa (2 bar).
N. Katerji, J.W. van Hoorn, A. Hamdy, N. Bouzid, S. El-Sayed Mahrous and M. Mastrorilli
Options Méditerranéennes Série B n. 369
Fig. 2. Predawn leaf water potential (a) and stomatal conductance (b) vs. daysafter sowing. The vertical dashes through the observations correspondwith 95% confidence interval.
Effect of salinity on water stress, growth and yield of broadbeans
Options Méditerranéennes Série B n. 3610
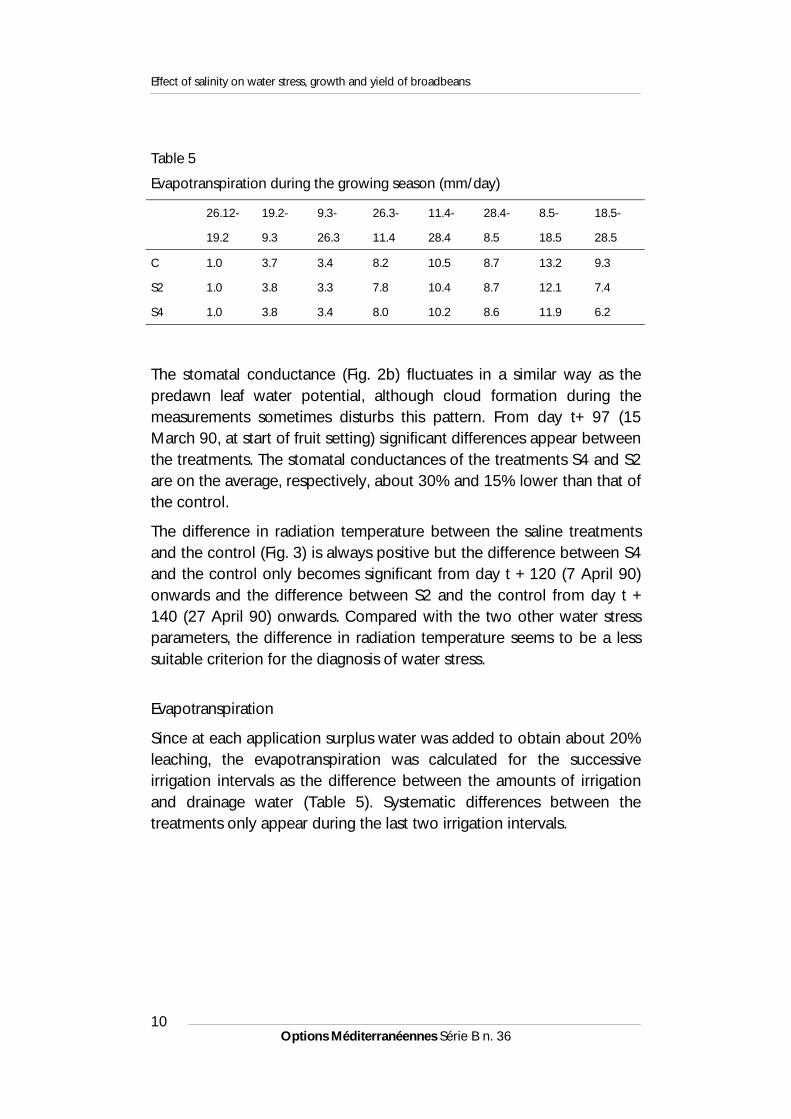
Table 5
Evapotranspiration during the growing season (mm/day)
26.12- 19.2- 9.3- 26.3- 11.4- 28.4- 8.5- 18.5-
19.2 9.3 26.3 11.4 28.4 8.5 18.5 28.5
C 1.0 3.7 3.4 8.2 10.5 8.7 13.2 9.3
S2 1.0 3.8 3.3 7.8 10.4 8.7 12.1 7.4
S4 1.0 3.8 3.4 8.0 10.2 8.6 11.9 6.2
The stomatal conductance (Fig. 2b) fluctuates in a similar way as thepredawn leaf water potential, although cloud formation during themeasurements sometimes disturbs this pattern. From day t+ 97 (15March 90, at start of fruit setting) significant differences appear betweenthe treatments. The stomatal conductances of the treatments S4 and S2are on the average, respectively, about 30% and 15% lower than that ofthe control.
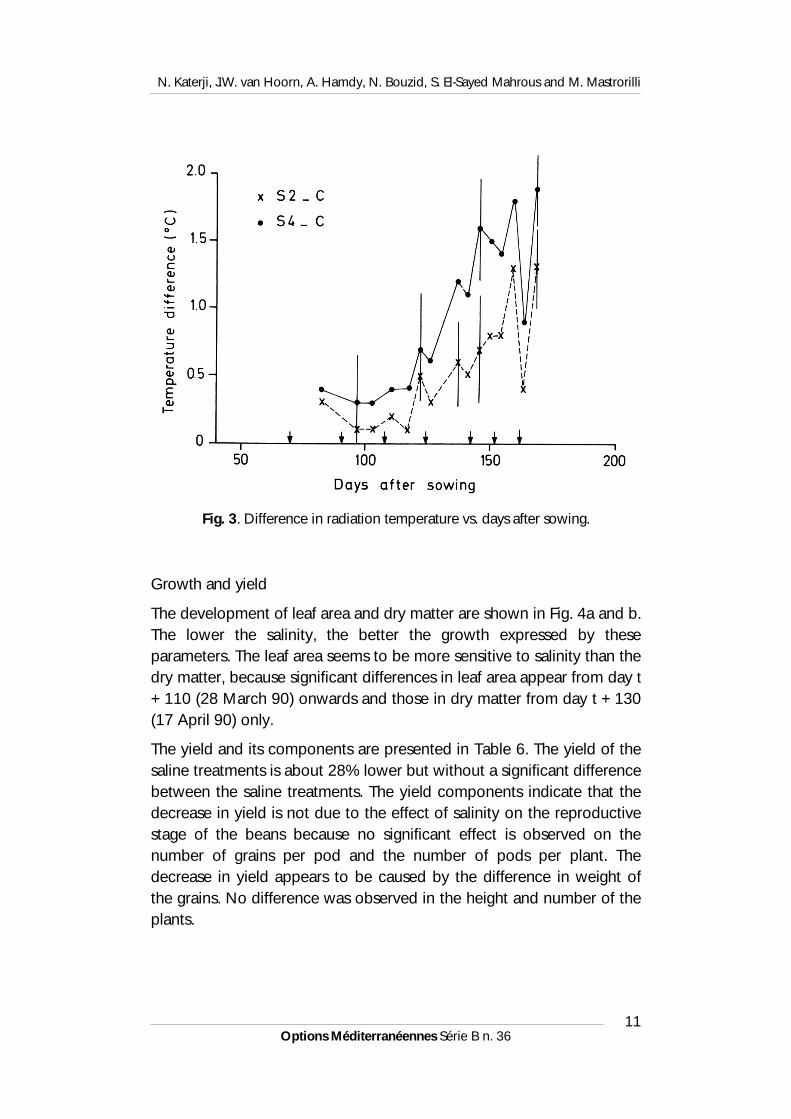
The difference in radiation temperature between the saline treatmentsand the control (Fig. 3) is always positive but the difference between S4and the control only becomes significant from day t + 120 (7 April 90)onwards and the difference between S2 and the control from day t +140 (27 April 90) onwards. Compared with the two other water stressparameters, the difference in radiation temperature seems to be a lesssuitable criterion for the diagnosis of water stress.
Evapotranspiration
Since at each application surplus water was added to obtain about 20%leaching, the evapotranspiration was calculated for the successiveirrigation intervals as the difference between the amounts of irrigationand drainage water (Table 5). Systematic differences between thetreatments only appear during the last two irrigation intervals.
N. Katerji, J.W. van Hoorn, A. Hamdy, N. Bouzid, S. El-Sayed Mahrous and M. Mastrorilli
Options Méditerranéennes Série B n. 3611
Fig. 3 . Difference in radiation temperature vs. days after sowing.
Growth and yield
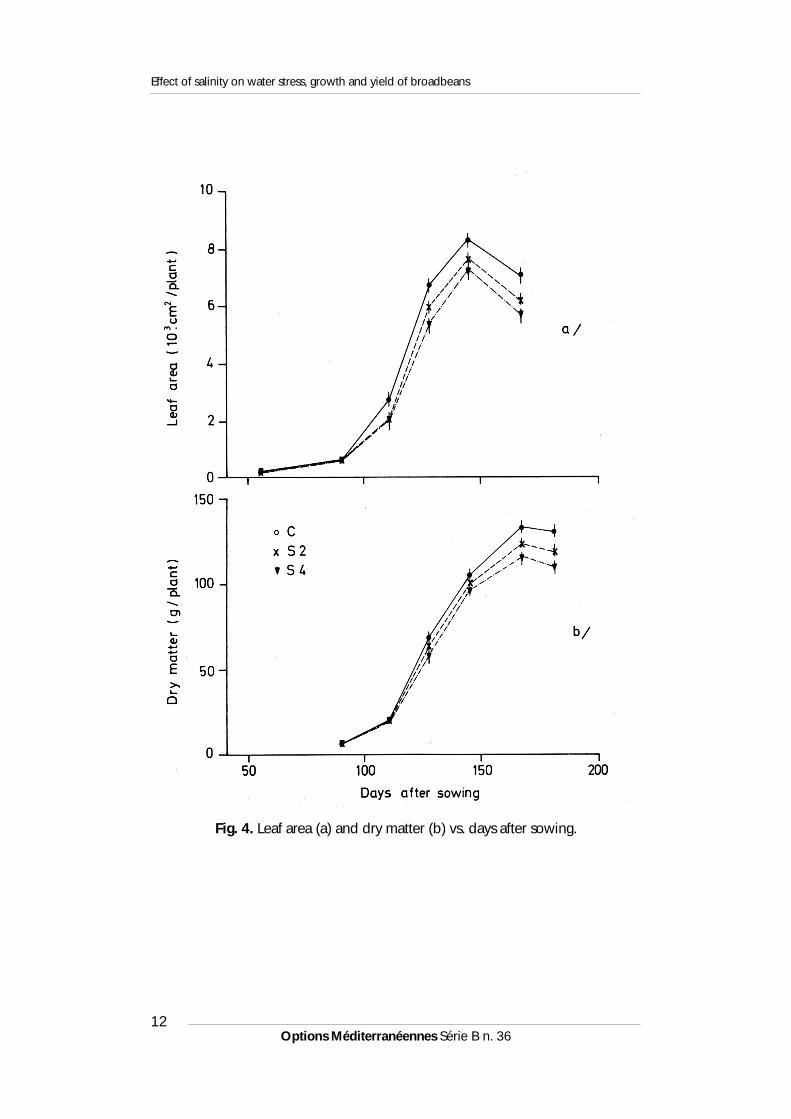
The development of leaf area and dry matter are shown in Fig. 4a and b.The lower the salinity, the better the growth expressed by theseparameters. The leaf area seems to be more sensitive to salinity than thedry matter, because significant differences in leaf area appear from day t+ 110 (28 March 90) onwards and those in dry matter from day t + 130(17 April 90) only.
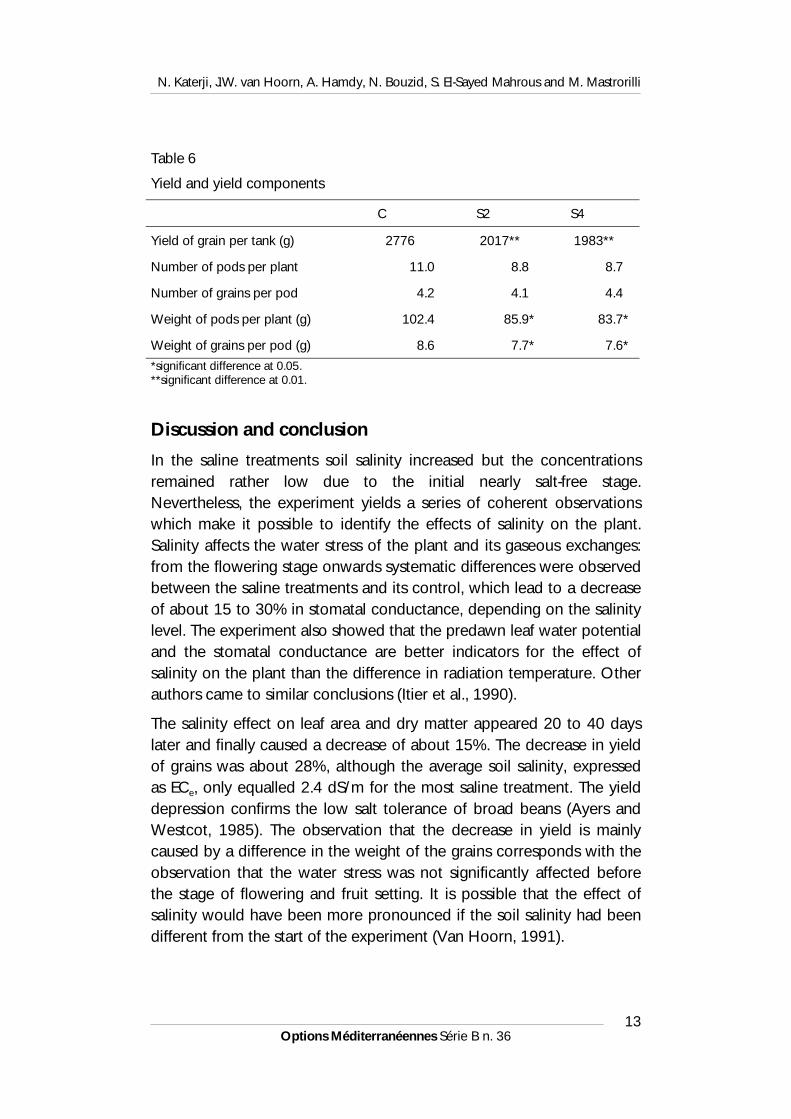
The yield and its components are presented in Table 6. The yield of thesaline treatments is about 28% lower but without a significant differencebetween the saline treatments. The yield components indicate that thedecrease in yield is not due to the effect of salinity on the reproductivestage of the beans because no significant effect is observed on thenumber of grains per pod and the number of pods per plant. Thedecrease in yield appears to be caused by the difference in weight ofthe grains. No difference was observed in the height and number of theplants.
Effect of salinity on water stress, growth and yield of broadbeans
Options Méditerranéennes Série B n. 3612
Fig. 4. Leaf area (a) and dry matter (b) vs. days after sowing.
N. Katerji, J.W. van Hoorn, A. Hamdy, N. Bouzid, S. El-Sayed Mahrous and M. Mastrorilli
Options Méditerranéennes Série B n. 3613
Table 6
Yield and yield components
C S2 S4
Yield of grain per tank (g) 2776 2017** 1983**
Number of pods per plant 11.0 8.8 8.7
Number of grains per pod 4.2 4.1 4.4
Weight of pods per plant (g) 102.4 85.9* 83.7*
Weight of grains per pod (g) 8.6 7.7* 7.6*
*significant difference at 0.05.**significant difference at 0.01.
Discussion and conclusion
In the saline treatments soil salinity increased but the concentrationsremained rather low due to the initial nearly salt-free stage.Nevertheless, the experiment yields a series of coherent observationswhich make it possible to identify the effects of salinity on the plant.Salinity affects the water stress of the plant and its gaseous exchanges:from the flowering stage onwards systematic differences were observedbetween the saline treatments and its control, which lead to a decreaseof about 15 to 30% in stomatal conductance, depending on the salinitylevel. The experiment also showed that the predawn leaf water potentialand the stomatal conductance are better indicators for the effect ofsalinity on the plant than the difference in radiation temperature. Otherauthors came to similar conclusions (Itier et al., 1990).
The salinity effect on leaf area and dry matter appeared 20 to 40 dayslater and finally caused a decrease of about 15%. The decrease in yieldof grains was about 28%, although the average soil salinity, expressedas ECe, only equalled 2.4 dS/m for the most saline treatment. The yielddepression confirms the low salt tolerance of broad beans (Ayers andWestcot, 1985). The observation that the decrease in yield is mainlycaused by a difference in the weight of the grains corresponds with theobservation that the water stress was not significantly affected beforethe stage of flowering and fruit setting. It is possible that the effect ofsalinity would have been more pronounced if the soil salinity had beendifferent from the start of the experiment (Van Hoorn, 1991).

Effect of salinity on water stress, growth and yield of broadbeans
Options Méditerranéennes Série B n. 3614
If saline water is used in agriculture, the salt tolerance of the crop mustbe known. This experiment suggests that this knowledge should besupported by a description of the physiological behaviour of the plantsin a saline environment, since this behaviour implies other variables,such as physical and chemical soil properties, climate and phenologicalstage, which may modify the reaction of the plant to salinity. In this waythe relation between physiological behaviour and yield allows a betterand more reliable analysis of the salinity effect on crop yield. Not onlydo crops differ in their salt tolerance, but also cultivars of the samespecies are known to vary in their responses. Thus, physiological testingmay be helpful in assessing such differences.
N. Katerji, J.W. van Hoorn, A. Hamdy, N. Bouzid, S. El-Sayed Mahrous and M. Mastrorilli
Options Méditerranéennes Série B n. 3615
References
Ayers, R.S. and Westcot, D.W., 1985. Water Quality for Agriculture. FAOIrrigation and Drainage Paper 29 rev. 1, Rome, 174 pp.
Bowman, W.D. and Strain, 1987. Interaction between CO2 enrichment andsalinity stress in the C4 nonhalophyte Andropogon glomeratus Walter B.S.P.Plant Cell Environ., 10: 267-270.
Itier, B., Katerji, N., Flura, D. and Ferreira, I., 1990. Relative evapotranspirationin relation to soil water deficit and predawn leaf water potential.Application to tomato crop. Acta Hortic., 278: 101-111.
Katerji, N., Itier, B., Ferreira, I. and Pereira, L.S., 1987. Water stress indicatorsfor tomato crop. Int. Conf. on Measurement of Soil and Water Plant Status,Logan, 6-10/07/1987, Utah State University, Vol. 2: 155-161.
Longstreth, D.J. and Strain, B.R., 1977. Effects of salinity and illumination onphotosynthesis and water balance of Spartina alterniflora Loisel. Oecologia,31: 191-199.
0smond, C.B. and Greenway, H., 1972. Salt responses of carboxylationenzymes from species differing in salt tolerance. Plant Physiol., 49: 260-263.
Passera, C. and Albuzio, A., 1978. Effect of salinity on photosynthesis andphotorespiration of two wheat species. Can. J. Bot., 56: 121-126.
Van Hoorn, J.W., 1991. Development of soil salinity during germination andearly seedling growth and its effect on several crops. Agric. Water Manage.,20: 17-28..
Walker, R.R., Torokalvy, E., Scott, N.S. and Kriedemann, P.E., 1981. An analysisof photosynthetic response to salt treatment in Vitis vinifera. Aust. J. PlantPhysiol., 8: 359-374.
West, D.W., Hoffman, G.J. and Fisher, M.J., 1986. Photosynthesis, leafconductance and water relations of cowpea under saline conditions. Irrig.Sci., 7: 183-193.
Yeo, A.R., Caporn, S.J.M. and Flowers, T.J., 1985. The effect of salinity uponphotosynthesis in rice (Oryza sativa L.). Gas exchange by individual leaves inrelation to their salt content. J. Exp. Bot., 36: 1240-1248.