effect of noninvasive ventilation on tracheal reintubation among
TRANSCRIPT
Copyright 2016 American Medical Association. All rights reserved.
Effect of Noninvasive Ventilation on Tracheal Reintubation
Among PatientsWith Hypoxemic Respiratory Failure
Following Abdominal Surgery
A Randomized Clinical Trial
Samir Jaber, MD, PhD; Thomas Lescot, MD, PhD; Emmanuel Futier, MD, PhD; Catherine Paugam-Burtz, MD, PhD; Philippe Seguin, MD, PhD;
Martine Ferrandiere, MD; Sigismond Lasocki, MD, PhD; Olivier Mimoz, MD, PhD; Baptiste Hengy, MD; Antoine Sannini, MD; Julien Pottecher, MD;
Paër-Sélim Abback, MD; Beatrice Riu, MD; Fouad Belafia, MD; Jean-Michel Constantin, MD, PhD; Elodie Masseret, MD; Marc Beaussier, MD, PhD;
Daniel Verzilli, MD; Audrey De Jong, MD; Gerald Chanques, MD, PhD; Laurent Brochard, MD, PhD; Nicolas Molinari, PhD; for the NIVAS Study Group
IMPORTANCE It has not been established whether noninvasive ventilation (NIV) reduces the
need for invasive mechanical ventilation in patients who develop hypoxemic acute
respiratory failure after abdominal surgery.
OBJECTIVE To evaluate whether noninvasive ventilation improves outcomes among patients
developing hypoxemic acute respiratory failure after abdominal surgery.
DESIGN, SETTING, AND PARTICIPANTS Multicenter, randomized, parallel-group clinical trial
conducted betweenMay 2013 and September 2014 in 20 French intensive care units among
293 patients who had undergone abdominal surgery and developed hypoxemic respiratory
failure (partial oxygen pressure <60mmHg or oxygen saturation [SpO2] �90%when
breathing room air or <80mmHgwhen breathing 15 L/min of oxygen, plus either [1] a
respiratory rate above 30/min or [2] clinical signs suggestive of intense respiratory muscle
work and/or labored breathing) if it occurred within 7 days after surgical procedure.
INTERVENTIONS Patients were randomly assigned to receive standard oxygen therapy (up to
15 L/min to maintain SpO2 of 94% or higher) (n = 145) or NIV delivered via facial mask
(inspiratory pressure support level, 5-15 cmH2O; positive end-expiratory pressure, 5-10 cm
H2O; fraction of inspired oxygen titrated tomaintain SpO2 �94%) (n = 148).
MAIN OUTCOMES ANDMEASURES The primary outcomewas tracheal reintubation for any
cause within 7 days of randomization. Secondary outcomes were gas exchange, invasive
ventilation–free days at day 30, health care–associated infections, and 90-daymortality.
RESULTS Among the 293 patients (mean age, 63.4 [SD, 13.8] years; n=224men) included in
the intention-to-treat analysis, reintubation occurred in 49 of 148 (33.1%) in the NIV group
and in 66 of 145 (45.5%) in the standard oxygen therapy group within+ 7 days after
randomization (absolute difference, −12.4%; 95% CI, −23.5% to −1.3%; P = .03). Noninvasive
ventilation was associated with significantly more invasive ventilation–free days compared
with standard oxygen therapy (25.4 vs 23.2 days; absolute difference, −2.2 days; 95% CI, −0.1
to 4.6 days; P = .04), while fewer patients developed health care–associated infections
(43/137 [31.4%] vs 63/128 [49.2%]; absolute difference, −17.8%; 95% CI, −30.2% to −5.4%;
P = .003). At 90 days, 22 of 148 patients (14.9%) in the NIV group and 31 of 144 (21.5%) in the
standard oxygen therapy group had died (absolute difference, −6.5%; 95% CI, −16.0% to
3.0%; P = .15). There were no significant differences in gas exchange.
CONCLUSIONS AND RELEVANCE Among patients with hypoxemic respiratory failure following
abdominal surgery, use of NIV compared with standard oxygen therapy reduced the risk of
tracheal reintubation within 7 days. These findings support use of NIV in this setting.
TRIAL REGISTRATION clinicaltrials.gov Identifier: NCT01971892
JAMA. doi:10.1001/jama.2016.2706
Published online March 15, 2016.
Editorial
Related article
Supplemental content at
jama.com
Author Affiliations:Author
affiliations are listed at the end of this
article.
Group Information: The Noninvasive
Ventilation for Postextubation
Respiratory Failure After
Abdominal Surgery (NIVAS) study
investigators are listed in eAppendix 1
in Supplement 1.
Corresponding Author: Samir Jaber,
MD, PhD, Département d’Anesthésie
Réanimation B (DAR B), 80 Avenue
Augustin Fliche, 34295Montpellier,
France ([email protected]).
Section Editor:Derek C. Angus, MD,
MPH, Associate Editor, JAMA
Research
Original Investigation | CARING FORTHE CRITICALLY ILL PATIENT
(Reprinted) E1
Copyright 2016 American Medical Association. All rights reserved.
Copyright 2016 American Medical Association. All rights reserved.
Postoperative acute respiratory failure is a major con-
tributor to the overall risk of surgery, leading to an in-
crease inmorbidity andmortality.1-3 The early postop-
erative period following abdominal surgery is associatedwith
diaphragmatic dysfunction andadecrease in lungvital capac-
ity, whichmay lead to atelectasis formation and hypoxemia.4
Treating postoperative acute respiratory failure usually re-
fers to tracheal reintubation and invasive mechanical
ventilation.5 Tracheal reintubation for acute respiratory fail-
ure is associated with higher mortality and increased health
care utilization, with a longer duration of both intensive care
unit (ICU) and hospital stay.3Reasons for the increase inmor-
tality include complications during the reintubationperiod6,7
and health care–associated infections such as pneumonia.6-9
This suggests that postoperative outcome may be improved
by strategies aimedat avoiding reintubation and invasiveme-
chanical ventilation.10
Noninvasive ventilation (NIV) has proven effective
in nonsurgical cases of acute exacerbation of chronic obstruc-
tive pulmonary disease11 and cardiogenic pulmonary
edema.12 However, to date, no evidence supports the use of
NIV in surgical patients with hypoxemic acute respiratory
failure after abdominal surgery. Indeed, NIV is sometimes
considered a relative contraindication after recent upper gas-
trointestinal tract surgery.13
To our knowledge, no multicenter randomized clinical
trials have evaluated whether NIV could reduce the need for
invasive mechanical ventilation and its effect on the inci-
denceofhealth care–associated infections inpatientswhode-
velop hypoxemic acute respiratory failure after abdominal
surgery.14,15
Wehypothesized that application of NIVmay prevent re-
intubation and invasive mechanical ventilation and may de-
crease the rate of health care–associated infections.
We thus conductedamulticenter randomizedclinical trial
ofNIV in surgical patientswhodevelopedhypoxemicacute re-
spiratory failure after abdominal surgery, comparing NIV
against standard oxygen therapy.
Methods
Trial Design andOversight
The trial was an investigator-initiated, multicenter, strati-
fied, parallel-group trial with a computer-generated alloca-
tion sequence and an electronic system–based randomiza-
tion. The study protocol and statistical analysis plan
(Supplement 2 and Supplement 3) were approved for all cen-
ters by a central ethics committee in accordance with French
law. The trial was conducted in accordance with the Declara-
tionofHelsinki.Written informedconsent from thepatient or
consent from a relative was obtained on study inclusion. An
independent data and safety monitoring committee oversaw
the study conduct and reviewed blinded safety data, with in-
terim analyses performed after the inclusion of 100 and 200
patients. Patients were screened and underwent randomiza-
tionbetweenMay2013andSeptember2014at20French ICUs.
Randomization was performed centrally by the minimiza-
tionmethodwith theuseofacomputer-generatedandblinded
assignment sequence. Randomization was stratified accord-
ing to study site, age (<60 vs ≥60 years), site of surgery (up-
pervs lower abdominal), anduseofpostoperativeepidural an-
algesia, as this may influence outcomes.16
Patients
Patients were eligible for participation in the study if they
were older than 18 years and had undergone laparoscopic or
nonlaparoscopic elective or nonelective abdominal surgery
under general anesthesia. Patients were included if they met
the following criteria: a diagnosis of acute respiratory failure
occurring within 7 days of the surgical procedure,17,18 defined
as the presence and persistence for more than 30 minutes of
hypoxemia (defined by a partial oxygen pressure <60 mm Hg
when breathing room air or <80 mm Hg when breathing
15 L/min of oxygen or a peripheral oxygen saturation [SpO2]
≤90% when breathing room air plus either [1] a respiratory
rate higher than 30/min or [2] clinical signs suggestive of
intense respiratory muscle work and/or labored breathing,
such as use of accessory respiratory muscles, paradoxical
motion of the abdomen, or intercostal retraction). Exclusion
criteria were withholding of life-sustaining treatment,19 con-
traindications to noninvasive ventilation, sleep apnea syn-
drome, immediate tracheal intubation, requirement for an
emergent surgical procedure, and previous recruitment in
another trial.
Causes of Acute Respiratory Failure
We assigned causes of acute respiratory failure following ex-
tubation using adapted published definitions11,20-23 as fol-
lows: upper airway obstruction, aspiration or excess respira-
tory secretions, encephalopathy, congestive heart failure,
pneumonia, and atelectasis.
Study Interventions
Patientswere randomlyassigned to receive eitherNIVor stan-
dard oxygen therapy alone from randomization until day 30
or ICU discharge, whichever came first. Patients assigned to
standard oxygen therapy received supplemental oxygen at a
rate of up to 15 L/min to maintain an SpO2 of at least 94%. In
the interventiongroup,NIVwasdelivered througha facemask
connected to an ICU- orNIV-dedicatedventilator, using either
a heated humidifier or heat andmoisture exchanger to warm
and humidify inspired gases.24 Noninvasive ventilation was
started at an inspiratory positive airwaypressure of 5 cmH2O,
increasing to a maximum inspiratory pressure of 15 cm H2O,
aiming to achieve an expiratory tidal volume between 6 and
8mL/kgof predictedbodyweight and a respiratory rate lower
than 25/min. Positive end-expiratory airway pressure (PEEP)
was started at 5 cm H2O and increased as needed to a maxi-
mumof 10cmH2O.4,10PEEPand inspiredoxygen fractionwere
titrated to maintain an SpO2 of at least 94%. Ventilator set-
tings were subsequently adjusted as needed for patient
comfort.4 Patients in this group were encouraged to use NIV
for at least 6hours, continuously or intermittently, during the
first 24hours after randomization. BetweenNIV sessions, pa-
tients received standard oxygen therapy as described above.
Research Original Investigation Noninvasive Ventilation and Tracheal Reintubation in Hypoxemic Respiratory Failure
E2 JAMA Published online March 15, 2016 (Reprinted) jama.com
Copyright 2016 American Medical Association. All rights reserved.
Copyright 2016 American Medical Association. All rights reserved.
The use of high-flow oxygen nasal cannulas was not permit-
ted in either group. Any decision to discontinue NIV was left
to the attending physician. All other aspects of patient care in
both groups were conducted according to each center’s rou-
tine clinical practice.
Criteria for Reintubation
To reduce the risk of delayed reintubation and to ensure con-
sistency of indications for reintubation among all trial sites,
predefined criteriawere applied. Immediate reintubationwas
performed if patients hadanyof the followingpredefinedma-
jor clinical events: respiratory or cardiac arrest, respiratory
pauses with loss of consciousness or gasping for air, massive
aspiration, persistent inability to clear respiratory secretions,
heart rate of less than 50/min with loss of alertness, and se-
vere hemodynamic instability without response to fluid and
vasoactive drugs. After reintubation, all patients underwent
ventilation with the same ventilation protocol, using a
low-tidal-volume protective ventilatory strategy.25
Study Outcomes
The primary outcome for comparing NIV and standard oxy-
gen therapy was any cause of reintubation within 7 days fol-
lowing randomization. Causes and time to reintubation were
recorded. Secondary outcomes included gas exchange,
health care–associated infection rate within 30 days, number
of ventilator-free days (ie, days alive and without invasive
mechanical ventilation) between days 1 and 30, antibiotic use
duration, ICU and in-hospital length of stay, and 30- and
90-day mortality. Five of 7 secondary outcomes are reported
in this article. Definitions for each health care–associated
infection (pneumonia, urinary tract infection, central venous
catheter–related infection, bacteremia, and surgical site
infection, occurring both at least 48 hours after ICU admis-
sion and after study entry) are detailed in eAppendix 2 in
Supplement 1.
Statistical Analysis
We estimated that with a sample of 150 patients per group
evaluated for the primary efficacy outcome, the study had at
least 90% power to determine superiority of noninvasive
ventilation compared with standard oxygen therapy. For the
intention-to-treat analysis, the following assumptions were
made: a 65% event rate in the standard oxygen therapy
group10,26,27 and a 40% event rate in the noninvasive ventila-
tion group14,28,29 (absolute risk reduction with NIV of at least
25% based on expert opinion). Further assumptions (15% of
included patients) were made relating to patients random-
ized despite not being eligible for randomization according to
inclusion/exclusion criteria and loss to follow-up for the pri-
mary end point. Two interim analyses were conducted after
the first 100 and 200 patient randomizations by an indepen-
dent data and safetymonitoring committee for early stopping
of the study for safety (mortality within 90 days) using
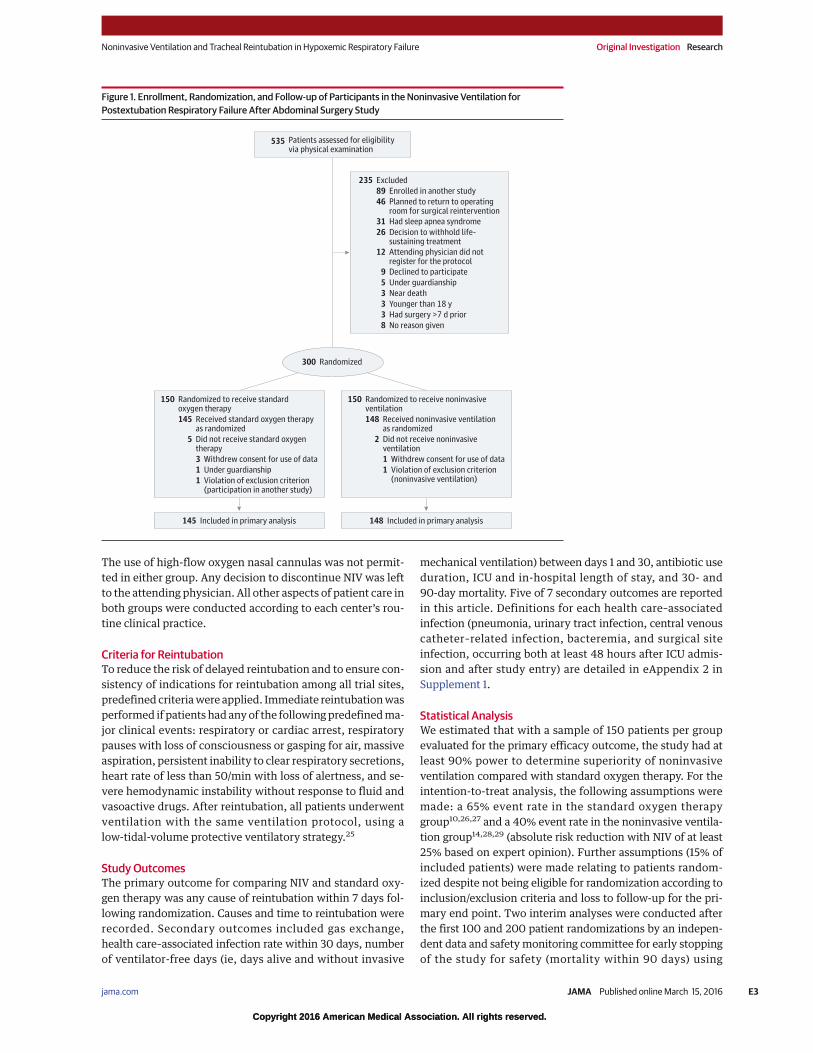
Figure 1. Enrollment, Randomization, and Follow-up of Participants in the Noninvasive Ventilation for
Postextubation Respiratory Failure After Abdominal Surgery Study
535 Patients assessed for eligibilityvia physical examination
235 Excluded
89 Enrolled in another study
46 Planned to return to operatingroom for surgical reintervention
12 Attending physician did notregister for the protocol
26 Decision to withhold life-sustaining treatment
31 Had sleep apnea syndrome
5 Under guardianship
9 Declined to participate
3 Younger than 18 y
3 Near death
8 No reason given
3 Had surgery >7 d prior
300 Randomized
150 Randomized to receive standardoxygen therapy
145 Received standard oxygen therapyas randomized
5 Did not receive standard oxygentherapy
3 Withdrew consent for use of data
1 Under guardianship
1 Violation of exclusion criterion(participation in another study)
150 Randomized to receive noninvasiveventilation
148 Received noninvasive ventilationas randomized
2 Did not receive noninvasiveventilation
1 Withdrew consent for use of data
1 Violation of exclusion criterion(noninvasive ventilation)
145 Included in primary analysis 148 Included in primary analysis
Noninvasive Ventilation and Tracheal Reintubation in Hypoxemic Respiratory Failure Original Investigation Research
jama.com (Reprinted) JAMA Published online March 15, 2016 E3
Copyright 2016 American Medical Association. All rights reserved.
Copyright 2016 American Medical Association. All rights reserved.
a prespecified Haybittle-Peto efficacy boundary30 (α = .001
for the 2 interim analyses). A secondary modified intention-
to-treat analysis was performed for the primary outcome
including only patients who did not return to the operating
room for reintervention. Unadjusted χ2 testing was used for
primary outcome analysis. Multiple imputation was addi-
tionally performed if the frequency of missing data was
greater than 5%. A Markov chain Monte Carlo method was
used for the multiple imputation procedure; we generated
m = 5 complete data sets. Multiple logistic regression analysis
was used to identify relevant baseline covariates associated
with the primary outcome. Variables tested in the model
were selected if P<.15 and then presented as absolute differ-
ence for binary variables and mean differences for continu-
ous variables with 95% confidence intervals. Kaplan-Meier
curves for reintubation and for mortality rates were plotted
for the first 30 and 90 days, respectively, after inclusion in
the study and were compared by the log-rank test. We com-
pared the primary outcome in prespecified subgroups
defined by stratification criteria according to age (<60 vs ≥60
years), site of surgery (upper vs lower abdominal), and use/
nonuse of epidural analgesia. A 2-tailed P<.05 was consid-
ered to indicate statistical significance. SAS software, version
9.3 (SAS Institute Inc), was used for all analyses.
Results
Study Patients
From May 2013 through September 2014, 535 patients with
acute respiratory failurewithin7days followingabdominal sur-
gery were eligible, of whom 300 underwent randomization,
150tostandardoxygentherapyand150toNIV (Figure 1). Seven
patients were excluded after randomization because of with-
drawn consent (n = 4) or ineligibility (n = 3). Data on the pri-
mary outcome were available for all 293 remaining patients
(mean age, 63.4 [SD, 13.8] years; n = 224 men). Groups were
similar with respect to inclusion, site, duration of surgery,
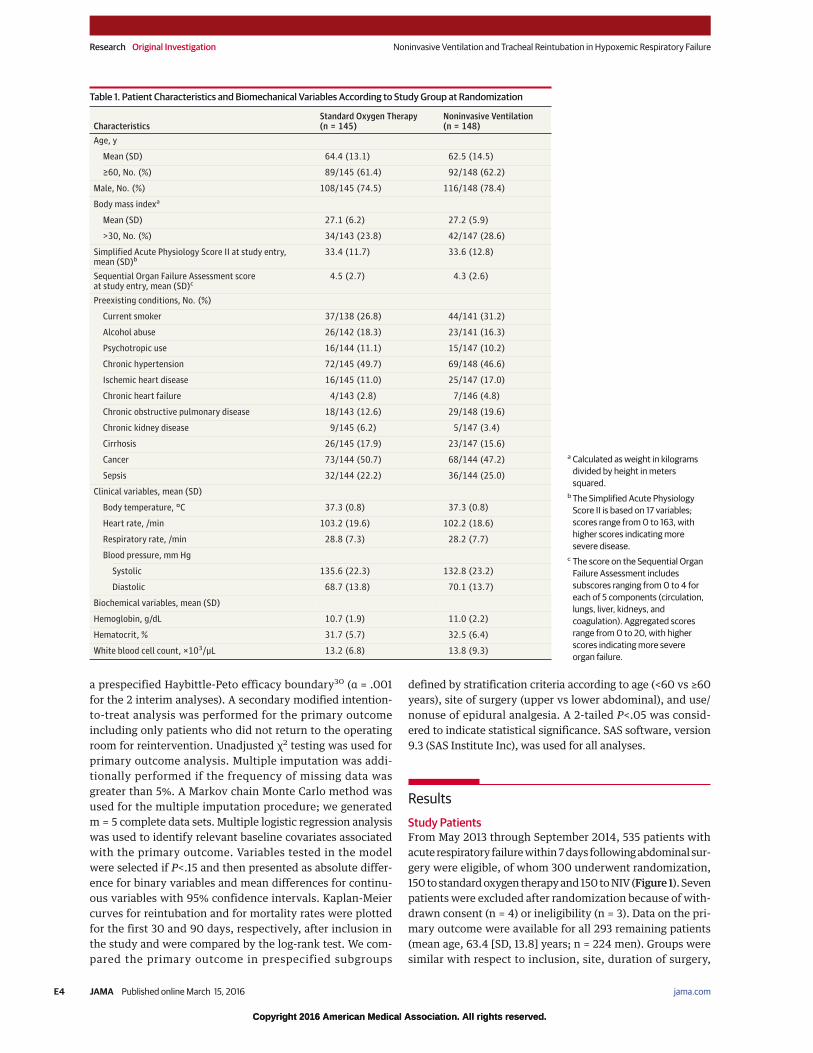
Table 1. Patient Characteristics and Biomechanical Variables According to Study Group at Randomization
CharacteristicsStandard Oxygen Therapy(n = 145)
Noninvasive Ventilation(n = 148)
Age, y
Mean (SD) 64.4 (13.1) 62.5 (14.5)
≥60, No. (%) 89/145 (61.4) 92/148 (62.2)
Male, No. (%) 108/145 (74.5) 116/148 (78.4)
Body mass indexa
Mean (SD) 27.1 (6.2) 27.2 (5.9)
>30, No. (%) 34/143 (23.8) 42/147 (28.6)
Simplified Acute Physiology Score II at study entry,mean (SD)b
33.4 (11.7) 33.6 (12.8)
Sequential Organ Failure Assessment scoreat study entry, mean (SD)c
4.5 (2.7) 4.3 (2.6)
Preexisting conditions, No. (%)
Current smoker 37/138 (26.8) 44/141 (31.2)
Alcohol abuse 26/142 (18.3) 23/141 (16.3)
Psychotropic use 16/144 (11.1) 15/147 (10.2)
Chronic hypertension 72/145 (49.7) 69/148 (46.6)
Ischemic heart disease 16/145 (11.0) 25/147 (17.0)
Chronic heart failure 4/143 (2.8) 7/146 (4.8)
Chronic obstructive pulmonary disease 18/143 (12.6) 29/148 (19.6)
Chronic kidney disease 9/145 (6.2) 5/147 (3.4)
Cirrhosis 26/145 (17.9) 23/147 (15.6)
Cancer 73/144 (50.7) 68/144 (47.2)
Sepsis 32/144 (22.2) 36/144 (25.0)
Clinical variables, mean (SD)
Body temperature, °C 37.3 (0.8) 37.3 (0.8)
Heart rate, /min 103.2 (19.6) 102.2 (18.6)
Respiratory rate, /min 28.8 (7.3) 28.2 (7.7)
Blood pressure, mm Hg
Systolic 135.6 (22.3) 132.8 (23.2)
Diastolic 68.7 (13.8) 70.1 (13.7)
Biochemical variables, mean (SD)
Hemoglobin, g/dL 10.7 (1.9) 11.0 (2.2)
Hematocrit, % 31.7 (5.7) 32.5 (6.4)
White blood cell count, ×103/µL 13.2 (6.8) 13.8 (9.3)
a Calculated as weight in kilograms
divided by height in meters
squared.
bThe Simplified Acute Physiology
Score II is based on 17 variables;
scores range from0 to 163, with
higher scores indicating more
severe disease.
c The score on the Sequential Organ
Failure Assessment includes
subscores ranging from0 to 4 for
each of 5 components (circulation,
lungs, liver, kidneys, and
coagulation). Aggregated scores
range from0 to 20, with higher
scores indicating more severe
organ failure.
Research Original Investigation Noninvasive Ventilation and Tracheal Reintubation in Hypoxemic Respiratory Failure
E4 JAMA Published online March 15, 2016 (Reprinted) jama.com
Copyright 2016 American Medical Association. All rights reserved.
Copyright 2016 American Medical Association. All rights reserved.
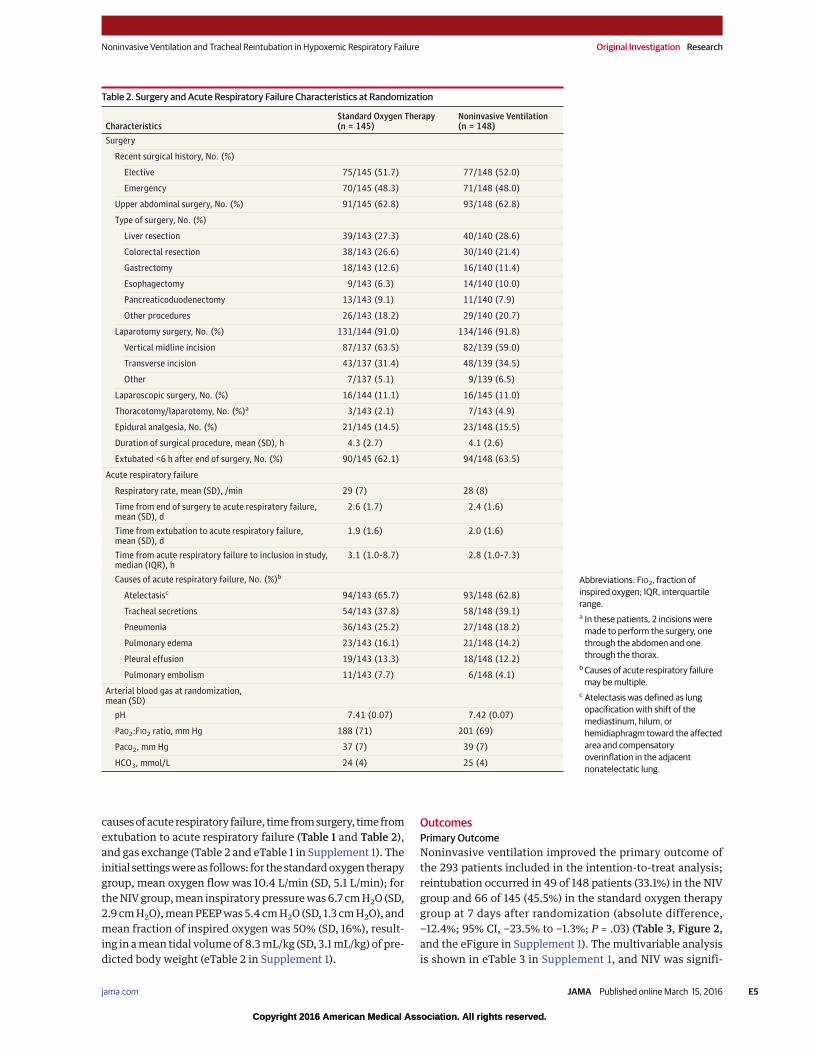
causesofacuterespiratory failure, timefromsurgery, timefrom
extubation to acute respiratory failure (Table 1 and Table 2),
and gas exchange (Table 2 and eTable 1 in Supplement 1). The
initial settingswereas follows: for thestandardoxygen therapy
group, mean oxygen flow was 10.4 L/min (SD, 5.1 L/min); for
theNIVgroup,mean inspiratorypressurewas6.7 cmH2O (SD,
2.9 cmH2O),meanPEEPwas5.4 cmH2O (SD, 1.3 cmH2O), and
mean fraction of inspired oxygen was 50% (SD, 16%), result-
ing in amean tidal volumeof 8.3mL/kg (SD, 3.1mL/kg) of pre-
dicted body weight (eTable 2 in Supplement 1).
Outcomes
Primary Outcome
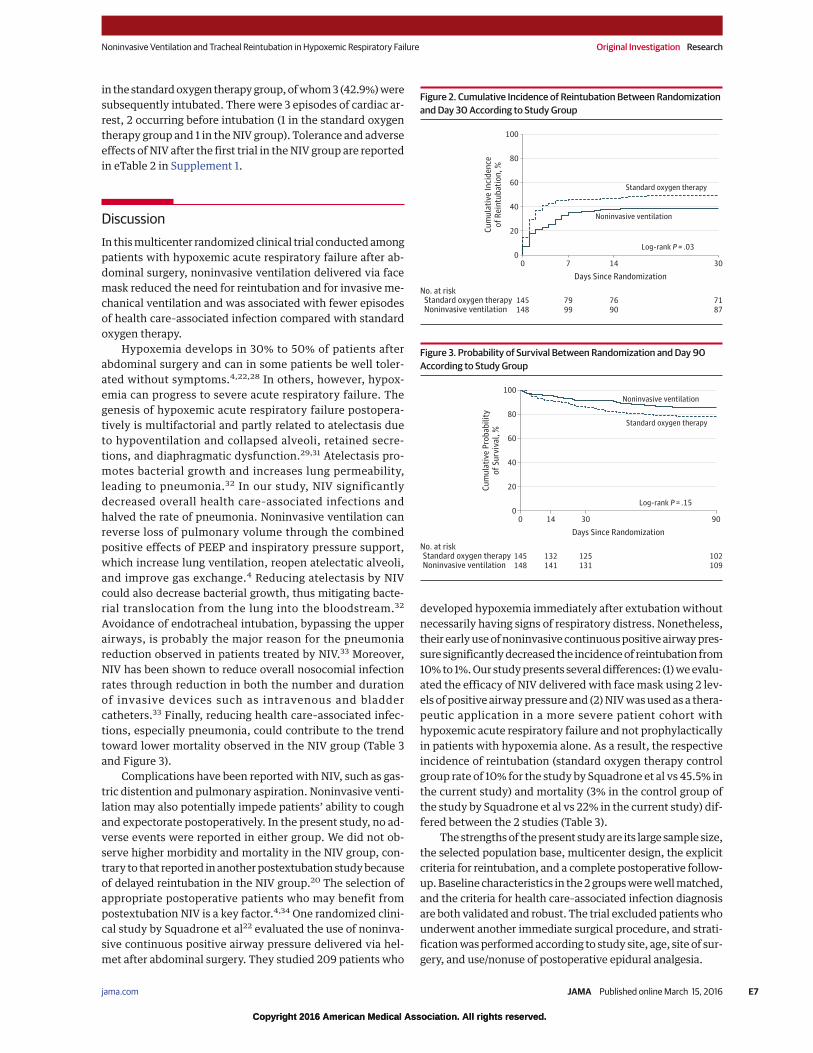
Noninvasive ventilation improved the primary outcome of
the 293 patients included in the intention-to-treat analysis;
reintubation occurred in 49 of 148 patients (33.1%) in the NIV
group and 66 of 145 (45.5%) in the standard oxygen therapy
group at 7 days after randomization (absolute difference,
−12.4%; 95% CI, −23.5% to −1.3%; P = .03) (Table 3, Figure 2,
and the eFigure in Supplement 1). The multivariable analysis
is shown in eTable 3 in Supplement 1, and NIV was signifi-
Table 2. Surgery and Acute Respiratory Failure Characteristics at Randomization
CharacteristicsStandard Oxygen Therapy(n = 145)
Noninvasive Ventilation(n = 148)
Surgery
Recent surgical history, No. (%)
Elective 75/145 (51.7) 77/148 (52.0)
Emergency 70/145 (48.3) 71/148 (48.0)
Upper abdominal surgery, No. (%) 91/145 (62.8) 93/148 (62.8)
Type of surgery, No. (%)
Liver resection 39/143 (27.3) 40/140 (28.6)
Colorectal resection 38/143 (26.6) 30/140 (21.4)
Gastrectomy 18/143 (12.6) 16/140 (11.4)
Esophagectomy 9/143 (6.3) 14/140 (10.0)
Pancreaticoduodenectomy 13/143 (9.1) 11/140 (7.9)
Other procedures 26/143 (18.2) 29/140 (20.7)
Laparotomy surgery, No. (%) 131/144 (91.0) 134/146 (91.8)
Vertical midline incision 87/137 (63.5) 82/139 (59.0)
Transverse incision 43/137 (31.4) 48/139 (34.5)
Other 7/137 (5.1) 9/139 (6.5)
Laparoscopic surgery, No. (%) 16/144 (11.1) 16/145 (11.0)
Thoracotomy/laparotomy, No. (%)a 3/143 (2.1) 7/143 (4.9)
Epidural analgesia, No. (%) 21/145 (14.5) 23/148 (15.5)
Duration of surgical procedure, mean (SD), h 4.3 (2.7) 4.1 (2.6)
Extubated <6 h after end of surgery, No. (%) 90/145 (62.1) 94/148 (63.5)
Acute respiratory failure
Respiratory rate, mean (SD), /min 29 (7) 28 (8)
Time from end of surgery to acute respiratory failure,mean (SD), d
2.6 (1.7) 2.4 (1.6)
Time from extubation to acute respiratory failure,mean (SD), d
1.9 (1.6) 2.0 (1.6)
Time from acute respiratory failure to inclusion in study,median (IQR), h
3.1 (1.0-8.7) 2.8 (1.0-7.3)
Causes of acute respiratory failure, No. (%)b
Atelectasisc 94/143 (65.7) 93/148 (62.8)
Tracheal secretions 54/143 (37.8) 58/148 (39.1)
Pneumonia 36/143 (25.2) 27/148 (18.2)
Pulmonary edema 23/143 (16.1) 21/148 (14.2)
Pleural effusion 19/143 (13.3) 18/148 (12.2)
Pulmonary embolism 11/143 (7.7) 6/148 (4.1)
Arterial blood gas at randomization,mean (SD)
pH 7.41 (0.07) 7.42 (0.07)
PaO2:FIO2 ratio, mm Hg 188 (71) 201 (69)
PaCO2, mm Hg 37 (7) 39 (7)
HCO3, mmol/L 24 (4) 25 (4)
Abbreviations: FIO2, fraction of
inspired oxygen; IQR, interquartile
range.
a In these patients, 2 incisions were
made to perform the surgery, one
through the abdomen and one
through the thorax.
bCauses of acute respiratory failure
may bemultiple.
c Atelectasis was defined as lung
opacification with shift of the
mediastinum, hilum, or
hemidiaphragm toward the affected
area and compensatory
overinflation in the adjacent
nonatelectatic lung.
Noninvasive Ventilation and Tracheal Reintubation in Hypoxemic Respiratory Failure Original Investigation Research
jama.com (Reprinted) JAMA Published online March 15, 2016 E5
Copyright 2016 American Medical Association. All rights reserved.
Copyright 2016 American Medical Association. All rights reserved.
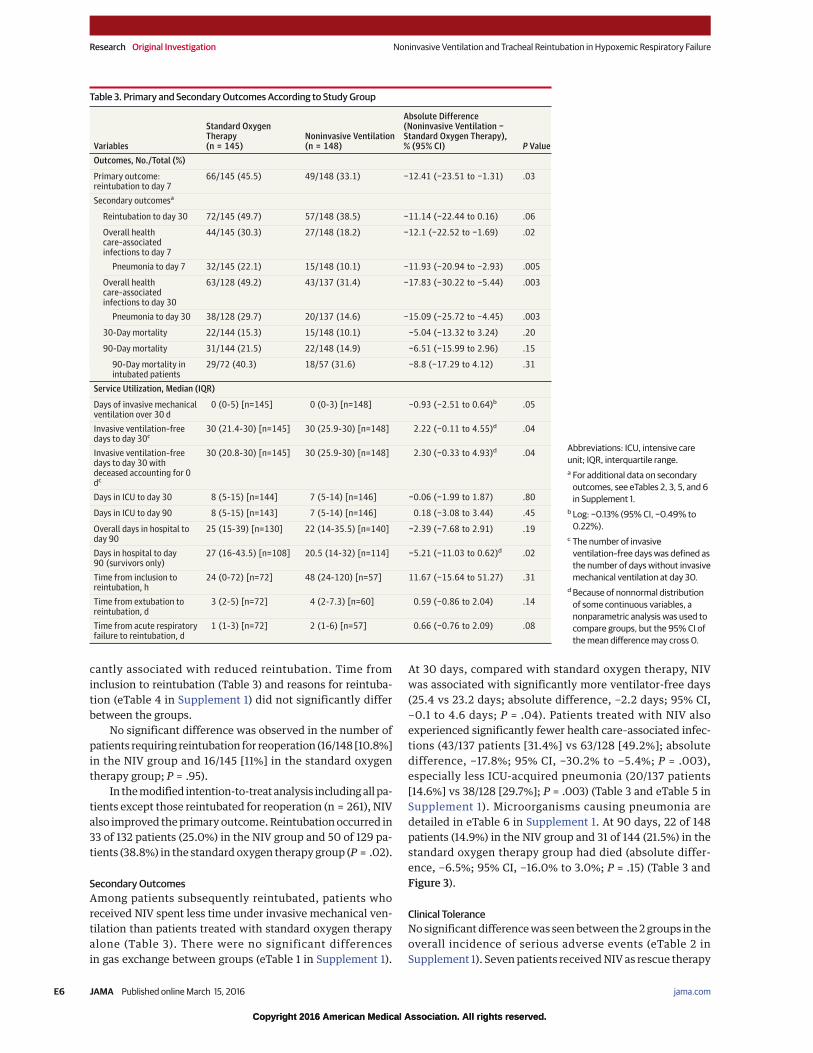
cantly associated with reduced reintubation. Time from
inclusion to reintubation (Table 3) and reasons for reintuba-
tion (eTable 4 in Supplement 1) did not significantly differ
between the groups.
No significant difference was observed in the number of
patients requiring reintubation for reoperation (16/148 [10.8%]
in the NIV group and 16/145 [11%] in the standard oxygen
therapy group; P = .95).
In themodified intention-to-treat analysis includingallpa-
tients except those reintubated for reoperation (n = 261), NIV
also improved theprimaryoutcome.Reintubationoccurred in
33 of 132 patients (25.0%) in the NIV group and 50 of 129 pa-
tients (38.8%) in the standardoxygen therapy group (P = .02).
Secondary Outcomes
Among patients subsequently reintubated, patients who
received NIV spent less time under invasive mechanical ven-
tilation than patients treated with standard oxygen therapy
alone (Table 3). There were no significant differences
in gas exchange between groups (eTable 1 in Supplement 1).
At 30 days, compared with standard oxygen therapy, NIV
was associated with significantly more ventilator-free days
(25.4 vs 23.2 days; absolute difference, −2.2 days; 95% CI,
−0.1 to 4.6 days; P = .04). Patients treated with NIV also
experienced significantly fewer health care–associated infec-
tions (43/137 patients [31.4%] vs 63/128 [49.2%]; absolute
difference, −17.8%; 95% CI, −30.2% to −5.4%; P = .003),
especially less ICU-acquired pneumonia (20/137 patients
[14.6%] vs 38/128 [29.7%]; P = .003) (Table 3 and eTable 5 in
Supplement 1). Microorganisms causing pneumonia are
detailed in eTable 6 in Supplement 1. At 90 days, 22 of 148
patients (14.9%) in the NIV group and 31 of 144 (21.5%) in the
standard oxygen therapy group had died (absolute differ-
ence, −6.5%; 95% CI, −16.0% to 3.0%; P = .15) (Table 3 and
Figure 3).
Clinical Tolerance
Nosignificantdifferencewas seenbetween the2groups in the
overall incidence of serious adverse events (eTable 2 in
Supplement 1). Sevenpatients receivedNIV as rescue therapy
Table 3. Primary and Secondary Outcomes According to Study Group
Variables
Standard OxygenTherapy(n = 145)
Noninvasive Ventilation(n = 148)
Absolute Difference(Noninvasive Ventilation −Standard Oxygen Therapy),% (95% CI) P Value
Outcomes, No./Total (%)
Primary outcome:reintubation to day 7
66/145 (45.5) 49/148 (33.1) −12.41 (−23.51 to −1.31) .03
Secondary outcomesa
Reintubation to day 30 72/145 (49.7) 57/148 (38.5) −11.14 (−22.44 to 0.16) .06
Overall healthcare–associatedinfections to day 7
44/145 (30.3) 27/148 (18.2) −12.1 (−22.52 to −1.69) .02
Pneumonia to day 7 32/145 (22.1) 15/148 (10.1) −11.93 (−20.94 to −2.93) .005
Overall healthcare–associatedinfections to day 30
63/128 (49.2) 43/137 (31.4) −17.83 (−30.22 to −5.44) .003
Pneumonia to day 30 38/128 (29.7) 20/137 (14.6) −15.09 (−25.72 to −4.45) .003
30-Day mortality 22/144 (15.3) 15/148 (10.1) −5.04 (−13.32 to 3.24) .20
90-Day mortality 31/144 (21.5) 22/148 (14.9) −6.51 (−15.99 to 2.96) .15
90-Day mortality inintubated patients
29/72 (40.3) 18/57 (31.6) −8.8 (−17.29 to 4.12) .31
Service Utilization, Median (IQR)
Days of invasive mechanicalventilation over 30 d
0 (0-5) [n=145] 0 (0-3) [n=148] −0.93 (−2.51 to 0.64)b .05
Invasive ventilation–freedays to day 30c
30 (21.4-30) [n=145] 30 (25.9-30) [n=148] 2.22 (−0.11 to 4.55)d .04
Invasive ventilation–freedays to day 30 withdeceased accounting for 0dc
30 (20.8-30) [n=145] 30 (25.9-30) [n=148] 2.30 (−0.33 to 4.93)d .04
Days in ICU to day 30 8 (5-15) [n=144] 7 (5-14) [n=146] −0.06 (−1.99 to 1.87) .80
Days in ICU to day 90 8 (5-15) [n=143] 7 (5-14) [n=146] 0.18 (−3.08 to 3.44) .45
Overall days in hospital today 90
25 (15-39) [n=130] 22 (14-35.5) [n=140] −2.39 (−7.68 to 2.91) .19
Days in hospital to day90 (survivors only)
27 (16-43.5) [n=108] 20.5 (14-32) [n=114] −5.21 (−11.03 to 0.62)d .02
Time from inclusion toreintubation, h
24 (0-72) [n=72] 48 (24-120) [n=57] 11.67 (−15.64 to 51.27) .31
Time from extubation toreintubation, d
3 (2-5) [n=72] 4 (2-7.3) [n=60] 0.59 (−0.86 to 2.04) .14
Time from acute respiratoryfailure to reintubation, d
1 (1-3) [n=72] 2 (1-6) [n=57] 0.66 (−0.76 to 2.09) .08
Abbreviations: ICU, intensive care
unit; IQR, interquartile range.
a For additional data on secondary
outcomes, see eTables 2, 3, 5, and 6
in Supplement 1.
bLog: −0.13% (95% CI, −0.49% to
0.22%).
c The number of invasive
ventilation–free days was defined as
the number of days without invasive
mechanical ventilation at day 30.
dBecause of nonnormal distribution
of some continuous variables, a
nonparametric analysis was used to
compare groups, but the 95% CI of
themean differencemay cross 0.
Research Original Investigation Noninvasive Ventilation and Tracheal Reintubation in Hypoxemic Respiratory Failure
E6 JAMA Published online March 15, 2016 (Reprinted) jama.com
Copyright 2016 American Medical Association. All rights reserved.
Copyright 2016 American Medical Association. All rights reserved.
in the standardoxygen therapygroup,ofwhom3(42.9%)were
subsequently intubated. There were 3 episodes of cardiac ar-
rest, 2 occurring before intubation (1 in the standard oxygen
therapy group and 1 in theNIV group). Tolerance and adverse
effects of NIV after the first trial in theNIV group are reported
in eTable 2 in Supplement 1.
Discussion
In thismulticenter randomizedclinical trial conductedamong
patients with hypoxemic acute respiratory failure after ab-
dominal surgery, noninvasive ventilation delivered via face
mask reduced the need for reintubation and for invasiveme-
chanical ventilation and was associated with fewer episodes
of health care–associated infection compared with standard
oxygen therapy.
Hypoxemia develops in 30% to 50% of patients after
abdominal surgery and can in some patients be well toler-
ated without symptoms.4,22,28 In others, however, hypox-
emia can progress to severe acute respiratory failure. The
genesis of hypoxemic acute respiratory failure postopera-
tively is multifactorial and partly related to atelectasis due
to hypoventilation and collapsed alveoli, retained secre-
tions, and diaphragmatic dysfunction.29,31 Atelectasis pro-
motes bacterial growth and increases lung permeability,
leading to pneumonia.32 In our study, NIV significantly
decreased overall health care–associated infections and
halved the rate of pneumonia. Noninvasive ventilation can
reverse loss of pulmonary volume through the combined
positive effects of PEEP and inspiratory pressure support,
which increase lung ventilation, reopen atelectatic alveoli,
and improve gas exchange.4 Reducing atelectasis by NIV
could also decrease bacterial growth, thus mitigating bacte-
rial translocation from the lung into the bloodstream.32
Avoidance of endotracheal intubation, bypassing the upper
airways, is probably the major reason for the pneumonia
reduction observed in patients treated by NIV.33 Moreover,
NIV has been shown to reduce overall nosocomial infection
rates through reduction in both the number and duration
of invasive devices such as intravenous and bladder
catheters.33 Finally, reducing health care–associated infec-
tions, especially pneumonia, could contribute to the trend
toward lower mortality observed in the NIV group (Table 3
and Figure 3).
Complications have been reported with NIV, such as gas-
tric distention and pulmonary aspiration. Noninvasive venti-
lation may also potentially impede patients’ ability to cough
and expectorate postoperatively. In the present study, no ad-
verse events were reported in either group. We did not ob-
serve higher morbidity and mortality in the NIV group, con-
trary to that reported inanotherpostextubation studybecause
of delayed reintubation in the NIV group.20 The selection of
appropriate postoperative patients who may benefit from
postextubation NIV is a key factor.4,34 One randomized clini-
cal study by Squadrone et al22 evaluated the use of noninva-
sive continuous positive airway pressure delivered via hel-
met after abdominal surgery. They studied 209 patients who
developed hypoxemia immediately after extubation without
necessarily having signs of respiratory distress. Nonetheless,
their earlyuseofnoninvasive continuouspositiveairwaypres-
sure significantlydecreased the incidenceof reintubation from
10%to1%.Our studypresents severaldifferences: (1)weevalu-
ated the efficacy of NIV deliveredwith facemask using 2 lev-
els of positive airwaypressure and (2)NIVwasusedas a thera-
peutic application in a more severe patient cohort with
hypoxemic acute respiratory failure and not prophylactically
in patients with hypoxemia alone. As a result, the respective
incidence of reintubation (standard oxygen therapy control
group rate of 10% for the study by Squadrone et al vs 45.5% in
the current study) and mortality (3% in the control group of
the study by Squadrone et al vs 22% in the current study) dif-
fered between the 2 studies (Table 3).
The strengthsof thepresent studyare its large sample size,
the selected population base, multicenter design, the explicit
criteria for reintubation, and a complete postoperative follow-
up.Baseline characteristics in the2groupswerewellmatched,
and the criteria for health care–associated infection diagnosis
are both validated and robust. The trial excluded patientswho
underwent another immediate surgical procedure, and strati-
ficationwasperformedaccording to study site, age, site of sur-
gery, and use/nonuse of postoperative epidural analgesia.
Figure 2. Cumulative Incidence of Reintubation Between Randomization
and Day 30 According to Study Group
100
80
60
40
20
00
145
148
7
79
99
14
76
90
30
71
87
Cu
mu
lati
ve
In
cid
en
ce
of
Re
intu
ba
tio
n,
%
Days Since Randomization
No. at riskStandard oxygen therapy
Standard oxygen therapy
Noninvasive ventilation
Noninvasive ventilation
Log-rank P = .03
Figure 3. Probability of Survival Between Randomization and Day 90
According to Study Group
100
80
60
40
20
00
145
148
14
132
141
30
125
131
90
102
109
Cu
mu
lati
ve
Pro
ba
bil
ity
of
Su
rviv
al,
%
Days Since Randomization
No. at riskStandard oxygen therapy
Standard oxygen therapy
Noninvasive ventilation
Noninvasive ventilation
Log-rank P = .15
Noninvasive Ventilation and Tracheal Reintubation in Hypoxemic Respiratory Failure Original Investigation Research
jama.com (Reprinted) JAMA Published online March 15, 2016 E7
Copyright 2016 American Medical Association. All rights reserved.
Copyright 2016 American Medical Association. All rights reserved.
Our studyhas several limitations. First, the observed rate
of reintubation in our study was lower than predicted in the
standard oxygen therapy group.2,3,17,35 This could be due, in
part, to exclusion of patients in whom acute respiratory fail-
ure was an early symptom of surgical complications needing
immediate reintervention.Althoughinvasiveendotrachealme-
chanical ventilation has remained the cornerstone of ventila-
tory strategy for severe acute respiratory failure for many
years,2 several studies have shown that mortality associated
withpulmonary complications is largely related to the risks of
postoperative reintubationandmechanical ventilation.2,3,36-38
Second, the present studywas not designed to showa signifi-
cant decrease in mortality in the NIV group. The lack of sig-
nificance for lowermortality observed in theNIV group (from
22% to 15% at day 90) could be due to an underpowered de-
sign. The lowmortality rate in the NIV groupmay result from
the cumulative effects of a decreased reintubation rate, a
shorter duration of invasivemechanical ventilation, and a re-
duced rate of health care–associated infections, especially
pneumonia (Table 3). Third, although we applied predefined
criteria for reintubation, bias cannot be completely ruled out
because blindingwith NIVwas not feasible. Fourth, the clini-
cally relevant effect size used in the power analysis was 25%.
Becausewewerenot able to identify randomizedclinical trials
that included similar patients, this was based on expert opin-
ion and was chosen to limit the likelihood of a type 1 error.
Recent high-impact trials have demonstrated the ben-
efits innonsurgical hypoxemic respiratory failure21or equiva-
lence of high-flow nasal cannula compared with NIV in pa-
tients after cardiothoracic surgery with moderate to severe
hypoxemia.23Future studies comparinguse of high-flowoxy-
gen cannula vs standard oxygen therapy andNIV for patients
after abdominal surgery as preventive (prophylactic)39 or cu-
rative application are needed.40
Conclusions
Among patients with hypoxemic respiratory failure follow-
ingabdominal surgery,useofNIVcomparedwithstandardoxy-
gen therapy reduced the risk of tracheal reintubation within
7 days. These findings support use of NIV in this setting.
ARTICLE INFORMATION
Published Online:March 15, 2016.
doi:10.1001/jama.2016.2706.
Author Affiliations: Saint Eloi University Hospital
andMontpellier School of Medicine, Research Unit
INSERMU1046, Montpellier, France (Jaber, Belafia,
Verzilli, De Jong, Chanques); Saint Antoine
Hospital, AP-HP, Paris, France (Lescot, Beaussier);
Estaing Hospital, Clermont-Ferrand, France (Futier,
Constantin); Beaujon Hospital, AP-HP, Paris, France
(Paugam-Burtz, Abback); Rennes University
Hospital, Rennes, France (Seguin, Masseret); Tours
University Hospital, Tours, France (Ferrandiere);
Angers University Hospital, Angers, France
(Lasocki); Poitiers University Hospital, Poitiers,
France (Mimoz); Edouard Herriot Hospital, Lyon,
France (Hengy); Institut Paoli Calmettes, Marseille,
France (Sannini); CHU Strasbourg, Strasbourg,
France (Pottecher); Purpan Hospital, Toulouse,
France (Riu); St Michael’s Hospital, Toronto,
Ontario, Canada (Brochard); Lapeyronie University
Hospital andMontpellier School of Pharmacy,
Research Unit IMAG U5149, Montpellier, France
(Molinari).
Author Contributions:DrMolinari had full access
to all of the data in the study and takes
responsibility for the integrity of the data and the
accuracy of the data analysis.
Study concept and design: Jaber, Paugam-Burtz,
Riu-Poulenc, Belafia, Molinari.
Acquisition, analysis, or interpretation of data:
Jaber, Lescot, Futier, Paugam-Burtz, Seguin,
Ferrandiere, Lasocki, Mimoz, Hengy, Sannini,
Pottecher, Abback, Riu-Poulenc, Constantin,
Masseret, Beaussier, Verzilli, De Jong, Chanques,
Brochard, Molinari.
Drafting of the manuscript: Jaber, Futier,
Riu-Poulenc, Verzilli, Molinari.
Critical revision of the manuscript for important
intellectual content: All authors.
Statistical analysis:De Jong, Molinari.
Obtained funding: Jaber.
Administrative, technical, or material support: Jaber,
Seguin, Belafia, Masseret, Verzilli, Chanques,
Molinari.
Study supervision: Jaber, Futier, Mimoz, Belafia,
Constantin, Beaussier, Verzilli, Molinari.
Conflict of Interest Disclosures: All authors have
completed and submitted the ICMJE Form for
Disclosure of Potential Conflicts of Interest.
Dr Jaber reports consulting fees from Drager,
Maquet, Hamilton, and Fisher & Paykel Healthcare.
Dr Lescot reports grants, personal fees, and/or
nonfinancial support from Baxter, Fresenius, and
Merck Sharpe & Dohme. Dr Futier reports advisory
boardmembership for Baxter, consulting and/or
lecture fees from Fresenius, General Electric, and
Drager, and travel reimbursement from Fisher &
Paykel Healthcare. Dr Brochard reports grants from
Covidien, General Electric, Fisher & Paykel
Healthcare, andMaquet, and nonfinancial/other
support from Philips andMaquet. No other
disclosures were reported.
Funding/Support: This investigator-initiated trial
was funded byMontpellier University Hospital and
the APARD Foundation.
Role of the Funders/Sponsors: The study funders/
sponsors had no role in the design and conduct of
the study; collection, management, analysis, and
interpretation of the data; preparation, review, or
approval of themanuscript; or decision to submit
themanuscript for publication.
Previous Presentation: Selected data in this article
were presented at the International Symposium on
Intensive Care and EmergencyMedicine meeting in
Brussels, Belgium, March 15-18, 2016.
Additional Contributions:We thankMervyn
Singer, MD, PhD, Bloomsbury Institute of Intensive
Care Medicine, University College London,
for critical revision of themanuscript and for
English-language editing. He did not receive
financial compensation for his contributions.
REFERENCES
1. Chiumello D, Chevallard G, Gregoretti C.
Non-invasive ventilation in postoperative patients:
a systematic review. Intensive Care Med. 2011;37(6):
918-929.
2. Pearse RM, Moreno RP, Bauer P, et al; European
Surgical Outcomes Study Group for the Trials
Groups of the European Society of Intensive Care
Medicine and the European Society of
Anaesthesiology. Mortality after surgery in Europe:
a 7 day cohort study. Lancet. 2012;380(9847):
1059-1065.
3. Serpa Neto A, Hemmes SN, Barbas CS, et al;
PROVE Network Investigators. Incidence of
mortality andmorbidity related to postoperative
lung injury in patients who have undergone
abdominal or thoracic surgery: a systematic review
andmeta-analysis. Lancet Respir Med. 2014;2(12):
1007-1015.
4. Jaber S, Chanques G, Jung B. Postoperative
noninvasive ventilation. Anesthesiology. 2010;112
(2):453-461.
5. Ghaferi AA, Birkmeyer JD, Dimick JB. Variation in
hospital mortality associated with inpatient surgery.
N Engl J Med. 2009;361(14):1368-1375.
6. Jaber S, Amraoui J, Lefrant JY, et al. Clinical
practice and risk factors for immediate
complications of endotracheal intubation in the
intensive care unit: a prospective, multiple-center
study. Crit Care Med. 2006;34(9):2355-2361.
7. Jaber S, Jung B, Corne P, et al. An intervention to
decrease complications related to endotracheal
intubation in the intensive care unit: a prospective,
multiple-center study. Intensive Care Med. 2010;36
(2):248-255.
8. Epstein SK. Extubation failure: an outcome to be
avoided. Crit Care. 2004;8(5):310-312.
9. Thille AW, Richard JC, Brochard L. The decision
to extubate in the intensive care unit. Am J Respir
Crit Care Med. 2013;187(12):1294-1302.
Research Original Investigation Noninvasive Ventilation and Tracheal Reintubation in Hypoxemic Respiratory Failure
E8 JAMA Published online March 15, 2016 (Reprinted) jama.com
Copyright 2016 American Medical Association. All rights reserved.
Copyright 2016 American Medical Association. All rights reserved.
10. Jaber S, Delay JM, Chanques G, et al. Outcomes
of patients with acute respiratory failure after
abdominal surgery treated with noninvasive
positive pressure ventilation. Chest. 2005;128(4):
2688-2695.
11. Brochard L, Mancebo J, Wysocki M, et al.
Noninvasive ventilation for acute exacerbations of
chronic obstructive pulmonary disease.NEngl JMed.
1995;333(13):817-822.
12. Masip J, RoqueM, Sánchez B, Fernández R,
Subirana M, Expósito JA. Noninvasive ventilation in
acute cardiogenic pulmonary edema: systematic
review andmeta-analysis. JAMA. 2005;294(24):
3124-3130.
13. Kelly CR, Higgins AR, Chandra S. Videos in
clinical medicine: noninvasive positive-pressure
ventilation.N Engl J Med. 2015;372(23):e30.
14. Faria DA, da Silva EM, Atallah AN, Vital FM.
Noninvasive positive pressure ventilation for acute
respiratory failure following upper abdominal
surgery. Cochrane Database Syst Rev. 2015;10:
CD009134.
15. Ireland CJ, Chapman TM, Mathew SF, Herbison
GP, Zacharias M. Continuous positive airway
pressure (CPAP) during the postoperative period
for prevention of postoperative morbidity and
mortality followingmajor abdominal surgery.
Cochrane Database Syst Rev. 2014;8:CD008930.
16. Pöpping DM, Elia N, Marret E, Remy C,
Tramèr MR. Protective effects of epidural analgesia
on pulmonary complications after abdominal and
thoracic surgery: a meta-analysis. Arch Surg. 2008;
143(10):990-999.
17. Futier E, Constantin JM, Paugam-Burtz C, et al;
IMPROVE Study Group. A trial of intraoperative
low-tidal-volume ventilation in abdominal surgery.
N Engl J Med. 2013;369(5):428-437.
18. Hemmes SN, Gama de AbreuM, Pelosi P,
Schultz MJ; PROVE Network Investigators for the
Clinical Trial Network of the European Society of
Anaesthesiology. High vs low positive
end-expiratory pressure during general anaesthesia
for open abdominal surgery (PROVHILO trial):
a multicentre randomised controlled trial. Lancet.
2014;384(9942):495-503.
19. Sprung CL, Cohen SL, Sjokvist P, et al; Ethicus
Study Group. End-of-life practices in European
intensive care units: the Ethicus Study. JAMA.
2003;290(6):790-797.
20. Esteban A, Frutos-Vivar F, Ferguson ND, et al.
Noninvasive positive-pressure ventilation for
respiratory failure after extubation.N Engl J Med.
2004;350(24):2452-2460.
21. Frat JP, Thille AW, Mercat A, et al; FLORALI
Study Group; REVA Network. High-flow oxygen
through nasal cannula in acute hypoxemic
respiratory failure. N Engl J Med. 2015;372(23):
2185-2196.
22. Squadrone V, CohaM, Cerutti E, et al; Piedmont
Intensive Care Units Network. Continuous positive
airway pressure for treatment of postoperative
hypoxemia: a randomized controlled trial. JAMA.
2005;293(5):589-595.
23. Stéphan F, Barrucand B, Petit P, et al;
BiPOP Study Group. High-flow nasal oxygen vs
noninvasive positive airway pressure in hypoxemic
patients after cardiothoracic surgery: a randomized
clinical trial. JAMA. 2015;313(23):2331-2339.
24. Lellouche F, L’Her E, Abroug F, et al. Impact of
the humidification device on intubation rate during
noninvasive ventilation with ICU ventilators: results
of a multicenter randomized controlled trial.
Intensive Care Med. 2014;40(2):211-219.
25. Neto AS, Simonis FD, Barbas CS, et al;
Protective Ventilation Network Investigators.
Lung-protective ventilation with low tidal volumes
and the occurrence of pulmonary complications in
patients without acute respiratory distress
syndrome: a systematic review and individual
patient data analysis. Crit Care Med. 2015;43(10):
2155-2163.
26. Conti G, Cavaliere F, Costa R, et al. Noninvasive
positive-pressure ventilation with different
interfaces in patients with respiratory failure after
abdominal surgery: a matched-control study. Respir
Care. 2007;52(11):1463-1471.
27. Wallet F, Schoeffler M, ReynaudM, Duperret S,
Workineh S, Viale JP. Factors associated with
noninvasive ventilation failure in postoperative
acute respiratory insufficiency: an observational
study. Eur J Anaesthesiol. 2010;27(3):270-274.
28. Futier E, Marret E, Jaber S. Perioperative
positive pressure ventilation: an integrated
approach to improve pulmonary care.Anesthesiology.
2014;121(2):400-408.
29. Ahmed AA. Dysfunction of the diaphragm.
N Engl J Med. 2012;366(21):2036-2037.
30. Haybittle JL. Repeated assessment of results in
clinical trials of cancer treatment. Br J Radiol. 1971;
44(526):793-797.
31. Canet J, Mazo V. Postoperative pulmonary
complications.Minerva Anestesiol. 2010;76(2):138-
143.
32. van Kaam AH, Lachmann RA, Herting E, et al.
Reducing atelectasis attenuates bacterial growth
and translocation in experimental pneumonia. Am J
Respir Crit Care Med. 2004;169(9):1046-1053.
33. Girou E, Schortgen F, Delclaux C, et al.
Association of noninvasive ventilation with
nosocomial infections and survival in critically ill
patients. JAMA. 2000;284(18):2361-2367.
34. Jaber S, Antonelli M. Preventive or curative
postoperative noninvasive ventilation after thoracic
surgery: still a grey zone? Intensive Care Med. 2014;
40(2):280-283.
35. Canet J, Hardman J, Sabaté S, et al. PERISCOPE
study: predicting post-operative pulmonary
complications in Europe. Eur J Anaesthesiol. 2011;
28(6):459-461.
36. Brueckmann B, Villa-Uribe JL, Bateman BT,
et al. Development and validation of a score for
prediction of postoperative respiratory
complications. Anesthesiology. 2013;118(6):1276-
1285.
37. Khuri SF, HendersonWG, DePalma RG, Mosca
C, Healey NA, Kumbhani DJ; Participants in the VA
National Surgical Quality Improvement Program.
Determinants of long-term survival after major
surgery and the adverse effect of postoperative
complications. Ann Surg. 2005;242(3):326-341.
38. Thille AW, Harrois A, Schortgen F, Brun-Buisson
C, Brochard L. Outcomes of extubation failure in
medical intensive care unit patients. Crit Care Med.
2011;39(12):2612-2618.
39. Futier E, Paugam-Burtz C, Constantin JM,
Pereira B, Jaber S. The OPERA trial—comparison of
early nasal high flow oxygen therapy with standard
care for prevention of postoperative hypoxemia
after abdominal surgery: study protocol for a
multicenter randomized controlled trial. Trials.
2013;14:341.
40. Lemiale V, Mokart D, Resche-RigonM, et al;
Groupe de Recherche en Réanimation Respiratoire
du Patient d’Onco-Hématologie. Effect of
noninvasive ventilation vs oxygen therapy on
mortality among immunocompromised patients
with acute respiratory failure: a randomized clinical
trial. JAMA. 2015;314(16):1711-1719.
Noninvasive Ventilation and Tracheal Reintubation in Hypoxemic Respiratory Failure Original Investigation Research
jama.com (Reprinted) JAMA Published online March 15, 2016 E9
Copyright 2016 American Medical Association. All rights reserved.
Supplementary Online Content
Jaber S, Lescot T, Futier E, et al; NIVAS Study Group. Effect of noninvasive ventilation on tracheal reintubation among patients with hypoxemic respiratory failure following abdominal surgery: a randomized clinical trial. JAMA. doi:10.1001/jama.2016.2706
eAppendix 1. List of NIVAS Trial Investigators
eAppendix 2. Supplemental Methods
eFigure. Absolute Difference of Intubation at 30 Days
eTable 1. Gas Exchange According to Study Group
eTable 2. Settings, Monitored Parameters, Tolerance and Side Effects of Noninvasive Ventilation
eTable 3. Bivariate and Multivariable Analysis of Factors Associated With the Primary Outcome
eTable 4. Reasons for Re-intubation, as Defined in the Protocol Guidelines, According to Study Group
eTable 5. Primary and Secondary Outcomes According to Study Group
eTable 6. Clinical Pulmonary Infection Score (CPIS) and Microorganisms Causing Pneumonia According to Study Group
This supplementary material has been provided by the authors to give readers additional information about their work.
© 2016 American Medical Association. All rights reserved.
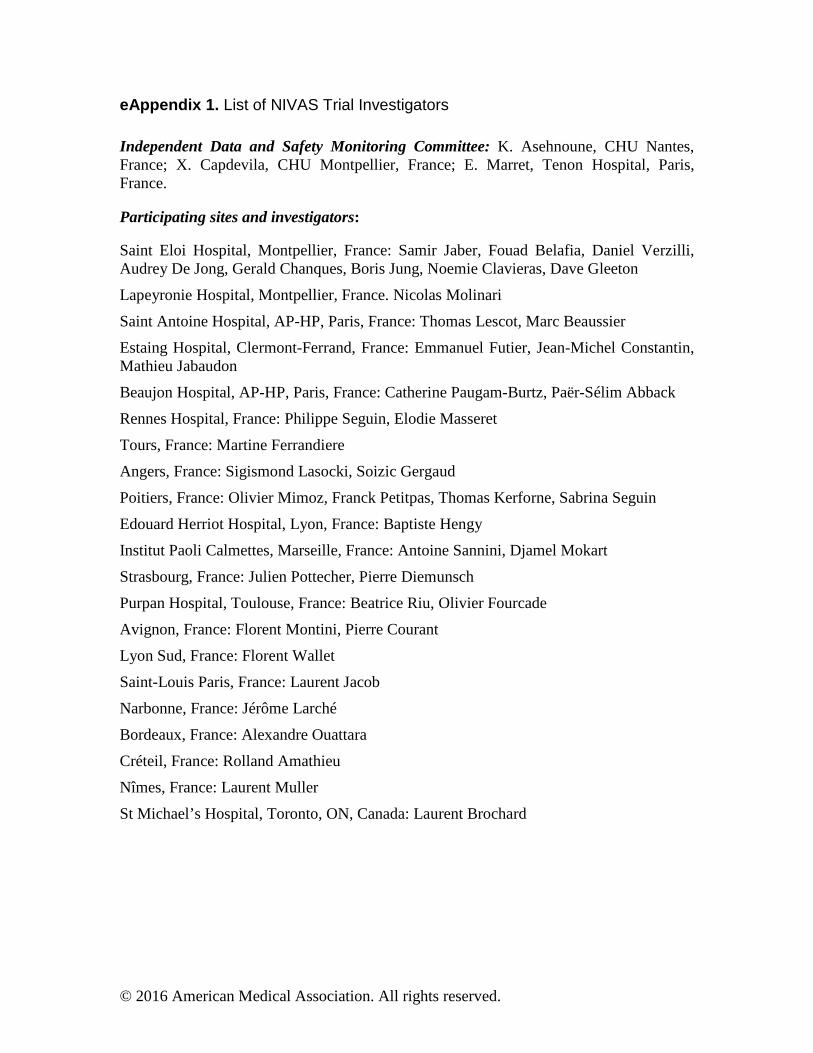
eAppendix 1. List of NIVAS Trial Investigators
Independent Data and Safety Monitoring Committee: K. Asehnoune, CHU Nantes, France; X. Capdevila, CHU Montpellier, France; E. Marret, Tenon Hospital, Paris, France. Participating sites and investigators: Saint Eloi Hospital, Montpellier, France: Samir Jaber, Fouad Belafia, Daniel Verzilli, Audrey De Jong, Gerald Chanques, Boris Jung, Noemie Clavieras, Dave Gleeton
Lapeyronie Hospital, Montpellier, France. Nicolas Molinari
Saint Antoine Hospital, AP-HP, Paris, France: Thomas Lescot, Marc Beaussier
Estaing Hospital, Clermont-Ferrand, France: Emmanuel Futier, Jean-Michel Constantin, Mathieu Jabaudon
Beaujon Hospital, AP-HP, Paris, France: Catherine Paugam-Burtz, Paër-Sélim Abback
Rennes Hospital, France: Philippe Seguin, Elodie Masseret
Tours, France: Martine Ferrandiere
Angers, France: Sigismond Lasocki, Soizic Gergaud
Poitiers, France: Olivier Mimoz, Franck Petitpas, Thomas Kerforne, Sabrina Seguin
Edouard Herriot Hospital, Lyon, France: Baptiste Hengy
Institut Paoli Calmettes, Marseille, France: Antoine Sannini, Djamel Mokart
Strasbourg, France: Julien Pottecher, Pierre Diemunsch
Purpan Hospital, Toulouse, France: Beatrice Riu, Olivier Fourcade
Avignon, France: Florent Montini, Pierre Courant
Lyon Sud, France: Florent Wallet
Saint-Louis Paris, France: Laurent Jacob
Narbonne, France: Jérôme Larché
Bordeaux, France: Alexandre Ouattara
Créteil, France: Rolland Amathieu
Nîmes, France: Laurent Muller
St Michael’s Hospital, Toronto, ON, Canada: Laurent Brochard
© 2016 American Medical Association. All rights reserved.
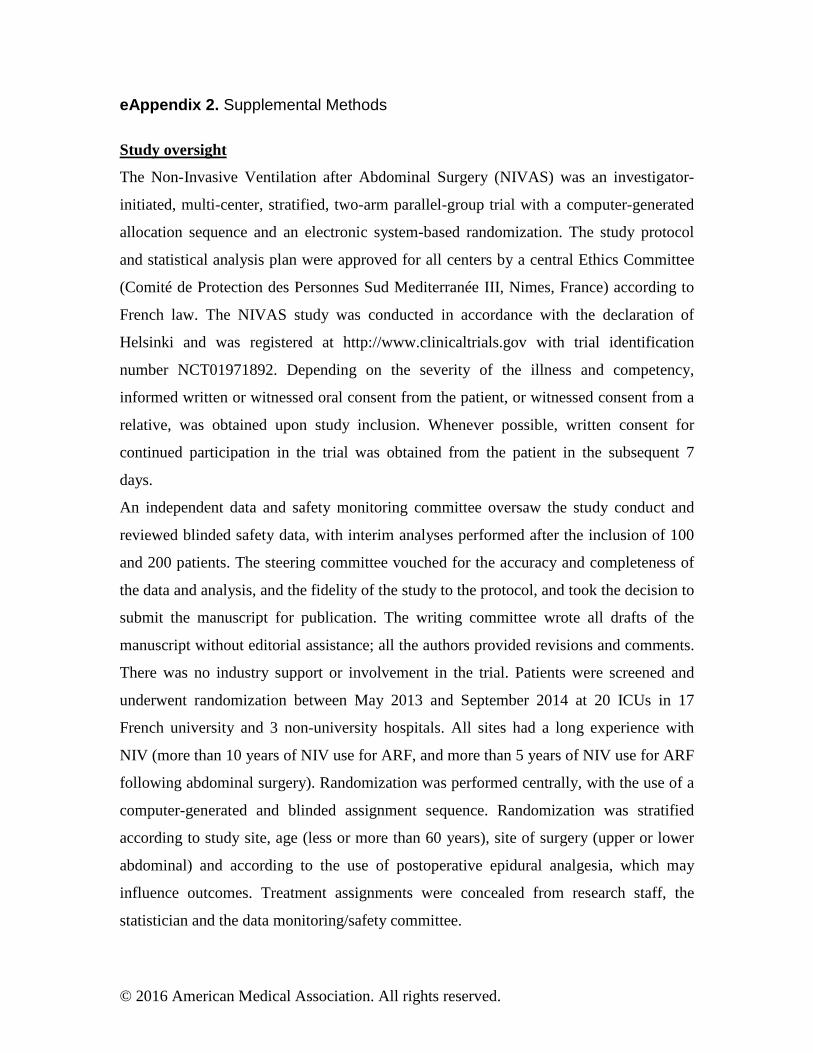
eAppendix 2. Supplemental Methods
Study oversight
The Non-Invasive Ventilation after Abdominal Surgery (NIVAS) was an investigator-
initiated, multi-center, stratified, two-arm parallel-group trial with a computer-generated
allocation sequence and an electronic system-based randomization. The study protocol
and statistical analysis plan were approved for all centers by a central Ethics Committee
(Comité de Protection des Personnes Sud Mediterranée III, Nimes, France) according to
French law. The NIVAS study was conducted in accordance with the declaration of
Helsinki and was registered at http://www.clinicaltrials.gov with trial identification
number NCT01971892. Depending on the severity of the illness and competency,
informed written or witnessed oral consent from the patient, or witnessed consent from a
relative, was obtained upon study inclusion. Whenever possible, written consent for
continued participation in the trial was obtained from the patient in the subsequent 7
days.
An independent data and safety monitoring committee oversaw the study conduct and
reviewed blinded safety data, with interim analyses performed after the inclusion of 100
and 200 patients. The steering committee vouched for the accuracy and completeness of
the data and analysis, and the fidelity of the study to the protocol, and took the decision to
submit the manuscript for publication. The writing committee wrote all drafts of the
manuscript without editorial assistance; all the authors provided revisions and comments.
There was no industry support or involvement in the trial. Patients were screened and
underwent randomization between May 2013 and September 2014 at 20 ICUs in 17
French university and 3 non-university hospitals. All sites had a long experience with
NIV (more than 10 years of NIV use for ARF, and more than 5 years of NIV use for ARF
following abdominal surgery). Randomization was performed centrally, with the use of a
computer-generated and blinded assignment sequence. Randomization was stratified
according to study site, age (less or more than 60 years), site of surgery (upper or lower
abdominal) and according to the use of postoperative epidural analgesia, which may
influence outcomes. Treatment assignments were concealed from research staff, the
statistician and the data monitoring/safety committee.
© 2016 American Medical Association. All rights reserved.
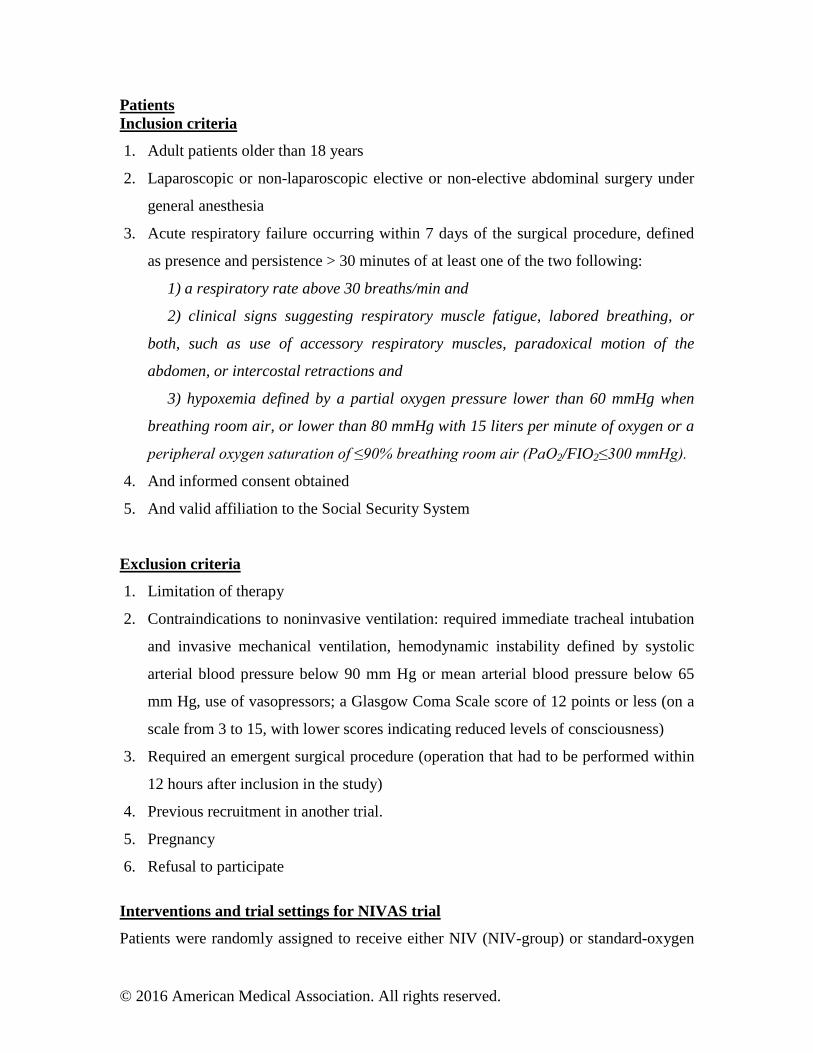
Patients Inclusion criteria
1. Adult patients older than 18 years
2. Laparoscopic or non-laparoscopic elective or non-elective abdominal surgery under
general anesthesia
3. Acute respiratory failure occurring within 7 days of the surgical procedure, defined
as presence and persistence > 30 minutes of at least one of the two following:
1) a respiratory rate above 30 breaths/min and
2) clinical signs suggesting respiratory muscle fatigue, labored breathing, or
both, such as use of accessory respiratory muscles, paradoxical motion of the
abdomen, or intercostal retractions and
3) hypoxemia defined by a partial oxygen pressure lower than 60 mmHg when
breathing room air, or lower than 80 mmHg with 15 liters per minute of oxygen or a
peripheral oxygen saturation of ≤90% breathing room air (PaO2/FIO2≤300 mmHg).
4. And informed consent obtained
5. And valid affiliation to the Social Security System
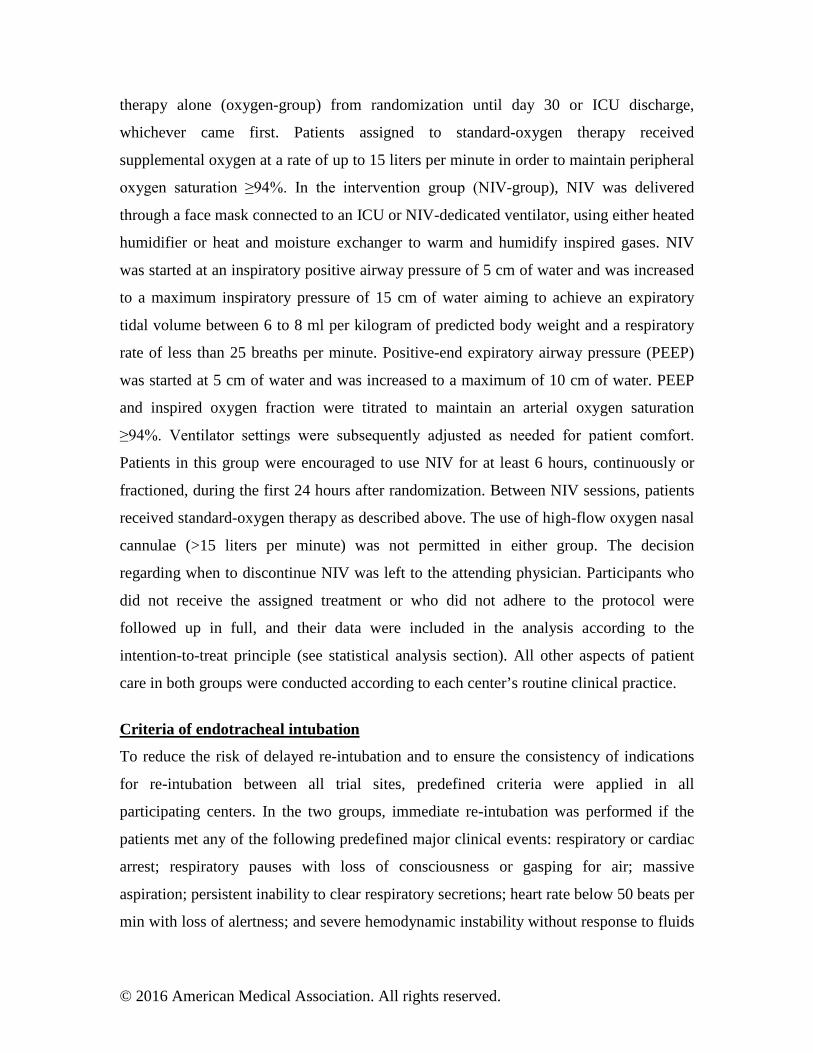
Exclusion criteria
1. Limitation of therapy
2. Contraindications to noninvasive ventilation: required immediate tracheal intubation
and invasive mechanical ventilation, hemodynamic instability defined by systolic
arterial blood pressure below 90 mm Hg or mean arterial blood pressure below 65
mm Hg, use of vasopressors; a Glasgow Coma Scale score of 12 points or less (on a
scale from 3 to 15, with lower scores indicating reduced levels of consciousness)
3. Required an emergent surgical procedure (operation that had to be performed within
12 hours after inclusion in the study)
4. Previous recruitment in another trial.
5. Pregnancy
6. Refusal to participate
Interventions and trial settings for NIVAS trial
Patients were randomly assigned to receive either NIV (NIV-group) or standard-oxygen
© 2016 American Medical Association. All rights reserved.
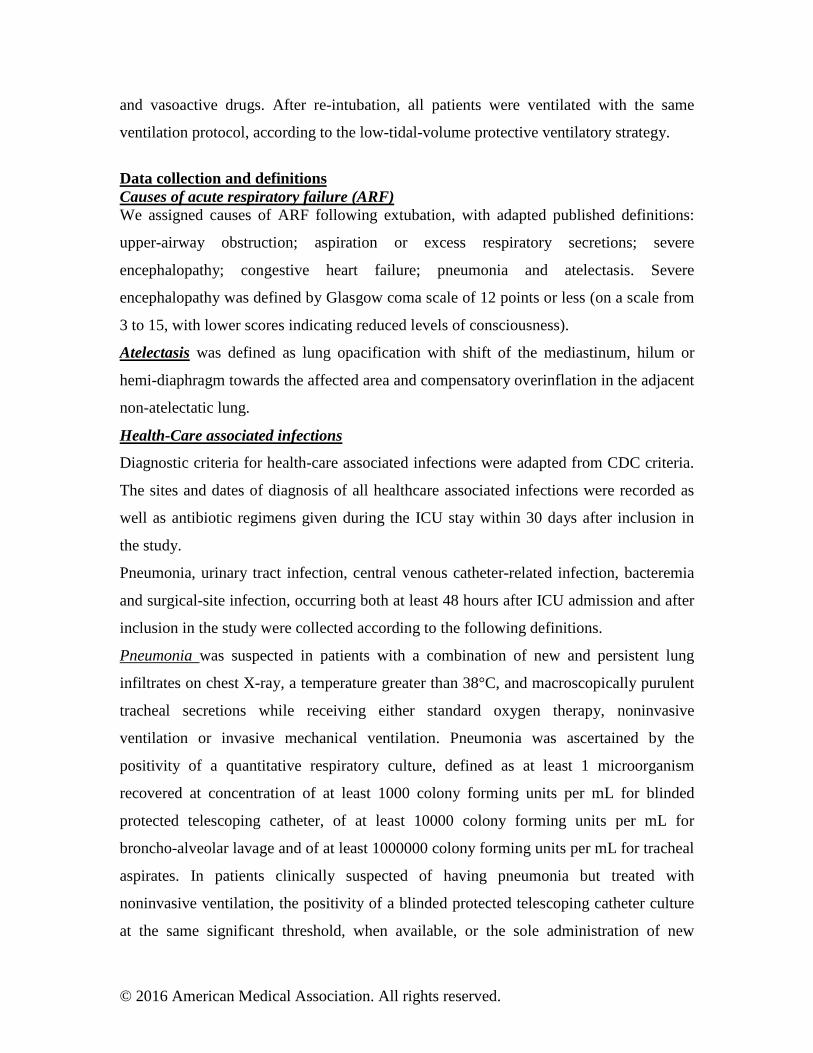
therapy alone (oxygen-group) from randomization until day 30 or ICU discharge,
whichever came first. Patients assigned to standard-oxygen therapy received
supplemental oxygen at a rate of up to 15 liters per minute in order to maintain peripheral
oxygen saturation ≥94%. In the intervention group (NIV-group), NIV was delivered
through a face mask connected to an ICU or NIV-dedicated ventilator, using either heated
humidifier or heat and moisture exchanger to warm and humidify inspired gases. NIV
was started at an inspiratory positive airway pressure of 5 cm of water and was increased
to a maximum inspiratory pressure of 15 cm of water aiming to achieve an expiratory
tidal volume between 6 to 8 ml per kilogram of predicted body weight and a respiratory
rate of less than 25 breaths per minute. Positive-end expiratory airway pressure (PEEP)
was started at 5 cm of water and was increased to a maximum of 10 cm of water. PEEP
and inspired oxygen fraction were titrated to maintain an arterial oxygen saturation
≥94%. Ventilator settings were subsequently adjusted as needed for patient comfort.
Patients in this group were encouraged to use NIV for at least 6 hours, continuously or
fractioned, during the first 24 hours after randomization. Between NIV sessions, patients
received standard-oxygen therapy as described above. The use of high-flow oxygen nasal
cannulae (>15 liters per minute) was not permitted in either group. The decision
regarding when to discontinue NIV was left to the attending physician. Participants who
did not receive the assigned treatment or who did not adhere to the protocol were
followed up in full, and their data were included in the analysis according to the
intention-to-treat principle (see statistical analysis section). All other aspects of patient
care in both groups were conducted according to each center’s routine clinical practice.
Criteria of endotracheal intubation
To reduce the risk of delayed re-intubation and to ensure the consistency of indications
for re-intubation between all trial sites, predefined criteria were applied in all
participating centers. In the two groups, immediate re-intubation was performed if the
patients met any of the following predefined major clinical events: respiratory or cardiac
arrest; respiratory pauses with loss of consciousness or gasping for air; massive
aspiration; persistent inability to clear respiratory secretions; heart rate below 50 beats per
min with loss of alertness; and severe hemodynamic instability without response to fluids
© 2016 American Medical Association. All rights reserved.
and vasoactive drugs. After re-intubation, all patients were ventilated with the same
ventilation protocol, according to the low-tidal-volume protective ventilatory strategy.
Data collection and definitions Causes of acute respiratory failure (ARF) We assigned causes of ARF following extubation, with adapted published definitions:
upper-airway obstruction; aspiration or excess respiratory secretions; severe
encephalopathy; congestive heart failure; pneumonia and atelectasis. Severe
encephalopathy was defined by Glasgow coma scale of 12 points or less (on a scale from
3 to 15, with lower scores indicating reduced levels of consciousness).
Atelectasis was defined as lung opacification with shift of the mediastinum, hilum or
hemi-diaphragm towards the affected area and compensatory overinflation in the adjacent
non-atelectatic lung.
Health-Care associated infections
Diagnostic criteria for health-care associated infections were adapted from CDC criteria.
The sites and dates of diagnosis of all healthcare associated infections were recorded as
well as antibiotic regimens given during the ICU stay within 30 days after inclusion in
the study.
Pneumonia, urinary tract infection, central venous catheter-related infection, bacteremia
and surgical-site infection, occurring both at least 48 hours after ICU admission and after
inclusion in the study were collected according to the following definitions.
Pneumonia was suspected in patients with a combination of new and persistent lung
infiltrates on chest X-ray, a temperature greater than 38°C, and macroscopically purulent
tracheal secretions while receiving either standard oxygen therapy, noninvasive
ventilation or invasive mechanical ventilation. Pneumonia was ascertained by the
positivity of a quantitative respiratory culture, defined as at least 1 microorganism
recovered at concentration of at least 1000 colony forming units per mL for blinded
protected telescoping catheter, of at least 10000 colony forming units per mL for
broncho-alveolar lavage and of at least 1000000 colony forming units per mL for tracheal
aspirates. In patients clinically suspected of having pneumonia but treated with
noninvasive ventilation, the positivity of a blinded protected telescoping catheter culture
at the same significant threshold, when available, or the sole administration of new
© 2016 American Medical Association. All rights reserved.
antibiotics in the absence of other sites of infection was used to characterize the presence
of pneumonia.
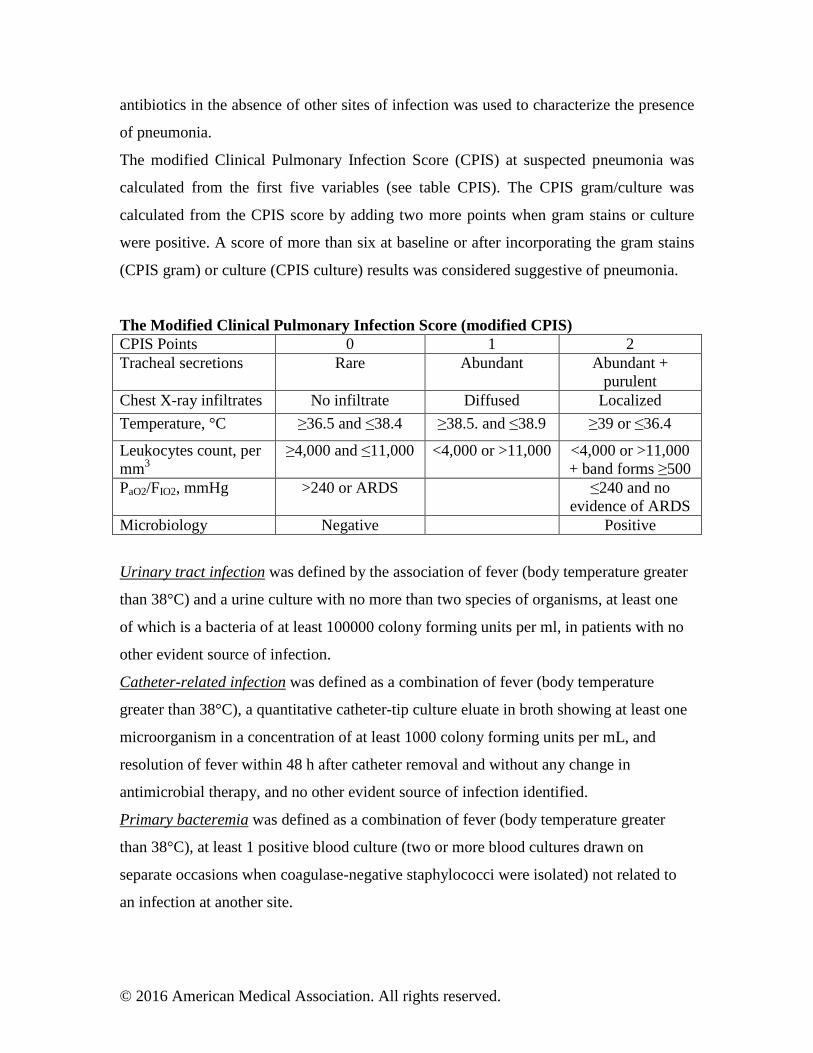
The modified Clinical Pulmonary Infection Score (CPIS) at suspected pneumonia was
calculated from the first five variables (see table CPIS). The CPIS gram/culture was
calculated from the CPIS score by adding two more points when gram stains or culture
were positive. A score of more than six at baseline or after incorporating the gram stains
(CPIS gram) or culture (CPIS culture) results was considered suggestive of pneumonia.
The Modified Clinical Pulmonary Infection Score (modified CPIS) CPIS Points 0 1 2 Tracheal secretions Rare Abundant Abundant +
purulent Chest X-ray infiltrates No infiltrate Diffused Localized
Temperature, °C ≥36.5 and ≤38.4 ≥38.5. and ≤38.9 ≥39 or ≤36.4
Leukocytes count, per mm3
≥4,000 and ≤11,000 <4,000 or >11,000 <4,000 or >11,000 + band forms ≥500
PaO2/FIO2, mmHg >240 or ARDS ≤240 and no evidence of ARDS
Microbiology Negative Positive
Urinary tract infection was defined by the association of fever (body temperature greater
than 38°C) and a urine culture with no more than two species of organisms, at least one
of which is a bacteria of at least 100000 colony forming units per ml, in patients with no
other evident source of infection.
Catheter-related infection was defined as a combination of fever (body temperature
greater than 38°C), a quantitative catheter-tip culture eluate in broth showing at least one
microorganism in a concentration of at least 1000 colony forming units per mL, and
resolution of fever within 48 h after catheter removal and without any change in
antimicrobial therapy, and no other evident source of infection identified.
Primary bacteremia was defined as a combination of fever (body temperature greater
than 38°C), at least 1 positive blood culture (two or more blood cultures drawn on
separate occasions when coagulase-negative staphylococci were isolated) not related to
an infection at another site.
© 2016 American Medical Association. All rights reserved.
Surgical-site infection diagnostic was performed according standard CDC definitions
(Mangram AJ, Horan TC, Pearson ML, Silver LC, Jarvis WR. Guideline for prevention
of surgical site infection, 1999: Hospital Infection Control Practices Advisory
Committee. Infect Control Hosp Epidemiol 1999;20:250-78).
An independent infectious disease specialist reviewed all clinical and microbiological
informations for each patient.
© 2016 American Medical Association. All rights reserved.
Definitions for outcomes The primary outcome for comparing NIV and standard-oxygen therapy was any cause of
re-intubation within 7 days following randomization. Causes and time to re-intubation
were recorded. Secondary outcomes included gas exchange, healthcare associated
infections rate within 30 days, the number of ventilator-free days (i.e. days alive and
without invasive mechanical ventilation) between day-1 and day-30, antibiotic use
duration and numbers, ICU and in-hospital lengths of stay, 30 and 90-day mortality.
© 2016 American Medical Association. All rights reserved.
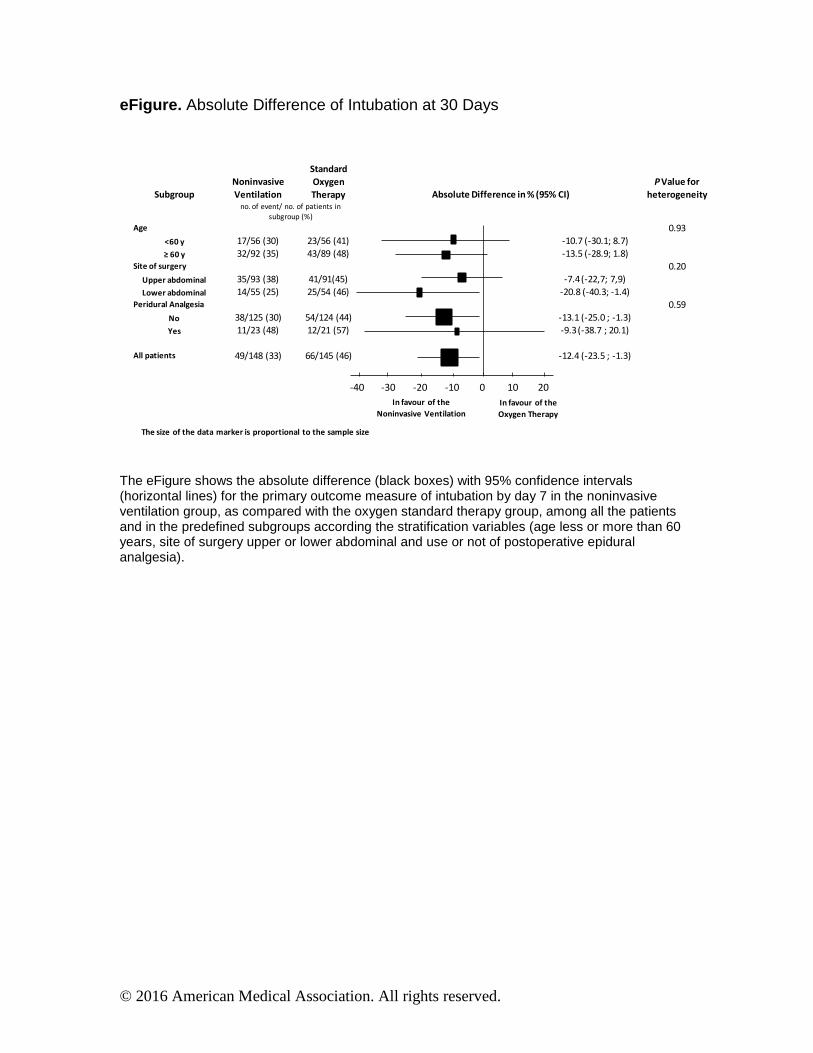
eFigure . Absolute Difference of Intubation at 30 Days
The eFigure shows the absolute difference (black boxes) with 95% confidence intervals (horizontal lines) for the primary outcome measure of intubation by day 7 in the noninvasive ventilation group, as compared with the oxygen standard therapy group, among all the patients and in the predefined subgroups according the stratification variables (age less or more than 60 years, site of surgery upper or lower abdominal and use or not of postoperative epidural analgesia).
Subgroup
Noninvasive
Ventilation
Standard
Oxygen
Therapy Absolute Difference in % (95% CI)
PValue for
heterogeneity
no. of event/ no. of patients in
subgroup (%)
Age 0.93
<60 y 17/56 (30) 23/56 (41) -10.7 (-30.1; 8.7)
д ヶヰ ┞ 32/92 (35) 43/89 (48) -13.5 (-28.9; 1.8)
Site of surgery 0.20
Upper abdominal 35/93 (38) 41/91(45) -7.4 (-22,7; 7,9)
Lower abdominal 14/55 (25) 25/54 (46) -20.8 (-40.3; -1.4)
Peridural Analgesia 0.59
No 38/125 (30) 54/124 (44) -13.1 (-25.0 ; -1.3)
Yes 11/23 (48) 12/21 (57) -9.3 (-38.7 ; 20.1)
All patients 49/148 (33) 66/145 (46) -12.4 (-23.5 ; -1.3)
-40 -30 -20 -10 0 10 20
In favour of the
Noninvasive Ventilation
In favour of the
Oxygen Therapy
The size of the data marker is proportional to the sample size
© 2016 American Medical Association. All rights reserved.
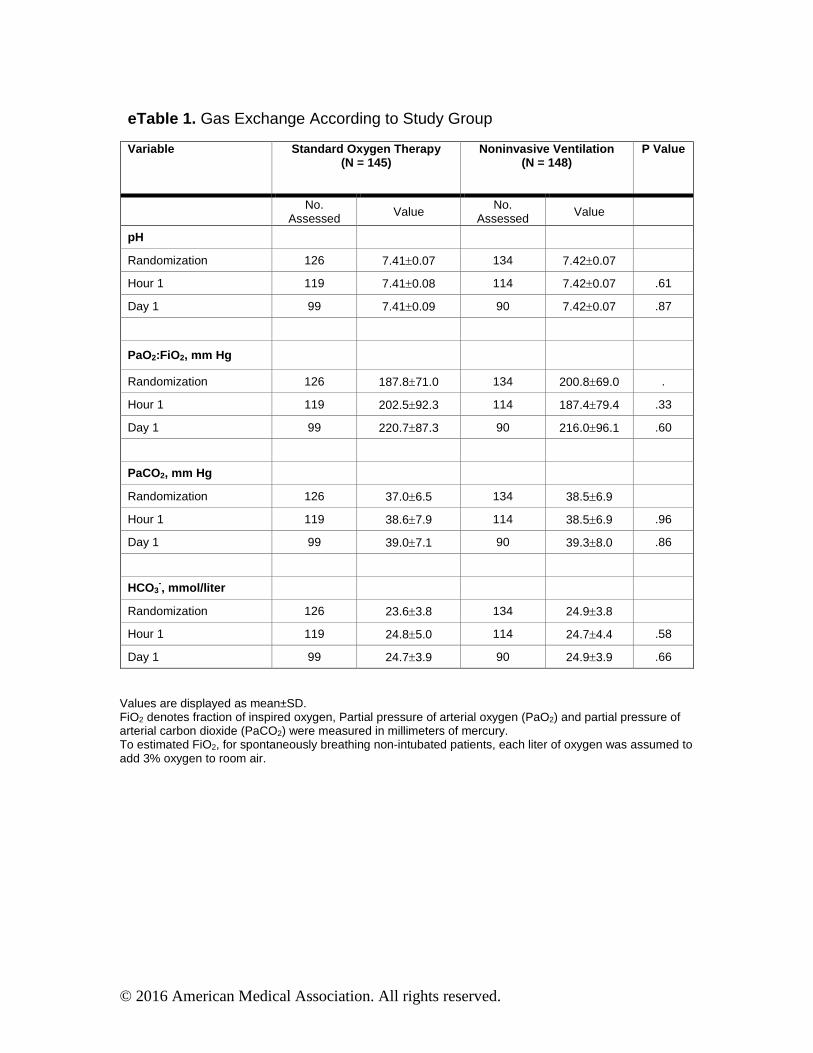
eTable 1. Gas Exchange According to Study Group
Variable Standard Oxygen Therapy (N = 145)
Noni nvasive Ventilation (N = 148)
P Value
No. Assessed Value
No. Assessed Value
pH
Randomization 126 7.41±0.07 134 7.42±0.07
Hour 1 119 7.41±0.08 114 7.42±0.07 .61
Day 1 99 7.41±0.09 90 7.42±0.07 .87
PaO2:FiO2, mm Hg
Randomization 126 187.8±71.0 134 200.8±69.0 .
Hour 1 119 202.5±92.3 114 187.4±79.4 .33
Day 1 99 220.7±87.3 90 216.0±96.1 .60
PaCO2, mm Hg
Randomization 126 37.0±6.5 134 38.5±6.9
Hour 1 119 38.6±7.9 114 38.5±6.9 .96
Day 1 99 39.0±7.1 90 39.3±8.0 .86
HCO3-, mmol/liter
Randomization 126 23.6±3.8 134 24.9±3.8
Hour 1 119 24.8±5.0 114 24.7±4.4 .58
Day 1 99 24.7±3.9 90 24.9±3.9 .66
Values are displayed as mean±SD. FiO2 denotes fraction of inspired oxygen, Partial pressure of arterial oxygen (PaO2) and partial pressure of arterial carbon dioxide (PaCO2) were measured in millimeters of mercury. To estimated FiO2, for spontaneously breathing non-intubated patients, each liter of oxygen was assumed to add 3% oxygen to room air.
© 2016 American Medical Association. All rights reserved.
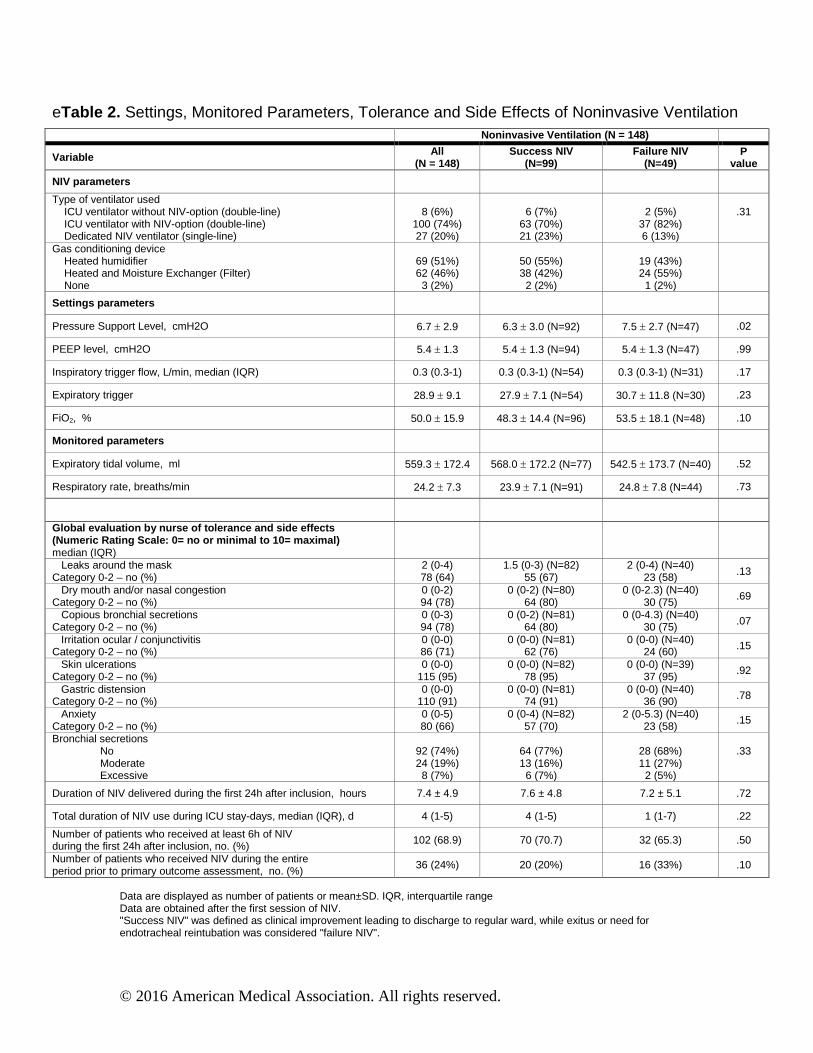
eTable 2. Settings, Monitored Parameters, Tolerance and Side Effects of Noninvasive Ventilation Noninvasive Ventilation (N = 148)
Variable All (N = 148)
Success NIV (N=99)
Failure NIV (N=49)
P value
NIV parameters
Type of ventilator used ICU ventilator without NIV-option (double-line) ICU ventilator with NIV-option (double-line) Dedicated NIV ventilator (single-line)
8 (6%)
100 (74%) 27 (20%)
6 (7%)
63 (70%) 21 (23%)
2 (5%)
37 (82%) 6 (13%)
.31
Gas conditioning device Heated humidifier Heated and Moisture Exchanger (Filter) None
69 (51%) 62 (46%) 3 (2%)
50 (55%) 38 (42%)
2 (2%)
19 (43%) 24 (55%)
1 (2%)
Settings parameters
Pressure Support Level, cmH2O 6.7 ± 2.9 6.3 ± 3.0 (N=92) 7.5 ± 2.7 (N=47) .02
PEEP level, cmH2O 5.4 ± 1.3 5.4 ± 1.3 (N=94) 5.4 ± 1.3 (N=47) .99
Inspiratory trigger flow, L/min, median (IQR) 0.3 (0.3-1) 0.3 (0.3-1) (N=54) 0.3 (0.3-1) (N=31) .17
Expiratory trigger 28.9 ± 9.1 27.9 ± 7.1 (N=54) 30.7 ± 11.8 (N=30) .23
FiO2, % 50.0 ± 15.9 48.3 ± 14.4 (N=96) 53.5 ± 18.1 (N=48) .10
Monitored parameters
Expiratory tidal volume, ml 559.3 ± 172.4 568.0 ± 172.2 (N=77) 542.5 ± 173.7 (N=40) .52
Respiratory rate, breaths/min 24.2 ± 7.3 23.9 ± 7.1 (N=91) 24.8 ± 7.8 (N=44) .73
Global evaluation by nurse of tolerance and side effects (Numeric Rating Scale: 0= no or minimal to 10= maximal) median (IQR)
Leaks around the mask Category 0-2 – no (%)
2 (0-4) 78 (64)
1.5 (0-3) (N=82) 55 (67)
2 (0-4) (N=40) 23 (58) .13
Dry mouth and/or nasal congestion Category 0-2 – no (%)
0 (0-2) 94 (78)
0 (0-2) (N=80) 64 (80)
0 (0-2.3) (N=40) 30 (75)
.69
Copious bronchial secretions Category 0-2 – no (%)
0 (0-3) 94 (78)
0 (0-2) (N=81) 64 (80)
0 (0-4.3) (N=40) 30 (75) .07
Irritation ocular / conjunctivitis Category 0-2 – no (%)
0 (0-0) 86 (71)
0 (0-0) (N=81) 62 (76)
0 (0-0) (N=40) 24 (60) .15
Skin ulcerations Category 0-2 – no (%)
0 (0-0) 115 (95)
0 (0-0) (N=82) 78 (95)
0 (0-0) (N=39) 37 (95)
.92
Gastric distension Category 0-2 – no (%)
0 (0-0) 110 (91)
0 (0-0) (N=81) 74 (91)
0 (0-0) (N=40) 36 (90) .78
Anxiety Category 0-2 – no (%)
0 (0-5) 80 (66)
0 (0-4) (N=82) 57 (70)
2 (0-5.3) (N=40) 23 (58)
.15
Bronchial secretions No Moderate Excessive
92 (74%) 24 (19%) 8 (7%)
64 (77%) 13 (16%)
6 (7%)
28 (68%) 11 (27%)
2 (5%)
.33
Duration of NIV delivered during the first 24h after inclusion, hours 7.4 ± 4.9 7.6 ± 4.8 7.2 ± 5.1 .72
Total duration of NIV use during ICU stay-days, median (IQR), d 4 (1-5) 4 (1-5) 1 (1-7) .22
Number of patients who received at least 6h of NIV during the first 24h after inclusion, no. (%) 102 (68.9) 70 (70.7) 32 (65.3) .50
Number of patients who received NIV during the entire period prior to primary outcome assessment, no. (%)
36 (24%) 20 (20%) 16 (33%) .10
Data are displayed as number of patients or mean±SD. IQR, interquartile range Data are obtained after the first session of NIV. "Success NIV" was defined as clinical improvement leading to discharge to regular ward, while exitus or need for endotracheal reintubation was considered "failure NIV".
© 2016 American Medical Association. All rights reserved.
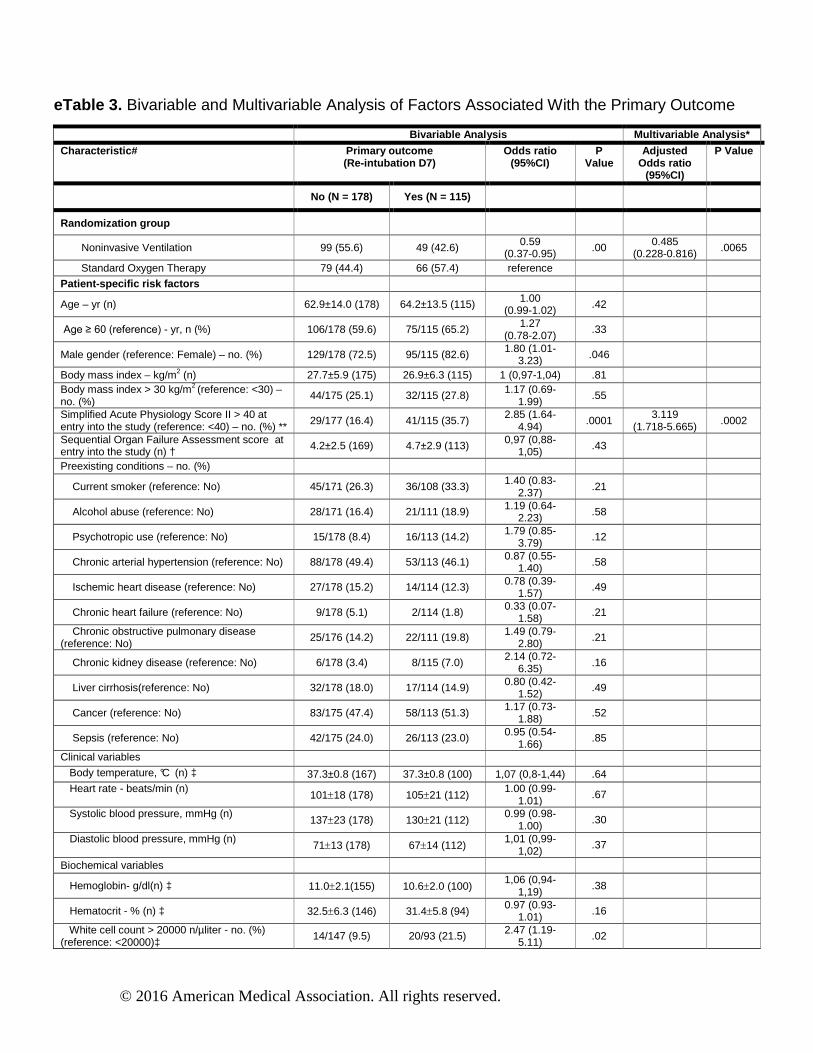
eTable 3. Bivariable and Multivariable Analysis of Factors Associated With the Primary Outcome
Bivariable Analysis Multivaria ble Analysis *
Characteristic # Primary outcome (Re-intubation D7)
Odds ratio (95%CI)
P Value
Adjusted Odds ratio
(95%CI)
P Value
No (N = 178) Yes (N = 115)
Randomization group
Noninvasive Ventilation 99 (55.6) 49 (42.6) 0.59 (0.37-0.95) .00 0.485
(0.228-0.816) .0065
Standard Oxygen Therapy 79 (44.4) 66 (57.4) reference
Patient -specific risk factors
Age – yr (n) 62.9±14.0 (178) 64.2±13.5 (115) 1.00 (0.99-1.02) .42
Age ≥ 60 (reference) - yr, n (%) 106/178 (59.6) 75/115 (65.2) 1.27 (0.78-2.07)
.33
Male gender (reference: Female) – no. (%) 129/178 (72.5) 95/115 (82.6) 1.80 (1.01-3.23) .046
Body mass index – kg/m2 (n) 27.7±5.9 (175) 26.9±6.3 (115) 1 (0,97-1,04) .81 Body mass index > 30 kg/m2 (reference: <30) – no. (%)
44/175 (25.1) 32/115 (27.8) 1.17 (0.69-1.99)
.55
Simplified Acute Physiology Score II > 40 at entry into the study (reference: <40) – no. (%) **
29/177 (16.4) 41/115 (35.7) 2.85 (1.64-
4.94) .0001 3.119
(1.718-5.665) .0002
Sequential Organ Failure Assessment score at entry into the study (n) † 4.2±2.5 (169) 4.7±2.9 (113) 0,97 (0,88-
1,05) .43
Preexisting conditions – no. (%)
Current smoker (reference: No) 45/171 (26.3) 36/108 (33.3) 1.40 (0.83-2.37)
.21
Alcohol abuse (reference: No) 28/171 (16.4) 21/111 (18.9) 1.19 (0.64-2.23) .58
Psychotropic use (reference: No) 15/178 (8.4) 16/113 (14.2) 1.79 (0.85-3.79)
.12
Chronic arterial hypertension (reference: No) 88/178 (49.4) 53/113 (46.1) 0.87 (0.55-1.40) .58
Ischemic heart disease (reference: No) 27/178 (15.2) 14/114 (12.3) 0.78 (0.39-1.57)
.49
Chronic heart failure (reference: No) 9/178 (5.1) 2/114 (1.8) 0.33 (0.07-
1.58) .21
Chronic obstructive pulmonary disease (reference: No)
25/176 (14.2) 22/111 (19.8) 1.49 (0.79-2.80)
.21
Chronic kidney disease (reference: No) 6/178 (3.4) 8/115 (7.0) 2.14 (0.72-
6.35) .16
Liver cirrhosis(reference: No) 32/178 (18.0) 17/114 (14.9) 0.80 (0.42-1.52)
.49
Cancer (reference: No) 83/175 (47.4) 58/113 (51.3) 1.17 (0.73-
1.88) .52
Sepsis (reference: No) 42/175 (24.0) 26/113 (23.0) 0.95 (0.54-1.66)
.85
Clinical variables Body temperature, °C (n) ‡ 37.3±0.8 (167) 37.3±0.8 (100) 1,07 (0,8-1,44) .64 Heart rate - beats/min (n)
101±18 (178) 105±21 (112) 1.00 (0.99-
1.01) .67
Systolic blood pressure, mmHg (n) 137±23 (178) 130±21 (112)
0.99 (0.98-1.00) .30
Diastolic blood pressure, mmHg (n) 71±13 (178) 67±14 (112)
1,01 (0,99-1,02)
.37
Biochemical variables
Hemoglobin- g/dl(n) ‡ 11.0±2.1(155) 10.6±2.0 (100) 1,06 (0,94-
1,19) .38
Hematocrit - % (n) ‡ 32.5±6.3 (146) 31.4±5.8 (94) 0.97 (0.93-
1.01) .16
White cell count > 20000 n/µliter - no. (%) (reference: <20000)‡
14/147 (9.5) 20/93 (21.5) 2.47 (1.19-5.11)
.02
© 2016 American Medical Association. All rights reserved.
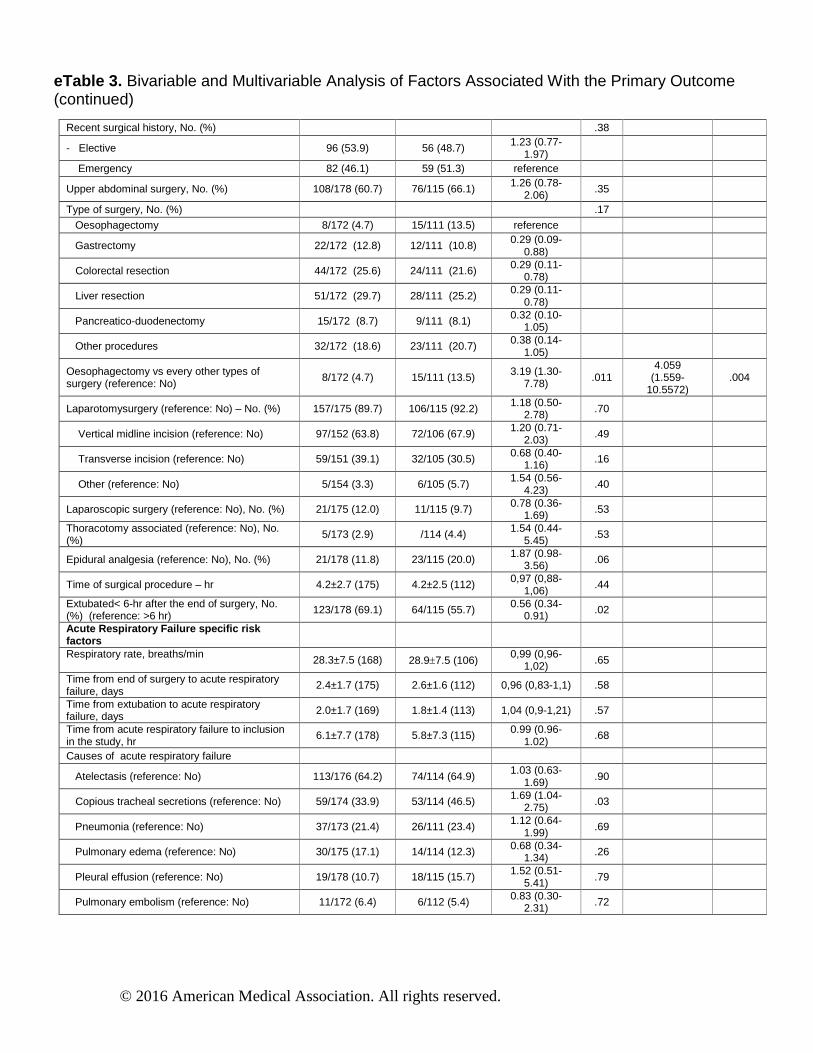
eTable 3. Bivariable and Multivariable Analysis of Factors Associated With the Primary Outcome (continued)
Recent surgical history, No. (%) .38
- Elective 96 (53.9) 56 (48.7) 1.23 (0.77-1.97)
Emergency 82 (46.1) 59 (51.3) reference
Upper abdominal surgery, No. (%) 108/178 (60.7) 76/115 (66.1) 1.26 (0.78-2.06)
.35
Type of surgery, No. (%) .17
Oesophagectomy 8/172 (4.7) 15/111 (13.5) reference
Gastrectomy 22/172 (12.8) 12/111 (10.8) 0.29 (0.09-0.88)
Colorectal resection 44/172 (25.6) 24/111 (21.6) 0.29 (0.11-0.78)
Liver resection 51/172 (29.7) 28/111 (25.2) 0.29 (0.11-0.78)
Pancreatico-duodenectomy 15/172 (8.7) 9/111 (8.1) 0.32 (0.10-1.05)
Other procedures 32/172 (18.6) 23/111 (20.7) 0.38 (0.14-1.05)
Oesophagectomy vs every other types of surgery (reference: No)
8/172 (4.7) 15/111 (13.5) 3.19 (1.30-7.78)
.011 4.059
(1.559-10.5572)
.004
Laparotomysurgery (reference: No) – No. (%) 157/175 (89.7) 106/115 (92.2) 1.18 (0.50-2.78) .70
Vertical midline incision (reference: No) 97/152 (63.8) 72/106 (67.9) 1.20 (0.71-
2.03) .49
Transverse incision (reference: No) 59/151 (39.1) 32/105 (30.5) 0.68 (0.40-1.16) .16
Other (reference: No) 5/154 (3.3) 6/105 (5.7) 1.54 (0.56-
4.23) .40
Laparoscopic surgery (reference: No), No. (%) 21/175 (12.0) 11/115 (9.7) 0.78 (0.36-1.69) .53
Thoracotomy associated (reference: No), No. (%)
5/173 (2.9) /114 (4.4) 1.54 (0.44-5.45)
.53
Epidural analgesia (reference: No), No. (%) 21/178 (11.8) 23/115 (20.0) 1.87 (0.98-3.56) .06
Time of surgical procedure – hr 4.2±2.7 (175) 4.2±2.5 (112) 0,97 (0,88-1,06)
.44
Extubated< 6-hr after the end of surgery, No. (%) (reference: >6 hr) 123/178 (69.1) 64/115 (55.7) 0.56 (0.34-
0.91) .02
Acute Respiratory Failure specific risk factors
Respiratory rate, breaths/min 28.3±7.5 (168) 28.9±7.5 (106) 0,99 (0,96-
1,02) .65
Time from end of surgery to acute respiratory failure, days
2.4±1.7 (175) 2.6±1.6 (112) 0,96 (0,83-1,1) .58
Time from extubation to acute respiratory failure, days 2.0±1.7 (169) 1.8±1.4 (113) 1,04 (0,9-1,21) .57
Time from acute respiratory failure to inclusion in the study, hr
6.1±7.7 (178) 5.8±7.3 (115) 0.99 (0.96-1.02)
.68
Causes of acute respiratory failure
Atelectasis (reference: No) 113/176 (64.2) 74/114 (64.9) 1.03 (0.63-
1.69) .90
Copious tracheal secretions (reference: No) 59/174 (33.9) 53/114 (46.5) 1.69 (1.04-2.75) .03
Pneumonia (reference: No) 37/173 (21.4) 26/111 (23.4) 1.12 (0.64-
1.99) .69
Pulmonary edema (reference: No) 30/175 (17.1) 14/114 (12.3) 0.68 (0.34-1.34) .26
Pleural effusion (reference: No) 19/178 (10.7) 18/115 (15.7) 1.52 (0.51-
5.41) .79
Pulmonary embolism (reference: No) 11/172 (6.4) 6/112 (5.4) 0.83 (0.30-2.31) .72
© 2016 American Medical Association. All rights reserved.
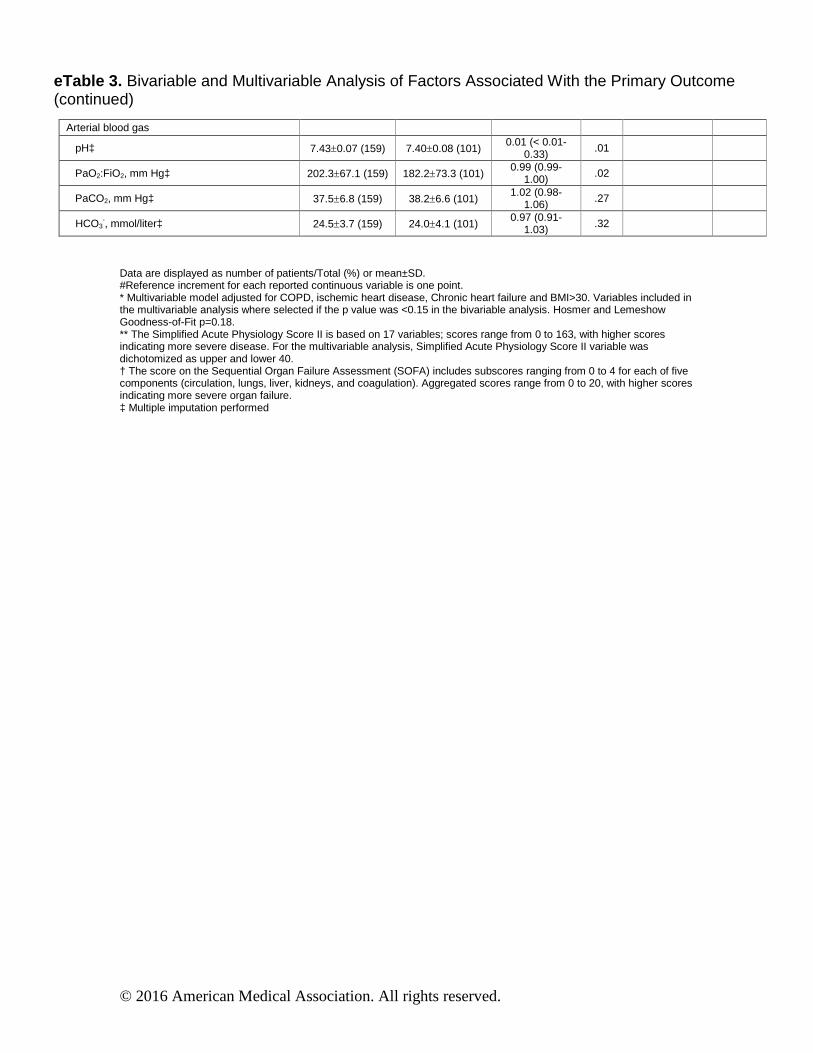
eTable 3. Bivariable and Multivariable Analysis of Factors Associated With the Primary Outcome (continued)
Data are displayed as number of patients/Total (%) or mean±SD. #Reference increment for each reported continuous variable is one point. * Multivariable model adjusted for COPD, ischemic heart disease, Chronic heart failure and BMI>30. Variables included in the multivariable analysis where selected if the p value was <0.15 in the bivariable analysis. Hosmer and Lemeshow Goodness-of-Fit p=0.18. ** The Simplified Acute Physiology Score II is based on 17 variables; scores range from 0 to 163, with higher scores indicating more severe disease. For the multivariable analysis, Simplified Acute Physiology Score II variable was dichotomized as upper and lower 40. † The score on the Sequential Organ Failure Assessment (SOFA) includes subscores ranging from 0 to 4 for each of five components (circulation, lungs, liver, kidneys, and coagulation). Aggregated scores range from 0 to 20, with higher scores indicating more severe organ failure. ‡ Multiple imputation performed
Arterial blood gas
pH‡ 7.43±0.07 (159) 7.40±0.08 (101) 0.01 (< 0.01-
0.33) .01
PaO2:FiO2, mm Hg‡ 202.3±67.1 (159) 182.2±73.3 (101) 0.99 (0.99-
1.00) .02
PaCO2, mm Hg‡ 37.5±6.8 (159) 38.2±6.6 (101) 1.02 (0.98-
1.06) .27
HCO3-, mmol/liter‡ 24.5±3.7 (159) 24.0±4.1 (101)
0.97 (0.91-1.03) .32
© 2016 American Medical Association. All rights reserved.
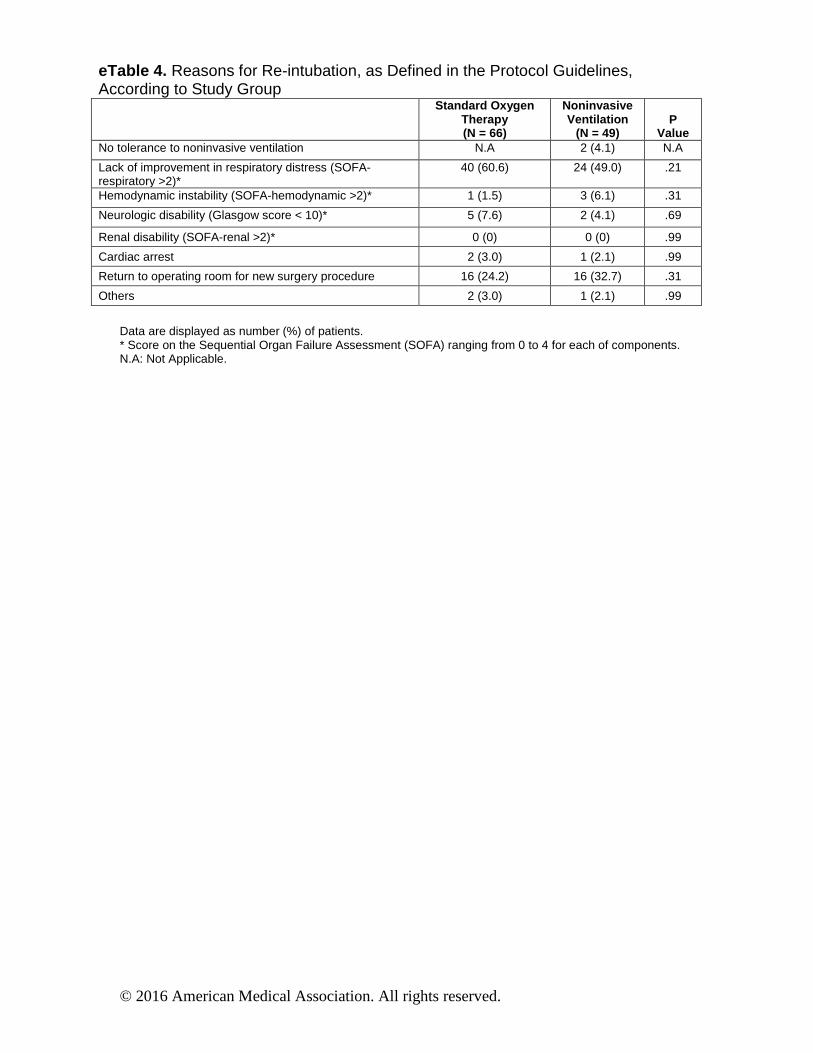
eTable 4. Reasons for Re-intubation, as Defined in the Protocol Guidelines, According to Study Group
Standard Oxygen Therapy (N = 66)
Noninvasive Ventilation
(N = 49)
P
Value No tolerance to noninvasive ventilation N.A 2 (4.1) N.A
Lack of improvement in respiratory distress (SOFA-respiratory >2)*
40 (60.6) 24 (49.0) .21
Hemodynamic instability (SOFA-hemodynamic >2)* 1 (1.5) 3 (6.1) .31
Neurologic disability (Glasgow score < 10)* 5 (7.6) 2 (4.1) .69
Renal disability (SOFA-renal >2)* 0 (0) 0 (0) .99
Cardiac arrest 2 (3.0) 1 (2.1) .99
Return to operating room for new surgery procedure 16 (24.2) 16 (32.7) .31
Others 2 (3.0) 1 (2.1) .99
Data are displayed as number (%) of patients. * Score on the Sequential Organ Failure Assessment (SOFA) ranging from 0 to 4 for each of components. N.A: Not Applicable.
© 2016 American Medical Association. All rights reserved.
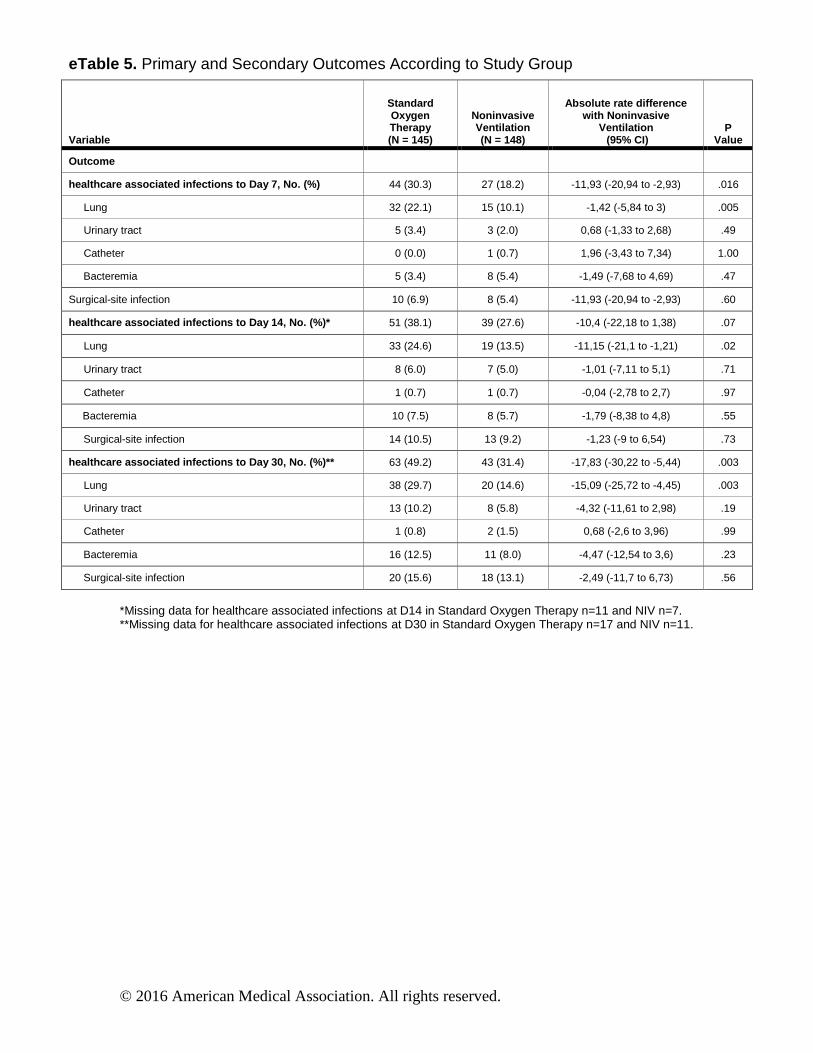
eTable 5. Primary and Secondary Outcomes According to Study Group
Variable
Standard Oxygen Therapy (N = 145)
Noninvasive Ventilation (N = 148)
Absolute rate difference with Noninvasive
Ventilation (95% CI)
P Value
Outcome
healthcare associated infections to Day 7 , No. (%) 44 (30.3) 27 (18.2) -11,93 (-20,94 to -2,93) .016
Lung 32 (22.1) 15 (10.1) -1,42 (-5,84 to 3) .005
Urinary tract 5 (3.4) 3 (2.0) 0,68 (-1,33 to 2,68) .49
Catheter 0 (0.0) 1 (0.7) 1,96 (-3,43 to 7,34) 1.00
Bacteremia 5 (3.4) 8 (5.4) -1,49 (-7,68 to 4,69) .47
Surgical-site infection 10 (6.9) 8 (5.4) -11,93 (-20,94 to -2,93) .60
healthcare associated infections to Day 14 , No. (%)* 51 (38.1) 39 (27.6) -10,4 (-22,18 to 1,38) .07
Lung 33 (24.6) 19 (13.5) -11,15 (-21,1 to -1,21) .02
Urinary tract 8 (6.0) 7 (5.0) -1,01 (-7,11 to 5,1) .71
Catheter 1 (0.7) 1 (0.7) -0,04 (-2,78 to 2,7) .97
Bacteremia 10 (7.5) 8 (5.7) -1,79 (-8,38 to 4,8) .55
Surgical-site infection 14 (10.5) 13 (9.2) -1,23 (-9 to 6,54) .73
healthcare associated infections to Day 30 , No. (%)** 63 (49.2) 43 (31.4) -17,83 (-30,22 to -5,44) .003
Lung 38 (29.7) 20 (14.6) -15,09 (-25,72 to -4,45) .003
Urinary tract 13 (10.2) 8 (5.8) -4,32 (-11,61 to 2,98) .19
Catheter 1 (0.8) 2 (1.5) 0,68 (-2,6 to 3,96) .99
Bacteremia 16 (12.5) 11 (8.0) -4,47 (-12,54 to 3,6) .23
Surgical-site infection 20 (15.6) 18 (13.1) -2,49 (-11,7 to 6,73) .56
*Missing data for healthcare associated infections at D14 in Standard Oxygen Therapy n=11 and NIV n=7. **Missing data for healthcare associated infections at D30 in Standard Oxygen Therapy n=17 and NIV n=11.
© 2016 American Medical Association. All rights reserved.
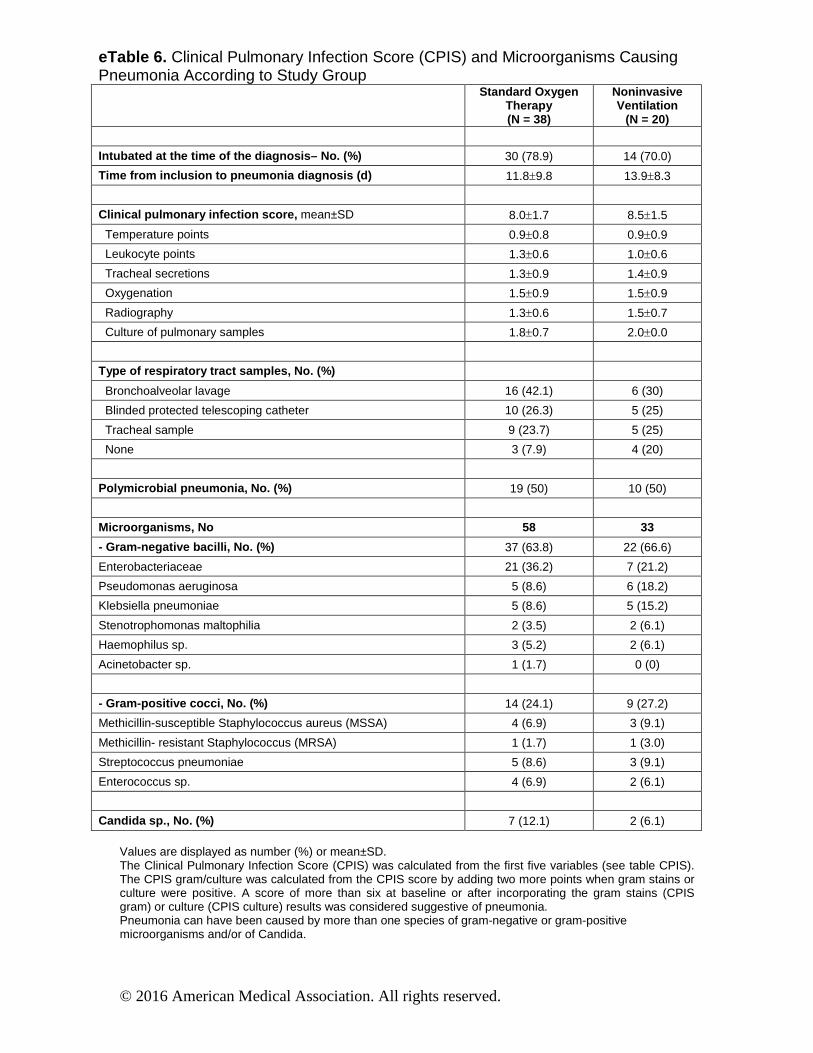
eTable 6. Clinical Pulmonary Infection Score (CPIS) and Microorganisms Causing Pneumonia According to Study Group
Standard Oxygen Therapy (N = 38)
Noninvasive Ventilation
(N = 20)
Intubated at the time of the diagnosis – No. (%) 30 (78.9) 14 (70.0)
Time from inclusion to pneumonia diagnosis (d) 11.8±9.8 13.9±8.3
Clinical pulmonary infection score, mean±SD 8.0±1.7 8.5±1.5
Temperature points 0.9±0.8 0.9±0.9
Leukocyte points 1.3±0.6 1.0±0.6
Tracheal secretions 1.3±0.9 1.4±0.9
Oxygenation 1.5±0.9 1.5±0.9
Radiography 1.3±0.6 1.5±0.7
Culture of pulmonary samples 1.8±0.7 2.0±0.0
Type of r espiratory tract samples , No. (%)
Bronchoalveolar lavage 16 (42.1) 6 (30)
Blinded protected telescoping catheter 10 (26.3) 5 (25)
Tracheal sample 9 (23.7) 5 (25)
None 3 (7.9) 4 (20)
Polymicrobial pneumonia, No. (%) 19 (50) 10 (50)
Microorganisms, No 58 33
- Gram-negative bacilli, No. (%) 37 (63.8) 22 (66.6)
Enterobacteriaceae 21 (36.2) 7 (21.2)
Pseudomonas aeruginosa 5 (8.6) 6 (18.2)
Klebsiella pneumoniae 5 (8.6) 5 (15.2)
Stenotrophomonas maltophilia 2 (3.5) 2 (6.1)
Haemophilus sp. 3 (5.2) 2 (6.1)
Acinetobacter sp. 1 (1.7) 0 (0)
- Gram-positive cocci, No. (%) 14 (24.1) 9 (27.2)
Methicillin-susceptible Staphylococcus aureus (MSSA) 4 (6.9) 3 (9.1)
Methicillin- resistant Staphylococcus (MRSA) 1 (1.7) 1 (3.0)
Streptococcus pneumoniae 5 (8.6) 3 (9.1)
Enterococcus sp. 4 (6.9) 2 (6.1)
Candida sp. , No. (%) 7 (12.1) 2 (6.1) Values are displayed as number (%) or mean±SD. The Clinical Pulmonary Infection Score (CPIS) was calculated from the first five variables (see table CPIS). The CPIS gram/culture was calculated from the CPIS score by adding two more points when gram stains or culture were positive. A score of more than six at baseline or after incorporating the gram stains (CPIS gram) or culture (CPIS culture) results was considered suggestive of pneumonia. Pneumonia can have been caused by more than one species of gram-negative or gram-positive microorganisms and/or of Candida.
© 2016 American Medical Association. All rights reserved.
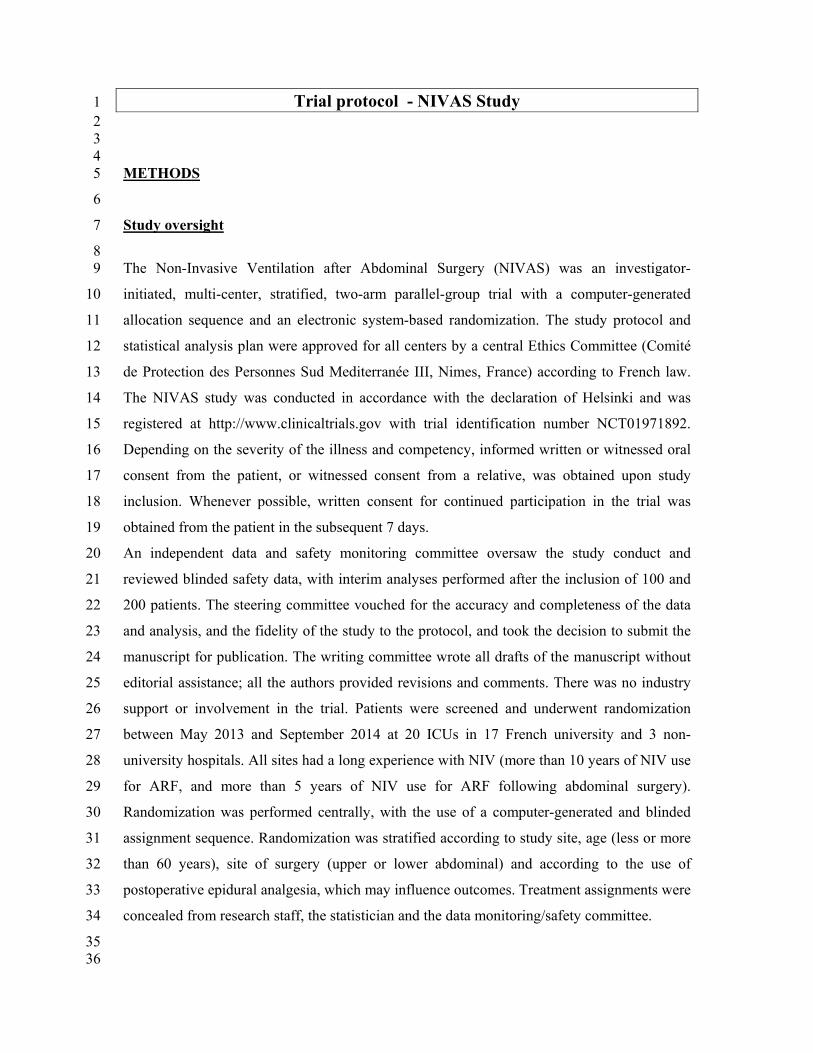
Trial protocol - NIVAS Study 1 2 3 4 METHODS 5
6
Study oversight 7
8 The Non-Invasive Ventilation after Abdominal Surgery (NIVAS) was an investigator-9
initiated, multi-center, stratified, two-arm parallel-group trial with a computer-generated 10
allocation sequence and an electronic system-based randomization. The study protocol and 11
statistical analysis plan were approved for all centers by a central Ethics Committee (Comité 12
de Protection des Personnes Sud Mediterranée III, Nimes, France) according to French law. 13
The NIVAS study was conducted in accordance with the declaration of Helsinki and was 14
registered at http://www.clinicaltrials.gov with trial identification number NCT01971892. 15
Depending on the severity of the illness and competency, informed written or witnessed oral 16
consent from the patient, or witnessed consent from a relative, was obtained upon study 17
inclusion. Whenever possible, written consent for continued participation in the trial was 18
obtained from the patient in the subsequent 7 days. 19
An independent data and safety monitoring committee oversaw the study conduct and 20
reviewed blinded safety data, with interim analyses performed after the inclusion of 100 and 21
200 patients. The steering committee vouched for the accuracy and completeness of the data 22
and analysis, and the fidelity of the study to the protocol, and took the decision to submit the 23
manuscript for publication. The writing committee wrote all drafts of the manuscript without 24
editorial assistance; all the authors provided revisions and comments. There was no industry 25
support or involvement in the trial. Patients were screened and underwent randomization 26
between May 2013 and September 2014 at 20 ICUs in 17 French university and 3 non-27
university hospitals. All sites had a long experience with NIV (more than 10 years of NIV use 28
for ARF, and more than 5 years of NIV use for ARF following abdominal surgery). 29
Randomization was performed centrally, with the use of a computer-generated and blinded 30
assignment sequence. Randomization was stratified according to study site, age (less or more 31
than 60 years), site of surgery (upper or lower abdominal) and according to the use of 32
postoperative epidural analgesia, which may influence outcomes. Treatment assignments were 33
concealed from research staff, the statistician and the data monitoring/safety committee. 34
35 36
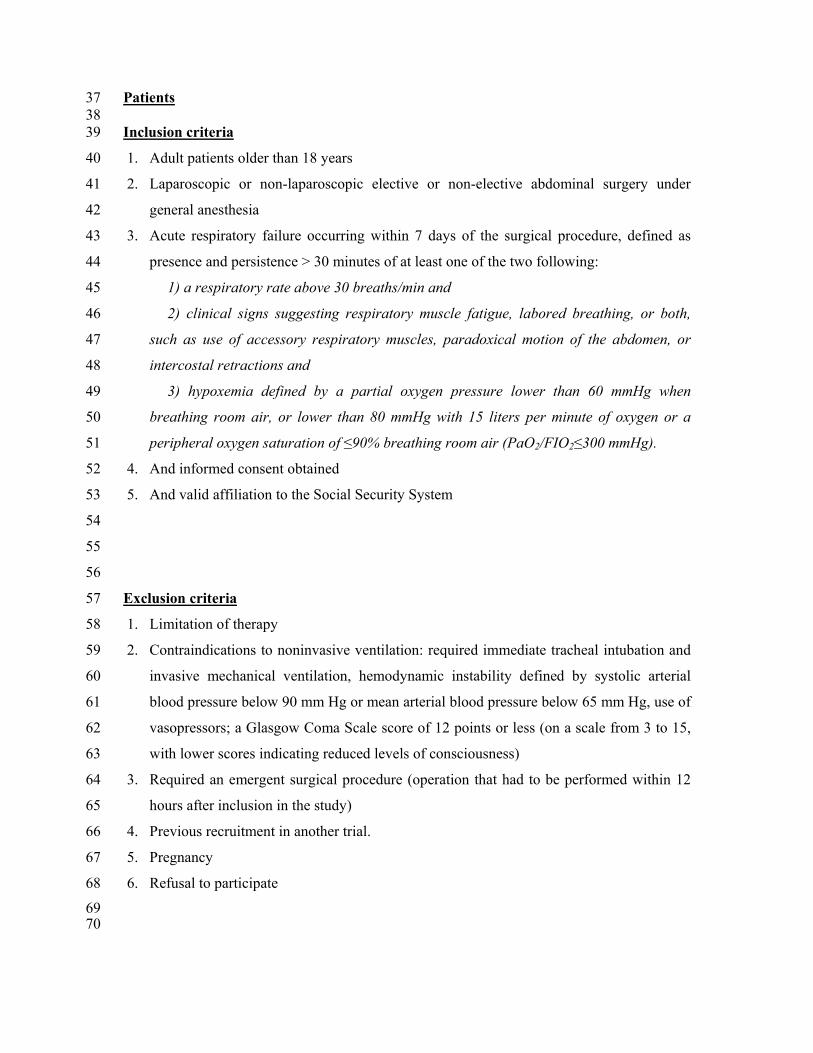
Patients 37 38 Inclusion criteria 39
1. Adult patients older than 18 years 40
2. Laparoscopic or non-laparoscopic elective or non-elective abdominal surgery under 41
general anesthesia 42
3. Acute respiratory failure occurring within 7 days of the surgical procedure, defined as 43
presence and persistence > 30 minutes of at least one of the two following: 44
1) a respiratory rate above 30 breaths/min and 45
2) clinical signs suggesting respiratory muscle fatigue, labored breathing, or both, 46
such as use of accessory respiratory muscles, paradoxical motion of the abdomen, or 47
intercostal retractions and 48
3) hypoxemia defined by a partial oxygen pressure lower than 60 mmHg when 49
breathing room air, or lower than 80 mmHg with 15 liters per minute of oxygen or a 50
peripheral oxygen saturation of ≤90% breathing room air (PaO2/FIO2≤300 mmHg). 51
4. And informed consent obtained 52
5. And valid affiliation to the Social Security System 53
54
55
56
Exclusion criteria 57
1. Limitation of therapy 58
2. Contraindications to noninvasive ventilation: required immediate tracheal intubation and 59
invasive mechanical ventilation, hemodynamic instability defined by systolic arterial 60
blood pressure below 90 mm Hg or mean arterial blood pressure below 65 mm Hg, use of 61
vasopressors; a Glasgow Coma Scale score of 12 points or less (on a scale from 3 to 15, 62
with lower scores indicating reduced levels of consciousness) 63
3. Required an emergent surgical procedure (operation that had to be performed within 12 64
hours after inclusion in the study) 65
4. Previous recruitment in another trial. 66
5. Pregnancy 67
6. Refusal to participate 68 69
70
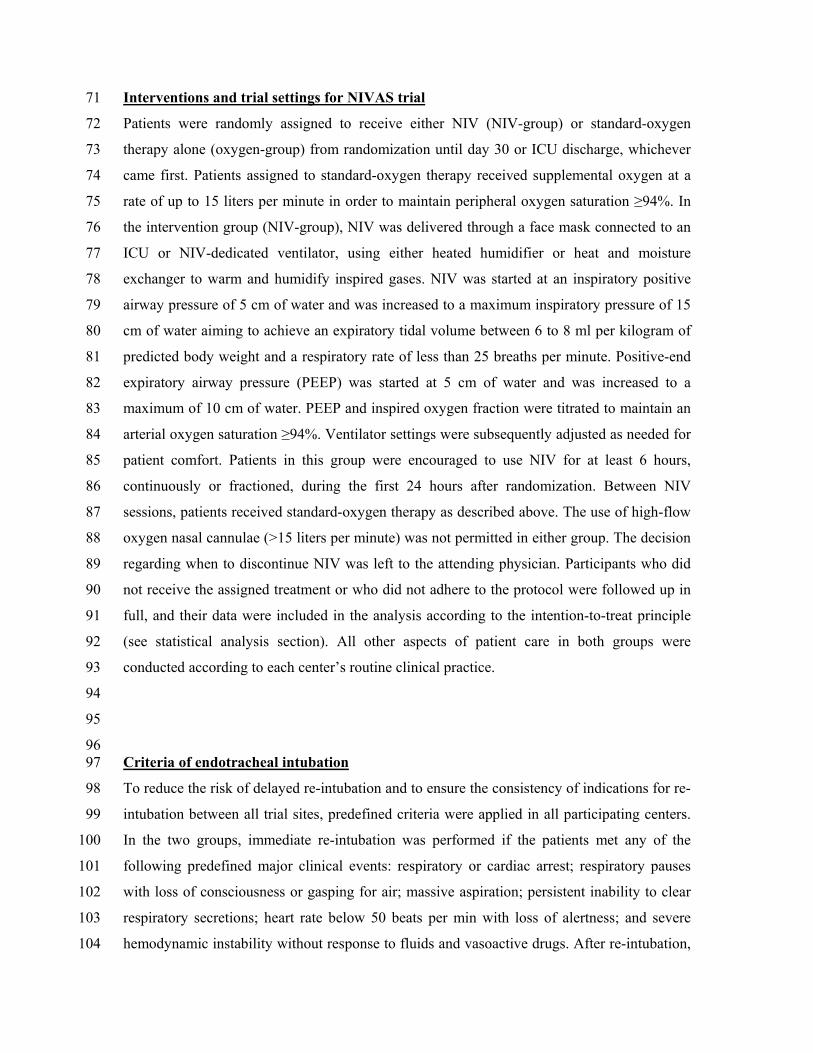
Interventions and trial settings for NIVAS trial 71
Patients were randomly assigned to receive either NIV (NIV-group) or standard-oxygen 72
therapy alone (oxygen-group) from randomization until day 30 or ICU discharge, whichever 73
came first. Patients assigned to standard-oxygen therapy received supplemental oxygen at a 74
rate of up to 15 liters per minute in order to maintain peripheral oxygen saturation ≥94%. In 75
the intervention group (NIV-group), NIV was delivered through a face mask connected to an 76
ICU or NIV-dedicated ventilator, using either heated humidifier or heat and moisture 77
exchanger to warm and humidify inspired gases. NIV was started at an inspiratory positive 78
airway pressure of 5 cm of water and was increased to a maximum inspiratory pressure of 15 79
cm of water aiming to achieve an expiratory tidal volume between 6 to 8 ml per kilogram of 80
predicted body weight and a respiratory rate of less than 25 breaths per minute. Positive-end 81
expiratory airway pressure (PEEP) was started at 5 cm of water and was increased to a 82
maximum of 10 cm of water. PEEP and inspired oxygen fraction were titrated to maintain an 83
arterial oxygen saturation ≥94%. Ventilator settings were subsequently adjusted as needed for 84
patient comfort. Patients in this group were encouraged to use NIV for at least 6 hours, 85
continuously or fractioned, during the first 24 hours after randomization. Between NIV 86
sessions, patients received standard-oxygen therapy as described above. The use of high-flow 87
oxygen nasal cannulae (>15 liters per minute) was not permitted in either group. The decision 88
regarding when to discontinue NIV was left to the attending physician. Participants who did 89
not receive the assigned treatment or who did not adhere to the protocol were followed up in 90
full, and their data were included in the analysis according to the intention-to-treat principle 91
(see statistical analysis section). All other aspects of patient care in both groups were 92
conducted according to each center’s routine clinical practice. 93
94
95
96 Criteria of endotracheal intubation 97
To reduce the risk of delayed re-intubation and to ensure the consistency of indications for re-98
intubation between all trial sites, predefined criteria were applied in all participating centers. 99
In the two groups, immediate re-intubation was performed if the patients met any of the 100
following predefined major clinical events: respiratory or cardiac arrest; respiratory pauses 101
with loss of consciousness or gasping for air; massive aspiration; persistent inability to clear 102
respiratory secretions; heart rate below 50 beats per min with loss of alertness; and severe 103
hemodynamic instability without response to fluids and vasoactive drugs. After re-intubation, 104
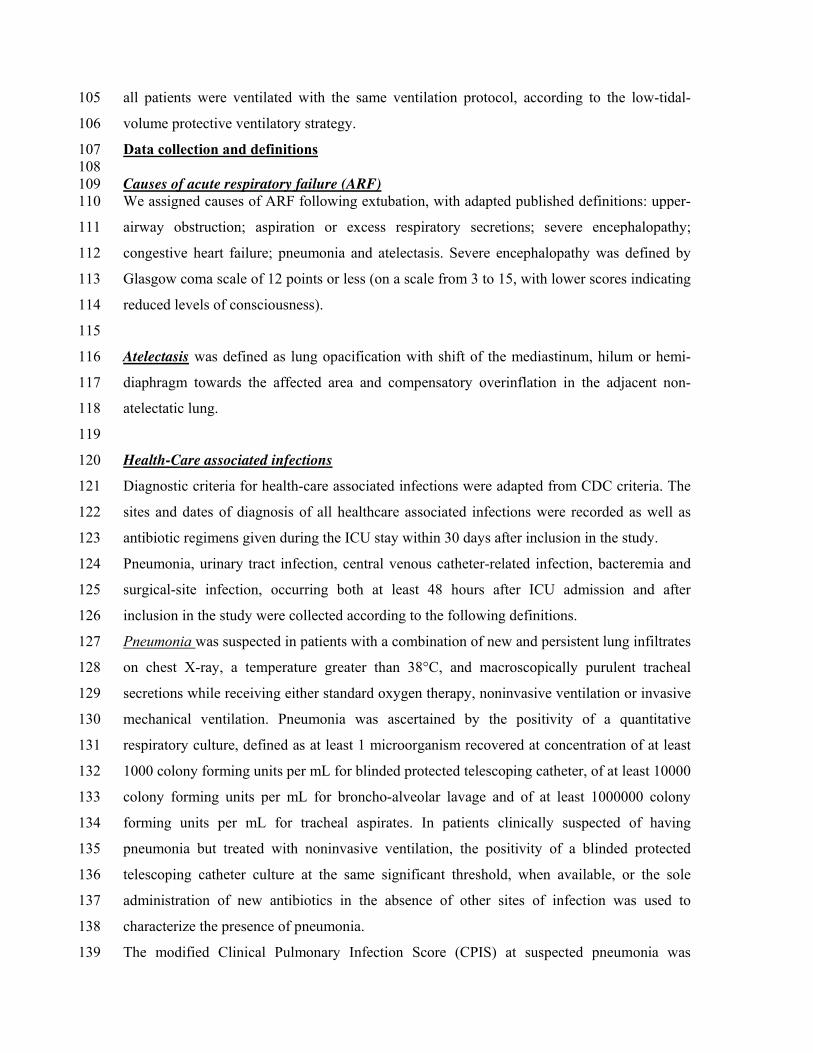
all patients were ventilated with the same ventilation protocol, according to the low-tidal-105
volume protective ventilatory strategy. 106
Data collection and definitions 107 108 Causes of acute respiratory failure (ARF) 109 We assigned causes of ARF following extubation, with adapted published definitions: upper-110
airway obstruction; aspiration or excess respiratory secretions; severe encephalopathy; 111
congestive heart failure; pneumonia and atelectasis. Severe encephalopathy was defined by 112
Glasgow coma scale of 12 points or less (on a scale from 3 to 15, with lower scores indicating 113
reduced levels of consciousness). 114
115
Atelectasis was defined as lung opacification with shift of the mediastinum, hilum or hemi-116
diaphragm towards the affected area and compensatory overinflation in the adjacent non-117
atelectatic lung. 118
119
Health-Care associated infections 120
Diagnostic criteria for health-care associated infections were adapted from CDC criteria. The 121
sites and dates of diagnosis of all healthcare associated infections were recorded as well as 122
antibiotic regimens given during the ICU stay within 30 days after inclusion in the study. 123
Pneumonia, urinary tract infection, central venous catheter-related infection, bacteremia and 124
surgical-site infection, occurring both at least 48 hours after ICU admission and after 125
inclusion in the study were collected according to the following definitions. 126
Pneumonia was suspected in patients with a combination of new and persistent lung infiltrates 127
on chest X-ray, a temperature greater than 38°C, and macroscopically purulent tracheal 128
secretions while receiving either standard oxygen therapy, noninvasive ventilation or invasive 129
mechanical ventilation. Pneumonia was ascertained by the positivity of a quantitative 130
respiratory culture, defined as at least 1 microorganism recovered at concentration of at least 131
1000 colony forming units per mL for blinded protected telescoping catheter, of at least 10000 132
colony forming units per mL for broncho-alveolar lavage and of at least 1000000 colony 133
forming units per mL for tracheal aspirates. In patients clinically suspected of having 134
pneumonia but treated with noninvasive ventilation, the positivity of a blinded protected 135
telescoping catheter culture at the same significant threshold, when available, or the sole 136
administration of new antibiotics in the absence of other sites of infection was used to 137
characterize the presence of pneumonia. 138
The modified Clinical Pulmonary Infection Score (CPIS) at suspected pneumonia was 139
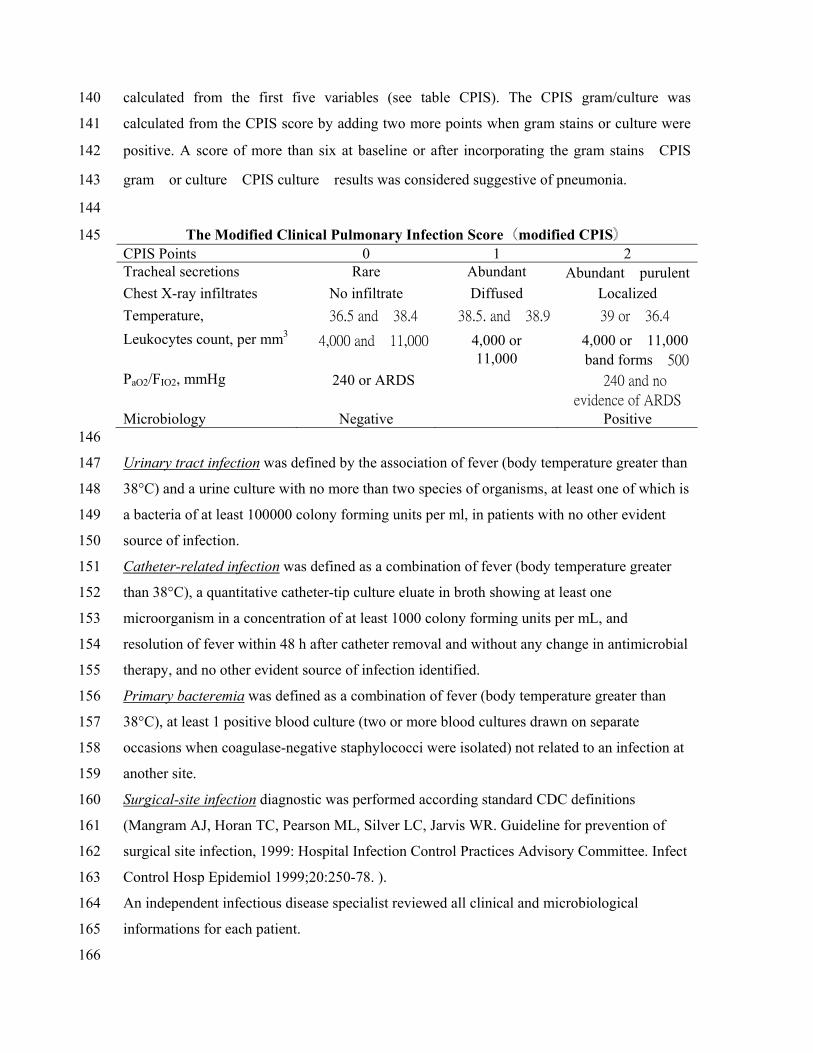
calculated from the first five variables (see table CPIS). The CPIS gram/culture was 140
calculated from the CPIS score by adding two more points when gram stains or culture were 141
positive. A score of more than six at baseline or after incorporating the gram stains㸦CPIS 142
gram㸧or culture㸦CPIS culture㸧results was considered suggestive of pneumonia. 143
144
The Modified Clinical Pulmonary Infection Score㸦modified CPIS㸧 145 CPIS Points 0 1 2 Tracheal secretions Rare Abundant Abundant㸩purulent Chest X-ray infiltrates No infiltrate Diffused Localized Temperature, Υ ӍĴķįĶġŢůťӌĴĹįĵ ӍĴĹįĶįġŢůťӌĴĹįĺ ӍĴĺġŰųӌĴķįĵ Leukocytes count, per mm3
ӍĵĭıııġŢůťӌIJIJĭııı 㸺4,000 or㸼11,000
㸺4,000 or㸼11,000㸩 band formsӍĶıı
PaO2/FIO2, mmHg 㸼240 or ARDS ӌijĵıġŢůťġůŰġ
ŦŷŪťŦůŤŦġŰŧġłœŅŔ Microbiology Negative Positive 146
Urinary tract infection was defined by the association of fever (body temperature greater than 147
38°C) and a urine culture with no more than two species of organisms, at least one of which is 148
a bacteria of at least 100000 colony forming units per ml, in patients with no other evident 149
source of infection. 150
Catheter-related infection was defined as a combination of fever (body temperature greater 151
than 38°C), a quantitative catheter-tip culture eluate in broth showing at least one 152
microorganism in a concentration of at least 1000 colony forming units per mL, and 153
resolution of fever within 48 h after catheter removal and without any change in antimicrobial 154
therapy, and no other evident source of infection identified. 155
Primary bacteremia was defined as a combination of fever (body temperature greater than 156
38°C), at least 1 positive blood culture (two or more blood cultures drawn on separate 157
occasions when coagulase-negative staphylococci were isolated) not related to an infection at 158
another site. 159
Surgical-site infection diagnostic was performed according standard CDC definitions 160
(Mangram AJ, Horan TC, Pearson ML, Silver LC, Jarvis WR. Guideline for prevention of 161
surgical site infection, 1999: Hospital Infection Control Practices Advisory Committee. Infect 162
Control Hosp Epidemiol 1999;20:250-78. ). 163
An independent infectious disease specialist reviewed all clinical and microbiological 164
informations for each patient. 165
166
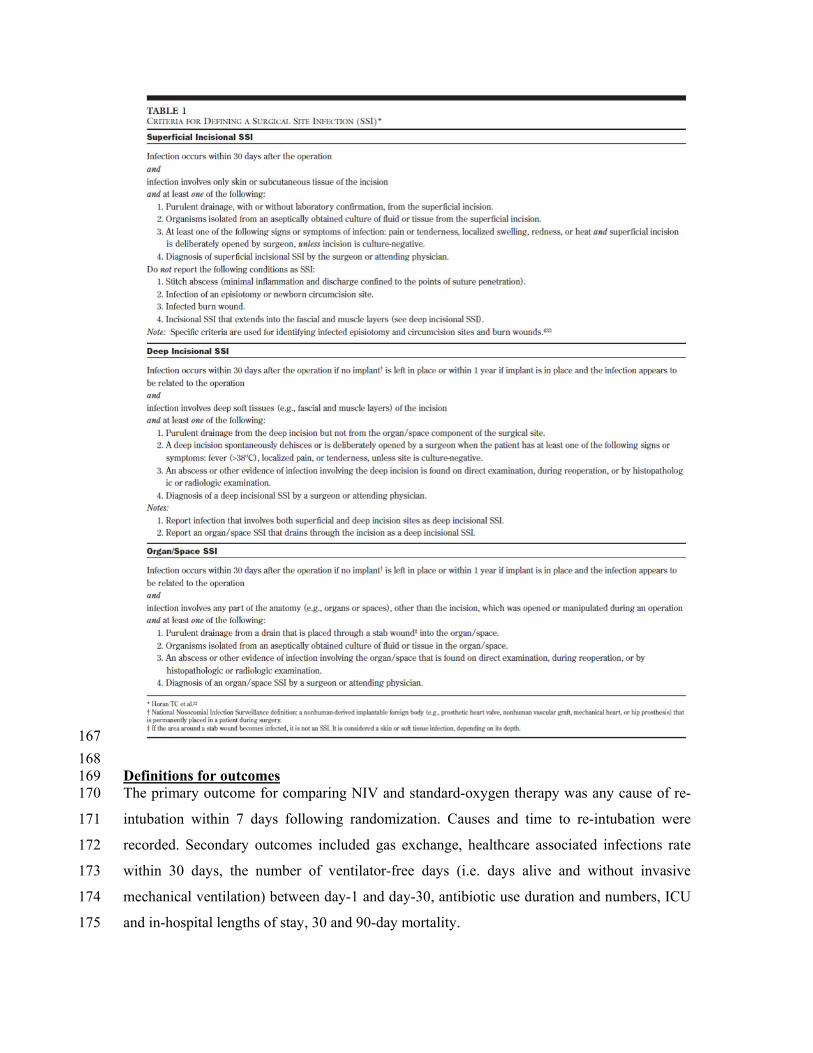
167 168 Definitions for outcomes 169 The primary outcome for comparing NIV and standard-oxygen therapy was any cause of re-170
intubation within 7 days following randomization. Causes and time to re-intubation were 171
recorded. Secondary outcomes included gas exchange, healthcare associated infections rate 172
within 30 days, the number of ventilator-free days (i.e. days alive and without invasive 173
mechanical ventilation) between day-1 and day-30, antibiotic use duration and numbers, ICU 174
and in-hospital lengths of stay, 30 and 90-day mortality. 175
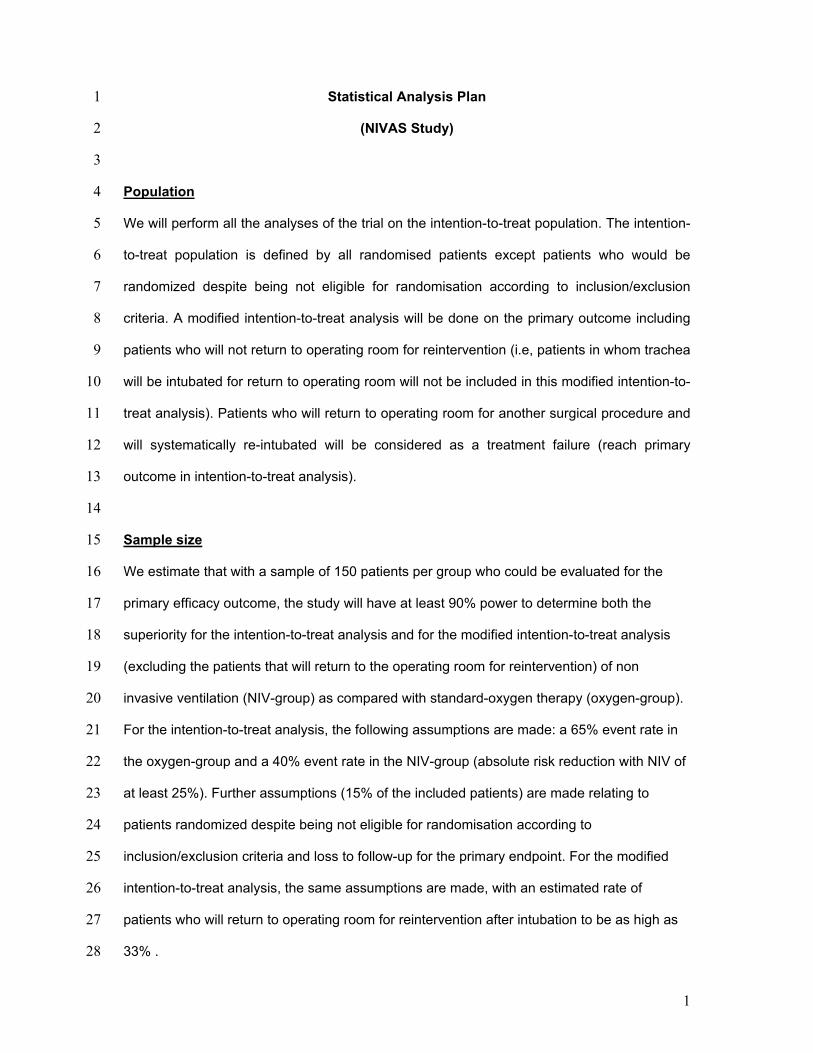
1
Statistical Analysis Plan 1
(NIVAS Study) 2
3
Population 4
We will perform all the analyses of the trial on the intention-to-treat population. The intention-5
to-treat population is defined by all randomised patients except patients who would be 6
randomized despite being not eligible for randomisation according to inclusion/exclusion 7
criteria. A modified intention-to-treat analysis will be done on the primary outcome including 8
patients who will not return to operating room for reintervention (i.e, patients in whom trachea 9
will be intubated for return to operating room will not be included in this modified intention-to-10
treat analysis). Patients who will return to operating room for another surgical procedure and 11
will systematically re-intubated will be considered as a treatment failure (reach primary 12
outcome in intention-to-treat analysis). 13
14
Sample size 15
We estimate that with a sample of 150 patients per group who could be evaluated for the 16
primary efficacy outcome, the study will have at least 90% power to determine both the 17
superiority for the intention-to-treat analysis and for the modified intention-to-treat analysis 18
(excluding the patients that will return to the operating room for reintervention) of non 19
invasive ventilation (NIV-group) as compared with standard-oxygen therapy (oxygen-group). 20
For the intention-to-treat analysis, the following assumptions are made: a 65% event rate in 21
the oxygen-group and a 40% event rate in the NIV-group (absolute risk reduction with NIV of 22
at least 25%). Further assumptions (15% of the included patients) are made relating to 23
patients randomized despite being not eligible for randomisation according to 24
inclusion/exclusion criteria and loss to follow-up for the primary endpoint. For the modified 25
intention-to-treat analysis, the same assumptions are made, with an estimated rate of 26
patients who will return to operating room for reintervention after intubation to be as high as 27
33% . 28
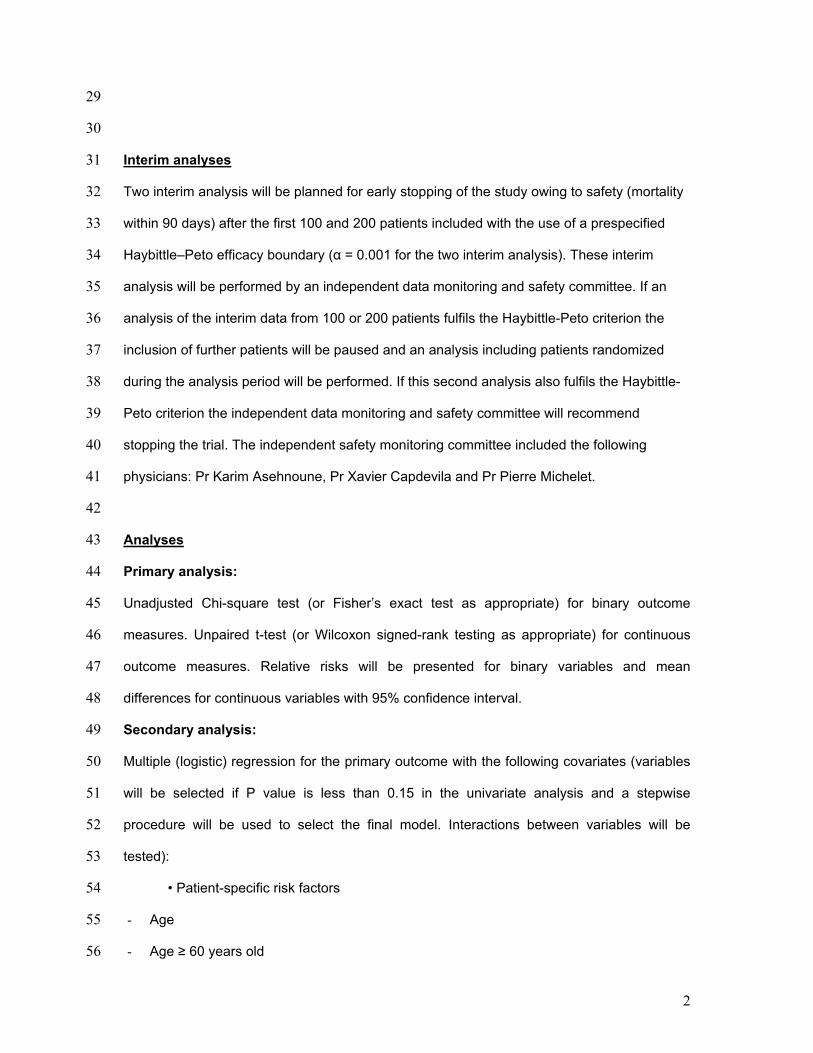
2
29
30
Interim analyses 31
Two interim analysis will be planned for early stopping of the study owing to safety (mortality 32
within 90 days) after the first 100 and 200 patients included with the use of a prespecified 33
Haybittle–Peto efficacy boundary (g = 0.001 for the two interim analysis). These interim 34
analysis will be performed by an independent data monitoring and safety committee. If an 35
analysis of the interim data from 100 or 200 patients fulfils the Haybittle-Peto criterion the 36
inclusion of further patients will be paused and an analysis including patients randomized 37
during the analysis period will be performed. If this second analysis also fulfils the Haybittle-38
Peto criterion the independent data monitoring and safety committee will recommend 39
stopping the trial. The independent safety monitoring committee included the following 40
physicians: Pr Karim Asehnoune, Pr Xavier Capdevila and Pr Pierre Michelet. 41
42
Analyses 43
Primary analysis: 44
Unadjusted Chi-square test (or Fisher’s exact test as appropriate) for binary outcome 45
measures. Unpaired t-test (or Wilcoxon signed-rank testing as appropriate) for continuous 46
outcome measures. Relative risks will be presented for binary variables and mean 47
differences for continuous variables with 95% confidence interval. 48
Secondary analysis: 49
Multiple (logistic) regression for the primary outcome with the following covariates (variables 50
will be selected if P value is less than 0.15 in the univariate analysis and a stepwise 51
procedure will be used to select the final model. Interactions between variables will be 52
tested): 53
• Patient-specific risk factors 54
- Age 55
- Age ≥ 60 years old 56
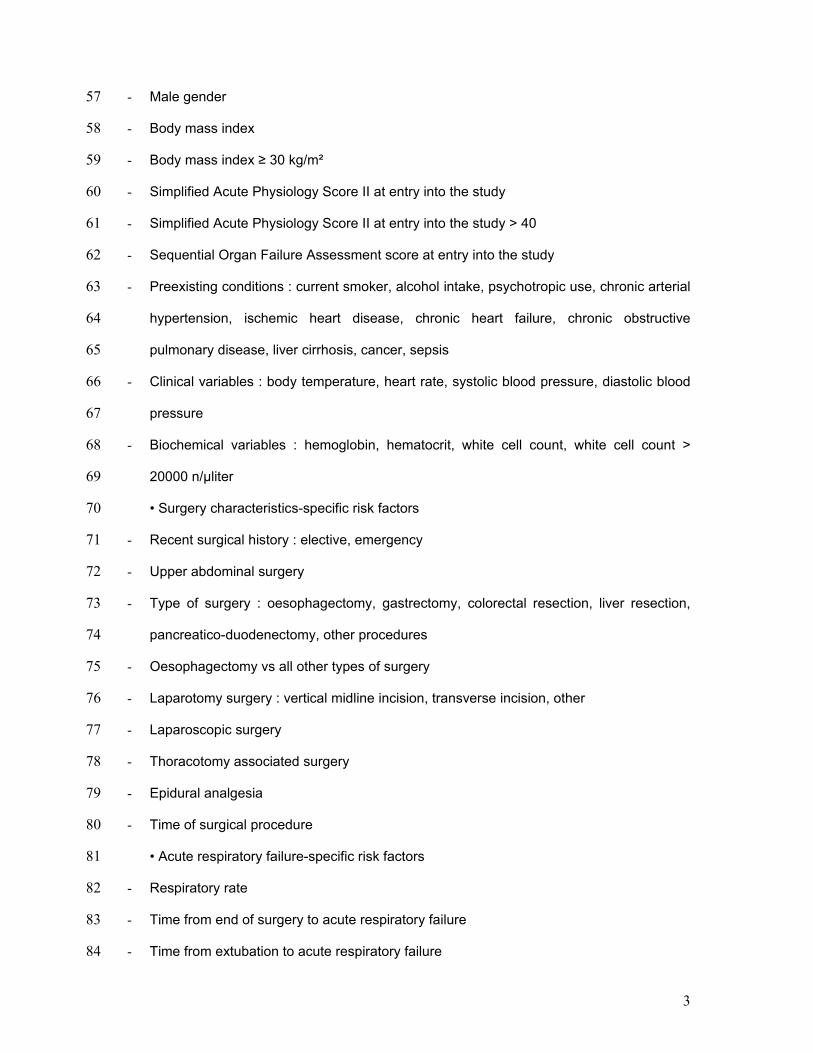
3
- Male gender 57
- Body mass index 58
- Body mass index ≥ 30 kg/m² 59
- Simplified Acute Physiology Score II at entry into the study 60
- Simplified Acute Physiology Score II at entry into the study > 40 61
- Sequential Organ Failure Assessment score at entry into the study 62
- Preexisting conditions : current smoker, alcohol intake, psychotropic use, chronic arterial 63
hypertension, ischemic heart disease, chronic heart failure, chronic obstructive 64
pulmonary disease, liver cirrhosis, cancer, sepsis 65
- Clinical variables : body temperature, heart rate, systolic blood pressure, diastolic blood 66
pressure 67
- Biochemical variables : hemoglobin, hematocrit, white cell count, white cell count > 68
20000 n/µliter 69
• Surgery characteristics-specific risk factors 70
- Recent surgical history : elective, emergency 71
- Upper abdominal surgery 72
- Type of surgery : oesophagectomy, gastrectomy, colorectal resection, liver resection, 73
pancreatico-duodenectomy, other procedures 74
- Oesophagectomy vs all other types of surgery 75
- Laparotomy surgery : vertical midline incision, transverse incision, other 76
- Laparoscopic surgery 77
- Thoracotomy associated surgery 78
- Epidural analgesia 79
- Time of surgical procedure 80
• Acute respiratory failure-specific risk factors 81
- Respiratory rate 82
- Time from end of surgery to acute respiratory failure 83
- Time from extubation to acute respiratory failure 84
4
- Time from acute respiratory failure to inclusion in the study 85
- Causes of acute respiratory failure (atelectasis, copious tracheal secretions, pneumonia, 86
pulmonary edema, pleural effusion, pulmonary embolism, others) 87
- Arterial blood gases : pH, PaO2/FiO2, PaCO2, HCO3- 88
We will compare the primary outcome in prespecified subgroups defined by stratification 89
criteria according to age (less or more 60 years), site of surgery (upper or lower abdominal) 90
and use or not use of epidural analgesia. 91
The Kaplan-Meier curves for 30-days re-intubation and for 90-days mortality will be plotted 92
and compared by the log-rank test. 93
94
Outcomes 95
96
Primary outcome measure: 97
- Re-intubation within 7 days following randomization. 98
99
Secondary outcome measures: 100
- Reintubation within 14 days 101
- Reintubation within 30 days 102
- ICU-acquired infection within 7, 14 and 30 days 103
- Mortality within 30 days and 90-days 104
- Duration of Invasive Ventilation within 14 days, 30 days,90 days 105
- Invasive ventilatory free days within 14 days, 30 days, 90 days 106
- Intensive care unit (ICU) and in hospital lengths of stay within 90 days 107
- ICU free days within 14 days, 30 days, 90 days 108
109
Tolerance of NIV will also be analyzed separately: 110
- leaks around the mask 111
- dry mouth and/or nasal congestion 112
5
- copious bronchial secretions 113
- ocular irritation 114
- skin ulcerations 115
- gastric distension 116
- anxiety 117
- bronchial secretions (no/moderate/excessive) 118
NIV settings and monitored parameters will be presented for reintubated and for non 119
reintubated patients in the noninvasive ventilation group. 120
121
Missing data 122
Due to the low rate of predicted missing values, we will not use any imputation method. 123
Analyses will be performed on the complete cases. We expect to have full data sets on all 124
patients. If not, we will indicate in each table the number of observed data. In case of 125
unexpected high rate of missing values (>15%), we will use for the secondary outcomes a 126
multiple imputation method. 127
128
Software 129
All data analysis will be conducted with SAS statistical software, version 9.3. 130