effect of misalignment on the cutting force signature in drilling
TRANSCRIPT
Effect of misalignment on the cutting force signature in drilling
A. Al-HamdanMechanical Engineering Department, Mutah University, Mutah, Karak, Jordan
Received 27 June 2000; accepted 2 January 2002
Abstract
This paper presents a study which investigates the effect of misalignment between the axes of rotation of drill and the workpiece on the
steady-state and dynamic of the axial cutting force and torque. A novel methodology has been proposed to measure the misalignment between
the axes of rotation of the drill and the workpiece. This uses a laser-based system to measure this misalignment, where a reference beam has
been generated by a laser tube, which is held in the chuck of the machine using a special enclosure. The laser beam is captured by a photo
sensor camera having a video capture card. To study the effect of the misalignment, the starting bush was intentionally misaligned by moving
the pressure head over the carriage using the lead screw of the cross slide. # 2002 Published by Elsevier Science B.V.
Keywords: Metal cutting; Drilling; Deep-hole machining; Image processing; Misalignment; Cutting forces
1. Introduction
The relative position and motion between the tool and
workpiece may affect both the steady-state and dynamic
cutting forces dramatically. Thus it becomes difficult to
distinguish between the cutting signature due to the dynamic
response of the cutting process and that due to the noise
originating from any inaccuracy in the position of the
workpiece relative to the cutting tool. Surprisingly, there
has been little attention paid to this effect in previous studies.
Some of the scatter in the cutting force measurements
reported in the literature may be partially explained by
the mentioned inaccuracy. This becomes particularly impor-
tant if a new model of chip formation has to be verified by
experiments.
In deep-hole drilling (BTA), the relative location of the
tool and the workpiece is defined by the relative location of
the axes of rotation of the tool, workpiece and starting bush
as shown in Fig. 1.
Sakuma et al. [1–3] investigated run-out in deep holes
drilled under different misalignment conditions. The authors
kept changing between gun drills and BTA drills when
running experiments with different setups. Thus the work
has no clear reference to a particular type of tool or tool
geometry. Further to this no information was provided on the
rigidity of the boring they used in the experiments.
In tool rotating systems the misalignment of the pilot bush
or a tool shank support makes the path of the tool deviate and
causes the axes to deviate from a straight path [4]. Being a
self-guided machining process, the straightness error on the
hole axis is further affected by the rigidity of the tool–work–
machine system. The straightness of the hole axes produced
by BTA drilling is usually measured as the run-out measure-
ments are influenced by the setting errors while drilling,
namely offset and nonparallelism of axes of tool and work-
piece. Therefore, a different approach is necessary to study
the error on the straightness of the axis, eliminating the
setting errors [5].
Katsuki et al. [6] studied the influence of the shape of the
cutting edge on axial hole deviation in deep drilling.
So far, there has been no systematic study of the overall
effect of misalignment on tool wear and tool performance,
except for the study on its effect on run-out [3]. In general,
authors attribute a variety of undesirable effects to misalign-
ment but mostly as experience-based guesswork. Common
problems include the cutting edge flaking or chipping,
leading pad wear, poor surface finish, straightness and
roundness. Also, literature sources cite that misalignment
related problems may and may not be accompanied by
excessive vibration [7].
The section to follow presents the experimental setup and
the procedure used to measure the cutting forces in deep-hole
machining. This encompasses the elements of the setup such
as the machine, the workpiece material, the cutting tool
and the dynamometer. This section covers also the measuring
setup and its calibration. The next section presents the
proposed methodology and the specially designed setup for
misalignment assurance, which is followed by the calibration
Journal of Materials Processing Technology 124 (2002) 83–91
E-mail address: [email protected] (A. Al-Hamdan).
0924-0136/02/$ – see front matter # 2002 Published by Elsevier Science B.V.
PII: S 0 9 2 4 - 0 1 3 6 ( 0 2 ) 0 0 0 5 1 - 1
of the misalignment assurance setup. This followed by the
presentation and discussion of the experimental results. The
last section outlines the conclusions of this study.
2. Cutting forces measurement
2.1. Experimental setup
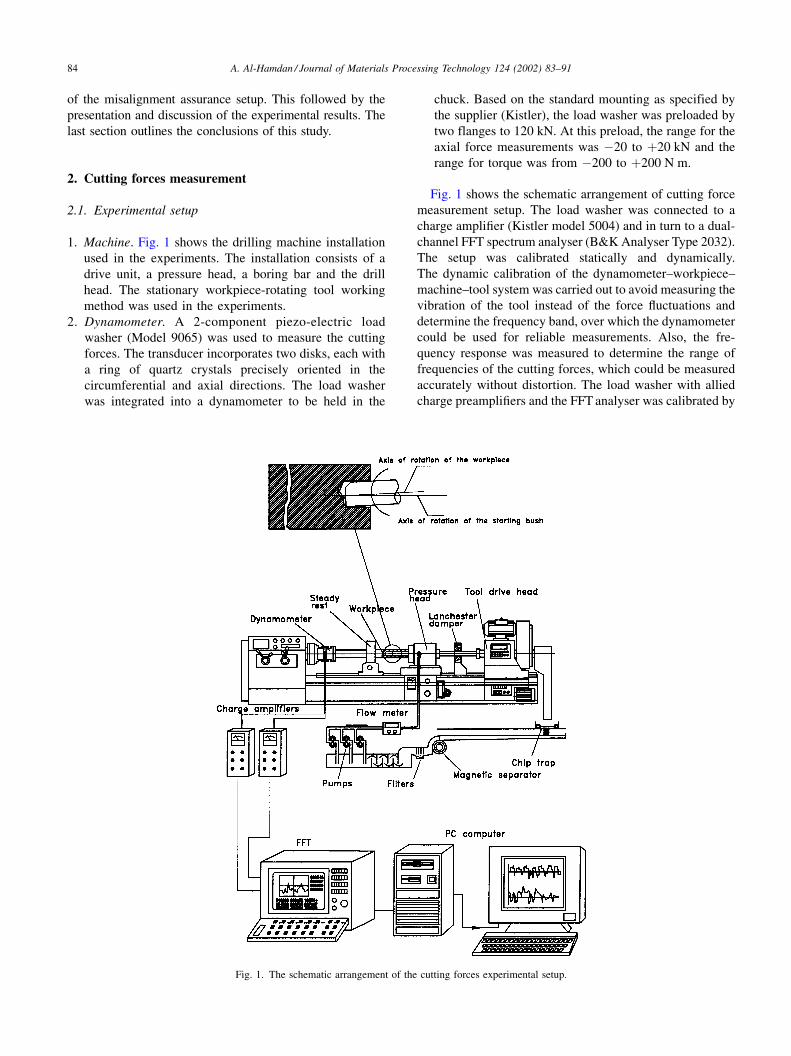
1. Machine. Fig. 1 shows the drilling machine installation
used in the experiments. The installation consists of a
drive unit, a pressure head, a boring bar and the drill
head. The stationary workpiece-rotating tool working
method was used in the experiments.
2. Dynamometer. A 2-component piezo-electric load
washer (Model 9065) was used to measure the cutting
forces. The transducer incorporates two disks, each with
a ring of quartz crystals precisely oriented in the
circumferential and axial directions. The load washer
was integrated into a dynamometer to be held in the
chuck. Based on the standard mounting as specified by
the supplier (Kistler), the load washer was preloaded by
two flanges to 120 kN. At this preload, the range for the
axial force measurements was �20 to þ20 kN and the
range for torque was from �200 to þ200 N m.
Fig. 1 shows the schematic arrangement of cutting force
measurement setup. The load washer was connected to a
charge amplifier (Kistler model 5004) and in turn to a dual-
channel FFT spectrum analyser (B&K Analyser Type 2032).
The setup was calibrated statically and dynamically.
The dynamic calibration of the dynamometer–workpiece–
machine–tool system was carried out to avoid measuring the
vibration of the tool instead of the force fluctuations and
determine the frequency band, over which the dynamometer
could be used for reliable measurements. Also, the fre-
quency response was measured to determine the range of
frequencies of the cutting forces, which could be measured
accurately without distortion. The load washer with allied
charge preamplifiers and the FFT analyser was calibrated by
Fig. 1. The schematic arrangement of the cutting forces experimental setup.
84 A. Al-Hamdan / Journal of Materials Processing Technology 124 (2002) 83–91
striking the dynamometer with Kistler hammer (Model 912).
To examine the validity of the measurement, the coherence
function was calculated for the thrust force and the torque.
2.2. Cutting tool
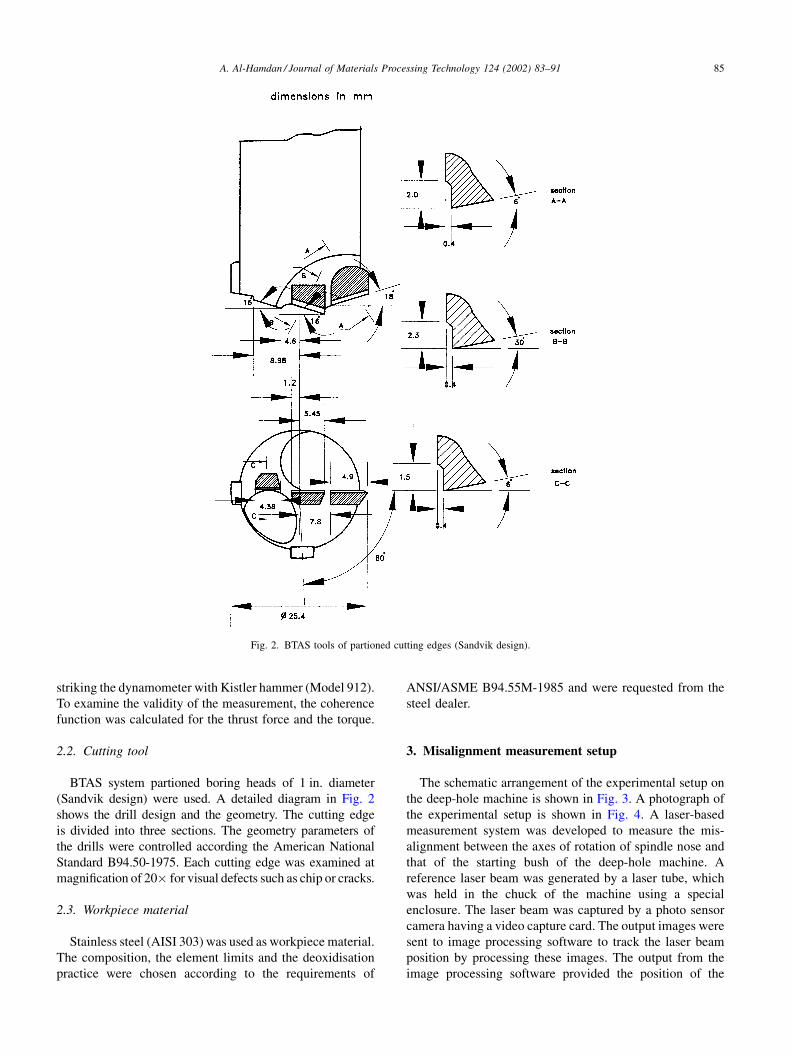
BTAS system partioned boring heads of 1 in. diameter
(Sandvik design) were used. A detailed diagram in Fig. 2
shows the drill design and the geometry. The cutting edge
is divided into three sections. The geometry parameters of
the drills were controlled according the American National
Standard B94.50-1975. Each cutting edge was examined at
magnification of 20� for visual defects such as chip or cracks.
2.3. Workpiece material
Stainless steel (AISI 303) was used as workpiece material.
The composition, the element limits and the deoxidisation
practice were chosen according to the requirements of
ANSI/ASME B94.55M-1985 and were requested from the
steel dealer.
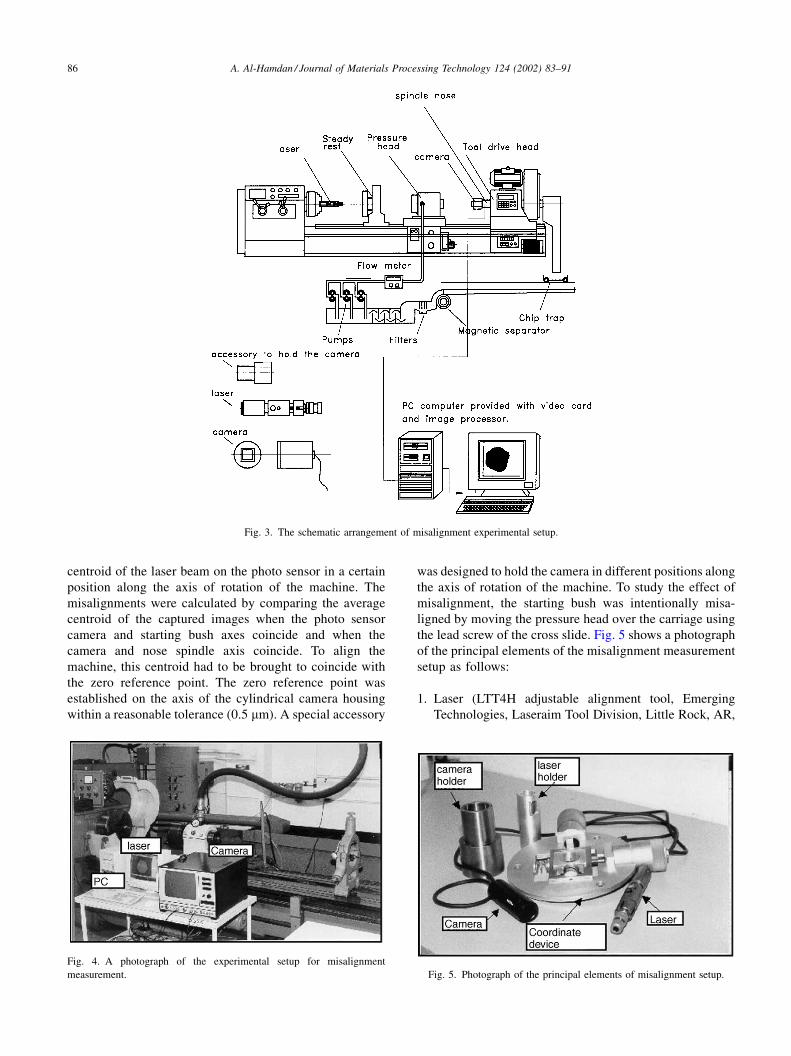
3. Misalignment measurement setup
The schematic arrangement of the experimental setup on
the deep-hole machine is shown in Fig. 3. A photograph of
the experimental setup is shown in Fig. 4. A laser-based
measurement system was developed to measure the mis-
alignment between the axes of rotation of spindle nose and
that of the starting bush of the deep-hole machine. A
reference laser beam was generated by a laser tube, which
was held in the chuck of the machine using a special
enclosure. The laser beam was captured by a photo sensor
camera having a video capture card. The output images were
sent to image processing software to track the laser beam
position by processing these images. The output from the
image processing software provided the position of the
Fig. 2. BTAS tools of partioned cutting edges (Sandvik design).
A. Al-Hamdan / Journal of Materials Processing Technology 124 (2002) 83–91 85
centroid of the laser beam on the photo sensor in a certain
position along the axis of rotation of the machine. The
misalignments were calculated by comparing the average
centroid of the captured images when the photo sensor
camera and starting bush axes coincide and when the
camera and nose spindle axis coincide. To align the
machine, this centroid had to be brought to coincide with
the zero reference point. The zero reference point was
established on the axis of the cylindrical camera housing
within a reasonable tolerance (0.5 mm). A special accessory
was designed to hold the camera in different positions along
the axis of rotation of the machine. To study the effect of
misalignment, the starting bush was intentionally misa-
ligned by moving the pressure head over the carriage using
the lead screw of the cross slide. Fig. 5 shows a photograph
of the principal elements of the misalignment measurement
setup as follows:
1. Laser (LTT4H adjustable alignment tool, Emerging
Technologies, Laseraim Tool Division, Little Rock, AR,
Fig. 3. The schematic arrangement of misalignment experimental setup.
Fig. 4. A photograph of the experimental setup for misalignment
measurement. Fig. 5. Photograph of the principal elements of misalignment setup.
86 A. Al-Hamdan / Journal of Materials Processing Technology 124 (2002) 83–91
USA). This laser projected a straight beam visible as a
‘‘dot’’ of laser light on distant surfaces. This beam is
used as a straight reference line over its entire length.
The tool had an adjustable focus feature which can
control the laser dot size on a surface located
perpendicular to the beam (referred to as the screen).
This adjustment allowed the use of the smallest possible
dot size at a specific distance, thus facilitating more
accurate measurements. Since the focus adjustment was
also linear, a change in the focus would not affect the X
and Y alignment. In practical terms, this means that the
smallest possible dot size could be used close to the tool
and then when the screen was more distance, the tool
may be re-focused again to the smallest possible dot,
keeping the centroid of these two dots on the same
plane.
2. A photo sensor digital camera Pulinx TM7 was used as
the screen. This camera contained a high resolution
interline transfer 0.5 in. CCD (charge-coupled device).
The camera was requested from the manufacturer to be
of super mini size that allows accurate and convenient
mounting within the setup.
3. Laser mounting fixture.
4. A special case was devised to mount the camera in
different positions along the machine bed. This case was
precisely manufactured to: (a) match the cone in the
starting bushing liner, (b) match the diameter of the
camera and (c) match the outer diameter of the spindle
nose.
5. Video capture card. This card was a single-slot,
accelerated, 24 bit-per-pixel, true-colour, designed to
capture and display high quality video images. The card
provided the complete set of camera control functions
required for capturing high quality images. The card
is also supported with a fully comprehensive software
that allows full exploitation of the hardware architec-
ture. Captured images could be saved as BMP or TIFF
files.
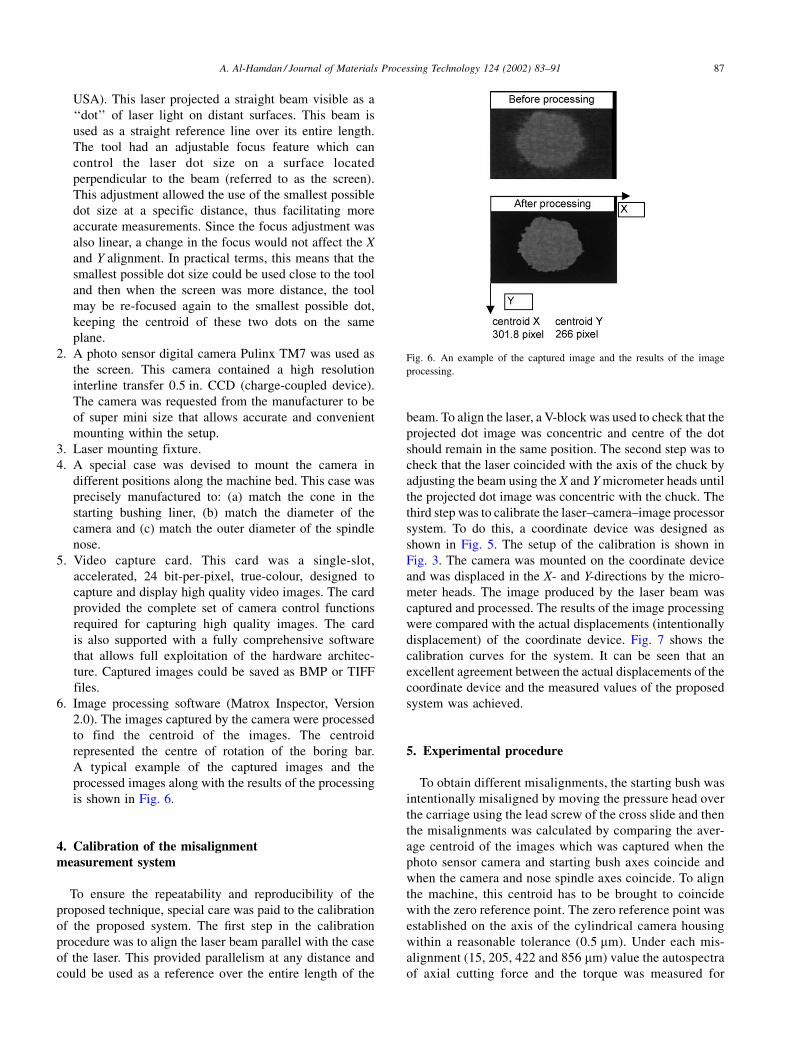
6. Image processing software (Matrox Inspector, Version
2.0). The images captured by the camera were processed
to find the centroid of the images. The centroid
represented the centre of rotation of the boring bar.
A typical example of the captured images and the
processed images along with the results of the processing
is shown in Fig. 6.
4. Calibration of the misalignmentmeasurement system
To ensure the repeatability and reproducibility of the
proposed technique, special care was paid to the calibration
of the proposed system. The first step in the calibration
procedure was to align the laser beam parallel with the case
of the laser. This provided parallelism at any distance and
could be used as a reference over the entire length of the
beam. To align the laser, a V-block was used to check that the
projected dot image was concentric and centre of the dot
should remain in the same position. The second step was to
check that the laser coincided with the axis of the chuck by
adjusting the beam using the X and Y micrometer heads until
the projected dot image was concentric with the chuck. The
third step was to calibrate the laser–camera–image processor
system. To do this, a coordinate device was designed as
shown in Fig. 5. The setup of the calibration is shown in
Fig. 3. The camera was mounted on the coordinate device
and was displaced in the X- and Y-directions by the micro-
meter heads. The image produced by the laser beam was
captured and processed. The results of the image processing
were compared with the actual displacements (intentionally
displacement) of the coordinate device. Fig. 7 shows the
calibration curves for the system. It can be seen that an
excellent agreement between the actual displacements of the
coordinate device and the measured values of the proposed
system was achieved.
5. Experimental procedure
To obtain different misalignments, the starting bush was
intentionally misaligned by moving the pressure head over
the carriage using the lead screw of the cross slide and then
the misalignments was calculated by comparing the aver-
age centroid of the images which was captured when the
photo sensor camera and starting bush axes coincide and
when the camera and nose spindle axes coincide. To align
the machine, this centroid has to be brought to coincide
with the zero reference point. The zero reference point was
established on the axis of the cylindrical camera housing
within a reasonable tolerance (0.5 mm). Under each mis-
alignment (15, 205, 422 and 856 mm) value the autospectra
of axial cutting force and the torque was measured for
Fig. 6. An example of the captured image and the results of the image
processing.
A. Al-Hamdan / Journal of Materials Processing Technology 124 (2002) 83–91 87
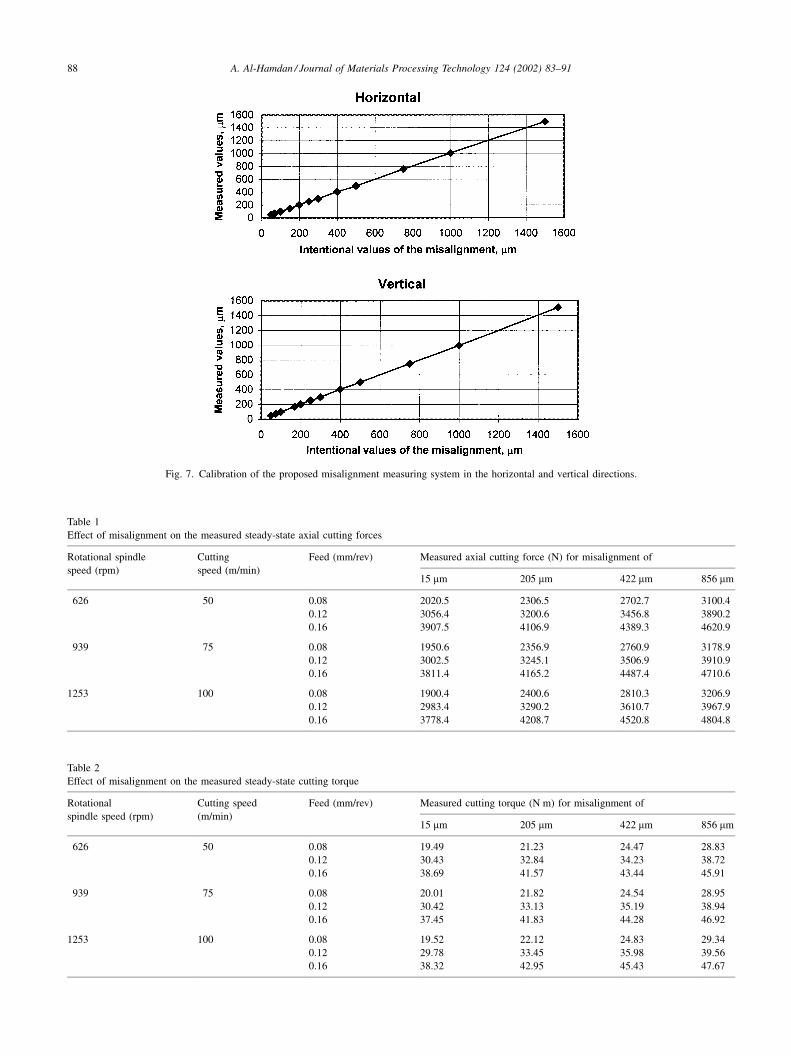
Fig. 7. Calibration of the proposed misalignment measuring system in the horizontal and vertical directions.
Table 1
Effect of misalignment on the measured steady-state axial cutting forces
Rotational spindle
speed (rpm)
Cutting
speed (m/min)
Feed (mm/rev) Measured axial cutting force (N) for misalignment of
15 mm 205 mm 422 mm 856 mm
626 50 0.08 2020.5 2306.5 2702.7 3100.4
0.12 3056.4 3200.6 3456.8 3890.2
0.16 3907.5 4106.9 4389.3 4620.9
939 75 0.08 1950.6 2356.9 2760.9 3178.9
0.12 3002.5 3245.1 3506.9 3910.9
0.16 3811.4 4165.2 4487.4 4710.6
1253 100 0.08 1900.4 2400.6 2810.3 3206.9
0.12 2983.4 3290.2 3610.7 3967.9
0.16 3778.4 4208.7 4520.8 4804.8
Table 2
Effect of misalignment on the measured steady-state cutting torque
Rotational
spindle speed (rpm)
Cutting speed
(m/min)
Feed (mm/rev) Measured cutting torque (N m) for misalignment of
15 mm 205 mm 422 mm 856 mm
626 50 0.08 19.49 21.23 24.47 28.83
0.12 30.43 32.84 34.23 38.72
0.16 38.69 41.57 43.44 45.91
939 75 0.08 20.01 21.82 24.54 28.95
0.12 30.42 33.13 35.19 38.94
0.16 37.45 41.83 44.28 46.92
1253 100 0.08 19.52 22.12 24.83 29.34
0.12 29.78 33.45 35.98 39.56
0.16 38.32 42.95 45.43 47.67
88 A. Al-Hamdan / Journal of Materials Processing Technology 124 (2002) 83–91
different combination of feed (0.08, 0.12 and 0.16 mm/rev)
and rotational speed (626, 939 and 1253 rev/min).
6. Results and discussion
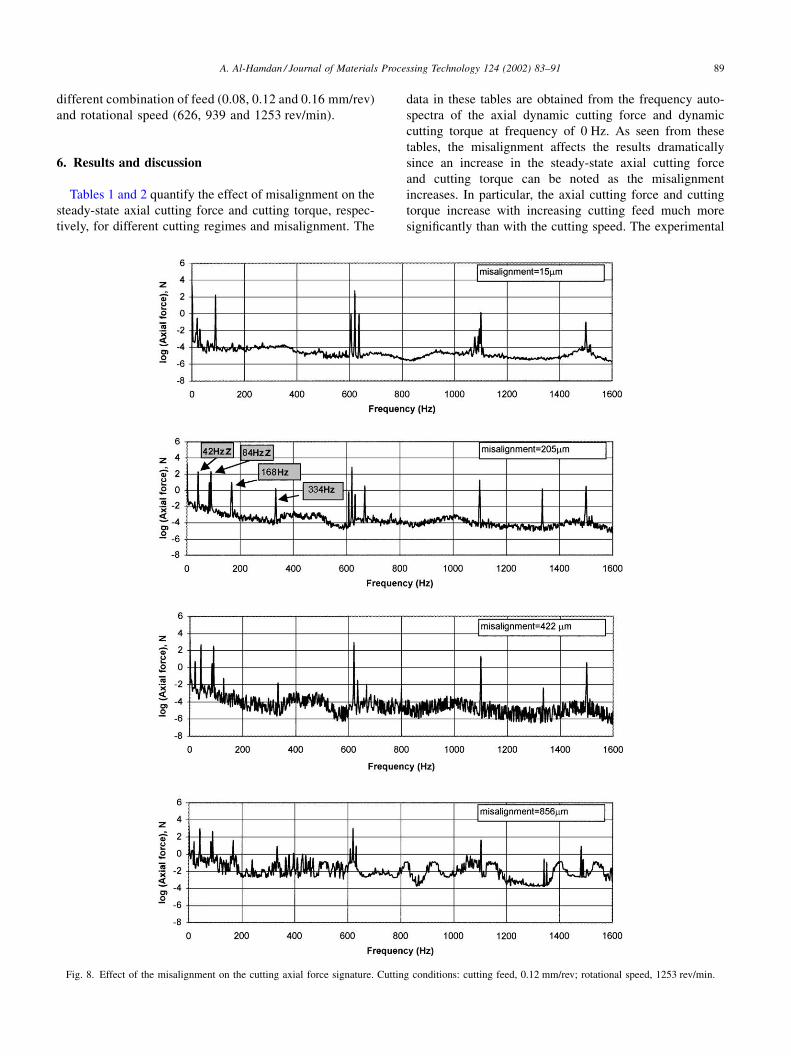
Tables 1 and 2 quantify the effect of misalignment on the
steady-state axial cutting force and cutting torque, respec-
tively, for different cutting regimes and misalignment. The
data in these tables are obtained from the frequency auto-
spectra of the axial dynamic cutting force and dynamic
cutting torque at frequency of 0 Hz. As seen from these
tables, the misalignment affects the results dramatically
since an increase in the steady-state axial cutting force
and cutting torque can be noted as the misalignment
increases. In particular, the axial cutting force and cutting
torque increase with increasing cutting feed much more
significantly than with the cutting speed. The experimental
Fig. 8. Effect of the misalignment on the cutting axial force signature. Cutting conditions: cutting feed, 0.12 mm/rev; rotational speed, 1253 rev/min.
A. Al-Hamdan / Journal of Materials Processing Technology 124 (2002) 83–91 89
results readily explain the significant scatter in the reported
experimental results on the steady-state cutting force mea-
surements in deep-hole machining [3,8–11]. Since in the
literature, the misalignment has never been reported, this
makes correlation of different reported results very difficult.
Also, the present results suggest that previous studies present
an incomplete picture of the BTA. Deep-hole machining
combines two processes: drilling and burnishing and the
forces generated in drilling are used to complete burnishing.
As shown by Griffiths [9], burnishing defines the quality of
the machined surface in terms of its roughness, roundness,
residual stresses, etc. It is also known that this process is
relatively sensitive to the burnishing force applied. For a
given drill design, the ratio ‘‘cutting force:burnishing force’’
is constant and therefore a change in the cutting force
directly affects the corresponding change in the burnishing
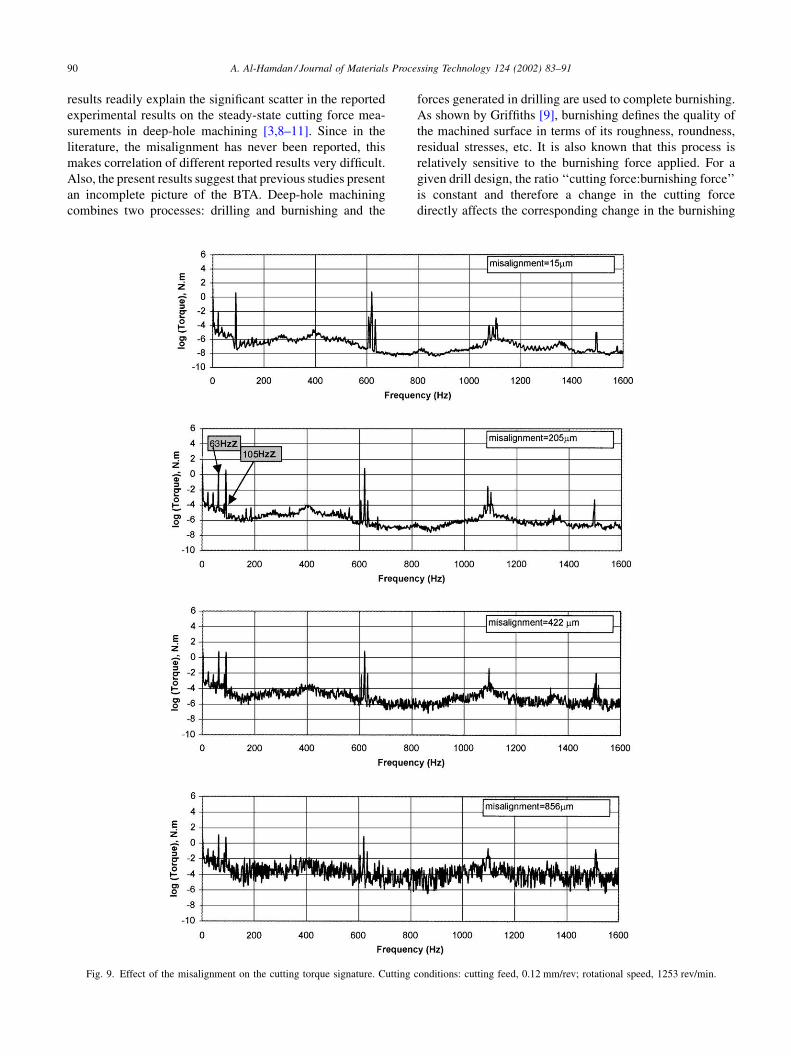
Fig. 9. Effect of the misalignment on the cutting torque signature. Cutting conditions: cutting feed, 0.12 mm/rev; rotational speed, 1253 rev/min.
90 A. Al-Hamdan / Journal of Materials Processing Technology 124 (2002) 83–91
force. This simple consideration explains a significant scat-
ter in the reported results on quality in the machining surface
in deep-hole machining. This also explains the relatively
poor productivity of deep-hole machining since the same
tools are used in the machines having different misalign-
ments that causes the scatter.
Figs. 8 and 9 show the frequency autospectra of the
axial dynamic cutting force and dynamic cutting torque,
respectively, under the same cutting feed and cutting
speed for different misalignments. The misalignment
shows up as a series of harmonics associated with the
running speed. Comparing the autospectra of the axial
cutting force under different misalignments for the same
cutting feed and spindle rotational speed show that the
misalignment introduce a series of different amplitude
harmonics at frequencies associated with the multiple of
the running speeds (2X, 4X, 6X, etc.; X is the frequency
corresponding of the running speed). For example at 1253
rev/min, the misalignments show up at 42, 84, 168 Hz, etc.
In the case of the cutting torque, the misalignments also
show up as a series of different amplitude harmonics but at
frequencies associated with an odd number of the running
speeds (3X, 5X, 7X, 9X, etc.; X is the frequency corre-
sponding of the running speed). For example at running
speed of 1253 rev/min, the misalignment shows up at 63,
105 and 147 Hz, etc.
From these figures it was easy to distinguish between the
harmonics caused by the misalignment and that caused by
the imperfections of the machine by comparing frequency
autospectra of the axial dynamic cutting force and dynamic
cutting torque when the machine is near perfect (misalign-
ment: 15 mm) and when the machine is under misalignment
of 205, 422 and 856 mm.
Comparing the autospectra of the axial cutting force and
cutting torque under different misalignment for the same
cutting feed and spindle rotational speed show that the
amplitudes of the different harmonics increase as the mis-
alignment increases.
Also, it can be noted that in the case of the axial cutting
forces, the dominant amplitude is associated with the second
harmonic (2X) of the operating speed where the amplitudes
of the spikes which are observed at the forth, sixth, etc.,
harmonics are seen to be progressively lowered. In the case
of torque, the dominant amplitude is associated with the
third harmonic of the operating speed. This spike which was
observed at the third harmonic was also seen at fifth, seventh,
etc., though the amplitude was seen to be progressively
reduced.
7. Conclusions
The important conclusions which follow from the
obtained results are:
1. The deep-hole machining system has very distinct
dynamic signatures under different misalignments. As
seen from the results, if the deep-hole machining system
is aligned, it is much more dynamically stable. In
practical terms this means that there is a reduced
possibility of lobbing which is considered as an inherent
feature of deep-hole machining [3,10,11] to occur.
Unfortunately, in the known literature on these common
defects, the misalignment has never been considered.
2. The misalignment changes the autospectra in such
manner that it becomes difficult to distinguish between
the spectra that reflects the cutting process contribution
and the spectra that come from other sources.
References
[1] K. Sakuma, K. Taguchi, A. Katsuki, Behavior of tool and its effects on
profile of machined hole, Bull. Jpn. Soc. Prec. Eng. 14 (1980) 143–148.
[2] K. Sakuma, K. Taguchi, A. Katsuki, The burnishing action of guide
pads and their influence on hole accuracies, Bull. JSME 23 (1980)
16–23.
[3] K. Sakuma, K. Taguchi, A. Katsuki, Self-guiding action of deep hole
drilling tools, Ann. CIRP 30 (1) (1981) 811–815.
[4] A.S. Choudhury, H.R. Guptha, R. Srinivasan, Experimental result on
precision hole making using BTA system, in: Proceedings of the 10th
AIMTDR Conference, Durgapur, India, December 1982, Central
Mechanical Engineering Research Institute, p. 136.
[5] M.S. Shunmugam, On assessment of geometric errors, Int. J. Prod.
Res. 24 (2) (1986) 413–425.
[6] A. Katsuki, K. Sakuma, H. Onikura, Axial hole deviation in deep
drilling—the influence of the shape of the cutting edge, Bull. Jpn.
Soc. Prec. Eng. 14 (1987) 50–56.
[7] ASTME (Ed.), Gundrilling, Trepanning and Deep Hole Machining,
Dearborn, MI, 1967.
[8] B.J. Griffths, The machining action during deep-hole boring and the
resultant hole force and force system, in: Proceedings of the Second
International Conference on Production Research, Copenhagen,
Denmark, 1973.
[9] B.J. Griffiths, An investigation into the role of the burnishing pads in
the deep hole machining process, Ph.D. Thesis, Department of
Production Technology, Brunel University, 1982.
[10] K. Sakuma, K. Taguchi, A. Katsuki, Study on deep-hole drilling
with solid boring tool the burnishing action of guide pads and
their influence on hole accuracies, Bull. JSME 23 (185) (1980) 121.
[11] K. Sakuma, K. Taguchi, A. Katsuki, Study on deep-hole boring by a
BTA system solid boring tool-behavior of tool and its effects on the
profile of the machined hole, Bull. JSME 14 (3) (1980) 143.
A. Al-Hamdan / Journal of Materials Processing Technology 124 (2002) 83–91 91