effect of minimum tillage and mulching on nutrient transformation in rice based cropping system
TRANSCRIPT
Effect of Minimum Tillage and Effect of Minimum Tillage and Mulching on Nutrient Transformation Mulching on Nutrient Transformation
in Rice-Based Cropping System in Rice-Based Cropping System
Department of Agril. Chemistry and Soil ScienceBidhan Chandra Krishi Viswavidyalaya,
Mohanpur, Nadia, West Bengal, India E-mail: [email protected], Website: www.bckv.edu.in
H.K. Tarafder; P.K. Mani; M. Ray; T. Mitran; and D. Mazumdar
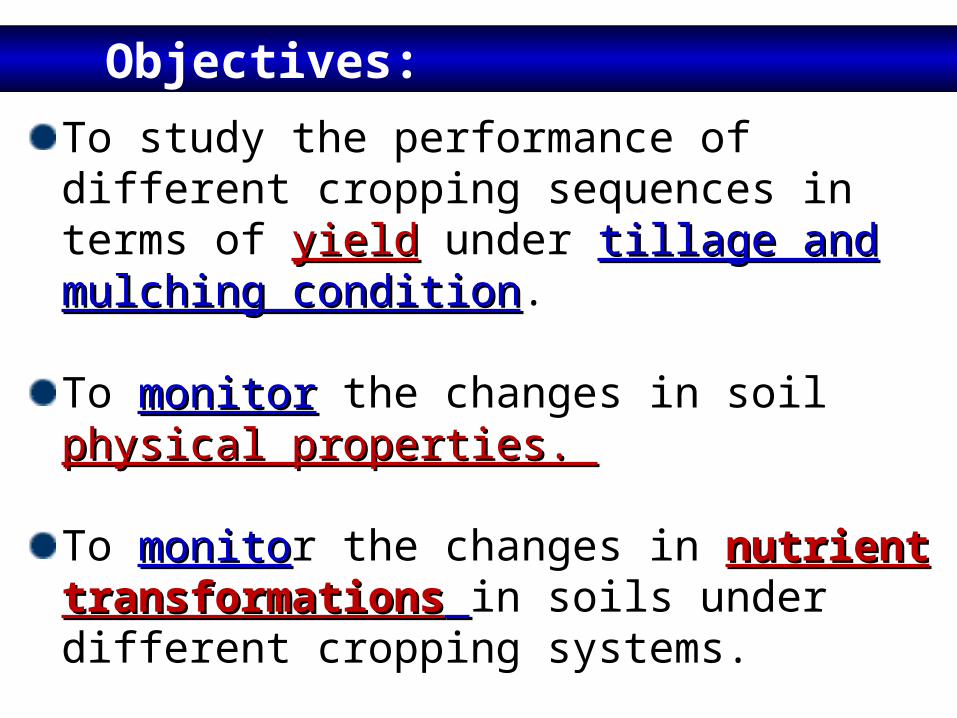
To study the performance of different cropping sequences in terms of yieldyield under tillage and mulching conditiontillage and mulching condition.
To monitormonitor the changes in soil physical physical properties. properties.
To monitomonitor the changes in nutrient nutrient transformationstransformations in soils under different cropping systems.
Objectives:
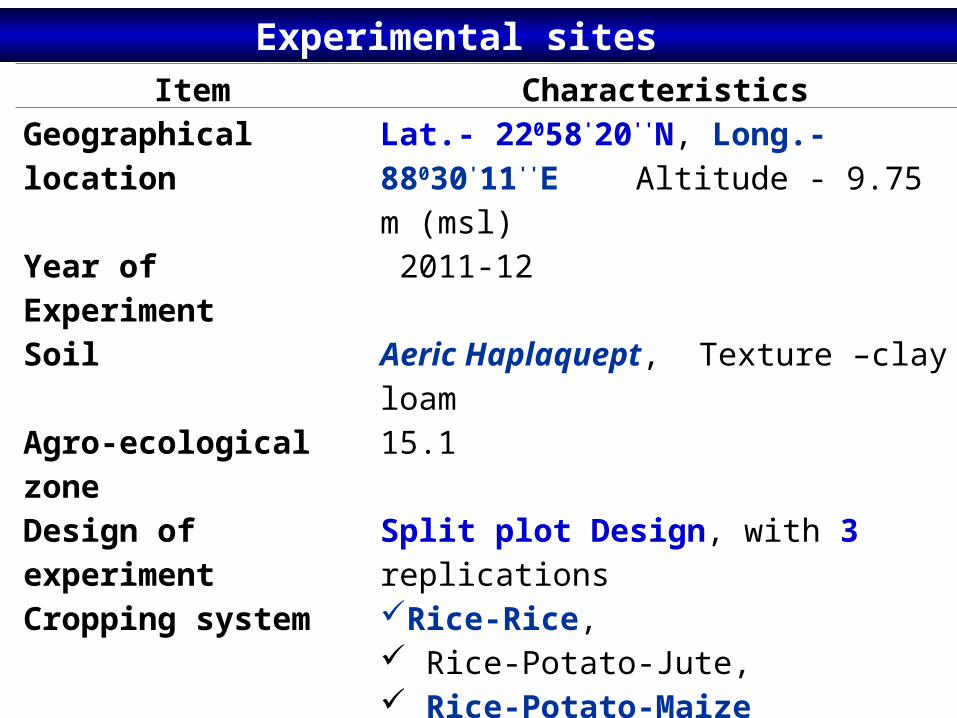
Item CharacteristicsGeographical location Lat.- 22058'20''N, Long.- 88030'11''E
Altitude - 9.75 m (msl)Year of Experiment 2011-12Soil Aeric Haplaquept, Texture –clay loamAgro-ecological zone 15.1Design of experiment Split plot Design, with 3 replicationsCropping system Rice-Rice,
Rice-Potato-Jute, Rice-Potato-Maize
Recommended fertilizer dose
Kharif Rice - N : P : K :: 80 : 40: 40Summer rice- N : P : K :: 120:60:60Potato - N : P : K :: 200 : 150: 150Jute- N : P : K :: 80:40:40Maize- N : P :K :: 80:40:40
Experimental sites
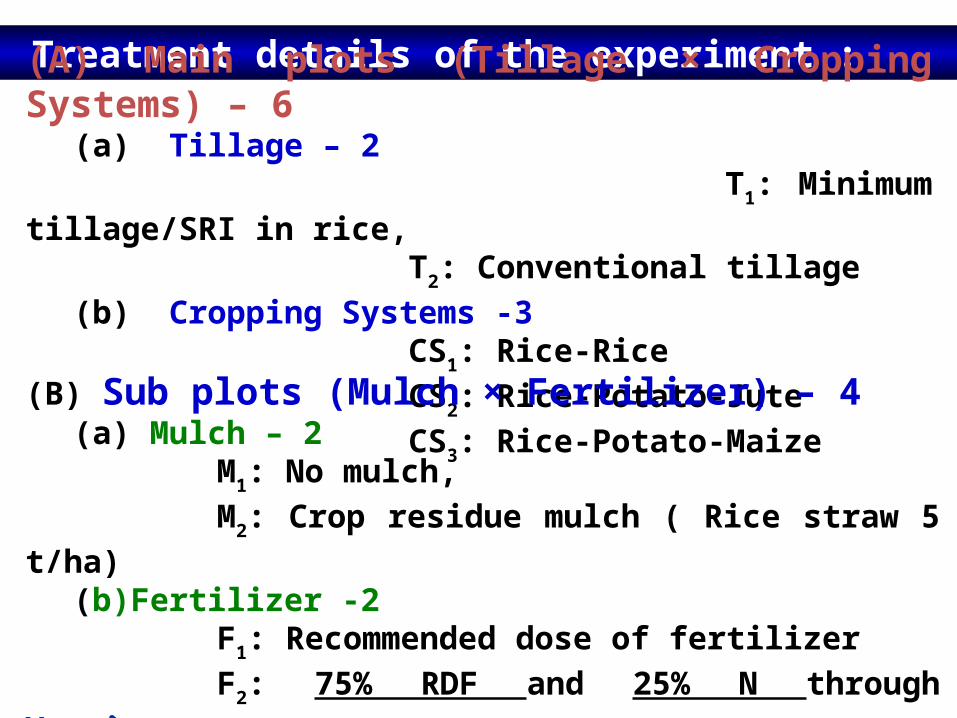
Treatment details of the experiment :(A) Main plots (Tillage × Cropping Systems) – 6
(a) Tillage – 2 T1: Minimum tillage/SRI in rice,
T2: Conventional tillage(b) Cropping Systems -3
CS1: Rice-Rice CS2: Rice-Potato-Jute
CS3: Rice-Potato-Maize(B) Sub plots (Mulch × Fertilizer) – 4
(a) Mulch – 2M1: No mulch, M2: Crop residue mulch ( Rice straw 5 t/ha)
(b)Fertilizer -2F1: Recommended dose of fertilizer F2: 75% RDF and 25% N through VermicompostVermicompost
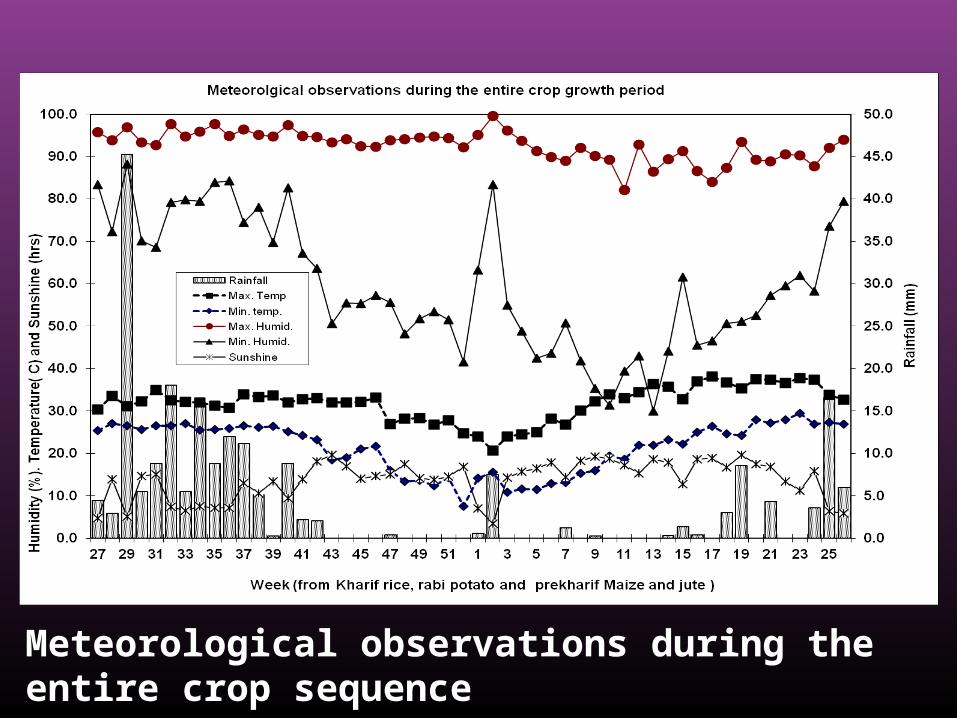
Meteorological observations during the entire crop sequence
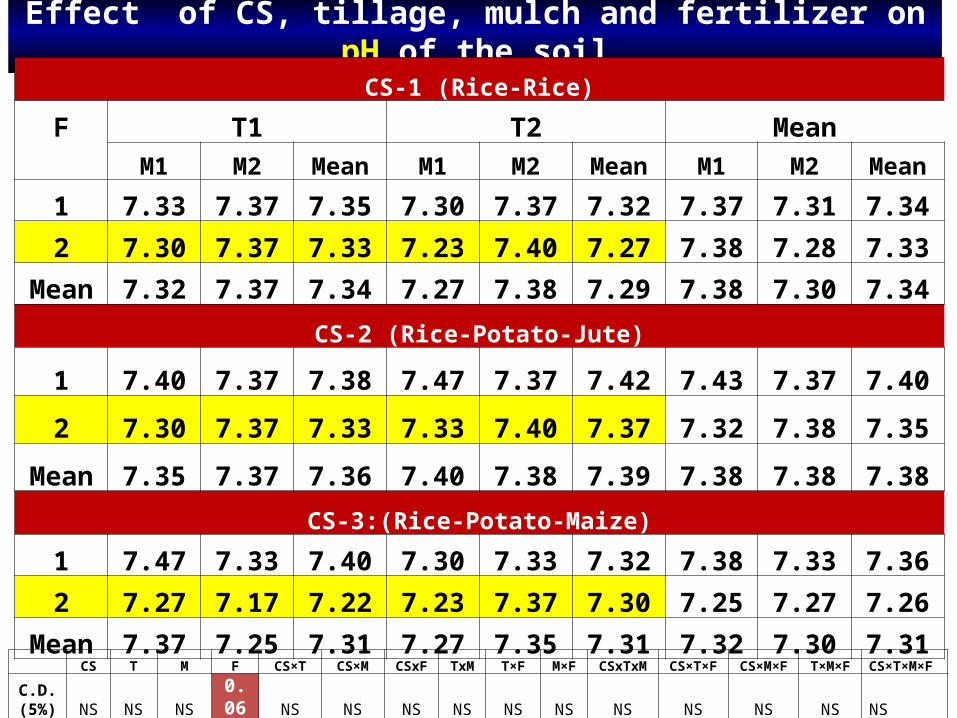
Effect of CS, tillage, mulch and fertilizer on pH of the soilCS-1 (Rice-Rice)
F T1 T2 MeanM1 M2 Mean M1 M2 Mean M1 M2 Mean
1 7.33 7.37 7.35 7.30 7.37 7.32 7.37 7.31 7.342 7.30 7.37 7.33 7.23 7.40 7.27 7.38 7.28 7.33
Mean 7.32 7.37 7.34 7.27 7.38 7.29 7.38 7.30 7.34CS-2 (Rice-Potato-Jute)
1 7.40 7.37 7.38 7.47 7.37 7.42 7.43 7.37 7.40
2 7.30 7.37 7.33 7.33 7.40 7.37 7.32 7.38 7.35
Mean 7.35 7.37 7.36 7.40 7.38 7.39 7.38 7.38 7.38CS-3:(Rice-Potato-Maize)
1 7.47 7.33 7.40 7.30 7.33 7.32 7.38 7.33 7.362 7.27 7.17 7.22 7.23 7.37 7.30 7.25 7.27 7.26
Mean 7.37 7.25 7.31 7.27 7.35 7.31 7.32 7.30 7.31 CS T M F CS×T CS×M CSxF TxM T×F M×F CSxTxM CS×T×F CS×M×F T×M×F CS×T×M×F
C.D. (5%) NS NS NS
0.06 NS NS NS NS NS NS NS NS NS NS NS
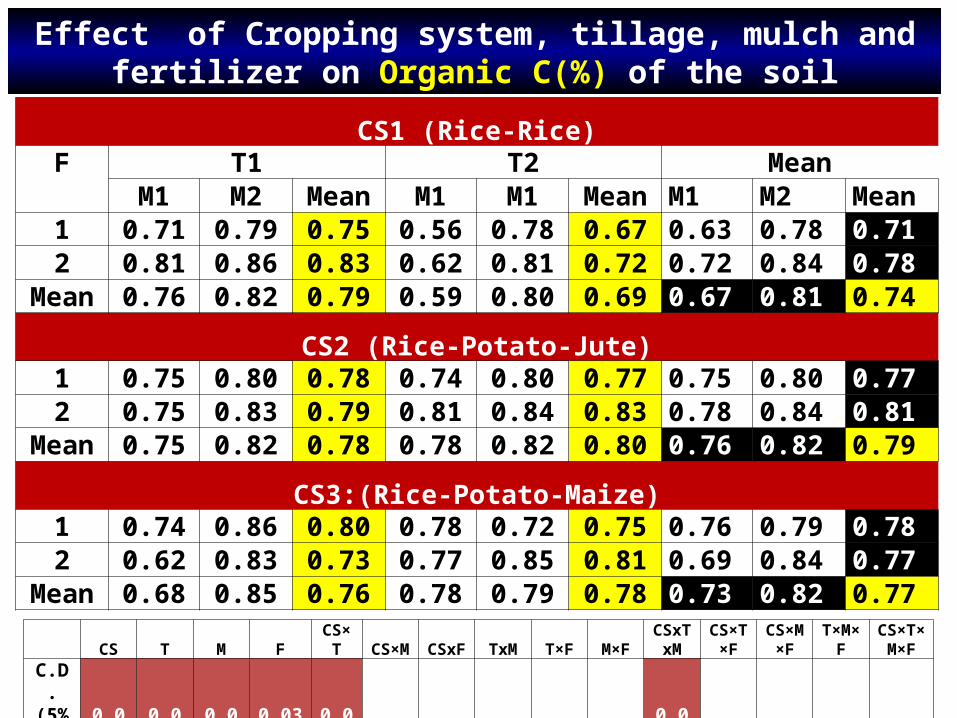
CS1 (Rice-Rice)F T1 T2 Mean
M1 M2 Mean M1 M1 Mean M1 M2 Mean1 0.71 0.79 0.75 0.56 0.78 0.67 0.63 0.78 0.712 0.81 0.86 0.83 0.62 0.81 0.72 0.72 0.84 0.78
Mean 0.76 0.82 0.79 0.59 0.80 0.69 0.67 0.81 0.74
CS2 (Rice-Potato-Jute)1 0.75 0.80 0.78 0.74 0.80 0.77 0.75 0.80 0.772 0.75 0.83 0.79 0.81 0.84 0.83 0.78 0.84 0.81
Mean 0.75 0.82 0.78 0.78 0.82 0.80 0.76 0.82 0.79
CS3:(Rice-Potato-Maize)1 0.74 0.86 0.80 0.78 0.72 0.75 0.76 0.79 0.782 0.62 0.83 0.73 0.77 0.85 0.81 0.69 0.84 0.77
Mean 0.68 0.85 0.76 0.78 0.79 0.78 0.73 0.82 0.77
Effect of Cropping system, tillage, mulch and fertilizer on Organic C(%) of the soil
CS T M FCS×
TCS×M CSxF TxM T×F M×F
CSxTxM
CS×T×F
CS×M×F
T×M×F
CS×T×M×F
C.D. (5%)
0.021
0.021
0.030 0.030 0.03 NS NS NS NS NS
0.073 NS NS NS NS
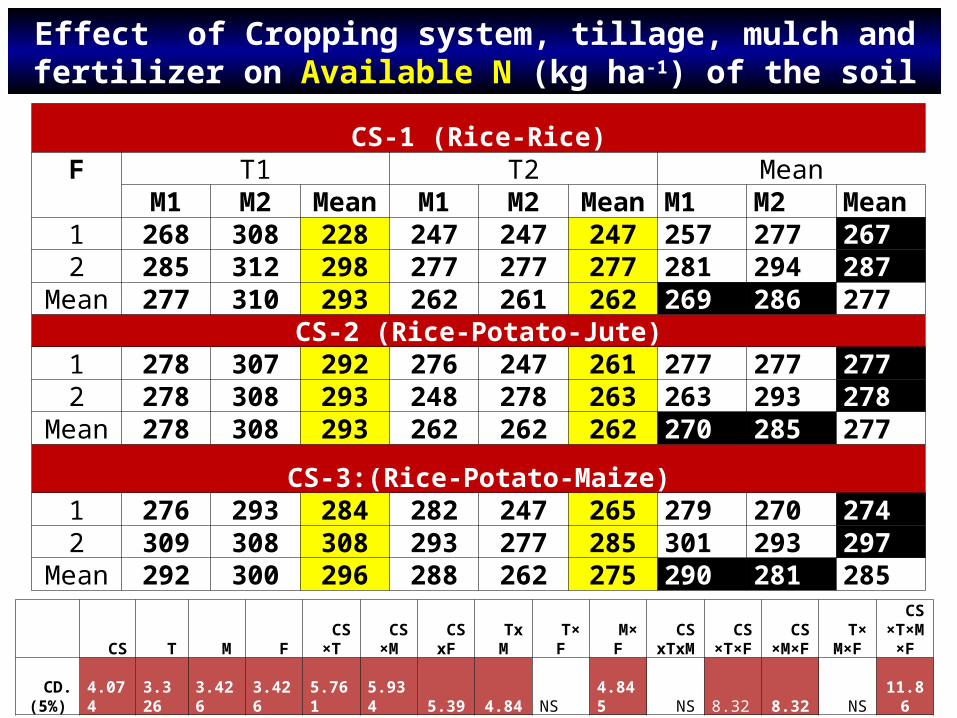
Effect of Cropping system, tillage, mulch and fertilizer on Available N (kg ha-1) of the soil
CS-1 (Rice-Rice)F T1 T2 Mean
M1 M2 Mean M1 M2 Mean M1 M2 Mean1 268 308 228 247 247 247 257 277 2672 285 312 298 277 277 277 281 294 287
Mean 277 310 293 262 261 262 269 286 277CS-2 (Rice-Potato-Jute)
1 278 307 292 276 247 261 277 277 2772 278 308 293 248 278 263 263 293 278
Mean 278 308 293 262 262 262 270 285 277
CS-3:(Rice-Potato-Maize)1 276 293 284 282 247 265 279 270 2742 309 308 308 293 277 285 301 293 297
Mean 292 300 296 288 262 275 290 281 285
CS T M FCS
×TCS
×MCS
xFTx
MT×
FM
×FCS
xTxMCS
×T×FCS
×M×FT×
M×F
CS×T×M×F
CD. (5%) 4.074 3.326 3.426 3.426 5.761 5.934
5.39
4.84 NS 4.845 NS 8.32
8.32 NS
11.86
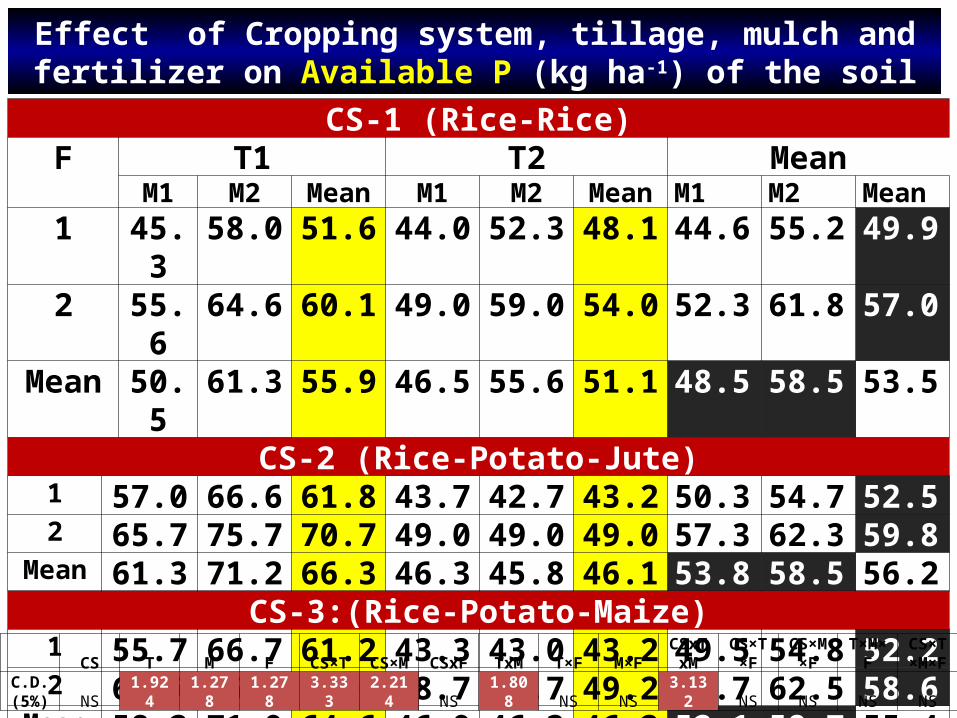
CS-1 (Rice-Rice)F T1 T2 Mean
M1 M2 Mean M1 M2 Mean M1 M2 Mean1 45.3 58.0 51.6 44.0 52.3 48.1 44.6 55.2 49.92 55.6 64.6 60.1 49.0 59.0 54.0 52.3 61.8 57.0
Mean 50.5 61.3 55.9 46.5 55.6 51.1 48.5 58.5 53.5CS-2 (Rice-Potato-Jute)
1 57.0 66.6 61.8 43.7 42.7 43.2 50.3 54.7 52.52 65.7 75.7 70.7 49.0 49.0 49.0 57.3 62.3 59.8
Mean 61.3 71.2 66.3 46.3 45.8 46.1 53.8 58.5 56.2CS-3:(Rice-Potato-Maize)
1 55.7 66.7 61.2 43.3 43.0 43.2 49.5 54.8 52.22 60.7 75.3 68.0 48.7 49.7 49.2 54.7 62.5 58.6
Mean 58.2 71.0 64.6 46.0 46.3 46.2 52.1 58.7 55.4
Effect of Cropping system, tillage, mulch and fertilizer on Available P (kg ha-1) of the soil
CS T M F CS×T CS×M CSxF TxM T×F M×FCSxT
xMCS×T
×FCS×M
×FT×M×
FCS×T×M×F
C.D. (5%) NS 1.924 1.278 1.278 3.333 2.214 NS 1.808 NS NS 3.132 NS NS NS NS
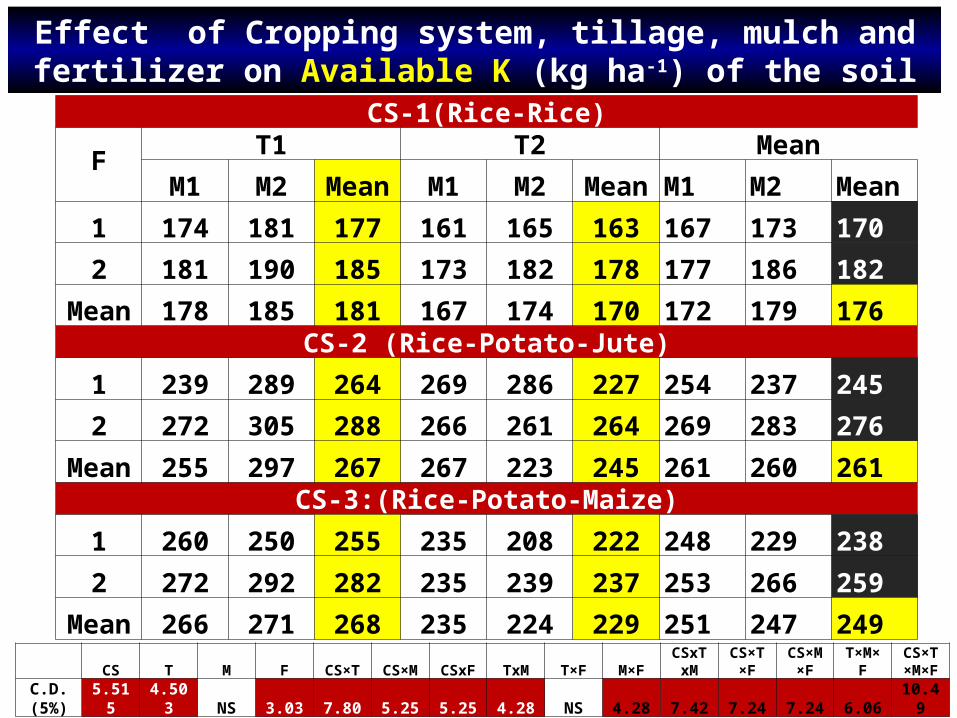
Effect of Cropping system, tillage, mulch and fertilizer on Available K (kg ha-1) of the soil
CS-1(Rice-Rice)
F T1 T2 MeanM1 M2 Mean M1 M2 Mean M1 M2 Mean
1 174 181 177 161 165 163 167 173 1702 181 190 185 173 182 178 177 186 182
Mean 178 185 181 167 174 170 172 179 176CS-2 (Rice-Potato-Jute)
1 239 289 264 269 286 227 254 237 2452 272 305 288 266 261 264 269 283 276
Mean 255 297 267 267 223 245 261 260 261CS-3:(Rice-Potato-Maize)
1 260 250 255 235 208 222 248 229 2382 272 292 282 235 239 237 253 266 259
Mean 266 271 268 235 224 229 251 247 249 CS T M F CS×T CS×M CSxF TxM T×F M×F
CSxTxM
CS×T×F
CS×M×F
T×M×F
CS×T×M×F
C.D. (5%) 5.515 4.503 NS 3.03 7.80 5.25 5.25 4.28 NS 4.28 7.42 7.24 7.24 6.06 10.49
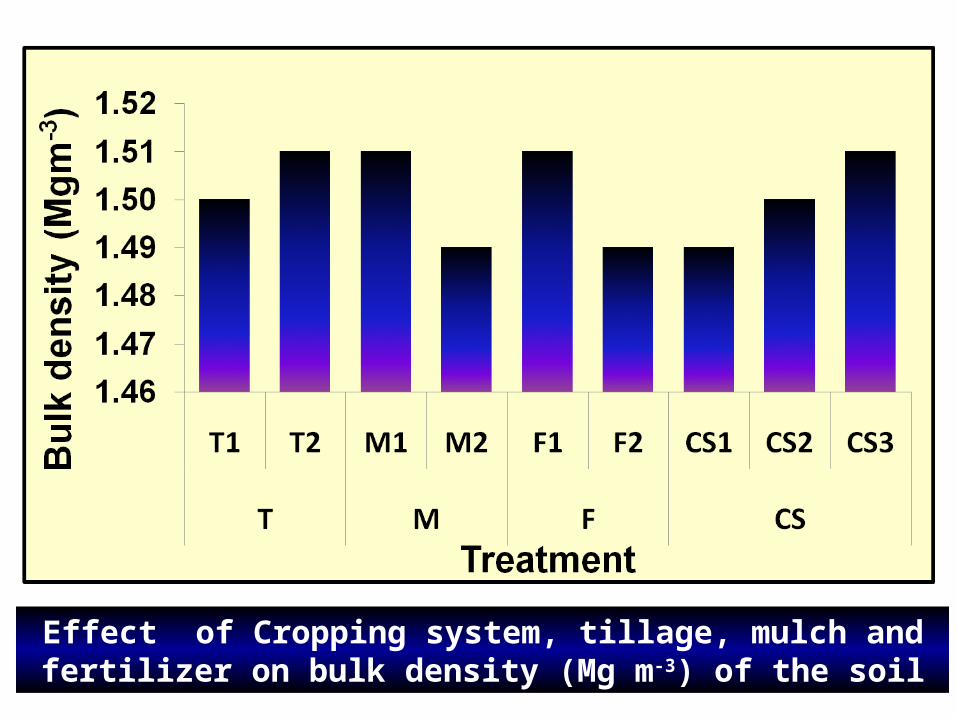
Effect of Cropping system, tillage, mulch and fertilizer on bulk density (Mg m-3) of the soil
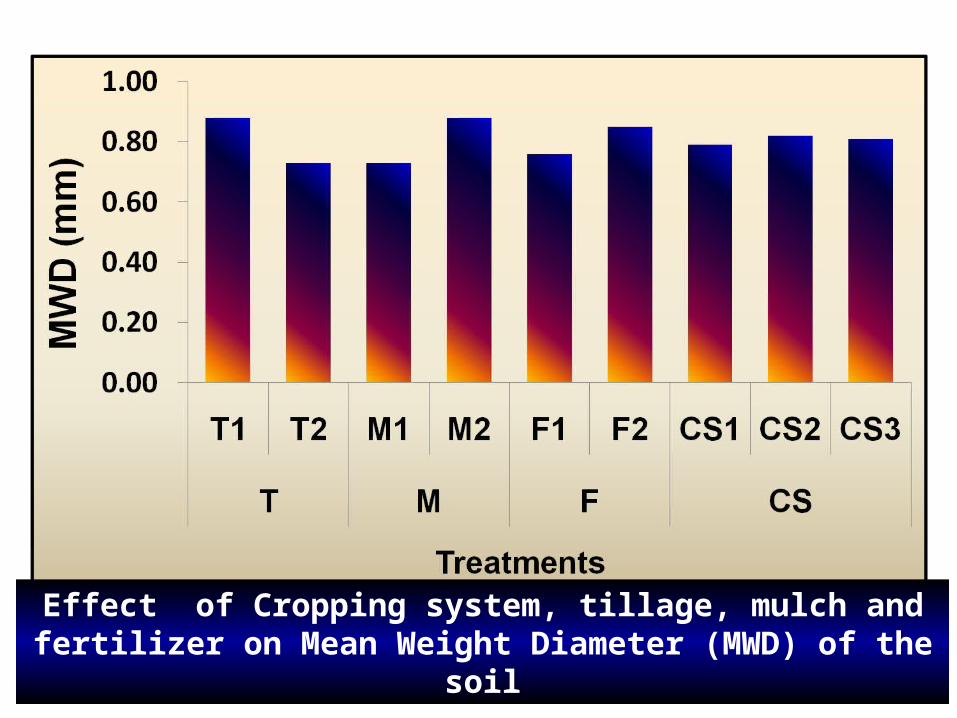
Effect of Cropping system, tillage, mulch and fertilizer on Mean Weight Diameter (MWD) of the soil
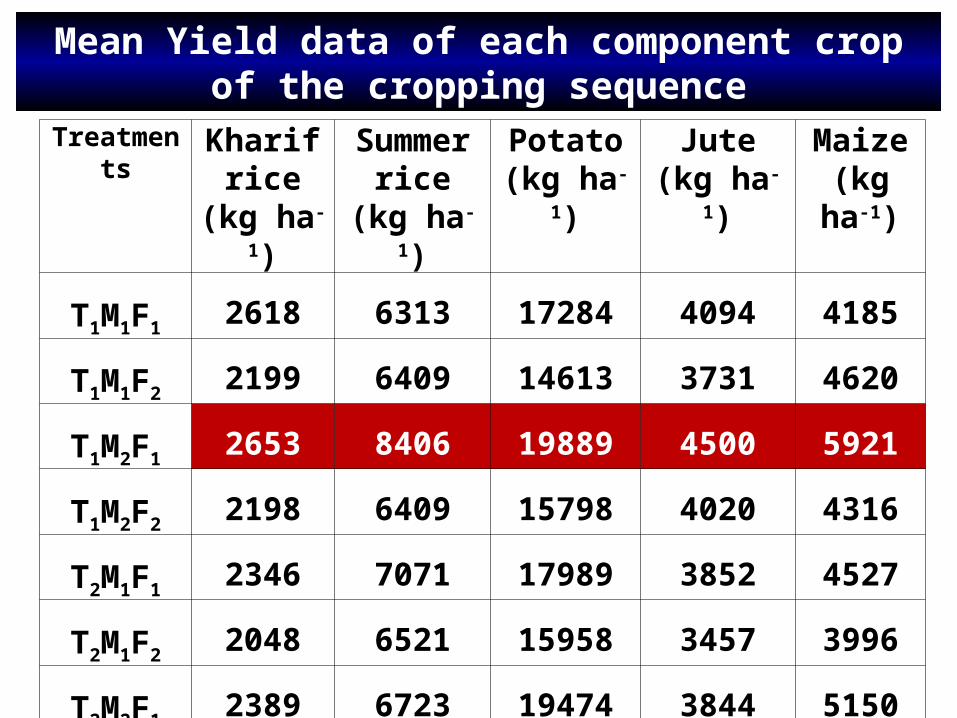
Treatments Kharif rice
(kg ha-1)
Summer rice
(kg ha-1)
Potato(kg ha-1)
Jute(kg ha-1)
Maize(kg ha-1)
T1M1F1 2618 6313 17284 4094 4185
T1M1F2 2199 6409 14613 3731 4620
T1M2F1 2653 8406 19889 4500 5921
T1M2F2 2198 6409 15798 4020 4316
T2M1F1 2346 7071 17989 3852 4527
T2M1F2 2048 6521 15958 3457 3996
T2M2F1 2389 6723 19474 3844 5150
T2M2F2 2013 5201 17255 3425 4711
Mean Yield data of each component crop of the cropping sequence
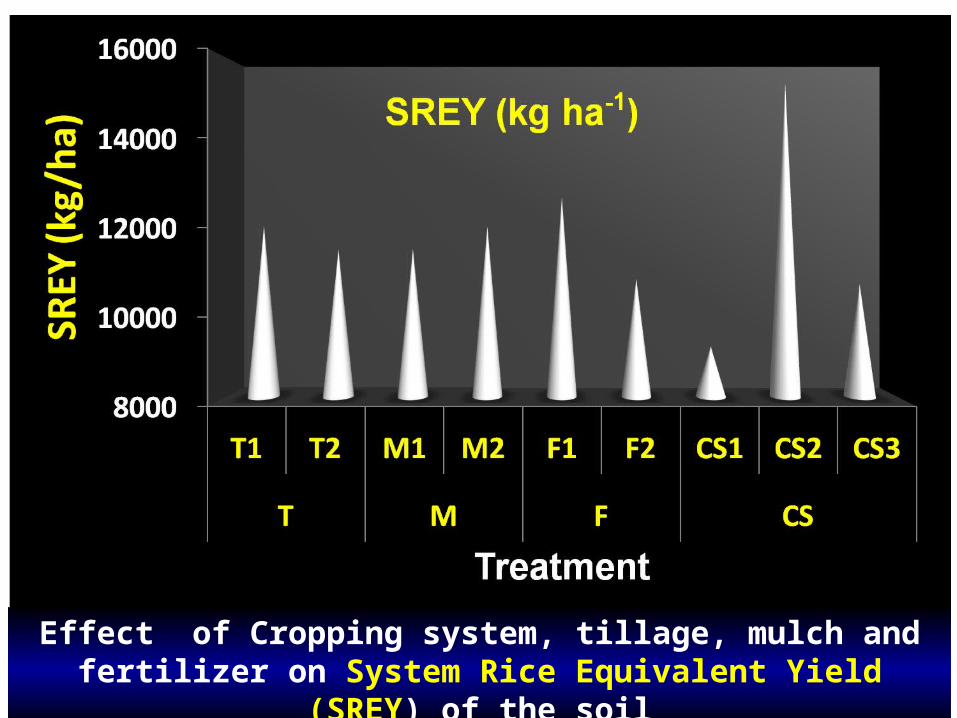
Effect of Cropping system, tillage, mulch and fertilizer on System Rice Equivalent Yield (SREY) of the soil
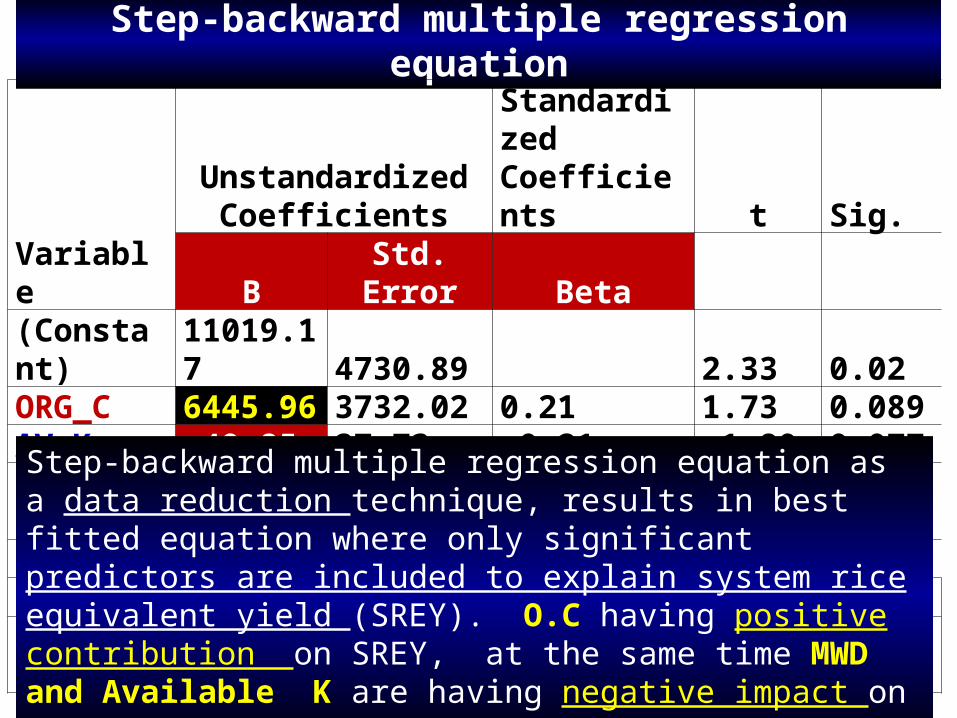
Step-backward multiple regression equation
Variable
Unstandardized Coefficients
Standardized Coefficients t Sig.
B Std. Error Beta (Constant) 11019.17 4730.89 2.33 0.02ORG_C 6445.96 3732.02 0.21 1.73 0.089AV_K -49.85 27.73 -0.21 -1.80 0.077MWD -9141.16 5092.29 -0.36 -1.80 0.077
Dependent Variable: SREYR R Sq. Adj. R Sq. SE(est) 0.63 0.397** 0.33 2460.02
Step-backward multiple regression equation as a data reduction technique, results in best fitted equation where only significant predictors are included to explain system rice equivalent yield (SREY). O.C having positive contribution on SREY, at the same time MWD and Available K are having negative impact on SREY
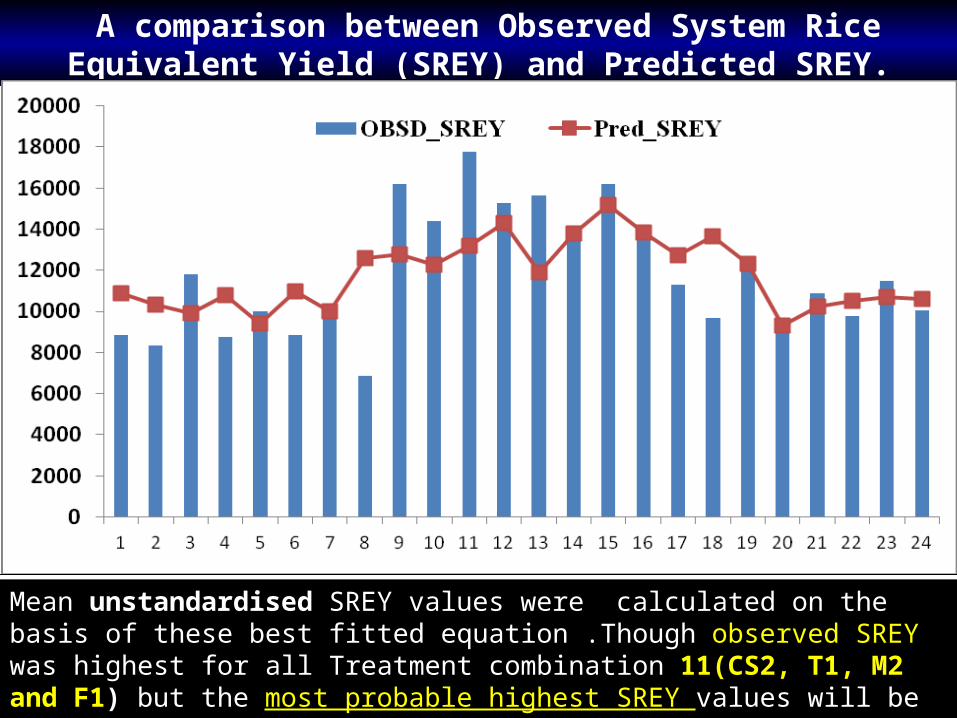
A comparison between Observed System Rice Equivalent Yield (SREY) and Predicted SREY.
Mean unstandardised SREY values were calculated on the basis of these best fitted equation .Though observed SREY was highest for all Treatment combination 11(CS2, T1, M2 and F1) but the most probable highest SREY values will be the treatment combination 15(i.e.,CS2, T2, M2 and F1)
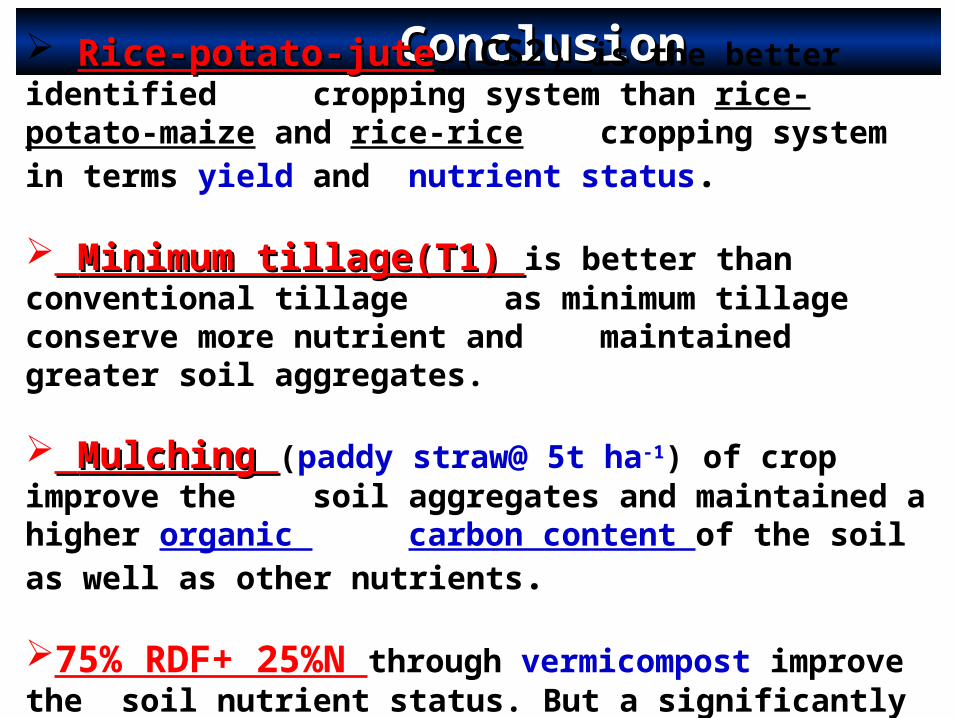
ConclusionConclusion Rice-potato-juteRice-potato-jute (CS2) is the better identified cropping system than rice-potato-maize and rice-rice cropping system in terms yield and nutrient status.
Minimum tillage(T1) Minimum tillage(T1) is better than conventional tillage as minimum tillage conserve more nutrient and
maintained greater soil aggregates.
Mulching Mulching (paddy straw@ 5t ha-1) of crop improve the soil aggregates and maintained a higher organic
carbon content of the soil as well as other nutrients.
75% RDF+ 25%N through vermicompost improve the soil nutrient status. But a significantly higher SREY, were recorded in 100%RDF.