effect of local nonlinearity in cohesionless soil on ... · effect of local nonlinearity in...
TRANSCRIPT
Acta Geotechnica (2010) 5:273–286
i
Effect of Local Nonlinearity in Cohesionless Soil on Optimal
Radius Minimizing Fixed-Head Pile Bending by Inertial and
Kinematic Interactions
Masato Saitoh
Graduate School of Science and Engineering, Saitama University 255 Shimo-Okubo, Sakura-Ku, Saitama, Japan
Tel.: +81-48-858-3560 E-mail address: [email protected]
Abstract This study presents the effects of a local nonlinearity in cohesionless soil upon the optimal radius minimizing the bending strains of a vertical, cylindrical fixed-head pile embedded in a layered soil stratum in a soil-pile-structure system where the kinematic interaction dominates. The Seismic Deformation Method (SDM) with discretized numerical models is applied since the SDM is a static numerical method that can easily consider realistic conditions of layered soil strata and the nonlinearity of the soil. In the numerical models, the local nonlinearity of the soil in the vicinity of the pile is represented by subgrade springs having bi-linear skeleton curves with a simple hysteretic loop. Various amplitudes of the lateral displacements of the soil and the lateral forces at the head of the pile are considered as numerical parameters. The results of parametric analyses reveal the presence of an optimal pile radius that locally minimizes the bending strains of the piles under strong nonlinearity of the soil, and the optimal pile radius tends to increase as the degree of nonlinearity increases. Criteria are presented for predicting the increment of the optimal radius of soil-pile-structure systems under strong nonlinearity in the soil.
Keywords/ Soil-structure interaction, Soil-pile interaction, Dynamic analysis, Seismic design,
Seismic Deformation Method, Nonlinearity
Acta Geotechnica (2010) 5:273–286
ii
INTRODUCTION
This study focuses on the effects of a local nonlinearity in cohesionless soil upon the optimal radius minimizing the bending strain of a vertical, cylindrical fixed-head pile embedded in a layered soil stratum in a soil-pile-structure system where the kinematic interaction dominates. In Saitoh [1], the author described the fundamental relation between the radius and the bending strain at the head of a pile using three-dimensional wave propagation theory, showing the presence of an optimal pile radius that minimizes the bending strain at the head of the pile. Moreover, the author derived criteria by which the optimal radius can be determined for soil-pile-structure systems. Saitoh [1] gave a general expression for the closed-form formulae by normalizing the bending strain with respect to a mean shear strain of a soil stratum sγ . The mean shear strain sγ is defined as the absolute value of the maximum response displacement of the ground surface with respect to the base divided by the height of the soil stratum. Consequently, it was found that the normalized bending strains can be expressed by normalized parameters, such
as the slenderness ratio Ha , the ratio of soil and pile stiffness pg EE , and a factor rF and a
phase lag rφ which represent dynamic characteristics of loading at the head of the pile and deformation of the soil.
From a practical point of view, a pile may be influenced by local nonlinearities in the soil, such as failure of the soil surrounding the pile, and slippage, gapping, and separation may occur at the interface between the pile and the soil during earthquakes. Many studies have proposed numerical models for expressing the force-displacement relation under the conditions of such local nonlinearities in the soil in the vicinity of a pile based on experimentally measured responses. For example, Gerolymos and Gazetas [2] proposed a sophisticated mathematical model that can fit many types of force-displacement relations obtained from experimental data. This model is based on an extension and modification of the Bouc-Wen model, which is a well-known model based on nonlinear springs distributed along the pile for representing the lateral soil reaction (Trochanis et al. [3], and Badoni and Makris [4]).
Therefore, it is tempting to speculate as to how the optimal pile radius is influenced by such inelastic conditions from a practical point of view. However, expanding the closed-form formulae based on the wave propagation theory to account for such practical conditions is extremely difficult. In recent years, a static numerical method called the Seismic Deformation Method (SDM) has been used in practical applications as a useful method to evaluate the response of a pile kinematically affected by the deformation of the soil stratum. SDM can easily consider realistic conditions of layered soil strata and the nonlinearity of the soil in the vicinity of piles. Luo et al. [5] verified the validity of the SDM in a simulative analysis of pile foundations
Acta Geotechnica (2010) 5:273–286
iii
embedded in soft soil that experienced the Hyogoken-Nanbu earthquake. Therefore, SDM is applicable to the above estimation whenever a local nonlinearity occurs in the soil in the vicinity of a pile. Until now, there has been little consideration of the optimal pile radius associated with the local nonlinearity in the soil, even for the case of a simple nonlinear soil reaction such as a model based on an elastic / perfectly plastic constitutive law. In this study, therefore, a simply approximate model, represented by a bilinear skeleton curve with a simple hysteretic loop, is used for understanding the fundamentals of the optimal pile radius influenced by the local nonlinearity in the soil. For the sake of simplicity, it is assumed that no strength deterioration and no stiffness degradation occur with cyclic loading in this model. It is presumed, therefore, that the nonlinearity of soil reaction could be underestimated when compared with that of the actual soil reaction showing significant deterioration of the strength or degradation of the stiffness. Another assumption is that the stiffness of the soil is uniform over the entire height of the soil layers, whereas various types of stiffness distributions can be expected in practice. The reason for this assumption is that, in this study, I concentrate on the effect of local nonlinearities in the soil upon the pile by removing the effect of inhomogeneous soil layers, such as the transmissibility of bending strains appearing at discontinuities in the soil stiffness (e.g., Mylonakis [6]).
Accordingly, the objectives of the present study are: (1) To obtain numerical solutions of the normalized bending strains at the head of a pile in the presence of a local nonlinearity in the soil by using SDM; and (2) to show the effects of the nonlinearity upon the normalized bending strain and the optimal pile radius with different amplitudes of the lateral displacements of soil and the lateral forces at the top of the pile; (3) to compare the optimal pile radius under linearly elastic conditions with that under the nonlinear conditions; and (4) to present criteria for evaluating the amount of change in the optimal radius of soil-pile-structure systems under strong nonlinearity in the soil.
NUMERICAL MODELS STUDIED
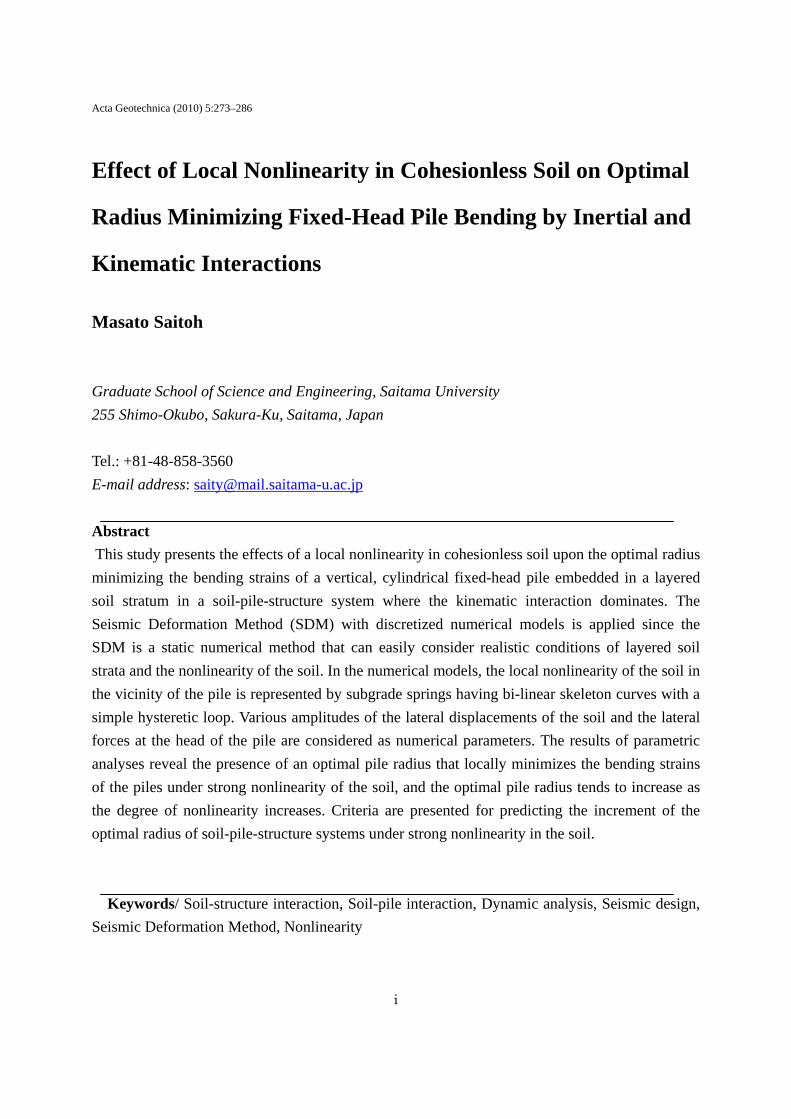
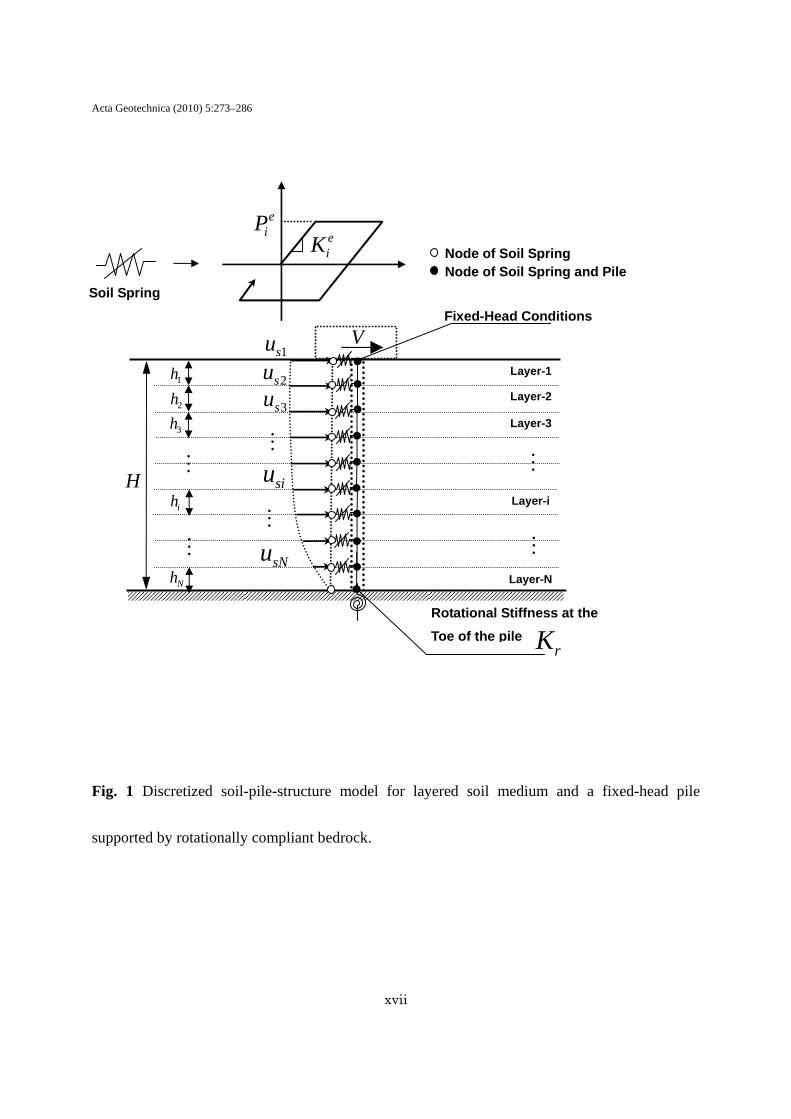
The soil-pile-structure system used is shown in Fig. 1. A vertical, cylindrical pile of radius a (diameter d ) is embedded in a layered soil of thickness H . The pile is discretized by elastic
beam elements of length L and flexural rigidity IE p ( 7105.2 ×=pE kN/m2). In this study, the
length of the pile, which is identical to the thickness H , is assumed to be 20 m, and that of the beam element L is assumed to be 0.5 m. A soil spring representing the horizontal subgrade reaction of the soil is concentrated at each node of the beam elements. The soil spring has a
Acta Geotechnica (2010) 5:273–286
iv
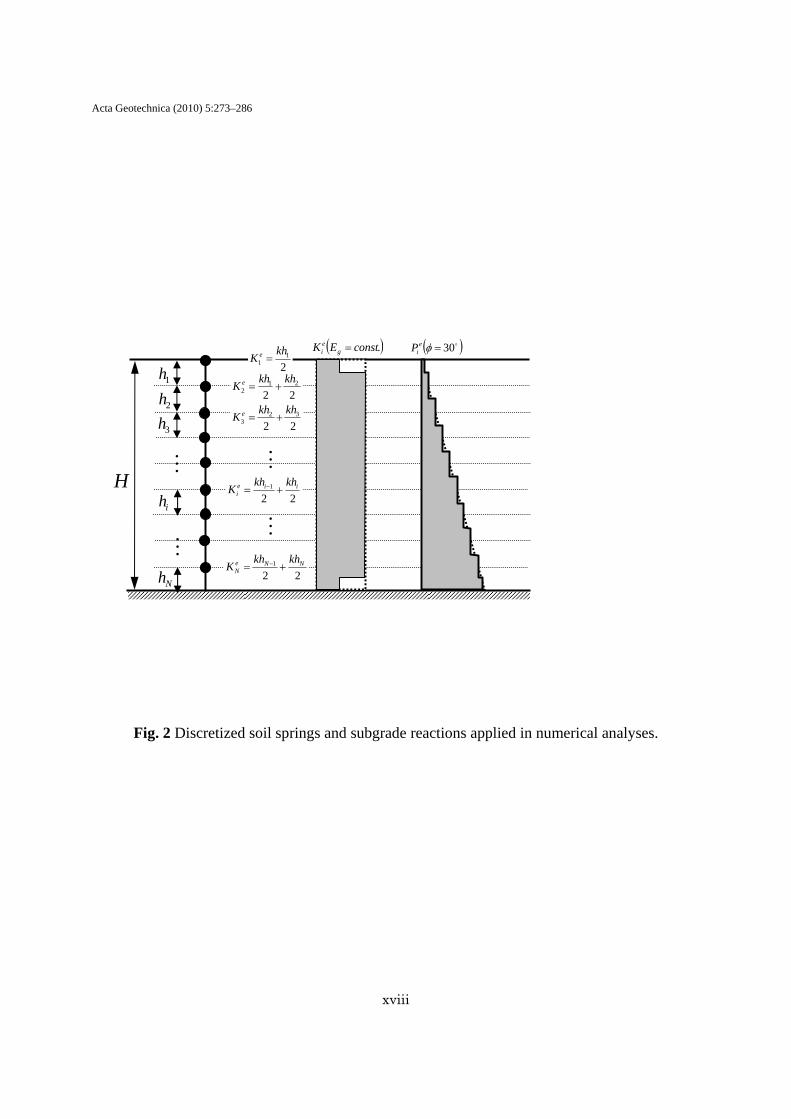
bilinear skeleton curve where the ratio of the second stiffness (after yielding) to the initial stiffness is assumed to be zero (in this study, a slight tangential is given to the second stiffness for stability of the numerical calculations); this is identical to the subgrade reaction that follows the elastic / perfectly plastic constitutive law.
The initial stiffness of the horizontal subgrade spring of the soil eiK at the i-th node of the
pile is determined from the following formulae:
11
1 2h
kK e = ( 1=i ) (1a)
2211 iiiie
ihkhk
K += −− ( 1>i ), (1b)
where ik is the product of the diameter of the pile d and the horizontal deformation of the subgrade of the i-th layer iK ; and ih is the thickness of the i-th layer. According to Gazetas and Dobry [7], the product ik ( dKi= ) in Eq. 1 can be approximated by
gii Ek 2.1= , (2)
where giE is the Young's modulus of the soil in the i-th layer.
It is apparent that Eq. 1 is derived based on the equivalency of the integrated stiffness of the rectangular area of the product ik distributed along two adjoining beam elements (only one beam element at the 1st node) between which the target node is placed.
The ultimate strength of the horizontal subgrade spring of the soil, eiP , at the i-th node is
given by the following formulae:
11
1 4hpP
Me = ( 1=i ) (3a)
( ) ( )Mi
Ui
iBi
Mi
iei pp
hpp
hP +++= −−
−
44 111 ( 1>i ), (3b)
Acta Geotechnica (2010) 5:273–286
v
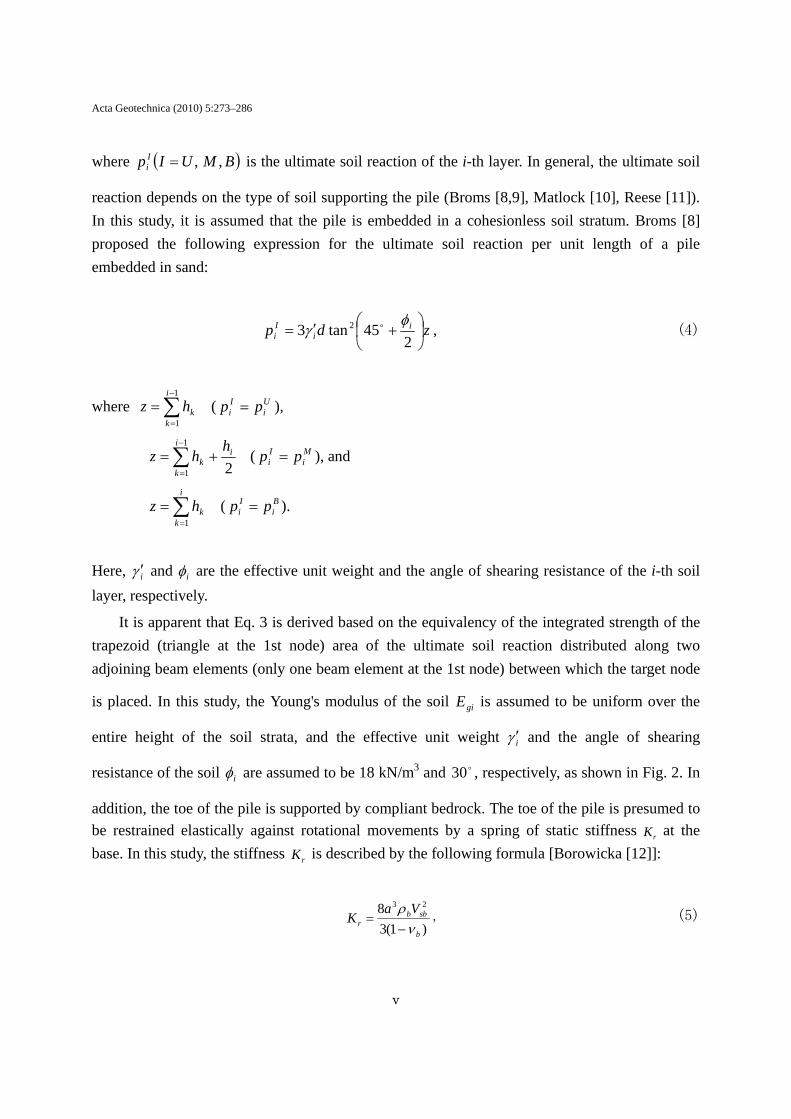
where ( )BMUIp Ii ,,= is the ultimate soil reaction of the i-th layer. In general, the ultimate soil
reaction depends on the type of soil supporting the pile (Broms [8,9], Matlock [10], Reese [11]). In this study, it is assumed that the pile is embedded in a cohesionless soil stratum. Broms [8] proposed the following expression for the ultimate soil reaction per unit length of a pile embedded in sand:
zdp ii
Ii ⎟
⎠⎞
⎜⎝⎛ +′=
245tan3 2 φ
γ o , (4)
where ∑−
=
=1
1
i
kkhz ( U
iIi pp = ),
2
1
1
ii
kk
hhz += ∑
−
=
( Mi
Ii pp = ), and
∑=
=i
kkhz
1 ( B
iIi pp = ).
Here, iγ ′ and iφ are the effective unit weight and the angle of shearing resistance of the i-th soil layer, respectively.
It is apparent that Eq. 3 is derived based on the equivalency of the integrated strength of the trapezoid (triangle at the 1st node) area of the ultimate soil reaction distributed along two adjoining beam elements (only one beam element at the 1st node) between which the target node
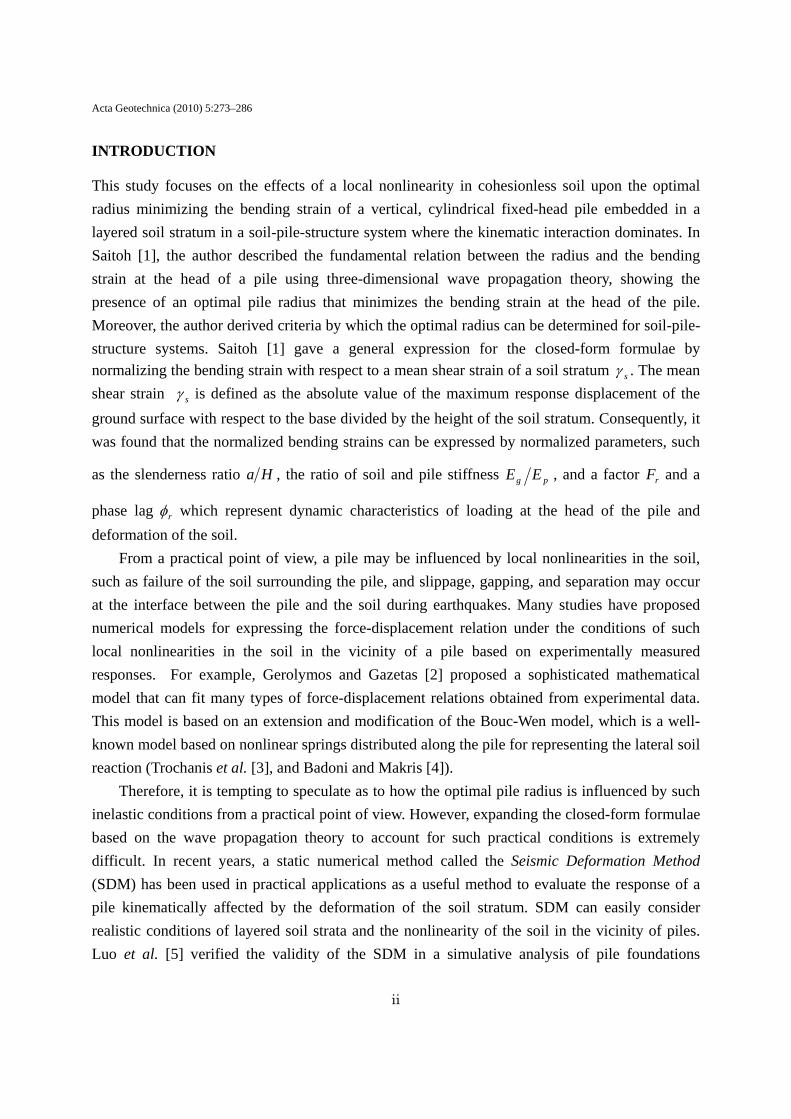
is placed. In this study, the Young's modulus of the soil giE is assumed to be uniform over the
entire height of the soil strata, and the effective unit weight iγ ′ and the angle of shearing
resistance of the soil iφ are assumed to be 18 kN/m3 and o30 , respectively, as shown in Fig. 2. In
addition, the toe of the pile is supported by compliant bedrock. The toe of the pile is presumed to be restrained elastically against rotational movements by a spring of static stiffness rK at the base. In this study, the stiffness rK is described by the following formula [Borowicka [12]]:
)1(38 23
b
sbbr
VaK
νρ−
= , (5)
Acta Geotechnica (2010) 5:273–286
vi
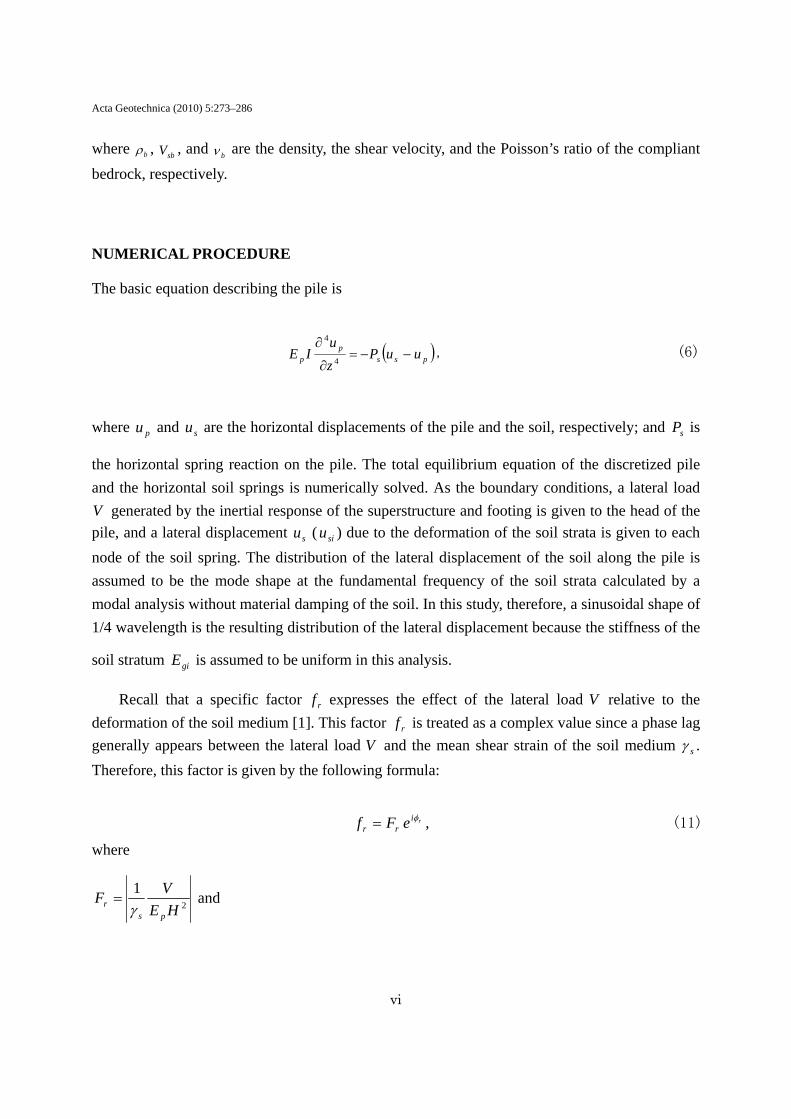
where bρ , sbV , and bν are the density, the shear velocity, and the Poisson’s ratio of the compliant bedrock, respectively.
NUMERICAL PROCEDURE
The basic equation describing the pile is
( )pssp
p uuPzu
IE −−=∂
∂4
4
, (6)
where pu and su are the horizontal displacements of the pile and the soil, respectively; and sP is
the horizontal spring reaction on the pile. The total equilibrium equation of the discretized pile and the horizontal soil springs is numerically solved. As the boundary conditions, a lateral load V generated by the inertial response of the superstructure and footing is given to the head of the pile, and a lateral displacement su ( siu ) due to the deformation of the soil strata is given to each node of the soil spring. The distribution of the lateral displacement of the soil along the pile is assumed to be the mode shape at the fundamental frequency of the soil strata calculated by a modal analysis without material damping of the soil. In this study, therefore, a sinusoidal shape of 1/4 wavelength is the resulting distribution of the lateral displacement because the stiffness of the
soil stratum giE is assumed to be uniform in this analysis.
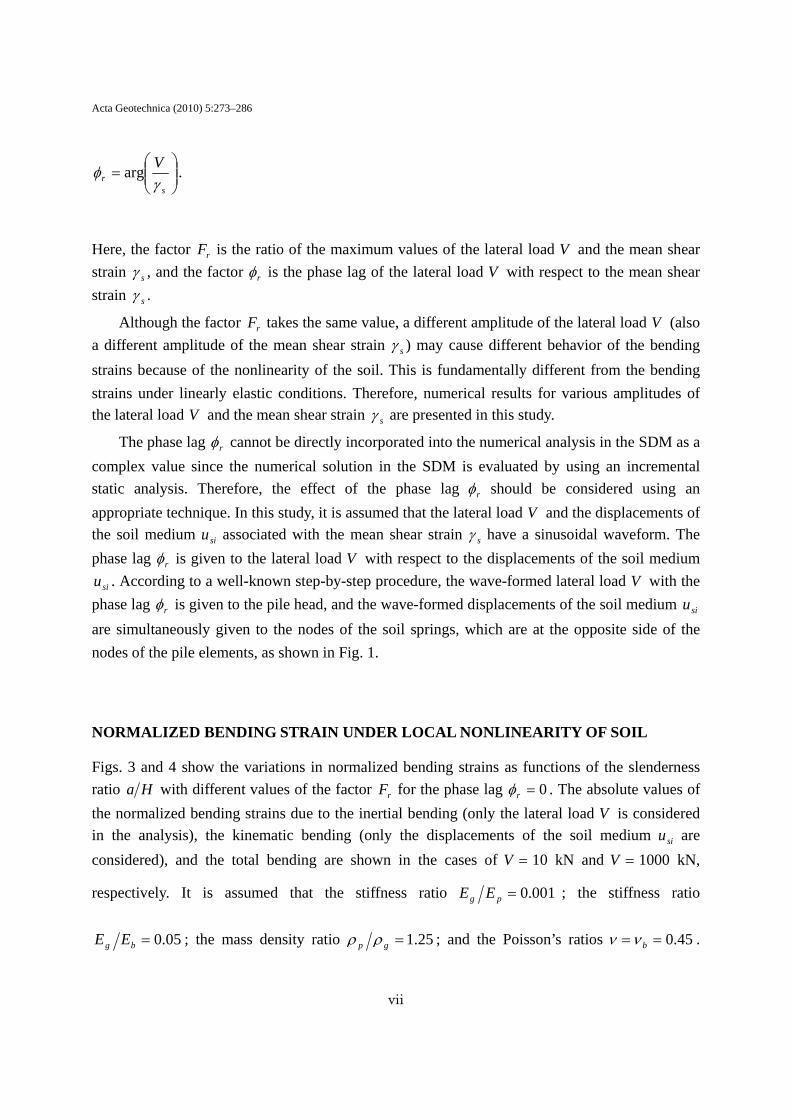
Recall that a specific factor rf expresses the effect of the lateral load V relative to the deformation of the soil medium [1]. This factor rf is treated as a complex value since a phase lag generally appears between the lateral load V and the mean shear strain of the soil medium sγ . Therefore, this factor is given by the following formula:
rirr eFf φ= , (11)
where
2
1HE
VFps
r γ= and
Acta Geotechnica (2010) 5:273–286
vii
⎟⎟⎠
⎞⎜⎜⎝
⎛=
sr
Vγ
φ arg .
Here, the factor rF is the ratio of the maximum values of the lateral load V and the mean shear strain sγ , and the factor rφ is the phase lag of the lateral load V with respect to the mean shear strain sγ .
Although the factor rF takes the same value, a different amplitude of the lateral load V (also a different amplitude of the mean shear strain sγ ) may cause different behavior of the bending strains because of the nonlinearity of the soil. This is fundamentally different from the bending strains under linearly elastic conditions. Therefore, numerical results for various amplitudes of the lateral load V and the mean shear strain sγ are presented in this study.
The phase lag rφ cannot be directly incorporated into the numerical analysis in the SDM as a complex value since the numerical solution in the SDM is evaluated by using an incremental static analysis. Therefore, the effect of the phase lag rφ should be considered using an appropriate technique. In this study, it is assumed that the lateral load V and the displacements of the soil medium siu associated with the mean shear strain sγ have a sinusoidal waveform. The phase lag rφ is given to the lateral load V with respect to the displacements of the soil medium
siu . According to a well-known step-by-step procedure, the wave-formed lateral load V with the phase lag rφ is given to the pile head, and the wave-formed displacements of the soil medium siu are simultaneously given to the nodes of the soil springs, which are at the opposite side of the nodes of the pile elements, as shown in Fig. 1.
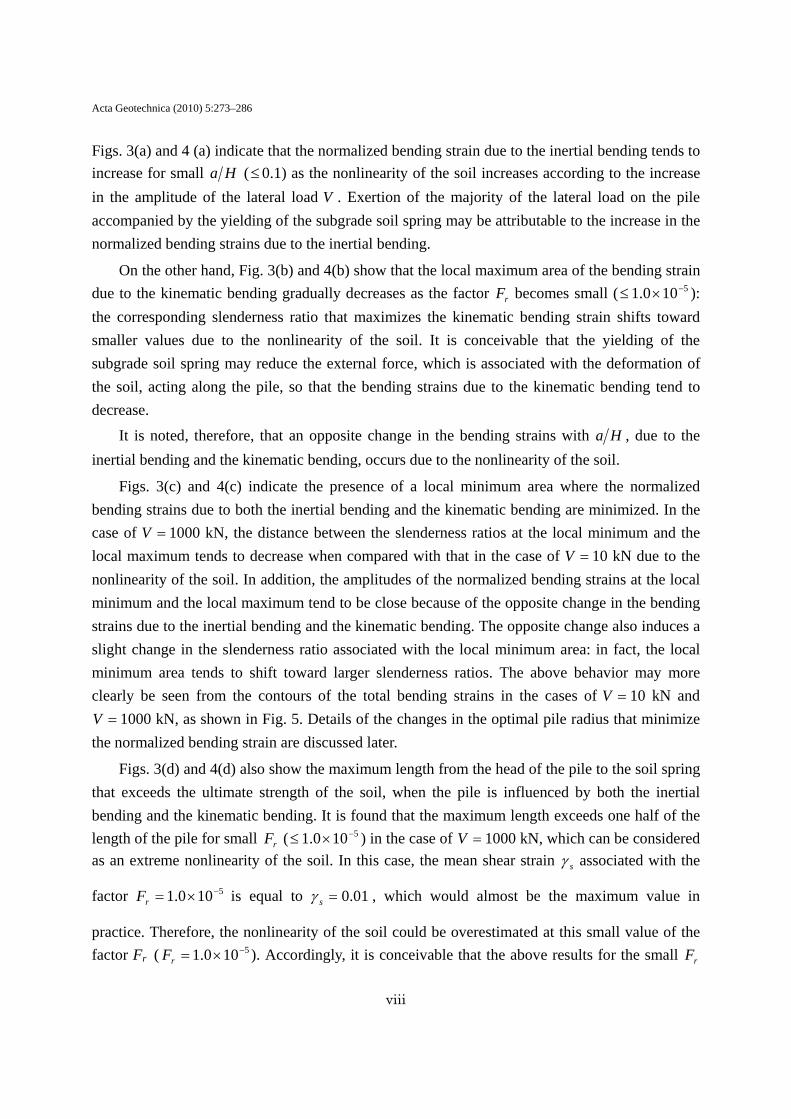
NORMALIZED BENDING STRAIN UNDER LOCAL NONLINEARITY OF SOIL
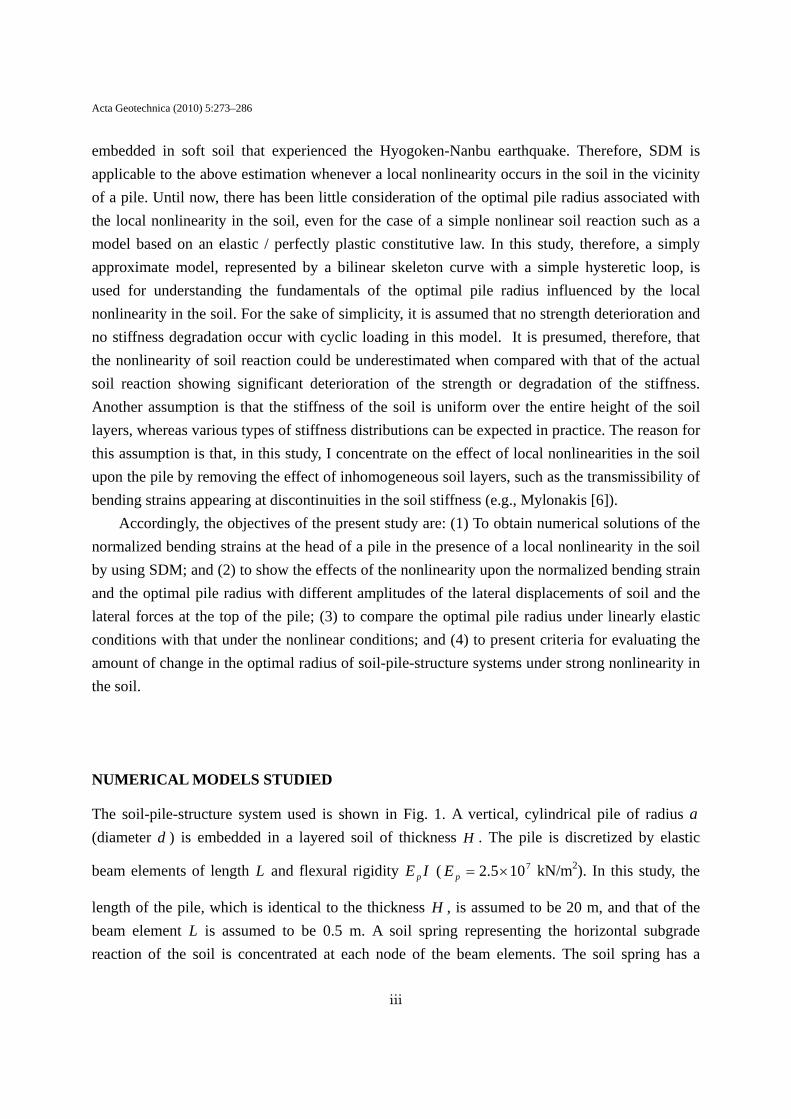
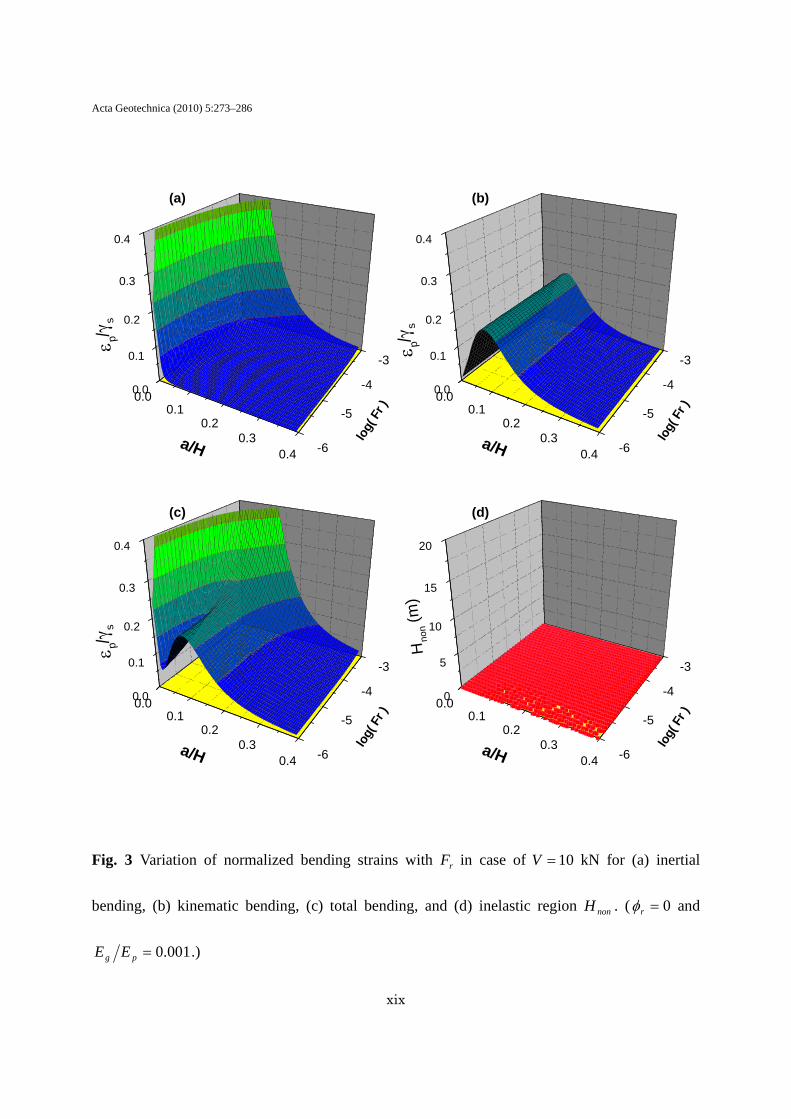
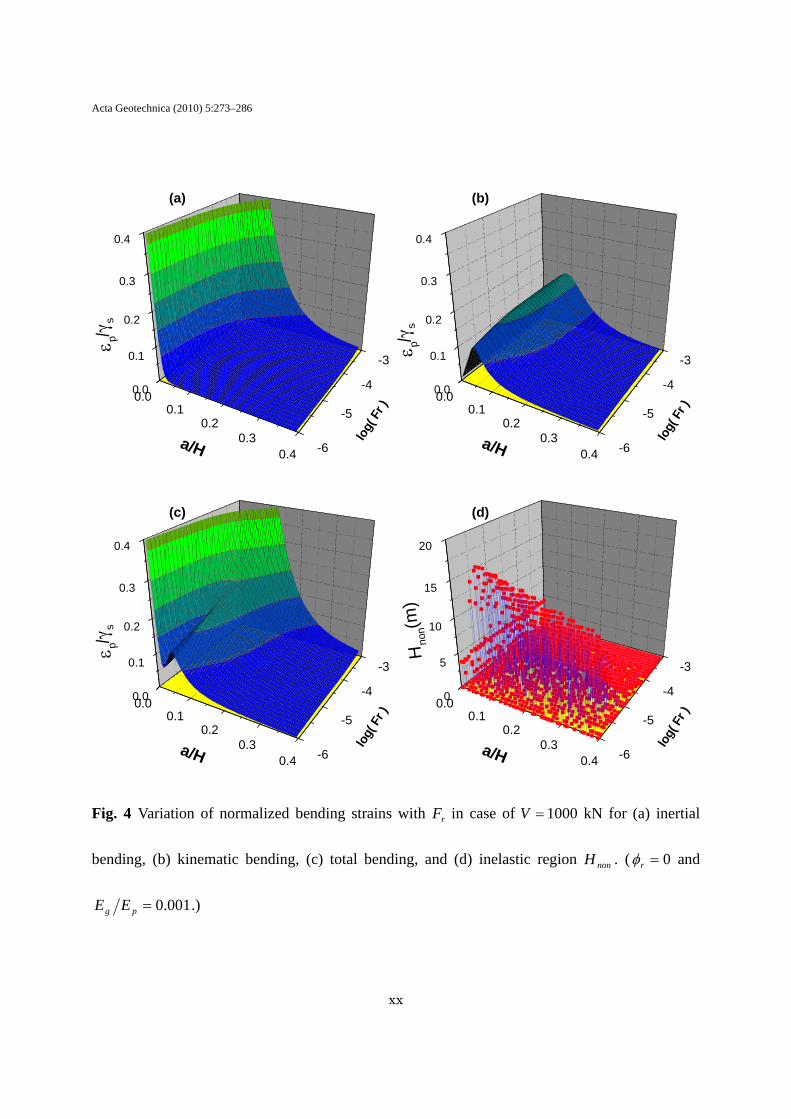
Figs. 3 and 4 show the variations in normalized bending strains as functions of the slenderness ratio Ha with different values of the factor rF for the phase lag 0=rφ . The absolute values of the normalized bending strains due to the inertial bending (only the lateral load V is considered in the analysis), the kinematic bending (only the displacements of the soil medium siu are considered), and the total bending are shown in the cases of =V 10 kN and =V 1000 kN,
respectively. It is assumed that the stiffness ratio 001.0=pg EE ; the stiffness ratio
05.0=bg EE ; the mass density ratio 25.1=gp ρρ ; and the Poisson’s ratios 45.0== bνν .
Acta Geotechnica (2010) 5:273–286
viii
Figs. 3(a) and 4 (a) indicate that the normalized bending strain due to the inertial bending tends to increase for small Ha (≤0.1) as the nonlinearity of the soil increases according to the increase in the amplitude of the lateral load V . Exertion of the majority of the lateral load on the pile accompanied by the yielding of the subgrade soil spring may be attributable to the increase in the normalized bending strains due to the inertial bending.
On the other hand, Fig. 3(b) and 4(b) show that the local maximum area of the bending strain due to the kinematic bending gradually decreases as the factor rF becomes small ( 5100.1 −×≤ ): the corresponding slenderness ratio that maximizes the kinematic bending strain shifts toward smaller values due to the nonlinearity of the soil. It is conceivable that the yielding of the subgrade soil spring may reduce the external force, which is associated with the deformation of the soil, acting along the pile, so that the bending strains due to the kinematic bending tend to decrease.
It is noted, therefore, that an opposite change in the bending strains with Ha , due to the inertial bending and the kinematic bending, occurs due to the nonlinearity of the soil.
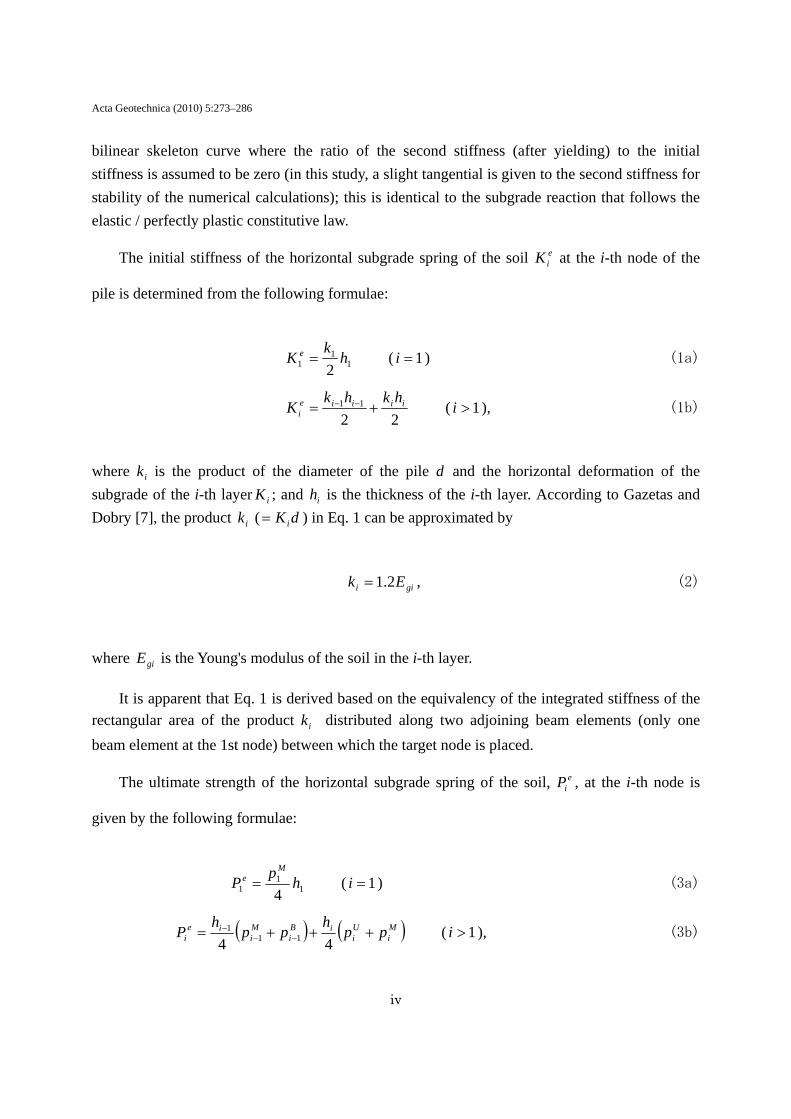
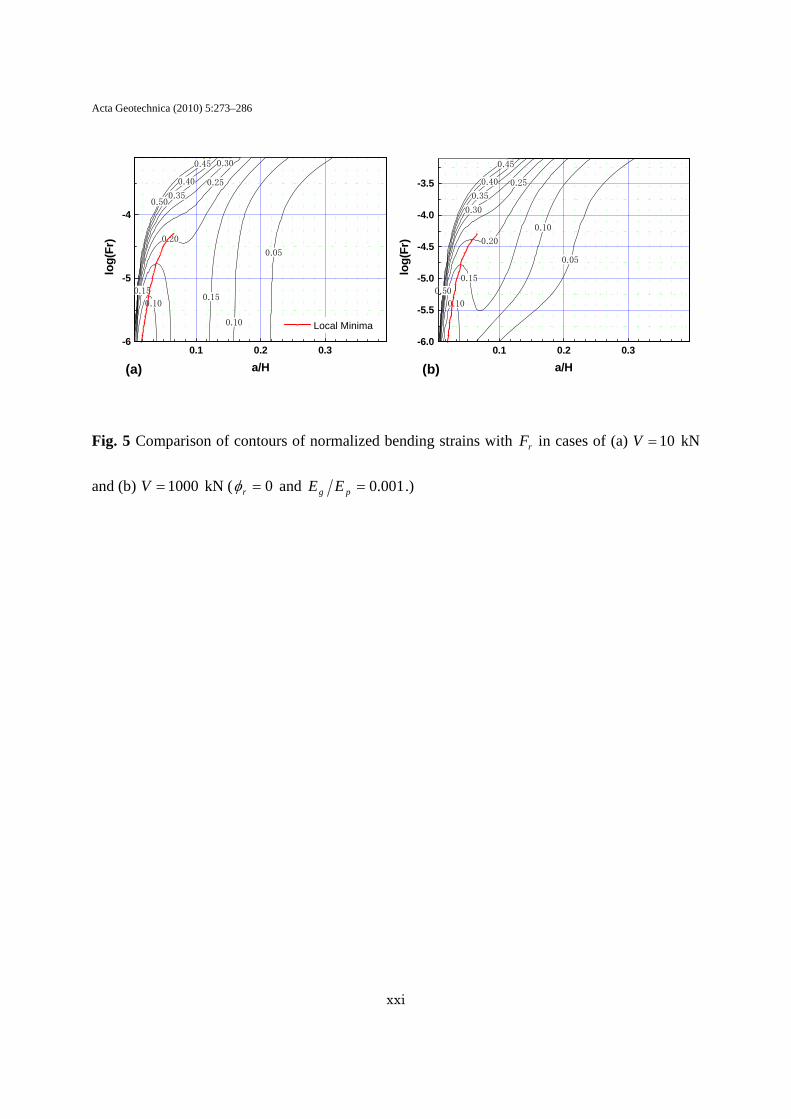
Figs. 3(c) and 4(c) indicate the presence of a local minimum area where the normalized bending strains due to both the inertial bending and the kinematic bending are minimized. In the case of =V 1000 kN, the distance between the slenderness ratios at the local minimum and the local maximum tends to decrease when compared with that in the case of =V 10 kN due to the nonlinearity of the soil. In addition, the amplitudes of the normalized bending strains at the local minimum and the local maximum tend to be close because of the opposite change in the bending strains due to the inertial bending and the kinematic bending. The opposite change also induces a slight change in the slenderness ratio associated with the local minimum area: in fact, the local minimum area tends to shift toward larger slenderness ratios. The above behavior may more clearly be seen from the contours of the total bending strains in the cases of =V 10 kN and =V 1000 kN, as shown in Fig. 5. Details of the changes in the optimal pile radius that minimize
the normalized bending strain are discussed later.
Figs. 3(d) and 4(d) also show the maximum length from the head of the pile to the soil spring that exceeds the ultimate strength of the soil, when the pile is influenced by both the inertial bending and the kinematic bending. It is found that the maximum length exceeds one half of the length of the pile for small rF ( 5100.1 −×≤ ) in the case of =V 1000 kN, which can be considered as an extreme nonlinearity of the soil. In this case, the mean shear strain sγ associated with the
factor 5100.1 −×=rF is equal to 01.0=sγ , which would almost be the maximum value in
practice. Therefore, the nonlinearity of the soil could be overestimated at this small value of the factor Fr ( 5100.1 −×=rF ). Accordingly, it is conceivable that the above results for the small rF
Acta Geotechnica (2010) 5:273–286
ix
( 5100.1 −×≤ ) would be comparable to those in cases when an extreme decrease in the ultimate strength of the soil occurs due to changes in the effective unit weight iγ ′ (e.g., a change in water level) and the angle of shear resistance iφ in Eq. 4(a), as well as when the strength deterioration and stiffness degradation of the soil springs are taken into consideration in practice.
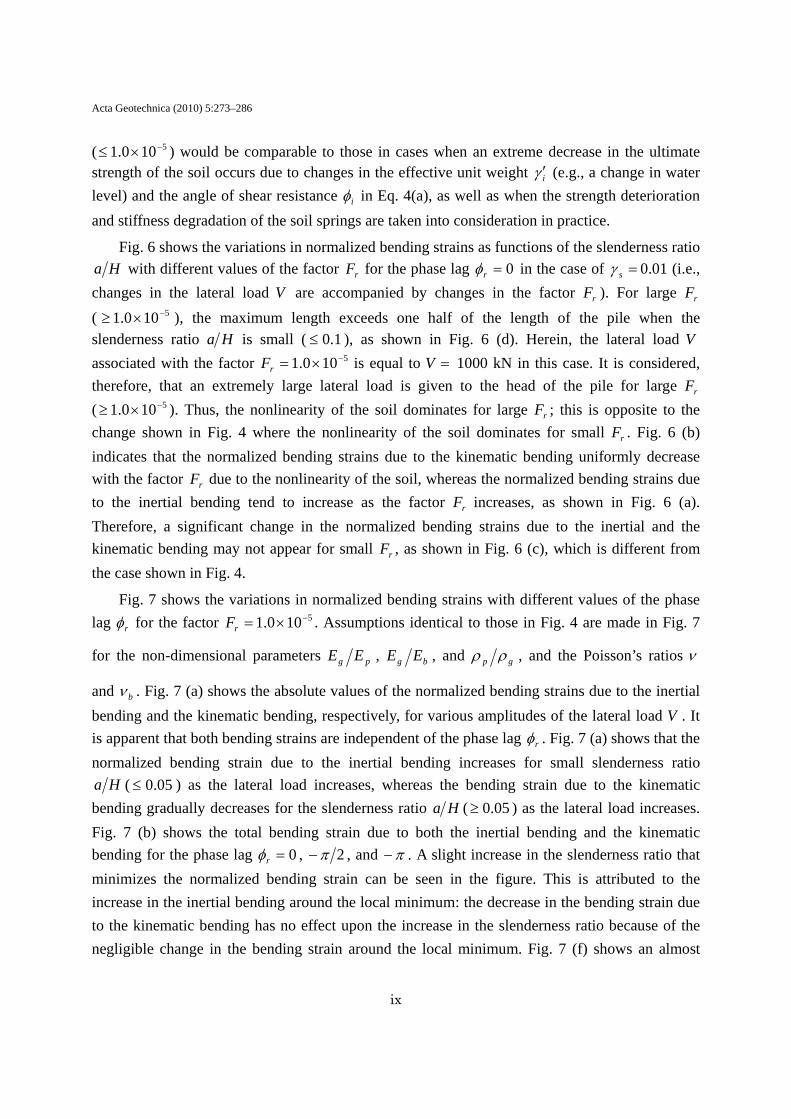
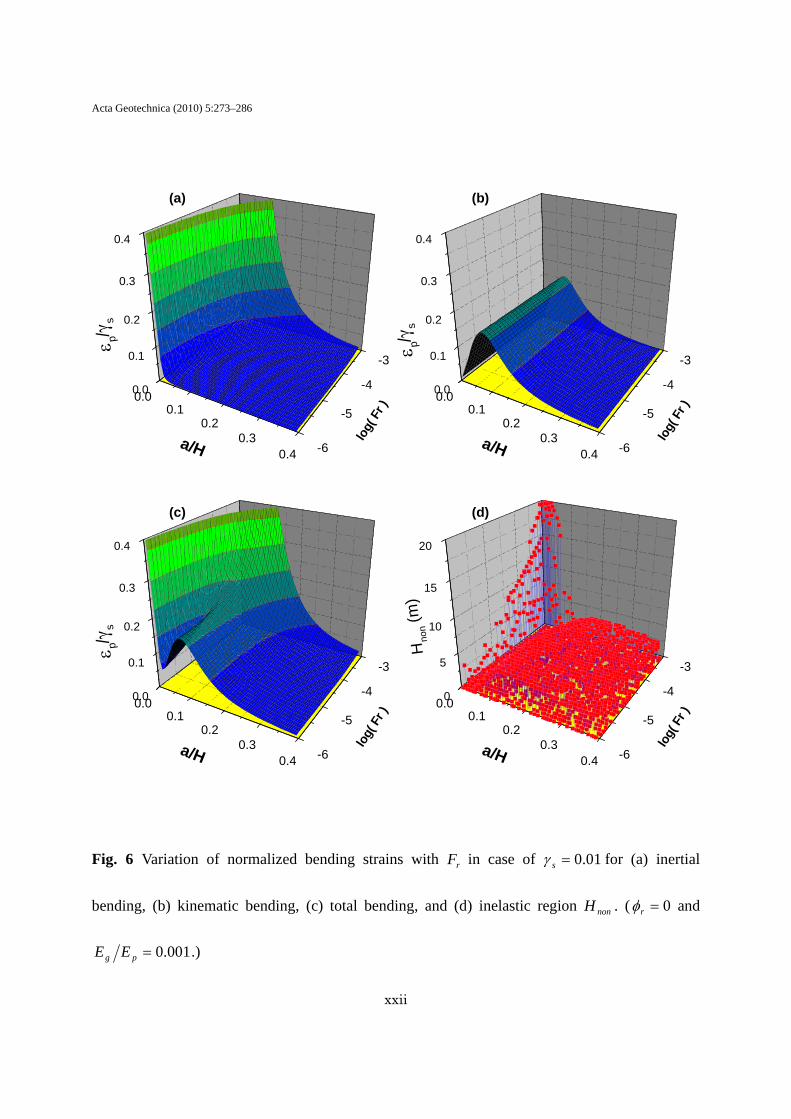
Fig. 6 shows the variations in normalized bending strains as functions of the slenderness ratio Ha with different values of the factor rF for the phase lag 0=rφ in the case of =sγ 0.01 (i.e.,
changes in the lateral load V are accompanied by changes in the factor rF ). For large rF ( 5100.1 −×≥ ), the maximum length exceeds one half of the length of the pile when the slenderness ratio Ha is small ( 1.0≤ ), as shown in Fig. 6 (d). Herein, the lateral load V associated with the factor 5100.1 −×=rF is equal to =V 1000 kN in this case. It is considered, therefore, that an extremely large lateral load is given to the head of the pile for large rF ( 5100.1 −×≥ ). Thus, the nonlinearity of the soil dominates for large rF ; this is opposite to the change shown in Fig. 4 where the nonlinearity of the soil dominates for small rF . Fig. 6 (b) indicates that the normalized bending strains due to the kinematic bending uniformly decrease with the factor rF due to the nonlinearity of the soil, whereas the normalized bending strains due to the inertial bending tend to increase as the factor rF increases, as shown in Fig. 6 (a). Therefore, a significant change in the normalized bending strains due to the inertial and the kinematic bending may not appear for small rF , as shown in Fig. 6 (c), which is different from the case shown in Fig. 4.
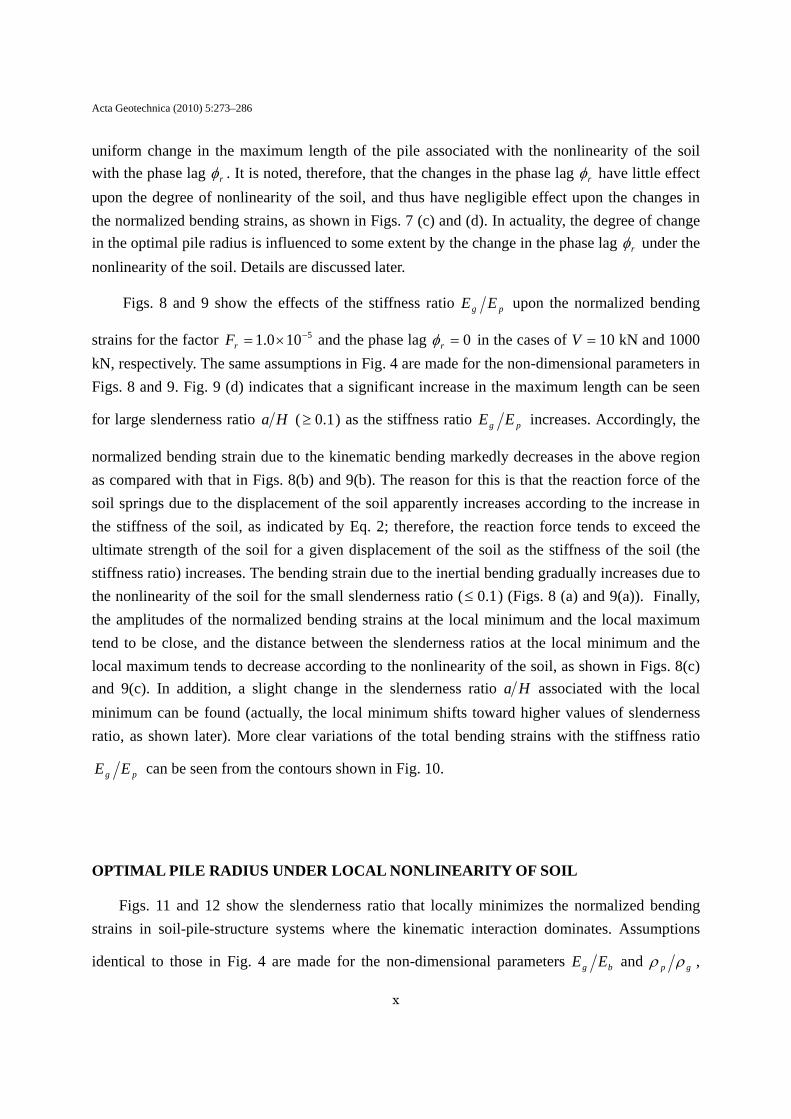
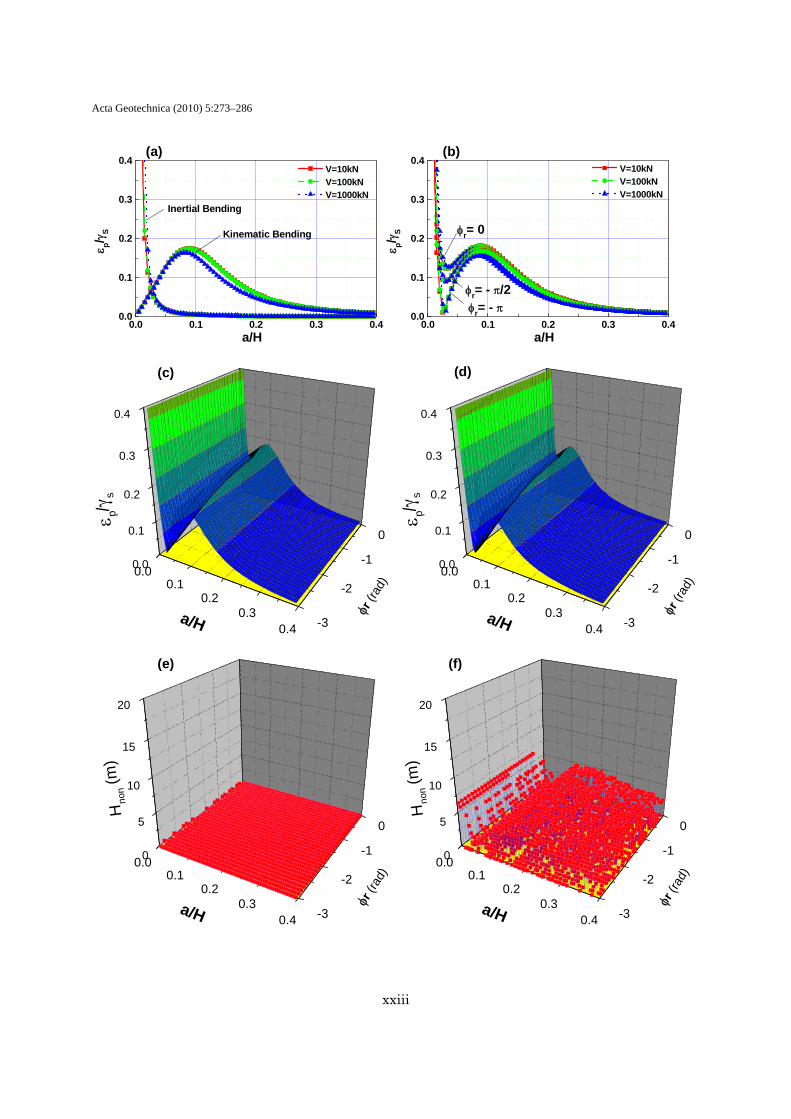
Fig. 7 shows the variations in normalized bending strains with different values of the phase lag rφ for the factor 5100.1 −×=rF . Assumptions identical to those in Fig. 4 are made in Fig. 7
for the non-dimensional parameters pg EE , bg EE , and gp ρρ , and the Poisson’s ratios ν
and bν . Fig. 7 (a) shows the absolute values of the normalized bending strains due to the inertial bending and the kinematic bending, respectively, for various amplitudes of the lateral load V . It is apparent that both bending strains are independent of the phase lag rφ . Fig. 7 (a) shows that the normalized bending strain due to the inertial bending increases for small slenderness ratio
Ha ( 05.0≤ ) as the lateral load increases, whereas the bending strain due to the kinematic bending gradually decreases for the slenderness ratio Ha ( 05.0≥ ) as the lateral load increases. Fig. 7 (b) shows the total bending strain due to both the inertial bending and the kinematic bending for the phase lag 0=rφ , 2π− , and π− . A slight increase in the slenderness ratio that minimizes the normalized bending strain can be seen in the figure. This is attributed to the increase in the inertial bending around the local minimum: the decrease in the bending strain due to the kinematic bending has no effect upon the increase in the slenderness ratio because of the negligible change in the bending strain around the local minimum. Fig. 7 (f) shows an almost
Acta Geotechnica (2010) 5:273–286
x
uniform change in the maximum length of the pile associated with the nonlinearity of the soil with the phase lag rφ . It is noted, therefore, that the changes in the phase lag rφ have little effect upon the degree of nonlinearity of the soil, and thus have negligible effect upon the changes in the normalized bending strains, as shown in Figs. 7 (c) and (d). In actuality, the degree of change in the optimal pile radius is influenced to some extent by the change in the phase lag rφ under the nonlinearity of the soil. Details are discussed later.
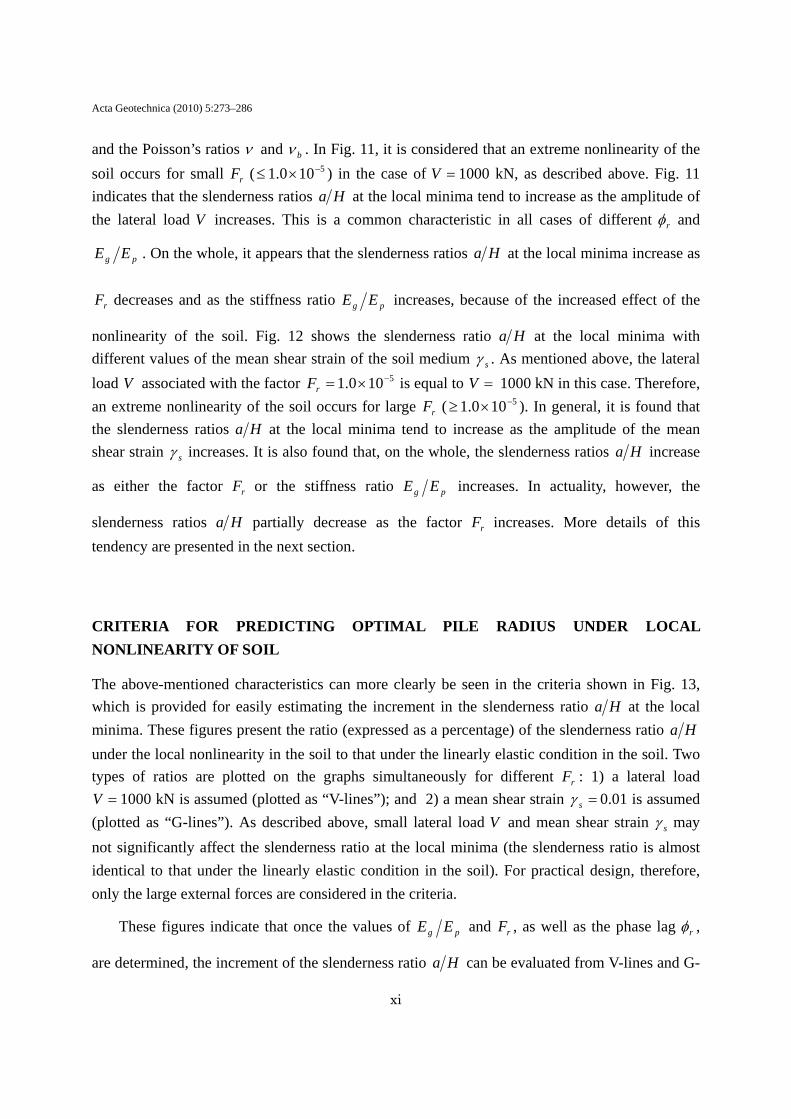
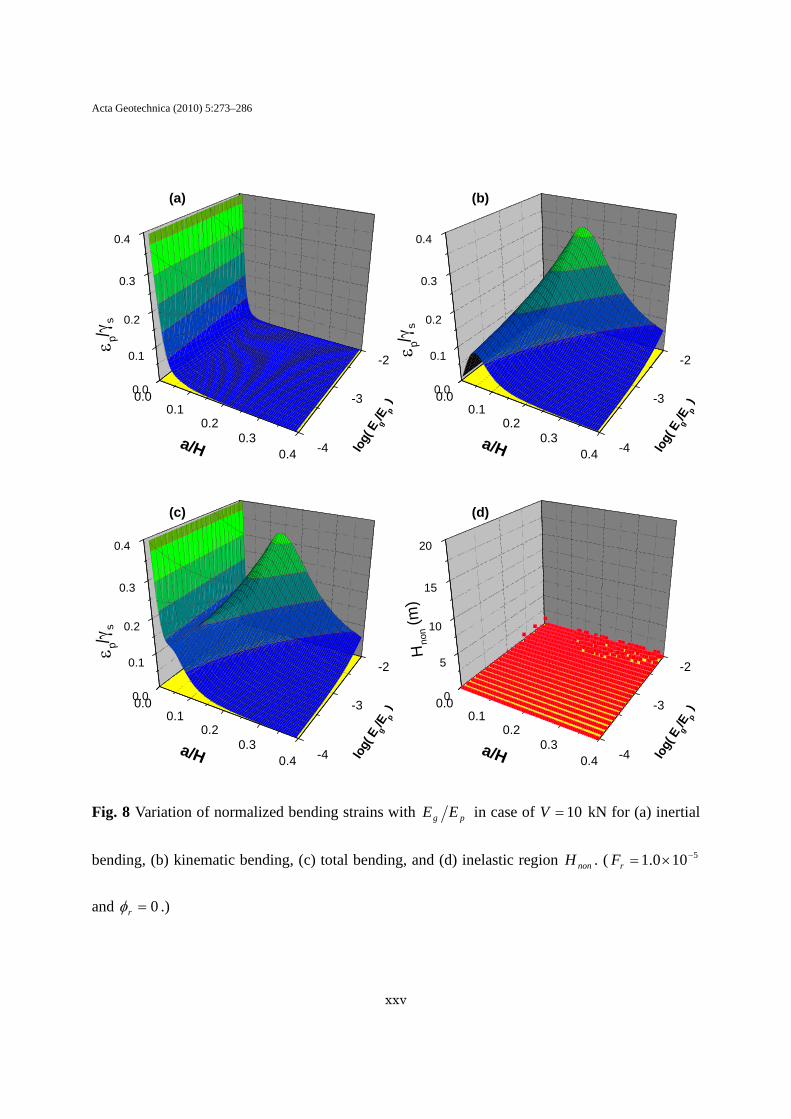
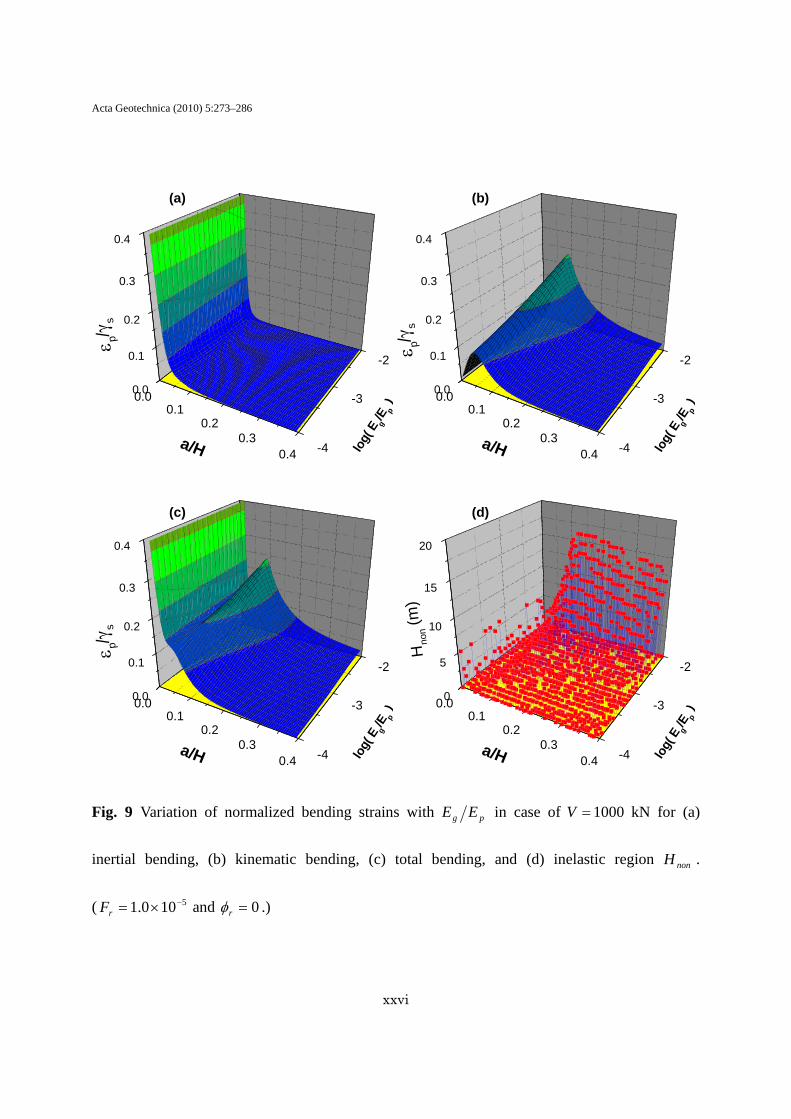
Figs. 8 and 9 show the effects of the stiffness ratio pg EE upon the normalized bending
strains for the factor 5100.1 −×=rF and the phase lag 0=rφ in the cases of =V 10 kN and 1000 kN, respectively. The same assumptions in Fig. 4 are made for the non-dimensional parameters in Figs. 8 and 9. Fig. 9 (d) indicates that a significant increase in the maximum length can be seen
for large slenderness ratio Ha ( 1.0≥ ) as the stiffness ratio pg EE increases. Accordingly, the
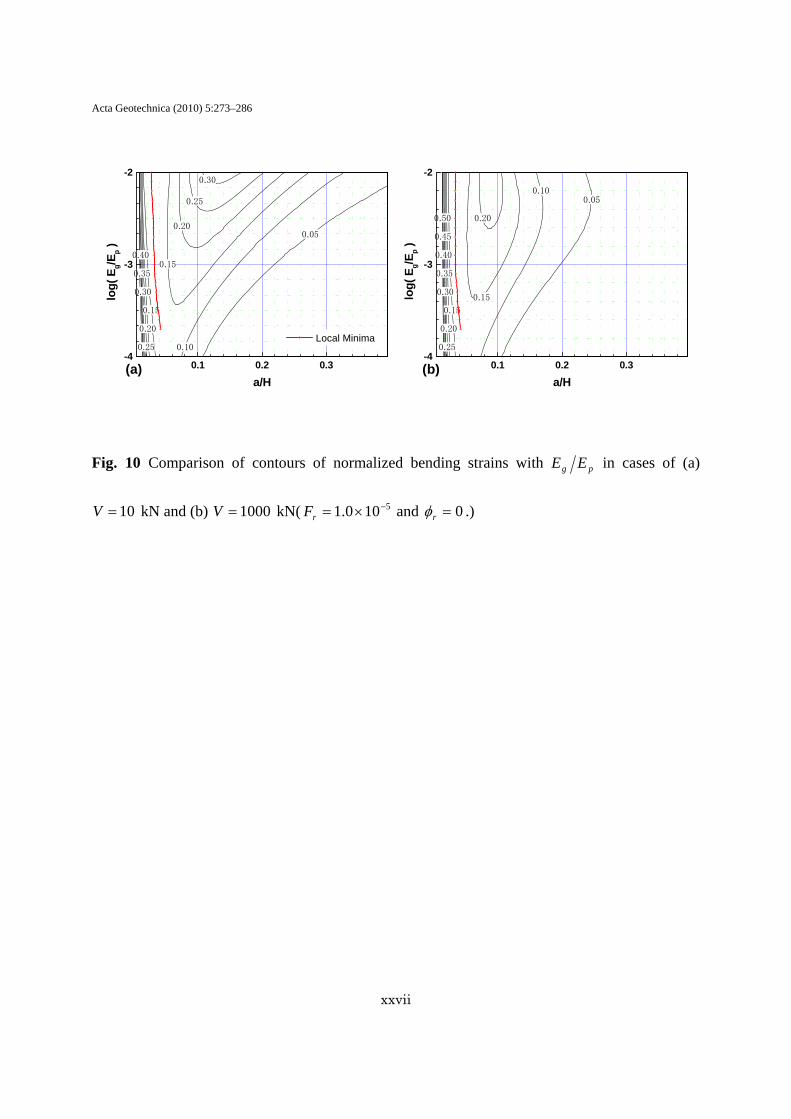
normalized bending strain due to the kinematic bending markedly decreases in the above region as compared with that in Figs. 8(b) and 9(b). The reason for this is that the reaction force of the soil springs due to the displacement of the soil apparently increases according to the increase in the stiffness of the soil, as indicated by Eq. 2; therefore, the reaction force tends to exceed the ultimate strength of the soil for a given displacement of the soil as the stiffness of the soil (the stiffness ratio) increases. The bending strain due to the inertial bending gradually increases due to the nonlinearity of the soil for the small slenderness ratio ( 1.0≤ ) (Figs. 8 (a) and 9(a)). Finally, the amplitudes of the normalized bending strains at the local minimum and the local maximum tend to be close, and the distance between the slenderness ratios at the local minimum and the local maximum tends to decrease according to the nonlinearity of the soil, as shown in Figs. 8(c) and 9(c). In addition, a slight change in the slenderness ratio Ha associated with the local minimum can be found (actually, the local minimum shifts toward higher values of slenderness ratio, as shown later). More clear variations of the total bending strains with the stiffness ratio
pg EE can be seen from the contours shown in Fig. 10.
OPTIMAL PILE RADIUS UNDER LOCAL NONLINEARITY OF SOIL
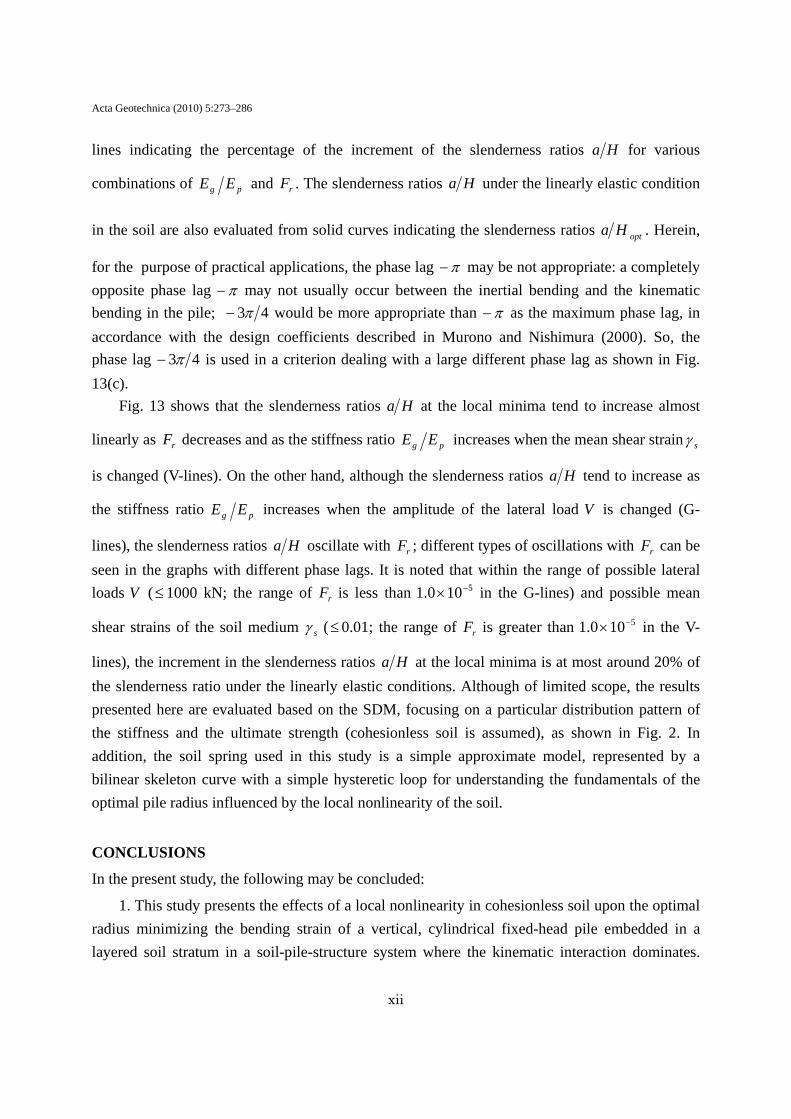
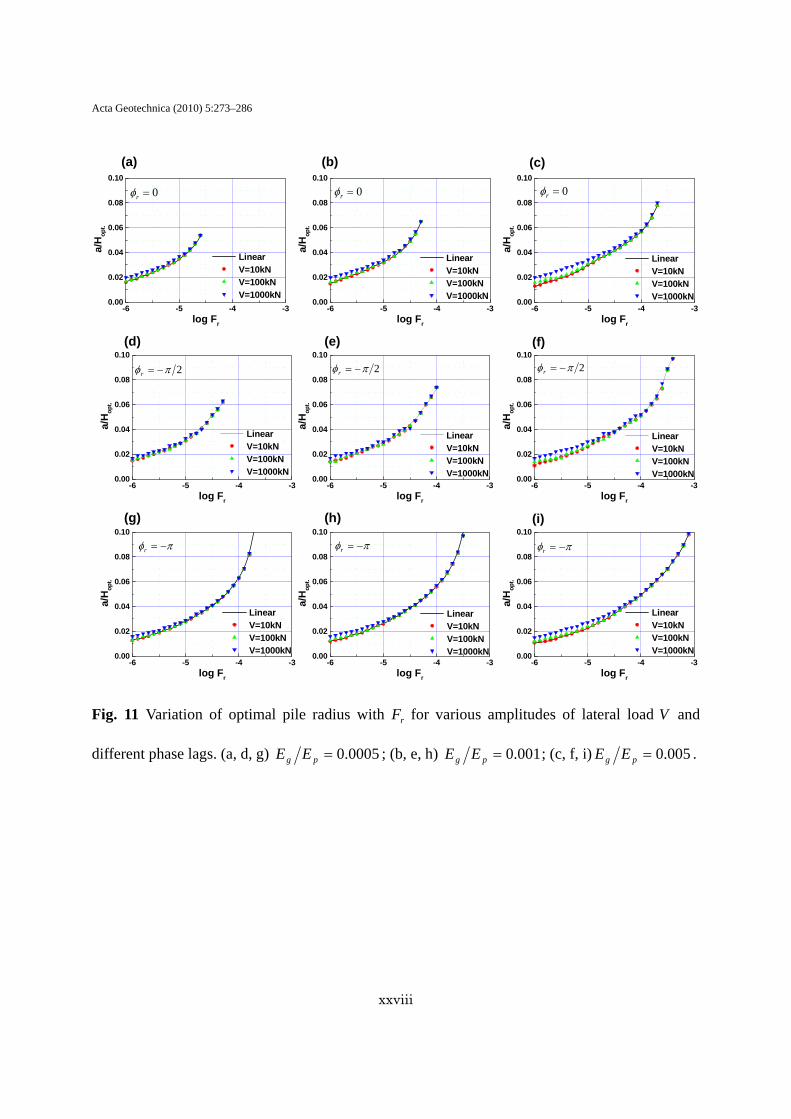
Figs. 11 and 12 show the slenderness ratio that locally minimizes the normalized bending strains in soil-pile-structure systems where the kinematic interaction dominates. Assumptions
identical to those in Fig. 4 are made for the non-dimensional parameters bg EE and gp ρρ ,
Acta Geotechnica (2010) 5:273–286
xi
and the Poisson’s ratios ν and bν . In Fig. 11, it is considered that an extreme nonlinearity of the soil occurs for small rF ( 5100.1 −×≤ ) in the case of =V 1000 kN, as described above. Fig. 11 indicates that the slenderness ratios Ha at the local minima tend to increase as the amplitude of the lateral load V increases. This is a common characteristic in all cases of different rφ and
pg EE . On the whole, it appears that the slenderness ratios Ha at the local minima increase as
rF decreases and as the stiffness ratio pg EE increases, because of the increased effect of the
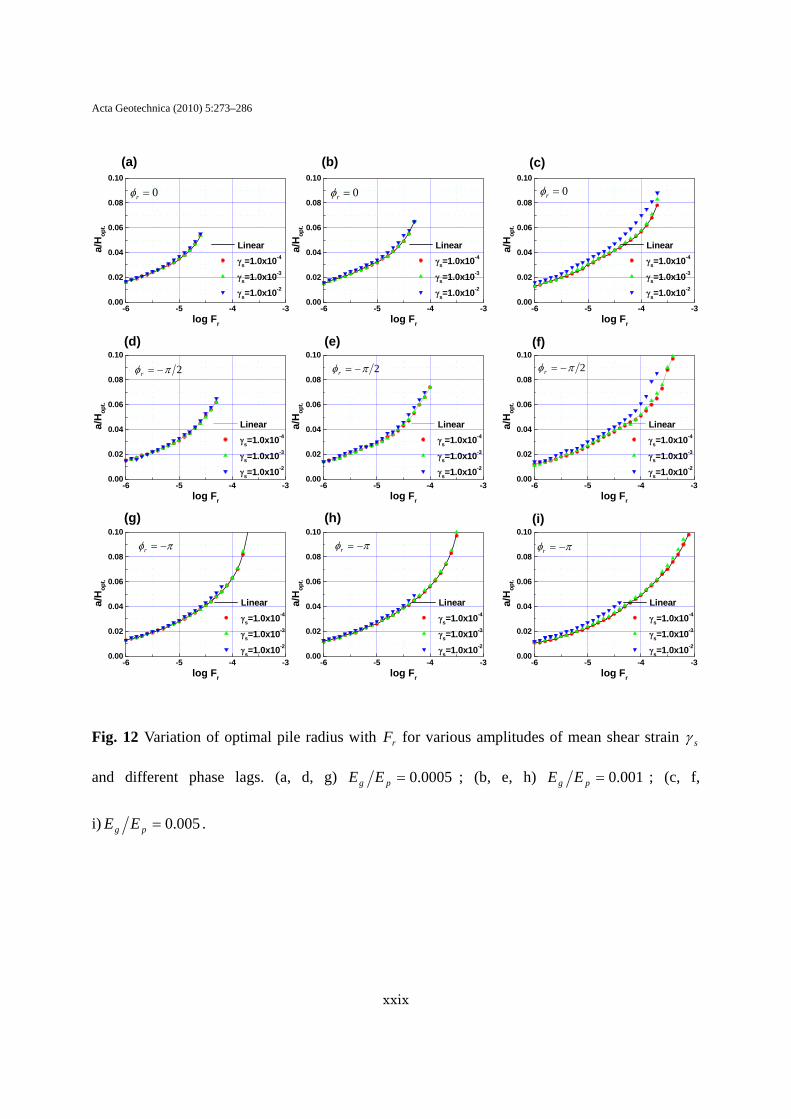
nonlinearity of the soil. Fig. 12 shows the slenderness ratio Ha at the local minima with different values of the mean shear strain of the soil medium sγ . As mentioned above, the lateral load V associated with the factor 5100.1 −×=rF is equal to =V 1000 kN in this case. Therefore, an extreme nonlinearity of the soil occurs for large rF ( 5100.1 −×≥ ). In general, it is found that the slenderness ratios Ha at the local minima tend to increase as the amplitude of the mean shear strain sγ increases. It is also found that, on the whole, the slenderness ratios Ha increase
as either the factor rF or the stiffness ratio pg EE increases. In actuality, however, the
slenderness ratios Ha partially decrease as the factor rF increases. More details of this tendency are presented in the next section.
CRITERIA FOR PREDICTING OPTIMAL PILE RADIUS UNDER LOCAL NONLINEARITY OF SOIL
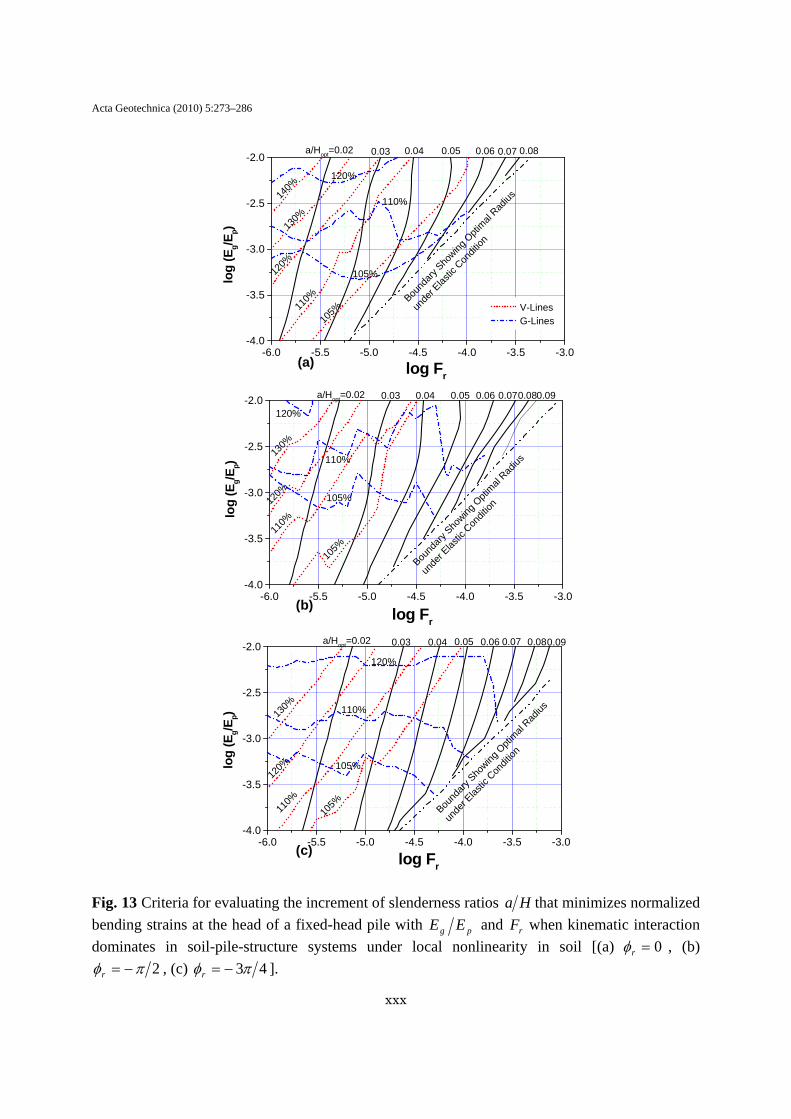
The above-mentioned characteristics can more clearly be seen in the criteria shown in Fig. 13, which is provided for easily estimating the increment in the slenderness ratio Ha at the local minima. These figures present the ratio (expressed as a percentage) of the slenderness ratio Ha under the local nonlinearity in the soil to that under the linearly elastic condition in the soil. Two types of ratios are plotted on the graphs simultaneously for different rF : 1) a lateral load =V 1000 kN is assumed (plotted as “V-lines”); and 2) a mean shear strain =sγ 0.01 is assumed
(plotted as “G-lines”). As described above, small lateral load V and mean shear strain sγ may not significantly affect the slenderness ratio at the local minima (the slenderness ratio is almost identical to that under the linearly elastic condition in the soil). For practical design, therefore, only the large external forces are considered in the criteria.
These figures indicate that once the values of pg EE and rF , as well as the phase lag rφ ,
are determined, the increment of the slenderness ratio Ha can be evaluated from V-lines and G-
Acta Geotechnica (2010) 5:273–286
xii
lines indicating the percentage of the increment of the slenderness ratios Ha for various
combinations of pg EE and rF . The slenderness ratios Ha under the linearly elastic condition
in the soil are also evaluated from solid curves indicating the slenderness ratios optHa . Herein,
for the purpose of practical applications, the phase lag π− may be not appropriate: a completely opposite phase lag π− may not usually occur between the inertial bending and the kinematic bending in the pile; 43π− would be more appropriate than π− as the maximum phase lag, in accordance with the design coefficients described in Murono and Nishimura (2000). So, the phase lag 43π− is used in a criterion dealing with a large different phase lag as shown in Fig. 13(c).
Fig. 13 shows that the slenderness ratios Ha at the local minima tend to increase almost
linearly as rF decreases and as the stiffness ratio pg EE increases when the mean shear strain sγ
is changed (V-lines). On the other hand, although the slenderness ratios Ha tend to increase as
the stiffness ratio pg EE increases when the amplitude of the lateral load V is changed (G-
lines), the slenderness ratios Ha oscillate with rF ; different types of oscillations with rF can be seen in the graphs with different phase lags. It is noted that within the range of possible lateral loads V (≤1000 kN; the range of rF is less than 5100.1 −× in the G-lines) and possible mean
shear strains of the soil medium sγ (≤0.01; the range of rF is greater than 5100.1 −× in the V-
lines), the increment in the slenderness ratios Ha at the local minima is at most around 20% of the slenderness ratio under the linearly elastic conditions. Although of limited scope, the results presented here are evaluated based on the SDM, focusing on a particular distribution pattern of the stiffness and the ultimate strength (cohesionless soil is assumed), as shown in Fig. 2. In addition, the soil spring used in this study is a simple approximate model, represented by a bilinear skeleton curve with a simple hysteretic loop for understanding the fundamentals of the optimal pile radius influenced by the local nonlinearity of the soil.
CONCLUSIONS
In the present study, the following may be concluded:
1. This study presents the effects of a local nonlinearity in cohesionless soil upon the optimal radius minimizing the bending strain of a vertical, cylindrical fixed-head pile embedded in a layered soil stratum in a soil-pile-structure system where the kinematic interaction dominates.
Acta Geotechnica (2010) 5:273–286
xiii
Discretized numerical models are constructed based on the Seismic Deformation Method (SDM). In this study, the nonlinearity in the soil is represented by a simple approximate model, represented by a bilinear skeleton curve with a simple hysteretic loop. As a general expression for the bending strain at the head of the pile, the bending strain is normalized with respect to a mean shear strain of a soil stratum sγ based on a series of previous studies. The present study shows the normalized bending strains for various parameters, such as the ratio of soil and pile stiffness
pg EE , a factor rF , and a phase lag rφ , including different amplitudes of the lateral load V
(also different amplitudes of the mean shear strain of the soil medium sγ ) for expressing a range of nonlinearities of the soil.
2. Numerical results show that the normalized bending strain due to the inertial bending tends to increase for small slenderness ratio Ha as the nonlinearity of the soil increases, whereas the normalized bending strain due to the kinematic bending tends to decrease. Therefore, an opposite change in the bending strains with Ha , due to the inertial bending and the kinematic bending, occurs due to the nonlinearity of the soil. Accordingly, the local minimum and the local maximum appearing in the normalized bending strains due to the inertial bending and the kinematic bending tend to be close, and the distance between the slenderness ratios associated with the local minimum and the local maximum tends to decrease as the nonlinearity of the soil increases.
3. This study shows the slenderness ratio Ha that locally minimizes the normalized bending strains for various amplitudes of the lateral load and the mean shear strain with different
stiffness ratios pg EE and phase lags rφ . Numerical results indicate that the slenderness ratio
increases due to the local nonlinearity in the soil as the amplitudes of the lateral load and the mean shear strain increase. The slenderness ratio also tends to increase as the stiffness ratio
pg EE increases.
4. Criteria for predicting the increment of the optimal radius of soil-pile-structure systems under strong nonlinearity in the soil are presented. The criteria imply that the increment of the slenderness ratio Ha at the local maxima is at most around 20% of the slenderness ratio under linearly elastic conditions within the range of various parameters presented here.
Acta Geotechnica (2010) 5:273–286
xiv
APPENDIX A. NOTATION
The following symbols are used in this paper:
a = radius of pile;
.optHa = optimal slenderness ratio;
bE = Young’s modulus of bedrock;
gE = Young’s modulus of soil;
giE = Young's modulus in the i-th layer of soil
pE = Young’s modulus of pile;
H = length of pile;
ih = length of beam element in the i-th layer;
I = geometrical moment of inertia of pile;
iK = horizontal deformation of subgrade of the i-th layer of soil;
eiK = initial stiffness of the horizontal subgrade spring of the soil at the i-th node
of pile;
rK = rotational stiffness at the toe of pile;
ik = horizontal subgrade spring of soil at the i-th layer of soil;
N = total number of layers;
eiP = ultimate strength of the horizontal subgrade spring of the soil e
iP at the i-th
node of pile;
Iip = ultimate soil reaction of the i-th layer of soil;
iφ = angle of shearing resistance of the i-th soil layer;
rφ = phase lag of lateral load with respect to mean shear strain;
pu = horizontal displacement of pile with respect to bedrock;
siu = relative displacement of the i-th soil layer with respect to bedrock;
Acta Geotechnica (2010) 5:273–286
xv
V = lateral load acting at top of pile;
sV = shear velocity of soil;
sbV = shear velocity of bedrock;
iγ ′ = effective unit weight of the i-th soil layer;
sγ = mean shear strain of soil stratum;
ν = Poisson’s ratio of soil;
bν = Poisson’s ratio of bedrock;
bρ = mass density of bedrock;
gρ = mass density of soil.
REFERENCES
[1] Saitoh, M (2005) Fixed-head pile bending by kinematic interaction and criteria for its minimization at optimal pile radius. Journal of Geotechnical and Geoenvironmental Engineering, ASCE 131(10): 1243-1251.
[2] Gerolymos, N. and Gazetas, G (2005) Phenomenological model applied to inelastic response of soil-pile interaction systems. Soils and Foundations, JGS 45(4): 119-132.
[3] Trochanis, A., Bielak, J., and Christano, P (1991) Simplified model for analysis of one or two piles. Journal of Geotechnical Engineering, ASCE 117(3): 448-466.
[4] Badoni, D. and Makris, N (1995) Nonlinear response of single piles under lateral inertial and seismic loads. Soil Dynamics and Earthquake Engineering 15: 29-43.
[5] Luo, X., Murono, Y., and Nishimura, A (2002) Verifying adequacy of the seismic deformation method by using real examples of earthquake damage. Soil Dynamics and Earthquake Engineering 22: 17-28.
[6] Mylonakis, G (2001) Simplified model for seismic pile bending at soil layer interfaces. Soils and Foundations JGS 41(4): 47-58.
[7] Gazetas, G. and Dobry, R (1984) Horizontal response of piles in layered soils. Journal of Geotechnical Engineering, ASCE 110(6): 937-956.
[8] Broms, B. B (1964) Lateral resistance of piles in cohesionless soils. Journal of Soil Mechanics and Foundation Division, ASCE 90(SM3): 123-156.
[9] Broms, B. B (1964) Lateral resistance of piles in cohesive soils. Journal of Soil Mechanics and Foundation Division, ASCE 90(SM2): 27-63.
[10] Matlock, H (1970) Correlations for design of laterally loaded piles in soft clay. Paper No.

Acta Geotechnica (2010) 5:273–286
xvi
OTC 1204, Proc. 2nd Annual Offshore Technology Conference, Houston, Texas I: 557-594.
[11] Reese, L. C., Cox, W. R., and Koop, F. D (1975) Field testing and analysis of laterally loaded piles in stiff clay. Paper No. OTC 2312, Proc. 7th Annual Offshore Technology Conference, Houston, Texas II: 672-690.
[12] Borowicka, H (1943) Über ausmittig belastete starre Platten auf elastisch isotropem Untergrund. Ingenieur-Archiv 1:1-8.
Acta Geotechnica (2010) 5:273–286
xvii
Fig. 1 Discretized soil-pile-structure model for layered soil medium and a fixed-head pile
supported by rotationally compliant bedrock.
H
Rotational Stiffness at the Toe of the pile
Fixed-Head Conditions V
siu
rK
1su2su3su
M
M
sNu
Layer-1
Layer-2
Layer-3
M
M
Layer-i
Layer-N
M
M
1h
2h
3h
ih
Nh
eiP
eiK
Soil Spring
Node of Soil Spring Node of Soil Spring and Pile
Acta Geotechnica (2010) 5:273–286
xviii
Fig. 2 Discretized soil springs and subgrade reactions applied in numerical analyses.
HM
M
1h
2h
3h
ih
Nh
21
1khK e =
2221
2khkhK e +=
2232
3khkhK e +=
M
221 iie
ikhkhK += −
M
221 NNe
NkhkhK += −
( ).constEK gei = ( )o30=φe
iP
Acta Geotechnica (2010) 5:273–286
xix
0.00.1
0.20.3
0.4 -6
-5
-4
-3
0.0
0.1
0.2
0.3
0.4
ε p/γ
s
log(
Fr )
a/H
0.00.1
0.20.3
0.4 -6
-5
-4
-3
0.0
0.1
0.2
0.3
0.4
ε p/γ
s
log(
Fr )
a/H
0.00.1
0.20.3
0.4 -6
-5
-4
-3
0.0
0.1
0.2
0.3
0.4
ε p/γ
s
log(
Fr )
a/H
0.00.1
0.20.3
0.4 -6
-5
-4
-3
0
5
10
15
20
Hno
n (m
)
log(
Fr )
a/H
Fig. 3 Variation of normalized bending strains with rF in case of 10=V kN for (a) inertial
bending, (b) kinematic bending, (c) total bending, and (d) inelastic region nonH . ( 0=rφ and
001.0=pg EE .)
(a) (b)
(c) (d)
Acta Geotechnica (2010) 5:273–286
xx
0.00.1
0.20.3
0.4 -6
-5
-4
-3
0.0
0.1
0.2
0.3
0.4
ε p/γ
s
log(
Fr )
a/H
0.00.1
0.20.3
0.4 -6
-5
-4
-3
0.0
0.1
0.2
0.3
0.4
ε p/γ
s
log(
Fr )
a/H
0.00.1
0.20.3
0.4 -6
-5
-4
-3
0.0
0.1
0.2
0.3
0.4
ε p/γ
s
log(
Fr )
a/H
0.00.1
0.20.3
0.4 -6
-5
-4
-3
0
5
10
15
20
Hno
n(m)
log(
Fr )
a/H
Fig. 4 Variation of normalized bending strains with rF in case of 1000=V kN for (a) inertial
bending, (b) kinematic bending, (c) total bending, and (d) inelastic region nonH . ( 0=rφ and
001.0=pg EE .)
(a) (b)
(c) (d)
Acta Geotechnica (2010) 5:273–286
xxi
0.05
0.10
0.100.15
0.15
0.20
0.25
0.30
0.35
0.40
0.45
0.50
0.1 0.2 0.3-6
-5
-4
Local Minima
log(
Fr)
a/H
0.05
0.10
0.10
0.15
0.20
0.25
0.30
0.35
0.40
0.45
0.50
0.1 0.2 0.3-6.0
-5.5
-5.0
-4.5
-4.0
-3.5
log(
Fr)
a/H
Fig. 5 Comparison of contours of normalized bending strains with rF in cases of (a) 10=V kN
and (b) 1000=V kN ( 0=rφ and 001.0=pg EE .)
(a) (b)
Acta Geotechnica (2010) 5:273–286
xxii
0.00.1
0.20.3
0.4 -6
-5
-4
-3
0.0
0.1
0.2
0.3
0.4
ε p/γ
s
log(
Fr )
a/H
0.00.1
0.20.3
0.4 -6
-5
-4
-3
0.0
0.1
0.2
0.3
0.4
ε p/γ
s
log(
Fr )
a/H
0.00.1
0.20.3
0.4 -6
-5
-4
-3
0.0
0.1
0.2
0.3
0.4
ε p/γ
s
log(
Fr )
a/H
0.00.1
0.20.3
0.4 -6
-5
-4
-3
0
5
10
15
20
Hno
n (m
)
log(
Fr )
a/H
Fig. 6 Variation of normalized bending strains with rF in case of 01.0=sγ for (a) inertial
bending, (b) kinematic bending, (c) total bending, and (d) inelastic region nonH . ( 0=rφ and
001.0=pg EE .)
(a) (b)
(c) (d)
Acta Geotechnica (2010) 5:273–286
xxiii
0.0 0.1 0.2 0.3 0.40.0
0.1
0.2
0.3
0.4
Kinematic Bending
Inertial Bending
V=10kN V=100kN V=1000kN
ε p/γ S
a/H0.0 0.1 0.2 0.3 0.4
0.0
0.1
0.2
0.3
0.4
φr= - π
φr= 0
φr= - π/2
V=10kN V=100kN V=1000kN
ε p/γ S
a/H
0.00.1
0.20.3
0.4 -3
-2
-1
0
0.0
0.1
0.2
0.3
0.4
ε p/γ
s
φr (r
ad)
a/H
0.00.1
0.20.3
0.4 -3
-2
-1
0
0.0
0.1
0.2
0.3
0.4ε p
/γs
φr (r
ad)
a/H
0.00.1
0.20.3
0.4 -3
-2
-1
0
0
5
10
15
20
Hno
n (m
)
φr (r
ad)
a/H
0.00.1
0.20.3
0.4 -3
-2
-1
0
0
5
10
15
20
Hno
n (m
)
φr (r
ad)
a/H
(a) (b)
(e) (f)
(c) (d)
Acta Geotechnica (2010) 5:273–286
xxiv
Fig. 7 Variation of normalized bending strains with rφ for (a) individual bending; and (b) total
bending in cases of (c, e) 10=V kN and (d, f) 1000=V kN. ( 5100.1 −×=rF and
001.0=pg EE .)
Acta Geotechnica (2010) 5:273–286
xxv
0.00.1
0.20.3
0.4 -4
-3
-2
0.0
0.1
0.2
0.3
0.4
ε p/γ
s
log(
E g/E p
)
a/H
0.00.1
0.20.3
0.4 -4
-3
-2
0.0
0.1
0.2
0.3
0.4
ε p/γ
s
log(
E g/E p
)
a/H
0.00.1
0.20.3
0.4 -4
-3
-2
0.0
0.1
0.2
0.3
0.4
ε p/γ
s
log(
E g/E p
)
a/H
0.00.1
0.20.3
0.4 -4
-3
-2
0
5
10
15
20
Hno
n (m
)
log(
E g/E p
)
a/H
Fig. 8 Variation of normalized bending strains with pg EE in case of 10=V kN for (a) inertial
bending, (b) kinematic bending, (c) total bending, and (d) inelastic region nonH . ( 5100.1 −×=rF
and 0=rφ .)
(a) (b)
(c) (d)
Acta Geotechnica (2010) 5:273–286
xxvi
0.00.1
0.20.3
0.4 -4
-3
-2
0.0
0.1
0.2
0.3
0.4
ε p/γ
s
log(
E g/E p
)
a/H
0.00.1
0.20.3
0.4 -4
-3
-2
0.0
0.1
0.2
0.3
0.4
ε p/γ
s
log(
E g/E p
)
a/H
0.00.1
0.20.3
0.4 -4
-3
-2
0.0
0.1
0.2
0.3
0.4
ε p/γ
s
log(
E g/E p
)
a/H
0.00.1
0.20.3
0.4 -4
-3
-2
0
5
10
15
20
Hno
n (m
)
log(
E g/E p
)
a/H
Fig. 9 Variation of normalized bending strains with pg EE in case of 1000=V kN for (a)
inertial bending, (b) kinematic bending, (c) total bending, and (d) inelastic region nonH .
( 5100.1 −×=rF and 0=rφ .)
(a) (b)
(c) (d)
Acta Geotechnica (2010) 5:273–286
xxvii
0.05
0.10
0.15
0.15
0.20
0.20
0.25
0.25
0.30
0.30
0.35
0.40
0.1 0.2 0.3-4
-3
-2
Local Minima
log(
Eg/E
p )
a/H
0.050.10
0.15
0.15
0.20
0.20
0.25
0.30
0.35
0.40
0.45
0.50
0.1 0.2 0.3-4
-3
-2
log(
Eg/E
p )
a/H
Fig. 10 Comparison of contours of normalized bending strains with pg EE in cases of (a)
10=V kN and (b) 1000=V kN( 5100.1 −×=rF and 0=rφ .)
(a) (b)
Acta Geotechnica (2010) 5:273–286
xxviii
-6 -5 -4 -30.00
0.02
0.04
0.06
0.08
0.10
Linear V=10kN V=100kN V=1000kN
a/H
opt.
log Fr
-6 -5 -4 -30.00
0.02
0.04
0.06
0.08
0.10
Linear V=10kN V=100kN V=1000kN
a/H
opt.
log Fr
-6 -5 -4 -30.00
0.02
0.04
0.06
0.08
0.10
Linear V=10kN V=100kN V=1000kN
a/H
opt.
log Fr
-6 -5 -4 -30.00
0.02
0.04
0.06
0.08
0.10
Linear V=10kN V=100kN V=1000kN
a/H
opt.
log Fr
-6 -5 -4 -30.00
0.02
0.04
0.06
0.08
0.10
Linear V=10kN V=100kN V=1000kN
a/H
opt.
log Fr
-6 -5 -4 -30.00
0.02
0.04
0.06
0.08
0.10
Linear V=10kN V=100kN V=1000kN
a/H
opt.
log Fr
-6 -5 -4 -30.00
0.02
0.04
0.06
0.08
0.10
Linear V=10kN V=100kN V=1000kN
a/H
opt.
log Fr
-6 -5 -4 -30.00
0.02
0.04
0.06
0.08
0.10
Linear V=10kN V=100kN V=1000kN
a/H
opt.
log Fr
-6 -5 -4 -30.00
0.02
0.04
0.06
0.08
0.10
Linear V=10kN V=100kN V=1000kN
a/H
opt.
log Fr
(a) (b) (c)
(d) (e) (f)
(g) (h) (i)
0=rφ
2πφ −=r
0=rφ 0=rφ
2πφ −=r 2πφ −=r
πφ −=r πφ −=r πφ −=r
Fig. 11 Variation of optimal pile radius with rF for various amplitudes of lateral load V and
different phase lags. (a, d, g) 0005.0=pg EE ; (b, e, h) 001.0=pg EE ; (c, f, i) 005.0=pg EE .
Acta Geotechnica (2010) 5:273–286
xxix
-6 -5 -4 -30.00
0.02
0.04
0.06
0.08
0.10
Linear γs=1.0x10⁻⁴
γs=1.0x10⁻³
γs=1.0x10⁻²
a/H
opt.
log Fr
-6 -5 -4 -30.00
0.02
0.04
0.06
0.08
0.10
Linear γs=1.0x10⁻⁴
γs=1.0x10⁻³
γs=1.0x10⁻²a/
Hop
t.
log Fr
-6 -5 -4 -30.00
0.02
0.04
0.06
0.08
0.10
Linear γs=1.0x10⁻⁴
γs=1.0x10⁻³
γs=1.0x10⁻²
a/H
opt.
log Fr
-6 -5 -4 -30.00
0.02
0.04
0.06
0.08
0.10
Linear γs=1.0x10⁻⁴
γs=1.0x10⁻³
γs=1.0x10⁻²
a/H
opt.
log Fr
-6 -5 -4 -30.00
0.02
0.04
0.06
0.08
0.10
Linear γs=1.0x10⁻⁴
γs=1.0x10⁻³
γs=1.0x10⁻²
a/H
opt.
log Fr
-6 -5 -4 -30.00
0.02
0.04
0.06
0.08
0.10
Linear γs=1.0x10⁻⁴
γs=1.0x10⁻³
γs=1.0x10⁻²
a/H
opt.
log Fr
-6 -5 -4 -30.00
0.02
0.04
0.06
0.08
0.10
Linear γs=1.0x10⁻⁴
γs=1.0x10⁻³
γs=1.0x10⁻²
a/H
opt.
log Fr
-6 -5 -4 -30.00
0.02
0.04
0.06
0.08
0.10
Linear γs=1.0x10⁻⁴
γs=1.0x10⁻³
γs=1.0x10⁻²
a/H
opt.
log Fr
-6 -5 -4 -30.00
0.02
0.04
0.06
0.08
0.10
Linear γs=1.0x10⁻⁴
γs=1.0x10⁻³
γs=1.0x10⁻²
a/H
opt.
log Fr
(a) (b) (c)
(d) (e) (f)
(g) (h) (i)
0=rφ
2πφ −=r
0=rφ 0=rφ
2πφ −=r 2πφ −=r
πφ −=r πφ −=r πφ −=r
Fig. 12 Variation of optimal pile radius with rF for various amplitudes of mean shear strain sγ
and different phase lags. (a, d, g) 0005.0=pg EE ; (b, e, h) 001.0=pg EE ; (c, f,
i) 005.0=pg EE .
Acta Geotechnica (2010) 5:273–286
xxx
-6.0 -5.5 -5.0 -4.5 -4.0 -3.5 -3.0-4.0
-3.5
-3.0
-2.5
-2.0
Bound
ary S
howing
Opti
mal Rad
ius
unde
r Elas
tic C
ondit
ion
105%
110%
120%
140%
130%
120%
110%
V-Lines G-Lines
0.080.070.060.050.040.03
105%
log Fr
log
(Eg/E
p)
a/Hopt=0.02
-6.0 -5.5 -5.0 -4.5 -4.0 -3.5 -3.0-4.0
-3.5
-3.0
-2.5
-2.0
Bound
ary Sho
wing O
ptimal
Radius
unde
r Elas
tic C
ondit
ion
120%
110%
105%
130%
120%
110%
105%
0.090.080.070.060.050.040.03
log
(Eg/E
p)
log Fr
a/Hopt=0.02
-6.0 -5.5 -5.0 -4.5 -4.0 -3.5 -3.0-4.0
-3.5
-3.0
-2.5
-2.0
Bound
ary S
howing
Opti
mal Rad
ius
unde
r Elas
tic C
ondit
ion
120%
110%
105%
130%
120%
110%
105%
log
(Eg/E
p)
log Fr
0.090.080.070.060.050.040.03a/Hopt=0.02
Fig. 13 Criteria for evaluating the increment of slenderness ratios Ha that minimizes normalized bending strains at the head of a fixed-head pile with pg EE and rF when kinematic interaction dominates in soil-pile-structure systems under local nonlinearity in soil [(a) 0=rφ , (b)
2πφ −=r , (c) 43πφ −=r ].
(a)
(b)
(c)