effect of human settlement and altitude on rangeland herbaceous species biodiversity and...
TRANSCRIPT

Journal of Environment and Earth Science www.iiste.org
ISSN 2224-3216 (Paper) ISSN 2225-0948 (Online)
Vol.4, No.15, 2014
108
Effect of Human Settlement and Altitude on Rangeland
Herbaceous Species Biodiversity and Productivity in Kafta-
Humera Woreda, Tigray, Ethiopia
Teame G/Hiwot1 Tessema Zewdu
2 Emiru Birhane
3
1.Adigrat University, College of Agriculture and Environmental Science, Ethiopia
2.Haramaya University, College of Agriculture, Ethiopia
3.Mekele University, College of Agriculture and Natural Recourses
*Corresponding Author: [email protected]
Abstract
This research was conducted in Kafta-Humera districts of the Northern Ethiopia with the objective to determine
the effect of human settlement on rangeland productivity and biodiversity under three altitudinal ranges (600-
1000, >1000-1400 and >1400-1800 m.a.s.l.) and along three distance intervals near (0-2 km), middle (2-4 km)
and far (4-6 km) from settlement. Vegetation and soil data was analyzed by Statistical Package for Social
Sciences. In the study districts, a total of 39, 30 and 15 species of grasses, forbs and herbaceous legumes species
were identified, respectively. Species diversity and species richness in higher altitude were significantly higher
than middle and lower altitudes. Species diversity and species richness were lower near to settlement than far
distance from settlement. Grass biomass of near, middle and far distance from settlement were 113.59, 622 and
1102.56 kg ha-1
respectively. Similarly, grass biomasses of the low, middle and upper altitude were 349.8, 542.7
and 945.7 kg ha-1
, respectively. Far distance from settlement had significantly higher in organic matter, available
phosphorus and available potassium than middle and near distance from settlement. The upper altitude had
significantly higher in organic matter, available phosphorus and available potassium than the lower and middle
altitude. Generally, the study area was highly dominated by the annual herbaceous species. This implies that
there is undergoing reduction in soil quality, biodiversity and productivity degradation. Therefore, appropriate
plan of soil and biodiversity conservation such as establishing, designing and implementations of watershed
management for physical and biological conservation should be planned to minimize loss of biodiversity.
Keywords: Settlement, plant Species composition, plant species abundance, plant Species diversity, biomass
production, basal cover, soil properties
1. Introduction
Settlement is defined as the integrator of human and environmental interactions in pastoral systems (Coppolillo,
2000; 2001). Settlement is done through government policies or natural calamities such as drought and natural
disasters or due to increasing grazing land as the resulted in to concentration of livestock around the settlement
area and water points and ending up with highly plant biodiversity degradation, soil degradation and over
grazing (Jeffrey, 2007).
Settlement in Ethiopia was started during the Haile Selassie regime in the year 1966 (Desalegn, 2003).
During the Military regime, resettlement was strengthened and by the current Ethiopian government has been
considered as a principal strategy (FDRE, 2006).
Kafta-Humera rangeland is one of the vast rangelands in the north western lowland boundary of the country
with area of 160,650 hectares and which has been subjected to varying degrees of disturbance like to vegetation
and soil degradation (Hailesilassie, 1998; Gebrehaweria, 2011). It is important to have basic information on the
effect human migrations from highland to lowland areas on rangeland biomass dynamics, biodiversity, soil
characteristics in particular and rangeland degradation as these facilitate the efficient and effective use of
rangeland resources. Accordingly, for successful livestock production, sustainable resource utilization and
conservation of rangeland biodiversity, knowledge of productivity and biodiversity of the rangeland is important.
Therefore this study was conducted with the follow specific objectives:
• To determine the effect of human settlement on herbaceous species composition, plant abundance and
species diversity under three altitudinal range sand distance away from human settlement in Kafta-
Humera district of northern Ethiopia; and
• To investigate the effect of human settlement on rangeland biomass production and soil characteristics,
as well as percentage of basal cover and bare ground under three altitudinal ranges and distance away
from human settlement in Kafta-Humera district of northern Ethiopia;
2. Materials and Methods
2.1. Description of the Study Area
The study was conducted in Kafta-Humera District of Tigray National Regional State in north-western Ethiopia

Journal of Environment and Earth Science www.iiste.org
ISSN 2224-3216 (Paper) ISSN 2225-0948 (Online)
Vol.4, No.15, 2014
109
(Figure 1).
Figure 1: Location of Kafta-Humera, the study area
Kafta-Humera district is situated in the North West corner of Tigray regional state which is located 954 km north
of Addis Ababa. The District is located between 13040’and 14
027’N, and 36
027’and 37
032’E. It covers an area of
160650 ha and its altitude ranges from 560 to 1849 m.a.s.l. The mean maximum temperature varied from 41.70C
- 330C while the mean minimum temperature varied from 22.2
0C - 17.5
0C. The rainfall ranges from 448.8 -
1102.5 mm (Hailesilassie, 1998; EARO, 2002).
2.2. Methods of Data Collection
Herbaceous species composition, plant abundance, species richness, aboveground biomass, the percentage of
basal and bare ground covers was quantified in 1 m2
quadrat. Five 1m by 1m quadrats were taken randomly
locations per plots and sixty 1 m2
quadrats per distance interval from settlements, a total of 540 numbers of
observations (3 attitudes x 3 distance interval x 60 quadrats) in the study areas. Percentage of basal cover and
bare ground were recorded using visual estimation. Dry matter yield was calculated according to ILCA (1990).
The species diversity, as Shannon diversity and species evenness was calculated according to Shannon‐Wiener
diversity index (Magurran, 2004). Species composition similarity among distance interval was estimated by the
model Jaccard coefficient of similarity using the present or absent of species according to Krebs (1998). Three
composite soil samples in each distance interval under each altitudinal ranges were pooled and yielding a total of
27 soil samples.
2.3. Statistical Analysis
Ordination of sampling sites under the three altitude and three distance intervals from settlements was done by
multivariate techniques, using Conoco (Ter Braak, 1997). Ordination species was done by a Principal
Component Analysis (PCA). In addition, the correlations of soil parameters with the herbaceous species were
done using a Redundancy Analysis (RDA).
The diversity indices for herbaceous vegetation, plant abundance of each species and species evenness data were
estimated using PAST software (Koleff et al., 2003).
To test differences in species diversity, plant abundance, basal and bare ground covers, soil characteristics
and biomass production, a General Linear Model (GLM) was applied using SPSS software (version.16) with
altitude, distance from settlement and their interaction as independent factors. Moreover, Jaccard coefficient of
similarity (Magurran, 2004) was used to test the differences on similarities in species compositions along
altitudinal ranges and distance from settlement. Tukey multiple comparison was used to test significant
differences among the means.
3. Results and Discussion
3.1. Herbaceous species
3.1.1. Herbaceous species composition and functional groups
A total of 84 herbaceous species were identified in the study area. The number of grass, herbaceous legumes and
forbs were 39 (46%), 15 (18%) and 30 (36%), respectively (Table 1). Out of these 39 grass species 25 (64%)
were identified as annual species whereas 14 (35.6%) were perennial grass species. The ordination result showed
a clear separation of the 9 sampling sites for the herbaceous species, as the three altitudinal ranges are separately
clustered from each other in Kafta-Humera rangelands (Figure 2a), indicating each altitudinal range was
different in terms of herbaceous species composition. The first and the second ordination axis explained

Journal of Environment and Earth Science www.iiste.org
ISSN 2224-3216 (Paper) ISSN 2225-0948 (Online)
Vol.4, No.15, 2014
110
cumulatively 64% of the total variance extracted by the Principal Component Analysis (PCA). Moreover, the
result of the 9 sampling sites x soil parameter using Redundancy Analysis (RDA) showed higher relationships
with herbaceous species on the first and second ordination axes with a correlation coefficient of 0.991 and 0.989,
respectively. The first and second ordination axis explained 53.1 and 75.6% of the total variance extracted by the
RDA, respectively (Figure 2b).
Figure 2: Ordination diagram of the nine sample sites for herbaceous species (a) and sampling sites x soil
parameters for herbaceous (b) under three altitudinal ranges(open circles = low altitude; filled circles = mid
altitude and filled squares = high altitude)
Table 1: List of herbaceous species with their relative abundance (nm-2
), life forms (LF) and functional group
(FG) under three altitudinal rages (m.a.s.l.) three distances (km) away from human settlement in Kafta-Humera
rangelands, northern Ethiopia
Herbaceous species
Altitudinal Ranges
(600-1000) (>1000-1400) (>1400-1800) LF FG
0-2 2-4 4-6 0-2 2-4 2-6 0-2 2-4 4-6
Acanthospermum hispidum 8.5 0 0 39.4 14.7 0 28.3 0 0 F A
Albuca abyssinica 2 0 0 0 0 0 0 0 0 F P
Alysicarpus quartinianus 8.5 0 0 0 8.67 4.5 0 20.5 12 L A
Alysicarpus rugosus 0 0 0 0 0 0 9 15 13.4 L A
Alysicarpus zeyheri 9 7.13 10 5 0 4.8 0 0 0 L P
Andropogon chrysostachyus 11.3 29.1 35.5 12.1 23.4 25 0 39 0 G P
Aristida adoensis 27.2 57.8 80.1 21.6 37.7 87.3 43 119 136.1 G A
Aristida mutabilis 0 6.4 19 0 12.7 13 0 37.6 33 G A
Aritsida adscensionis 15 0 0 0 0 0 0 0 0 G A
Biden spilosa 4.3 11.2 9.1 18.4 9.5 10.9 10.5 15.5 7 F A
Bidens setigera 0 0 0 0 0 0 29.5 6 0 F P
Brachiaria lata 3.8 11.5 5.14 4 5.3 20 5 5 19.3 G P
Brachiariara mosa 1 3.17 6 0 3.5 0 0 0 0 G P
Brassica rapa 7.3 6.5 0 6 8.5 0 0 0 0 F P
Cenchrus ciliaris 0 0 2 0 0 0 0 0 0 G P
Chamaecrista mimosoides 0 0 0 0 0 0 42.4 21 0 L A
Chloris gayana 0 17 0 0 0 0 0 0 0 G P
Citrullus colocynthis 2.6 0 1 0 0 0 0 0 0 F P
Commelina subula 0 0 0 3 0 0 38.4 12.8 2 F A
Commicarpus granddflora 5 0 2 4.3 0 0 0 22 0 F A
Corchorus olitorius 0 0 5 0 0 0 0 0 0 F A
Corchorus trilocularis 41.7 23.9 8.6 24.7 14.2 5.33 0 0 0 F A
Cyanotis barbata 0 0 0 1.5 4 0 0 0 0 L A
Cynodon dayctlon 0 0 7.5 0 18 0 80.7 21.8 0 G P
Cyperus rotundus 4 6.18 9.44 11 11.5 12.5 3 11 7.3 F P
Dactyloctenium aegyptium 0 24.2 51.1 0 37.6 29 24 43.8 55.5 G A
Digitaria ternata 12 21 27.6 13.8 19 15.4 16.1 2.7 32.8 G A
Digitaria velutina 0 9.8 0 0 0 0 0 0 0 G A
Dinebra retroflexa 15.8 15.8 13 24.6 14.2 9.33 10.5 7 18 G A
Discopodium penninervium 2 2.14 1.33 2 0 1 0 0 0 F A
Eleusine floccifolia 0 0 0 0 0 0 33.6 12 0 G A
Eragrostis abyssinica 10.9 7.2 2 0 0 0 0 0 0 G A
Eragrostis cilianensis 10 13.7 27 0 28.6 26 17.2 28 54.7 G A
Eragrostis schweinfurthii 0 0 0 0 0 0 14 42.3 41.7 G A
Euphorbia hirta 7 5 2.25 0 0 3.5 27.7 0 5.3 F A

Journal of Environment and Earth Science www.iiste.org
ISSN 2224-3216 (Paper) ISSN 2225-0948 (Online)
Vol.4, No.15, 2014
111
Euphorbia indica 0 0 0 17.1 15 9.5 40 17 13 F A
Eurochloa fatamensis 0 0 0 0 0 0 24.5 0 0 G A
Flaveria trinervia 14.3 23.2 18.3 19.3 19 16.5 14 24 20.2 F A
Guizotia scabra 0 0 0 0 0 0 3.5 0 0 F A
Hibiscus articulatus 0 0 12.7 0 10.5 6.5 0 0 0 F A
Hibiscus camabinus 9 10.5 8.33 0 0 0 0 0 0 F A
Hygrophilla schulli 0 0 0 0 0 0 48.4 15 7 F P
Hyparrhenia rufa 0 0 20.1 0 42 9.7 11.5 11.3 6 G P
Hypoestes forskalei 0 0 0 3 0 13.5 20 0 15 F A
Hypoestes triflora 0 0 0 4.43 6.3 4.3 0 0 0 F A
Indigofera amorphoides 0 0 0 0 0 0 44 0 0 L P
Indigofera spicata 0 0 0 0 0 0 0 6 14 L P
Indigofera viciodes 6 0 0 0 0 0 0 0 0 L P
Ipomoea purprea 0 14 9.6 0 0 0 0 0 0 F A
Kedrostis foetidissima 0 0 0 51 0 0 0 0 0 F P
Legenaria siceraria 0 0 0 6 0 0 0 0 0 F P
Leucas martinicensis 10.9 9.5 3.91 9 6.43 4 23 0 0 F A
Medicago polymorpha 8.8 4.3 3.2 3.5 4 5.5 2.33 5 4.4 L A
Melanocenchris abyssinica 0 0 0 0 3.2 7.3 0 6.5 19.3 G A
Nicandra physaliades 9 0 0 0 0 0 0 0 9.8 F A
Panicum atrosanguinium 0 15.4 24 0 14.5 37.1 0 33.3 43.9 G A
Panicum coloratum 0 0 8 0 0 17 0 76.3 83.5 G P
Panicum maximum 0 0 11 0 22.7 2.5 0 60.8 73.6 G P
Panicum subalbidum 6 0 0 3 15.2 10.7 14.6 46 35.3 G A
Pennisetum glabrum 2 0 0 0 7.3 6.9 12 34.6 54.1 G P
Pennisetum sphacelatum 6 16 19.3 10.8 25.4 48.3 25.4 71.7 104.8 G P
Polystachya bennettiana 7 4.7 17 11 0 16 0 8 0 F A
Rhamphicarpa fistulosa 0 0 16.8 17 8 0 0 0 0 G P
Rhaynochosia minima 23 14.7 6 37.8 2.7 3 0 0 0 F P
Rottboelia cochinchinensis 0 14 13.3 0 0 0 0 0 0 G A
Schoenefeldia gracilis 7 0 17 0 0 0 0 0 21.5 G A
Senna obtusifolia 77.3 5 0 21.3 0 0 0 0 0 L A
Senna occidentalis 0 0 0 0 21.6 5 0 0 0 L A
Setaria pallid-fusca 6.2 22.5 22.3 8.9 13.5 30.5 17.5 34.8 49 G A
Setaria pumila 0 0 8 7 0 10.5 5.4 9 11 G A
Sorghum arundinaceum 0 0 13.4 0 0 6 0 0 0 G A
Spermacoce sphaerostima 0 0 0 0 0 0 12 32.5 0 G A
Tephrosia interrupta 7 10.3 8.7 11 9.1 12.8 58.8 11 0 L P
Tetrapogon tenellus 0 0 5.56 8 10.7 4 24 16.3 13 G P
Themeda triandria 0 0 18.8 0 26 24 20.2 24.3 14.2 G P
Tiragia cinerea 0 0 14.5 0 12.8 0 0 0 0 L A
Tragus racemosus 0 13 0 0 0 0 0 0 0 G A
Tribulus ternatus 0 9 0 0 0 140 0 0 0 F A
Trifolium mattirolianum 0 5.71 0 41.4 0 .7 0 14 0 L A
Urochloa bracyra 0 0 0 0 0 0 0 22.5 9 G A
Urochloa fatamensis 0 0 14.2 17.8 5 39 23 15.1 22.3 G A
Urochloa panicoides 0 0 0 18 1 0 0 0 0 G A
Xanthium abyssinicum 43 7 2.5 18.2 12.4 2.5 0 0 0 F A
Zennia elegans 0 0 0 0 0 0 34.7 9.6 24.5 L A
Number of species
Grasses species 14 17 26 13 23 22 20 26 22 - -
Perennial grasses 5 6 12 5 11 9 7 9 7 - -
Annual grasses 9 11 14 8 12 13 13 17 15 - -
Legumes 6 5 4 6 6 8 6 8 5 - -
Forbs 17 14 16 18 11 14 11 9 10 - -
Total number of species 37 36 46 37 40 44 37 43 37 - -
Percentage of species
Grasses species 37.8 47.2 56.5 35.1 57.5 50 54.1 60.5 59.5 - -
Perennial grasses 13.5 16.7 26.1 13.5 27.5 20.5 19 20.9 18.9 - -

Journal of Environment and Earth Science www.iiste.org
ISSN 2224-3216 (Paper) ISSN 2225-0948 (Online)
Vol.4, No.15, 2014
112
Annual grasses 24.3 30.5 30.4 21.6 30 29.5 35.1 39.5 40.5 - -
Legumes 16.2 13.9 8.7 16.2 15 18.2 16.2 18.6 13.5 - -
Forbs 46 38.9 34.8 48.7 27.5 31.8 29.7 20.9 27 - -
Total percentage species 100 100 100 100 100 100 100 100 100 - -
A = annual; P = perennial; F = forbs; G = grass; L = legumes; LF = life form; FG = functional group
3.1.2. Herbaceous species diversity and plant abundance
3.1.2.1. The effect of distance on herbaceous species diversity and plant abundance at different altitudinal
ranges
In the lower altitude, herbaceous species evenness, relative plant abundance and richness were significantly
lower near to settlement than the other two distance intervals. This could be related to the presence of heavy
grazing pressures on grass species and replaced by non-grass. Hence, heavy grazing pressure tends to cause grass
species to decline and subsequently replaced by other herbaceous plant (Haan et al., 1997). In the mid altitude,
far distance interval from settlement area had significantly lower in species diversity and evenness but
significantly higher in plant abundance than the other two distance intervals (Table 2). This was in relation to the
A. adoensis grass species which were highly dominated species in far distance from settlement. In the upper
altitude, herbaceous species abundance had significantly increased with distance increased from settlement area
(Table 1).
3.1.2.2. Effect of altitude on herbaceous species diversity and plant abundance
Herbaceous species abundance in the upper altitude was significantly higher than lower and middle altitudes
(Table 2; F2, 531= 109.89, P < 0.000). But species diversity and richness were significantly lower than middle
and lower altitudes (Table 2). This is related to the fact that the species abundance is increasing with altitude
increasing (Admasu et al., 2010).
3.1.2.3. Effect of distance on herbaceous species diversity and plant abundance
Species diversity and species richness were significantly lower near to settlement than far from settlement. This
is related to the fact that plant damage is high around settlement areas due to heavy animal grazing and human
activities (Brinkmann, 2009) and (Jeffrey, 2007) also reported that continuous grazing around permanent
settlement areas causes to lowers plant diversity and favors the spread of unpalatable herbs and shrubs.
Figure 3: Invasive forbs herbaceous species Senna obtusifoli (a) in the lower altitude near to the settlement and
Corchorus trilocularis (b), Xanthium abyssinicum (c) and Rhaynochosia minima (d) in the lower and middle
altitudes near to the settlement in Kafta-Humera, northern Ethiopia.
(a)
)
(b)
(c)
)
(d)

Journal of Environment and Earth Science www.iiste.org
ISSN 2224-3216 (Paper) ISSN 2225-0948 (Online)
Vol.4, No.15, 2014
113
Table 2: Effect of altitudinal ranges (Low altitude: 600-1000, mid altitude: >1000-1400 and high
altitude: >1400-1800 m.a.s.l.) and distances interval away from human settlement (km) on herbaceous species
diversity, species evenness, total plant abundance (nm-2
) and species richness under three altitudinal ranges and
three distance intervals away from settlement in Kafta-Humera, northern Ethiopia.
Shannon diversity Evenness Plant abundance Species richness
Altitudinal ranges
600-1000
0-2 1.137c 0.63
b 109.583
b 5.333
b
2-4 1.322b 0.67b
a 136.367
a 5.933
a
4-6 1.473a 0.735
a 146.367
a 6.2
a
>1000-1400
0-2 1.25a 0.8
a 118.67
b 5.467
a
2-4 1.515a 0.78
a 117.25
b 5.967
a
4-6 1.242b 0.678
b 152.0.67
a 5.50
a
>1400-1800
0-2 1.183a 0.756
a 165.1
c 4.6
a
2-4 1.197a 0.728
a 195.95
b 4.67
a
4-6 1.117a 0.718
a 239.133
a 4.52
a
Altitude (A)
F (df = 2,531 ) 25.42 13.18 109.89 45.88
P 0.000 0.000 0.000 0.000
Distance (D)
F (df = 2,531 ) 4.28 1.01 41.54 4.15
P 0.014 0.36 0.000 0.016
(A) * (D)
F (df = 4,531 ) 13.18 11.70 3.27 2.08
P 0.000 0.000 0.012 0.025
Adjusted R2 0.162 0.111 0.364 0.161
Df = degree of freedom, F-ratio = F test value, P = probability value, A = Altitude, D = Distance. Means with the
same letter in columns are not significantly different at P ≤ 0.05
3.1.3. Effect of altitude and distance on biomass of herbaceous species.
In all altitude ranges grass biomass had significantly increasing with distance from settlement increasing (Fig. 4a;
F2,531 = 552.04, P< .000), Whereas, non-grass biomass had significantly decreasing with distance from settlement
increasing (Fig. 4b; F2,531 = 399.18, P < 0.000). This result could be related to the decreasing of animal grazing
pressures and human activities on plant damaged with increased distance from settlements. This finding
conforms to the reports of (Brinkmann 2009). Grass standing biomass had highly significant increasing with
altitude increasing (from low to high altitudes) (Fig. 4a; F2,531 = 208.63, P< 0.000), whereas non grass standing
biomass had highly significantly decreasing with altitude increasing (Fig. 4b; F2,531 = 22.24, P < 0.000). This
result was supported by (Amsalu 2002; Gemedo 2005).
Figure 4: Effect of altitude (Low altitude: 600-1000, mid altitude: (>1000-1400 and high altitude: >1400-1800
m.a.s.l) and distances from human settlement on grass biomass (a) and non-grass biomass (b) in Kafta-Humera,
northern Ethiopia
(a) (b)
Journal of Environment and Earth Science www.iiste.org
ISSN 2224-3216 (Paper) ISSN 2225-0948 (Online)
Vol.4, No.15, 2014
114
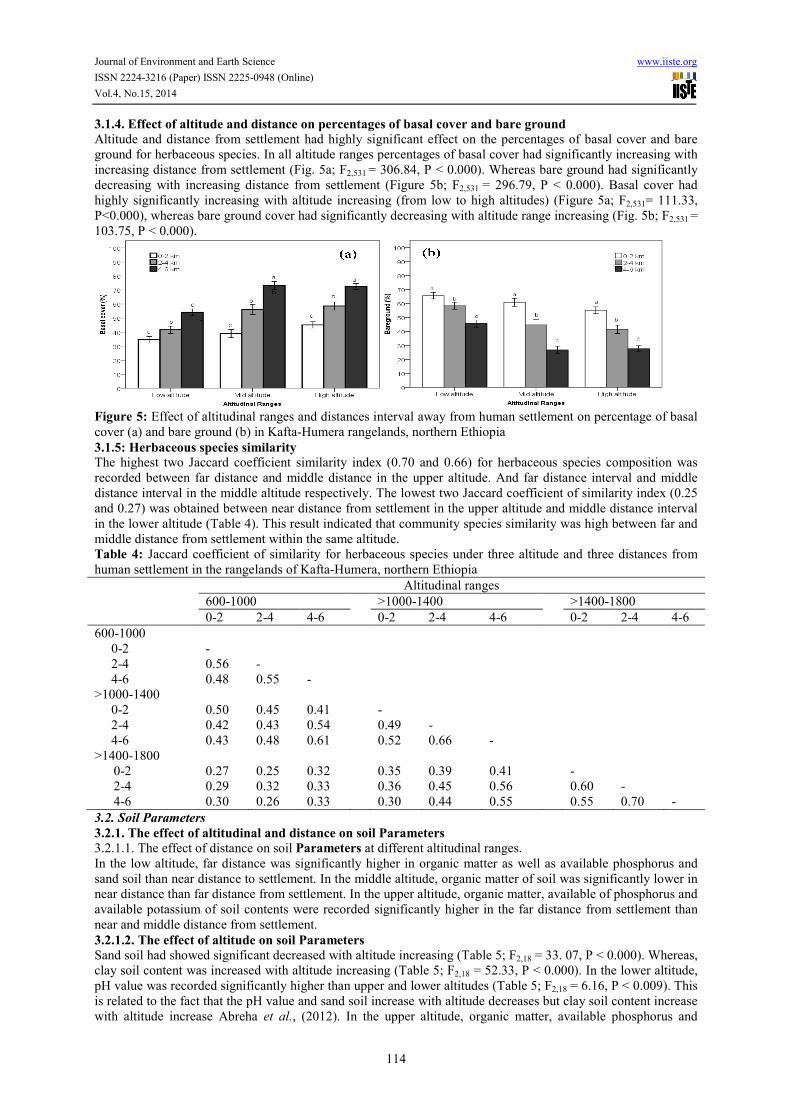
3.1.4. Effect of altitude and distance on percentages of basal cover and bare ground
Altitude and distance from settlement had highly significant effect on the percentages of basal cover and bare
ground for herbaceous species. In all altitude ranges percentages of basal cover had significantly increasing with
increasing distance from settlement (Fig. 5a; F2,531 = 306.84, P < 0.000). Whereas bare ground had significantly
decreasing with increasing distance from settlement (Figure 5b; F2,531 = 296.79, P < 0.000). Basal cover had
highly significantly increasing with altitude increasing (from low to high altitudes) (Figure 5a; F2,531= 111.33,
P<0.000), whereas bare ground cover had significantly decreasing with altitude range increasing (Fig. 5b; F2,531 =
103.75, P < 0.000).
Figure 5: Effect of altitudinal ranges and distances interval away from human settlement on percentage of basal
cover (a) and bare ground (b) in Kafta-Humera rangelands, northern Ethiopia
3.1.5: Herbaceous species similarity
The highest two Jaccard coefficient similarity index (0.70 and 0.66) for herbaceous species composition was
recorded between far distance and middle distance in the upper altitude. And far distance interval and middle
distance interval in the middle altitude respectively. The lowest two Jaccard coefficient of similarity index (0.25
and 0.27) was obtained between near distance from settlement in the upper altitude and middle distance interval
in the lower altitude (Table 4). This result indicated that community species similarity was high between far and
middle distance from settlement within the same altitude.
Table 4: Jaccard coefficient of similarity for herbaceous species under three altitude and three distances from
human settlement in the rangelands of Kafta-Humera, northern Ethiopia
Altitudinal ranges
600-1000 >1000-1400 >1400-1800
0-2 2-4 4-6 0-2 2-4 4-6 0-2 2-4 4-6
600-1000
0-2 -
2-4 0.56 -
4-6 0.48 0.55 -
>1000-1400
0-2 0.50 0.45 0.41 -
2-4 0.42 0.43 0.54 0.49 -
4-6 0.43 0.48 0.61 0.52 0.66 -
>1400-1800
0-2 0.27 0.25 0.32 0.35 0.39 0.41 -
2-4 0.29 0.32 0.33 0.36 0.45 0.56 0.60 -
4-6 0.30 0.26 0.33 0.30 0.44 0.55 0.55 0.70 -
3.2. Soil Parameters
3.2.1. The effect of altitudinal and distance on soil Parameters
3.2.1.1. The effect of distance on soil Parameters at different altitudinal ranges.
In the low altitude, far distance was significantly higher in organic matter as well as available phosphorus and
sand soil than near distance to settlement. In the middle altitude, organic matter of soil was significantly lower in
near distance than far distance from settlement. In the upper altitude, organic matter, available of phosphorus and
available potassium of soil contents were recorded significantly higher in the far distance from settlement than
near and middle distance from settlement.
3.2.1.2. The effect of altitude on soil Parameters
Sand soil had showed significant decreased with altitude increasing (Table 5; F2,18 = 33. 07, P < 0.000). Whereas,
clay soil content was increased with altitude increasing (Table 5; F2,18 = 52.33, P < 0.000). In the lower altitude,
pH value was recorded significantly higher than upper and lower altitudes (Table 5; F2,18 = 6.16, P < 0.009). This
is related to the fact that the pH value and sand soil increase with altitude decreases but clay soil content increase
with altitude increase Abreha et al., (2012). In the upper altitude, organic matter, available phosphorus and

Journal of Environment and Earth Science www.iiste.org
ISSN 2224-3216 (Paper) ISSN 2225-0948 (Online)
Vol.4, No.15, 2014
115
available potassium had significant higher as compared to other two altitude ranges. This is supported by the
finding of Getachew et al., (2007) in Borana rangelands, Ethiopia.
3.2.1.3. The effect of distance on soil Parameters In near distance interval to settlement, sand soil content had showed significantly higher than far distance
interval from settlement (Table 5; F2,18 = 3.65, P < 0.047). This result may be related to the high degree of soil
erosion, high grazing pressures and human activities near distance interval to settlement than far distance interval
from settlement. Organic matter and organic carbon had significant increased with distance interval increased
from settlement. In far distance interval from settlement, available phosphorus and potassium were recorded
significantly higher than that of the near and middle distance intervals from settlement. The total nitrogen
percentage near to settlement has not shown significant difference from the other two distance intervals but it
was significant difference between middle and far distances intervals away from settlement area (Table 5).
Percentage of nitrogen had significantly higher in far distance interval from settlement than middle distances
interval from settlement (Table 5; F2,18 = 4.97, P < 0.019).
Table 5: Effect of altitudinal ranges and distance interval away from settlements (km) on physical and chemical
soil Parameters in Kafta-Humera rangelands, northern Ethiopia
pH OC (%) OM
(%)
AVP.ppm AVK.ppm TN
(%)
Sand
(%)
Silt
(%)
Clay
(%)
Mean
Altitude (m.a.s.l)
600-1000
0-2 7.45a 1.06
b 1.83
b 0.61
b 1.42
a 0.09
a 53.33
a 16.33
b 30.33
a
2-4 7.22a 1.50
ba 2.58
ba 0.99
ba 1.43
a 0.08
a 48.67
ba 26.67
a 24.67
a
4-6 7.09a 2.10
a 3.62
a 1.28
a 1.96
a 0.10
a 42.00
b 27.00
a 31.00
a
>1000-1400
0-2 6.86a 0.95
b 1.64
b 0.92
a 1.57
a 0.163
a 45.67
a 22.33
a 32.00
a
2-4 6.73a 1.34
ba 2.32
ba 0.95
a 1.78
a 0.129
a 36.33
a 16.33
a 47.33
a
4-6 6.60a 2.03
a 3.51
a 1.22
a 2.34
a 0.269
a 28.67
a 23.33
a 48.00
a
>1400-1800
0-2 6.87a 1.59
b 2.75
b 1.44
b 1.87
b 0.210
a 17.67
a 21.33
a 61.00
a
2-4 6.71a 1.77
b 3.06
b 1.09
b 2.41
b 0.206
a 20.67
a 18.33
a 61.00
a
4-6 6.53a 2.57
a 4.44
a 2.10
a 3.39
a 0.311
a 16.33
a 23.00
a 60.67
a
Altitude (A)
F (df
=2,18)
6.16 10.43 10.52 19.07 25.95 14.32 33.07 1.47 52.33
p 0.009 0.001 0.001 0.000 0.000 0.000 0.000 0.255 0.000
Distance (D)
F (df
=2,18),
1.66 35.97 36.21 18.17 25.98 4.97 3.65 4.03 1.50
p 0.219 0.000 0.000 0.000 0.000 0.019 0.047 0.036 0.25
(A) * (D)
F (df
=4,18),
0.02 0.22 0.23 3.75 2.44 0.99 0.85 4.35 2.38
p 0.999 0.922 0.92 0.022 0.084 0.441 0.513 0.012 0.09
Adjusted
R2
0.23 0.767 0.769 0.758 0.802 0.57 0.726 0.44 0.807
OC = Organic carbon; OM = Organic matter; AVP = Available phosphorus; AVK = Available potassium; TN =
Total nitrogen.
Means with the same letters in columns are not significantly different at P ≤ 0.05
5. Conclusion
We concluded that a reduction in soil quality parameters was observed as a direct effect of distance from
settlement and altitudes in the rangelands of Kafta-Humera, northern Ethiopia and this consequently affected the
growth, diversity, abundance, aboveground standing biomass and basal cover of herbaceous species. Annual
herbaceous species were higher than perennials. Relative abundance of grass species were increased with
increasing distance from settlement whereas, forbs were decreased with distance increased from settlements.
Vegetation resources which recorded near to settlement and middle distance from settlement had been degraded
Journal of Environment and Earth Science www.iiste.org
ISSN 2224-3216 (Paper) ISSN 2225-0948 (Online)
Vol.4, No.15, 2014
116
as a result of decrease in grass cover through replacing of non grasses species. Areas which were found near to
settlement exposed to soil erosion and have increased due to grass cover removal. In general, declining grass
cover and its substitution with annual type of vegetation was the outcomes of the recent settlements. Therefore,
under the present soil status, biodiversity and productivity circumstances of the areas near to settlement and
middle distance intervals from settlement, preservation or return of habitats should be of greater concern because
the best way to minimize biodiversity loss is to maintain the integrity of ecosystem function.
Reference
Abreha K, Heluf G, Tekalign M and Kibebew K (2012). Impact of altitude and land use type on some physical
and chemical properties of acidic soils in Tsegede highlands, Northern Ethiopia. Journal of Earth and
Environmental Science, 2 (3): 223-223.
Admasu T, Abule E and Tessema Z (2010). Rangeland dynamics in South Omo Zone of Southern Ethiopia.
Assessment of rangeland condition in relation to altitude and Grazing types. 22p. vailable online on
www.lrrd.org/lrrd22/10/tref22187. Date of access 15/8/2012
Amsalu S and R.M.T. Baars (2002). Grass composition and rangeland condition of the major grazing areas in the
mid rift valley, Ethiopia. Africa Journal Range and Forage Science, 9: 161-166.
Brinkman (2009). Vegetation patterns and diversity along an altitude and grazing gradient in the Jabal al Akhdar
Mountain range of northern Oman. Journal of Arid Environments, 73: 1035- 1045.
Coppolillo P (2000). The lands escape ecology of pastoral ecosystems. Journal of Applied Ecology, 23: 573-583.
Coppolillo P (2001). Central place analyzing and modeling of land scope scale resources use in East Africa
agropastoral system. Journal of Landscape Ecology, 16: 205-219.
Desalegn R (2003). “Resettlement in Ethiopia: The tragedy of population relocation in the 1980s‟.” Forum for
Social Studies Discussion, Paper No. 11. Addis Ababa: Forum for Social Studies.
EARO (Ethiopia Agricultural Research Organization) (2002). Dry land Agriculture Research Strategic Planning
Document. Addis Ababa, Ethiopia. 66p. Ecosystem Processes, pp. 1–30. Berlin: Springer.
FDRE (Federal Democratic Republic of Ethiopia) (2006). Agriculture Policies, Programs and Targets for a Plan
for Accelerated and Sustainable Development to End Poverty (PASDEP), 2005/06 - 2009/10. Ministry
of Agriculture and Rural Development, Addis Ababa, Ethiopia.
Gebrehaweria K (2011). Pastoralists’ perception, vegetation diversity and condition assessment in rangelands of
kafta-humera woreda, tigray regional state, ethiopia M.Sc. Thesis Presented to the School of Graduate
Studies of Haramaya University, Ethiopia. 128p.
Gemedo D, Brigitte M and Johannes I (2005). Plant Biodiversity and Ethnobotany of Borana Pastoralists in
Southern Oromia, Ethiopia. Journal of Economic Botany, 59 (1): 43–65.
Getashew H, Mohammed A and Abule E (2007). Effects of rangeland management on soil characteristics of
Yabello rangelands, Southern Ethiopia. Ethiopian Journal of Natural Resources, 9(1): 19-35.
Hailesilassie A (1998). Present Land Use and Land Cover of Kafta- Humera District Western Zone.Mekelle,
Bureau of Agriculture and Natural Resources Development Land Use Team.
Jeffrey S (2007). Fragmentation and settlement patterns in Maasai land. Implications for pastoral mobility,
drought vulnerability and wild life conservation in East Africa savanna. In partial fulfillment of the
requirements for the degree of doctor of Philosophy Colorado state University, for Collins, Colorad.
Koleff P, Gaston K and Lennon J (2003). Measuring beta diversity for presence-absence data. Journal of Animal
Ecology, 72:367-382.
Krebs (1998). Ecological methodology, University of British Colombia.2th ed. British Publishing.
Magurran A (2004). Measuring Biological Diversity, First published by Blackwell Science Company, USA.
Ter Braak C (1997). CANOCO a FORTRAN program for canonical community ordination by [partial]
[detrended] canonical] correspondence analysis, principal component analysis and redundancy analysis
(version 4.15). Institute of Applied Computer Science, 95, Wageningen, Netherlands.
The IISTE is a pioneer in the Open-Access hosting service and academic event
management. The aim of the firm is Accelerating Global Knowledge Sharing.
More information about the firm can be found on the homepage:
http://www.iiste.org
CALL FOR JOURNAL PAPERS
There are more than 30 peer-reviewed academic journals hosted under the hosting
platform.
Prospective authors of journals can find the submission instruction on the
following page: http://www.iiste.org/journals/ All the journals articles are available
online to the readers all over the world without financial, legal, or technical barriers
other than those inseparable from gaining access to the internet itself. Paper version
of the journals is also available upon request of readers and authors.
MORE RESOURCES
Book publication information: http://www.iiste.org/book/
IISTE Knowledge Sharing Partners
EBSCO, Index Copernicus, Ulrich's Periodicals Directory, JournalTOCS, PKP Open
Archives Harvester, Bielefeld Academic Search Engine, Elektronische
Zeitschriftenbibliothek EZB, Open J-Gate, OCLC WorldCat, Universe Digtial
Library , NewJour, Google Scholar