effect of corneal thickness on the agreement between ultrasound and orbscan ii pachymetry
TRANSCRIPT
Effect of corneal thickness on the agreementbetween ultrasound and Orbscan II pachymetry
Hassan Hashemi, MD, Maryam Roshani, Shiva Mehravaran, MD, Hiva Parsafar, MD,Kamran Yazdani, MD, MPH
PURPOSE: To study the agreement between ultrasound (US) and Orbscan II (Bausch & Lomb)measurements with different ranges of central thickness in normal corneas.
SETTING: Noor Ophthalmology Research Center, Tehran, Iran.
METHODS: The central corneal thickness was measured first by the Orbscan II and then with a USpachymeter in 177 right eyes. Data were compared in 3 thickness groups: less than 500 mm, 500 to600 mm, and more than 600 mm. In all cases, uncorrected Orbscan II data were used. For eachrange, a correction factor was calculated through regression analysis, which was then used ina new set of analyses. To study the agreement between the 2 methods, the 95% limits of agreement(LoA) and intraclass correlations coefficients (ICC) were determined.
RESULTS: The mean interdevice difference was 2.7 G 16.9 (SD) in the less than 500 mm group(P Z .365), 21.3 G 3.1 in the 500 to 600 mm group (P Z .0001), and 27.2 G 20.9 in the morethan 600 mm group (P Z .0001). No clinically acceptable LoA were found in any group. The appli-cation of regression equations to the Orbscan II readings improved the agreement in the less than500 mm group better than the other 2 groups. The ICC was 0.76, 0.61, and 0.43 in the less than500 mm, 500 to 600 mm, and more than 600 mm groups, respectively.
CONCLUSIONS: The Orbscan corneal thickness readings had relatively lower validity than US mea-surements. The 2 devices should not be used interchangeably, especially when the validity of themeasurement is vital. In patient screening for corneal surgery, it is advisable to recheck cornealthickness with a US pachymeter.
J Cataract Refract Surg 2007; 33:1694–1700 Q 2007 ASCRS and ESCRS
ARTICLE
The popularity of refractive surgery has increased theimportance of accurate corneal thickness measure-ments. Preoperative assessment of central cornealthickness (CCT) is a requisite to ensure patient eligibil-ity in terms of a sufficient corneal thickness for a safe
Accepted for publication May 27, 2007.
From Noor Ophthalmology Research Center (Hashemi, Mehravaran,Yazdani), and Farabi Eye Hospital (Hashemi), the School ofMedicine (Roshani), and the Department of Epidemiology and Bio-statistics, School of Public Health (Yazdani), Tehran University ofMedical Sciences, and Imam Hussein Hospital (Parsafar), ShahidBeheshti University of Medical Sciences, Tehran, Iran.
No author has a financial or proprietary interest in any material ormethod mentioned.
Corresponding author: Shiva Mehravaran, MD, Noor Ophthalmol-ogy Research Center, Noor Eye Hospital, Number 106 EsfandiarBoulevard, Vali’asr Avenue, Tehran, 19686-53111, Iran. E-mail:[email protected].
Q 2007 ASCRS and ESCRS
Published by Elsevier Inc.
1694
correction and an acceptable residual thickness to re-duce the risk for iatrogenic ectasia.1,2 Pachymetersare generally based on ultrasound (US) or optical tech-nologies.3 The most commonly used devices are USpachymeters, which are also recognized as the goldstandard for performing CCTmeasurements.4–6 How-ever, in this technique, a probe must come in contactwith the corneal surface. This requires local anesthesiaand is associated with the risk for infection.7,8 Otherdisadvantages of the technique are the probability ofmisalignment, variations in placing the probe in re-peated measurements, and corneal indentation bythe probe.9,10 Also, US measurements are affected bythe fluctuations in corneal tissue hydration. For thesereasons, use of noncontact methodswith an acceptableaccuracy has been suggested.11
The Orbscan topography system (Bausch & Lomb)uses a computerized slit-scanning method to imagethe anterior and posterior corneal surfaces and a fullcorneal pachymetry map in a noncontact acquisition
0886-3350/07/$dsee front matter
doi:10.1016/j.jcrs.2007.05.036
1695ULTRASOUND AND ORBSCAN II AGREEMENT BY CORNEAL THICKNESS RANGES
that takes fewer than 2 seconds.12–14 Although highlyrepeatable,2,15–17 the validity of its corneal thicknessreadings compared with US measurements is a matterof debate.
Results in initial comparative studies showed thatthe Orbscan overestimated CCT up to approximately30 mm5,11,14,18; thus, the use of acoustic equivalent cor-rection factors was suggested to make the Orbscanreadings more comparable to US readings. The Orbs-can II software allows users to apply such an acousticfactor to corneal thicknessmeasurements displayed bythe system, and the value recommended by the manu-facturer is 0.92.
Gonzalez-Meijome et al.19 measured and comparedthe CCT and peripheral corneal thickness at equal dis-tances from the center. They found that a differentequation was required for each measured point. Otherstudies suggest using a different correction factor forcorneas that are thin postoperatively8,20 and perform-ing further studies of the validity of the Orbscancorneal thickness measurements in thin and thickcorneas.21
Our experience and published reports hint that theOrbscan II tends to underestimate the CCT in thinnercorneas, whether normal, keratoconic,22,23 or after la-ser refractive surgery,24 and generates overestimatedreadings in thicker corneas. This study was designedto determine the effect of corneal thickness on theagreement between the Orbscan II and US measure-ments in unoperated eyes. We also tried to determinewhether any correction factor could provide accept-able validity for Orbscan II measurements, especiallyin corneas thinner or thicker than normal.
PATIENTS AND METHODS
Prospectively, in a stratified sampling approach, 177 patientsadmitted to Noor Vision Correction Center were enrolled in1 of 3 groups based on corneal thickness: less than 500 mm(thin corneas), 500 to 600 mm (medium corneas), and morethan 600 mm (thick corneas). Exclusion criteria were a historyof ocular surgery, history of ocular trauma causing apparentdamage to the corneal surface, very poor cooperation, cor-neal haze, keratoconus, and use of a soft contact lens in thepast 3 days or a hard contact lens in the past 3 weeks.
Central Corneal Thickness Measurement
The central thickness was measured in all corneas at least3 hours after waking, first with the noncontact Orbscan IIand then with the US method. The same technician per-formed measurements in each patient on the same day,and readings in the right eyes were recorded.
With the Orbscan II, after proper positioning, patientswere instructed to focus on the red blinking light in frontof them. The slits were adjusted, and an acquisition wasmade. During acquisition, 40 slits were projected andscanned over the cornea, each providing 240 data pointsfrom the anterior and posterior corneal surfaces. The corneal
J CATARACT REFRACT SUR
thickness was computed for every corneal point from the el-evation difference between the 2 surfaces. In this study, onlycentral readings were collected without applying an acousticequivalent correction factor.
For US measurements, the cornea was anesthetized withtetracaine 0.5% eyedrops, and the sterilized probe wasplaced on the cornea as perpendicularly as possible. Fiveconsecutive measurements were generated, the mean ofwhich was used in the analysis.
Statistical Analysis
The Kolmogorov-Smirnov test was used to confirm thenormal distribution of data sets (PO.05). Mean interdevicedifferences were determined through paired t tests in eachgroup and in all eyes. The Pearson correlation coefficientand regression coefficient between the mean Orbscan IIand US readings and their differences were calculated. Theinterdevice agreement was determined by the method de-scribed by Bland and Altman,25 differences between pairedmeasurements were plotted against their means, and 95%limits of agreement (LoA) were calculated. Intraclass correla-tion coefficients (ICC) were used to assess the level of agree-ment as described by Fleiss and Cohen.26 To interpret thedegree of agreement, the guidelines provided by Landisand Koch27 (Table 1) were used.
Regression analysis was used to determine regressionequations: Ultrasound CCT Z (Orbscan II CCT � slope) Cintercept. The equation obtained in each group was appliedto that group’s Orbscan II data as the acoustic equivalent cor-rection factor to derive corrected readings, after which the in-terdevice difference and agreement analyses were repeated.Results are expressed as mean G standard deviation (SD)based on a significance level of !.05.
Table 1. Interpretation of ICC into level of agreement.
ICC Interpretation
1.00 Perfect agreement0.99 to 0.81 Almost perfect agreement0.80 to 0.61 Substantial agreement0.60 to 0.41 Moderate agreement0.40 to 0.21 Fair agreement0.20 to 0.01 Slight agreement0.00 to �0.10 Poor agreement
ICC Z intraclass correlation coefficient
Table 2. Details of study participants grouped by CCT.
Number(Men:Women)
Age (Y)
CCT Mean G SD (Range)
!500 mm 31 (9:22) 29.3 G 5.5 (19–39)500–600 mm 115 (45:70) 30.3 G 8.7 (18–54)O600 mm 31 (12:19) 28.0 G 8.5 (19–53)
CCT Z central corneal thickness
G - VOL 33, OCTOBER 2007
1696 ULTRASOUND AND ORBSCAN II AGREEMENT BY CORNEAL THICKNESS RANGES
RESULTS
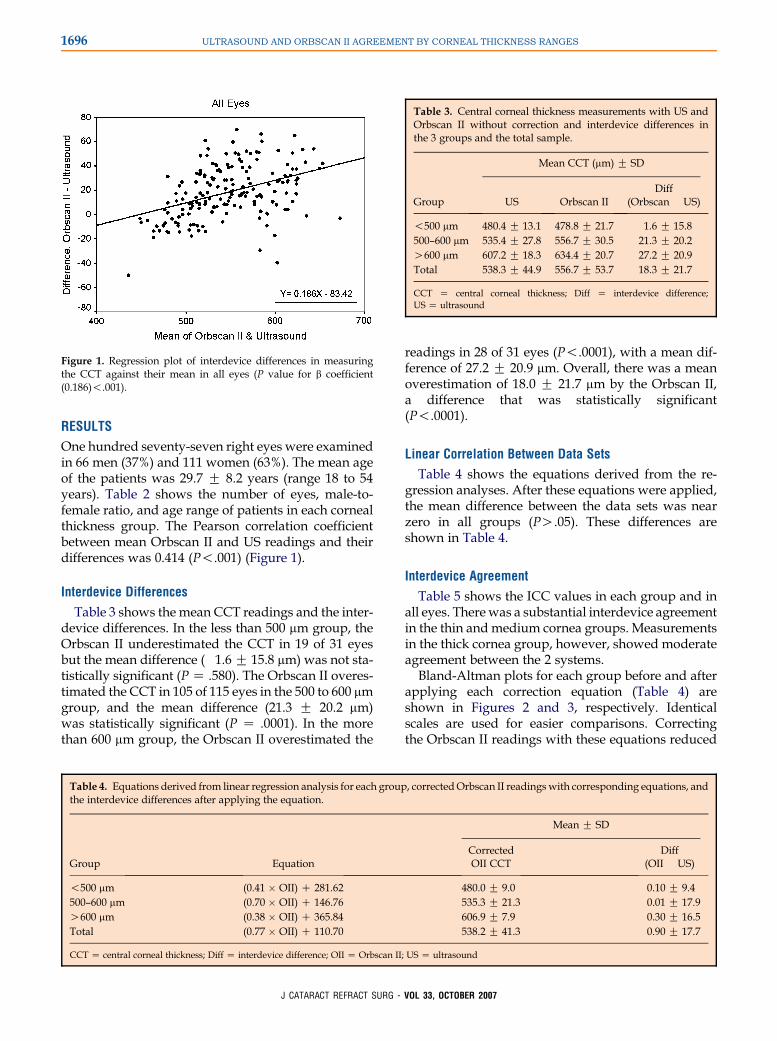
One hundred seventy-seven right eyes were examinedin 66 men (37%) and 111 women (63%). The mean ageof the patients was 29.7 G 8.2 years (range 18 to 54years). Table 2 shows the number of eyes, male-to-female ratio, and age range of patients in each cornealthickness group. The Pearson correlation coefficientbetween mean Orbscan II and US readings and theirdifferences was 0.414 (P!.001) (Figure 1).
Interdevice Differences
Table 3 shows the mean CCT readings and the inter-device differences. In the less than 500 mm group, theOrbscan II underestimated the CCT in 19 of 31 eyesbut the mean difference (�1.6 G 15.8 mm) was not sta-tistically significant (P Z .580). The Orbscan II overes-timated the CCT in 105 of 115 eyes in the 500 to 600 mmgroup, and the mean difference (21.3 G 20.2 mm)was statistically significant (P Z .0001). In the morethan 600 mm group, the Orbscan II overestimated the
Figure 1. Regression plot of interdevice differences in measuringthe CCT against their mean in all eyes (P value for b coefficient(0.186)!.001).
J CATARACT REFRACT SUR
readings in 28 of 31 eyes (P!.0001), with a mean dif-ference of 27.2 G 20.9 mm. Overall, there was a meanoverestimation of 18.0 G 21.7 mm by the Orbscan II,a difference that was statistically significant(P!.0001).
Linear Correlation Between Data Sets
Table 4 shows the equations derived from the re-gression analyses. After these equations were applied,the mean difference between the data sets was nearzero in all groups (PO.05). These differences areshown in Table 4.
Interdevice Agreement
Table 5 shows the ICC values in each group and inall eyes. There was a substantial interdevice agreementin the thin and medium cornea groups. Measurementsin the thick cornea group, however, showed moderateagreement between the 2 systems.
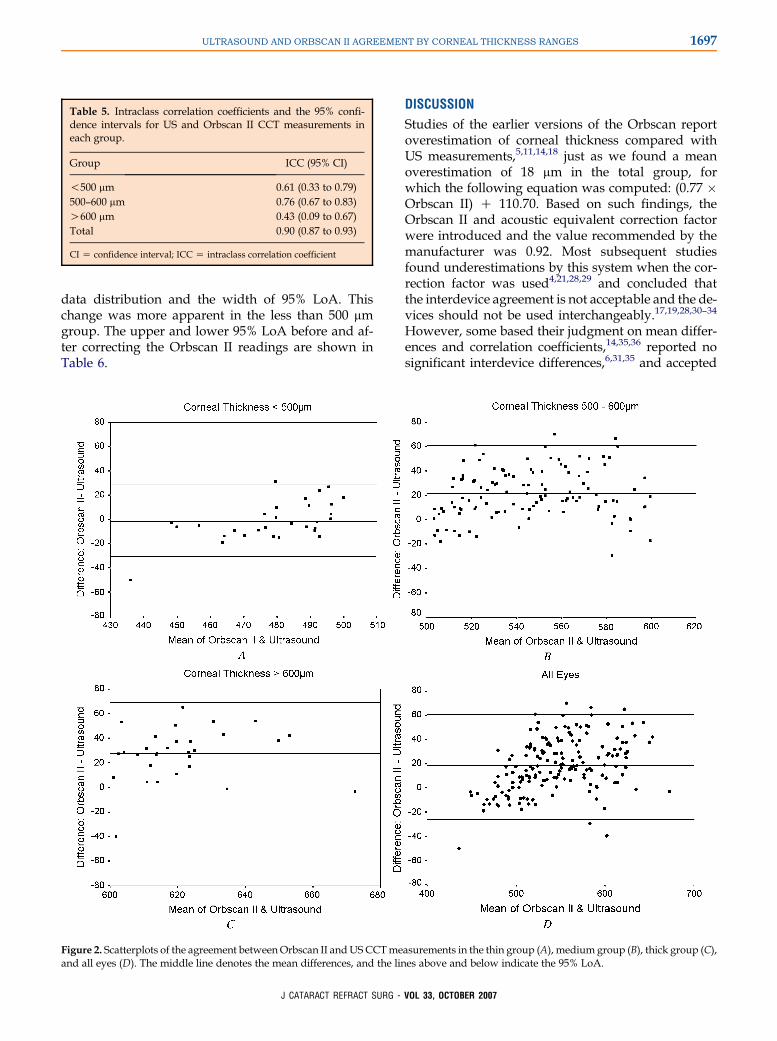
Bland-Altman plots for each group before and afterapplying each correction equation (Table 4) areshown in Figures 2 and 3, respectively. Identicalscales are used for easier comparisons. Correctingthe Orbscan II readings with these equations reduced
Table 3. Central corneal thickness measurements with US andOrbscan II without correction and interdevice differences inthe 3 groups and the total sample.
Mean CCT (mm) G SD
Group US Orbscan IIDiff
(Orbscan � US)
!500 mm 480.4 G 13.1 478.8 G 21.7 �1.6 G 15.8500–600 mm 535.4 G 27.8 556.7 G 30.5 21.3 G 20.2O600 mm 607.2 G 18.3 634.4 G 20.7 27.2 G 20.9Total 538.3 G 44.9 556.7 G 53.7 18.3 G 21.7
CCT Z central corneal thickness; Diff Z interdevice difference;US Z ultrasound
Table 4. Equations derived from linear regression analysis for each group, correctedOrbscan II readingswith corresponding equations, andthe interdevice differences after applying the equation.
Mean G SD
Group EquationCorrectedOII CCT
Diff(OII � US)
!500 mm (0.41 � OII) C 281.62 480.0 G 9.0 �0.10 G 9.4500–600 mm (0.70 � OII) C 146.76 535.3 G 21.3 �0.01 G 17.9O600 mm (0.38 � OII) C 365.84 606.9 G 7.9 �0.30 G 16.5Total (0.77 � OII) C 110.70 538.2 G 41.3 �0.90 G 17.7
CCT Z central corneal thickness; Diff Z interdevice difference; OII Z Orbscan II; US Z ultrasound
G - VOL 33, OCTOBER 2007
1697ULTRASOUND AND ORBSCAN II AGREEMENT BY CORNEAL THICKNESS RANGES
data distribution and the width of 95% LoA. Thischange was more apparent in the less than 500 mmgroup. The upper and lower 95% LoA before and af-ter correcting the Orbscan II readings are shown inTable 6.
Table 5. Intraclass correlation coefficients and the 95% confi-dence intervals for US and Orbscan II CCT measurements ineach group.
Group ICC (95% CI)
!500 mm 0.61 (0.33 to 0.79)500–600 mm 0.76 (0.67 to 0.83)O600 mm 0.43 (0.09 to 0.67)Total 0.90 (0.87 to 0.93)
CI Z confidence interval; ICC Z intraclass correlation coefficient
J CATARACT REFRACT SU
DISCUSSION
Studies of the earlier versions of the Orbscan reportoverestimation of corneal thickness compared withUS measurements,5,11,14,18 just as we found a meanoverestimation of 18 mm in the total group, forwhich the following equation was computed: (0.77 �Orbscan II) C 110.70. Based on such findings, theOrbscan II and acoustic equivalent correction factorwere introduced and the value recommended by themanufacturer was 0.92. Most subsequent studiesfound underestimations by this system when the cor-rection factor was used4,21,28,29 and concluded thatthe interdevice agreement is not acceptable and the de-vices should not be used interchangeably.17,19,28,30–34
However, some based their judgment on mean differ-ences and correlation coefficients,14,35,36 reported nosignificant interdevice differences,6,31,35 and accepted
Figure 2. Scatterplots of the agreement betweenOrbscan II andUS CCTmeasurements in the thin group (A), medium group (B), thick group (C),and all eyes (D). The middle line denotes the mean differences, and the lines above and below indicate the 95% LoA.
RG - VOL 33, OCTOBER 2007
1698 ULTRASOUND AND ORBSCAN II AGREEMENT BY CORNEAL THICKNESS RANGES
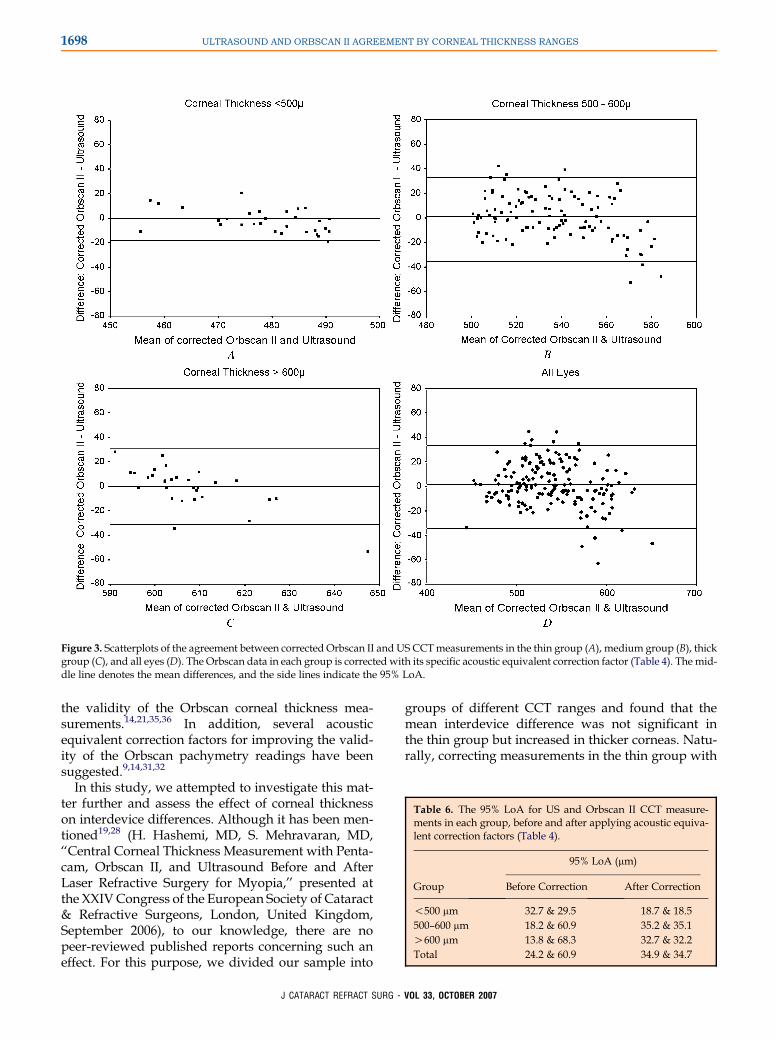
Figure 3. Scatterplots of the agreement between corrected Orbscan II and US CCTmeasurements in the thin group (A), medium group (B), thickgroup (C), and all eyes (D). The Orbscan data in each group is corrected with its specific acoustic equivalent correction factor (Table 4). The mid-dle line denotes the mean differences, and the side lines indicate the 95% LoA.
the validity of the Orbscan corneal thickness mea-surements.14,21,35,36 In addition, several acousticequivalent correction factors for improving the valid-ity of the Orbscan pachymetry readings have beensuggested.9,14,31,32
In this study, we attempted to investigate this mat-ter further and assess the effect of corneal thicknesson interdevice differences. Although it has been men-tioned19,28 (H. Hashemi, MD, S. Mehravaran, MD,‘‘Central Corneal Thickness Measurement with Penta-cam, Orbscan II, and Ultrasound Before and AfterLaser Refractive Surgery for Myopia,’’ presented atthe XXIVCongress of the European Society of Cataract& Refractive Surgeons, London, United Kingdom,September 2006), to our knowledge, there are nopeer-reviewed published reports concerning such aneffect. For this purpose, we divided our sample into
J CATARACT REFRACT SURG
groups of different CCT ranges and found that themean interdevice difference was not significant inthe thin group but increased in thicker corneas. Natu-rally, correcting measurements in the thin group with
Table 6. The 95% LoA for US and Orbscan II CCT measure-ments in each group, before and after applying acoustic equiva-lent correction factors (Table 4).
95% LoA (mm)
Group Before Correction After Correction
!500 mm �32.7 & 29.5 �18.7 & 18.5500–600 mm �18.2 & 60.9 �35.2 & 35.1O600 mm �13.8 & 68.3 �32.7 & 32.2Total �24.2 & 60.9 �34.9 & 34.7
- VOL 33, OCTOBER 2007
1699ULTRASOUND AND ORBSCAN II AGREEMENT BY CORNEAL THICKNESS RANGES
an equation proper for the thick group would lead togreat underestimations. This may, to some extent, ex-plain the Orbscan II underestimations after ablativeprocedures, as reported in the above-mentionedpresentation.
In addition, we determined the interdevice agree-ment in each group by computing the ICC and 95%LoA; results were indicative of lower agreement inmeasurements of thicker corneas. However, the rangeof data can affect the ICC. In this study, the ICC for thetotal may have been overrated because of the widerange in the total sample population, while in thegroup of thick corneas, the low ICC may be attribut-able to the small range of values.
To compare levels of agreement expressed in 95%LoA, it would be easier to consider the width of theselimits. For example, according to the information inTable 6, the width of the 95% LoA was 62.2 mm(�32.7 to 29.5) in thin corneas, 79.1 mm (�18.2 to60.9) in medium corneas, and 82.1 mm (�13.8 to 68.3)in thick corneas. This means the agreement is worstwith thick corneas and the difference between theOrbscan II CCT measurements and their US pairsmay range from an underestimation of 13.8 mm to anoverestimation of 68.3 mm in 95% of cases. The remain-ing 5% may even have differences beyond this range.Such differences are not acceptable because a differ-ence as little as 10 mm can lead to a different treatmentplan.
In the next step, the correction factor for each rangeof thickness was calculated and applied to the Orbscandata and the analyses were repeated with correcteddata. As expected, the mean difference in all 3 groupschanged to near zero and the levels of agreementimproved. To be more precise, the width of the95% LoA decreased as much as 25 mm in thin corneas,9 mm in medium corneas, and 17 mm in thick corneas,leaving widths of 37 mm, 70 mm, and 65 mm, respec-tively. One could reason that the agreement did not ac-ceptably improve. However, a practical advantage ofusing correction factors is that the ranges of expecteddifferences lie symmetrically along the zero axis. Forinstance, if the CCT reading is 550 mm and we usethe bottom equation in Table 4, there is a 95% chancethat the acoustic equivalent is 550 G 35 mm becausethe 95% LoA for this correction factor are �35 mmand 35 mm.
Overestimations and underestimations were seennot only in the total sample but also in each separategroup. However, rates varied in different groups; theOrbscan II underestimated the CCT in 19.8% of the to-tal 177 corneas, 61.0% in the thin group, 11.0% in themedium group, and 9.7% in the thick group. Applyinga correction factor evens out the distribution (ie, evensrates of overestimation and underestimation) rather
J CATARACT REFRACT SUR
than reduces the variability. This means a simple lin-ear transformation is not sufficient to achieve inter-changeable data.
Further studies withmore samples in the higher andlower ranges of corneal thickness are needed to inves-tigate this issue in more detail, as are studies of the ac-curacy of US pachymeters. In the meantime, these 2devices should not be used interchangeably andwhen the accuracy of the measurement is vital ora reading is borderline for proceedingwith a particularprocedure, it is advisable to recheck the corneal thick-ness with a US pachymeter.
REFERENCES1. Marsich MM, Bullimore MA. The repeatability of corneal thick-
ness measures. Cornea 2000; 9:792–795
2. Bechmann M, Thiel MJ, Neubauer AS, et al. Central corneal
thickness measurement with a retinal optical coherence tomog-
raphy device versus standard ultrasonic pachymetry. Cornea
2001; 20:50–54
3. Javaloy J, Vidal MT, Villada JR, et al. Comparison of four corneal
pachymetry techniques in corneal refractive surgery. J Refract
Surg 2004; 20:29–34
4. Iskander NG, Anderson Penno E, Peters NT, et al. Accuracy of
Orbscan pachymetry measurements and DHG ultrasound
pachymetry in primary laser in situ keratomileusis and LASIK
enhancement procedures. J Cataract Refract Surg 2001;
27:681–685
5. Chakrabarti HS, Craig JP, Brahma A, et al. Comparison of cor-
neal thickness measurements using ultrasound and Orbscan
slit-scanning topography in normal and post-LASIK eyes. J Cat-
aract Refract Surg 2001; 27:1823–1828
6. Gherghel D, Hosking SL, Mantry S, et al. Corneal pachymetry in
normal and keratoconic eyes: Orbscan II versus ultrasound.
J Cataract Refract Surg 2004; 30:1272–1277
7. Drexler W, Baumgartner A, Findl O, et al. Submicrometer preci-
sion biometry of the anterior segment of the human eye. Invest
Ophthalmol Vis Sci 1997; 38:1304–1313
8. Kawana K, Tokunaga T, Miyata K, et al. Comparison of corneal
thickness measurements using Orbscan II, non-contact specu-
lar microscopy, and ultrasonic pachymetry in eyes after laser
in situ keratomileusis. Br J Ophthalmol 2004; 88:466–468
9. Solomon OD. Corneal indentation during ultrasonic pachometry.
Cornea 1999; 18:214–215
10. Tam ES, Rootman DS. Comparison of central corneal thickness
measurements by specular microscopy, ultrasound pachyme-
try, and ultrasound biomicroscopy. J Cataract Refract Surg
2003; 29:1179–1184
11. Yaylali V, Kaufman SC, Thompson HW. Corneal thickness mea-
surements with the Orbscan Topography System and ultrasonic
pachymetry. J Cataract Refract Surg 1997; 23:1345–1350
12. Nissen J, Hjortdal JØ, Ehlers N, et al. A clinical comparison of
optical and ultrasonic pachometry. Acta Ophthalmol (Copenh)
1991; 69:659–663
13. Samapunphong S, Azar D. Placido- and elevation-based cor-
neal topography; a review. Ophthalmol Clin North Am 1998;
11(3):311–329
14. Liu Z, Huang AJ, Pflugfelder SC. Evaluation of corneal thickness
and topography in normal eyes using the Orbscan corneal
topography system. Br J Ophthalmol 1999; 83:774–778
15. Lackner B, Schmidinger G, Pieh S, et al. Repeatability and re-
producibility of central corneal thickness measurement with
G - VOL 33, OCTOBER 2007
1700 ULTRASOUND AND ORBSCAN II AGREEMENT BY CORNEAL THICKNESS RANGES
Pentacam, Orbscan, and ultrasound. Optom Vis Sci 2005;
82:892–899
16. FamH-B,LimK-L,ReinsteinDZ.Orbscanglobalpachymetry;anal-
ysis of repeated measures. Optom Vis Sci 2005; 82:1047–1053
17. Jonuscheit S, Doughty MJ. Regional repeatability measures of
corneal thickness: Orbscan II and ultrasound. Optom Vis Sci
2007; 84:52–58
18. Modis L Jr, Langenbucher A, Seitz B. Corneal thickness mea-
surements with contact and noncontact specular microscopic
and ultrasonic pachymetry. Am J Ophthalmol 2001; 132:517–
521
19. Gonzalez-Meijome JM, Cervino A, Yebra-Pimentel E,
Parafita MA. Central and peripheral corneal thickness measure-
ment with Orbscan II and topographical ultrasound pachymetry.
J Cataract Refract Surg 2003; 29:125–132
20. Cheng ACK, Tang E, Mohamed S, Lam DSC. Correction factor
in Orbscan II in the assessment of corneal pachymetry. Cornea
2006; 25:1158–1161
21. Rainer G, Petternel V, Findl O, et al. Comparison of ultrasound
pachymetry and partial coherence interferometry in the mea-
surement of central corneal thickness. J Cataract Refract Surg
2002; 28:2142–2145
22. Kawana K, Miyata K, Tokunaga T, et al. Central corneal thick-
ness measurements using Orbscan II scanning slit topogra-
phy, noncontact specular microscopy, and ultrasonic
pachymetry in eyes with keratoconus. Cornea 2005; 24:967–
971
23. Haque S, Simpson T, Jones L. Corneal and epithelial thickness
in keratoconus: a comparison of ultrasonic pachymetry, Orbs-
can II, and optical coherence tomography. J Refract Surg
2006; 22:486–493
24. Cheng ACK, Rao SK, Tang E, Lam DSC. Pachymetry assess-
ment with Orbscan II in postoperative patients with myopic
LASIK. J Refract Surg 2006; 22:363–366
25. Bland JM, Altman DG. Statistical methods for assessing agree-
ment between two methods of clinical measurement. Lancet
1986; 1:307–310
26. Fleiss JL, Cohen J. The equivalence of weighted kappa and the
intraclass correlation coefficient as measures of reliability. Educ
Psychol Meas 1973; 33:613–619
J CATARACT REFRACT SURG
27. Landis JR, Koch GG. The measurement of observer agreement
for categorical data. Biometrics 1977; 33:159–174
28. Giraldez Fernandez MJ, Diaz Rey A, Cervino A,
Yebra-Pimentel E. A comparison of two pachymetric systems:
slit-scanning and ultrasonic. CLAO J 2002; 28:221–223
29. Prisant O, Calderon N, Chastang P, et al. Reliability of pachy-
metric measurements using Orbscan after excimer refractive
surgery. Ophthalmology 2003; 110:511–515
30. Cho P, Cheung SW. Central and peripheral corneal thickness
measured with the TOPCON specular microscope SP-2000P.
Curr Eye Res 2000; 21:799–807
31. Suzuki S, Oshika T, Oki K, et al. Corneal thickness measure-
ments: scanning-slit corneal topography and noncontact specu-
lar microscopy versus ultrasonic pachymetry. J Cataract Refract
Surg 2003; 29:1313–1318
32. Hashemi H, Yazdani K, Mehravaran S, Fotouhi A. Central cor-
neal thickness measurement with Orbscan II and an ultrasound
pachymeter. J Iran Soc Ophthalmol 2004; 4(17):1–9
33. Fishman GR, Pons ME, Seedor JA, et al. Assessment of central
corneal thickness using optical coherence tomography. J Cata-
ract Refract Surg 2005; 31:707–711
34. Basmak H, Sahin A, Yildirim N. The reliability of central corneal
thickness measurements by ultrasound and by Orbscan system
in schoolchildren. Curr Eye Res 2006; 31:569–575
35. Fakhry MA, Artola A, Belda JI, et al. Comparison of corneal pa-
chymetry using ultrasound and Orbscan II. J Cataract Refract
Surg 2002; 28:248–252
36. Wong AC-M, Wong C-C, Yuen NS-Y, Hui S-P. Correlational
study of central corneal thickness measurements on Hong
Kong Chinese using optical coherence tomography, Orbscan
and ultrasound pachymetry. Eye 2002; 16:715–721
First author:Hassan Hashemi, MD
Noor Ophthalmology Research Center,Noor Eye Hospital, Tehran, Iran
- VOL 33, OCTOBER 2007