effect of benthic-pelagic coupling on dissolved organic carbon concentrations in permeable sediments...
TRANSCRIPT

Continental Shelf Research 45 (2012) 116–125
Contents lists available at SciVerse ScienceDirect
Continental Shelf Research
0278-43
http://d
n Corr
E-m
mhuett
journal homepage: www.elsevier.com/locate/csr
Research papers
Effect of benthic-pelagic coupling on dissolved organic carbon concentrationsin permeable sediments and water column in the northeasternGulf of Mexico
Lindsay Chipman a, Markus Huettel a,n, Matthias Laschet b
a Department of Earth, Ocean and Atmospheric Science, Florida State University, Tallahassee, FL 32306-4320, USAb U.S. Fish and Wildlife Service, Panama City, FL 32405, USA
a r t i c l e i n f o
Article history:
Received 11 September 2011
Received in revised form
21 June 2012
Accepted 25 June 2012Available online 1 July 2012
Keywords:
DOC
Permeable sediment
Benthic-pelagic coupling
Gulf of Mexico coastal sand
Seasonal dynamics
Sedimentary chlorophyll
43/$ - see front matter & 2012 Elsevier Ltd. A
x.doi.org/10.1016/j.csr.2012.06.010
esponding author. Tel.: þ1 850 645 1394; fax
ail addresses: [email protected] (L. Chipman),
[email protected] (M. Huettel), Matthias_Laschet@fw
a b s t r a c t
Large areas of the continental shelf are covered by permeable sand beds that filter substantial volumes
of coastal water. This study investigated the temporal changes in and coupling between dissolved
organic carbon (DOC) concentrations in the water column and pore water of nearshore permeable
sediments in the northeastern Gulf of Mexico. Time series samples, collected in the nearshore
environments at an exposed and a nearby protected site, showed very similar patterns of sedimentary
DOC concentrations at both sites indicating that large-scale, seasonal, and weather-related processes
controlled these distributions. A summer situation, with the sediment surface layer depleted in DOC
and upward diffusion of recalcitrant DOC from deeper layers, was separated by a fall transition phase,
where increasing winds and waves caused a mixing of the sedimentary DOC, resulting in relatively even
concentrations over the investigated sediment depth (0–12 cm). The subsequent winter situation was
characterized by increased DOC in the surface layer caused by filtration of degradable organic material
into the sands and subsurface removal of degradable DOC. A second transition phase in early spring
marked the end of the winter situation, with strong winds and waves and thorough pore water mixing,
leading again to even DOC distribution in the investigated sediment layer. This transition phase
initiated the next summer situation with depletion of DOC in the sediment surface layers. Our results
indicate that DOC in the upper layer (r12 cm) of the shallow sands is controlled by benthic-pelagic
coupling facilitated by relatively rapid solute and particle exchange in the highly permeable sediments
at our study sites. The prompt responses of the surface layer DOC concentrations to the changes in the
overlying water underline the dynamic character of substrate supply in the permeable sediments,
setting them apart from fine-grained cohesive beds characterized by relatively stable DOC distributions.
& 2012 Elsevier Ltd. All rights reserved.
1. Introduction
Dissolved organic carbon (DOC), one of the most abundant andmost mobile forms of non-gaseous carbon, is an important vector fororganic matter, and due to its abundance, a central factor in theglobal carbon cycle (Hansell and Carlson, 2002; Hedges et al., 1997).Most DOC in the deep ocean is highly refractory with turnover timesof approximately 6000 years (Williams and Druffel, 1987), while inthe surface ocean, labile and refractory components of DOC coexist,with polysaccharides comprising a major fraction of the labile DOC(Benner et al., 1992). The most important source of DOC in marineenvironments is phytoplankton, and large amounts of carbohydratesare released in the form of exopolymers (EPS) during growth and
ll rights reserved.
: þ1 850 644 2581.
s.gov (M. Laschet).
degradation (Biddanda and Benner, 1997). As nutrient levels reachhigh concentrations in the coastal zone, phytoplankton and asso-ciated dissolved organic matter (DOM) concentrations typicallyincrease rapidly with decreasing water depth (Hopkinson et al.,1997; Hopkinson and Fry, 1994). Wetz et al. (2008) showed that onaverage 41% of phytoplankton-derived DOM was degraded within3 days in Oregon continental shelf waters. In the shallow shelf,microphytobenthos activities add to the DOC pool through theexcretion of exopolymers (EPS) (Haynes et al., 2007; Lundkvistet al., 2007). This EPS contains high concentrations of water-solublecolloidal carbohydrates and provides a valuable food source forbacteria (Haynes et al., 2007; Middelburg et al., 2000).
In contrast to the deep ocean, where the labile fraction of thedissolved organic matter is degraded in the water column,relatively large amounts of highly degradable DOM reach or areproduced by the shelf sediments. About 70% of these sedimentsare composed of relict sands (Emery, 1968), characterized by arelatively high hydraulic conductivity (Wilson et al., 2008).

L. Chipman et al. / Continental Shelf Research 45 (2012) 116–125 117
Pressure gradients caused by waves and bottom currents pumpwater with particulate and dissolved organic matter into andthrough the surface layer of these sand beds (Huettel et al., 2007;Precht and Huettel, 2004). Chipman et al. (2010) demonstrated incolumn reactor experiments that the sedimentary microbialcommunity can efficiently degrade and remove DOM that isfiltered through the sand. As the filtration of this DOC dependson the boundary layer hydrodynamics and primary productivity,a seasonal dependency of the DOC concentrations and distribu-tion in the shelf sands can be expected with broad implicationsfor the shelf sediment biogeochemical processes.
Despite the high concentrations of DOC in the coastal zone, thefunction of permeable sediments and shallow shelf processes inthe cycles of dissolved organic matter is not well understood. Thisstudy investigates the DOC dynamics in highly permeable near-shore sediments and the associated DOC concentrations in theoverlying water at a monthly temporal resolution. The objectiveswere to (1) determine major temporal and spatial patterns in theDOC distributions in the permeable nearshore sediment affectedby pore water filtration and (2) to assess the influence of benthicpelagic coupling on sedimentary DOC concentrations. The work-ing hypothesis was that the DOC distribution and fluxes in thesehighly permeable sand sediments are tightly coupled to theoverlying water DOC concentrations.
2. Methods
2.1. Study sites
Our investigations took place at two contrasting sites at St.George Island in the northeastern Gulf of Mexico (Fig. 1). The GulfSite (29141017300N, -084147033700W) is located on the ocean side ofthe barrier island and is more exposed, whereas the Bay Site(29139098900N, -084152013900W) is situated on the ApalachicolaBay side of the island, and is protected from the open ocean. Thebay is about 40 km long and 7 km wide, with an average waterdepth of 3 m (Huang and Spaulding, 2002). During the study,water temperatures at the Gulf Site ranged from 131 to 30 1C andfrom 111 to 31 1C at the Bay Site. Salinities were lower at the BaySite (17–32) than at the Gulf Site (33–36) reflecting the influenceof Apalachicola River inflow into the Bay (Mortazavi et al., 2000a).Mean tidal range in this area is approximately 60 cm. Tidalcurrents are less than 30 cm s�1 and the main currents near thesediment surface are caused by wave orbital motion.
Florida
St. George Island85.2 W
29.5 N84.7 W
85.5°W 79.2°W
85.5°W 79.2°W
30.1°N
25.3°N
30.1°N
25.3°N Gulf of Mexico
Fig. 1. Locations of the study sites at St. George Island Florida. Open symbol: Gulf
Site, solid black symbol: Bay Site.
Multiple measurements of near bed velocity flow taken duringthe study period at our sites with a Nortek Acoustic DopplerVelocimeter (ADV) were used to calculate the relationshipbetween mean bottom flow, vb, (at 10 cm above the bed) andaverage daily wind velocity, vw. For the Gulf Site, this relationshipwas vb¼1.41þ(1.08�vw); (R2
¼0.66, po0.05, n¼8) and for theBay Site (vb¼�0.59þ(0.81�vw); (R2
¼0.53, po0.05, n¼10).These relationships were used to calculate bottom flow velocitiesfor our sampling days.
Surface sediments at both sites consist of well-sorted quartzsands that had a median grain size of 223744 mm (71SD) and ahigh permeability of 2.4n10�1171.0n10�11 m2 (71SD) at the GulfSite. The Bay Site sand was slightly finer (median 211716 mm), butthe average permeability (1.3n10�1170.5n10�11 m2 (71SD)) wasalso high, permitting advective pore water exchange (Huettel andRusch, 2000). Abundance of macrofauna 41 mm in the sands atboth sites was dominated by orbiniid polychaetes (o500 m�2) andsmall decapod crustaceans (o2000 m�2) at Gulf Site, and byspionid polychaetes (o1000 m�2) and small amphipod crustaceans(o5000 m�2) at the Bay Site.
2.2. Time series of water column dissolved organic matter
concentrations
Monthly samples of water column DOC, dissolved inorganiccarbon (DIC), and total dissolved nitrogen (TN) were collected inthe nearshore zone (water depth �1.5 m) at the Gulf and Bay Sitesfrom February 2006 to April 2007. The samples were collectedmanually using 140 mL syringes. DOC and TN samples were filteredthrough sterile 0.7 mm glass fiber filters into sterilized glass vials andacidified to pH 2 with hydrochloric acid and stored in the dark. DICsamples were stored on ice in bubble-free, gas-tight vials andanalyzed the same day as collected. DOC, DIC, and TN concentrationsin the samples were measured using a Shimadzu total carbonanalyzer (TOC-VCPH) with nitrogen analysis capability.
2.3. Time series of pore water dissolved organic matter
concentrations
Sediment cores for pore water DOC analysis were collectedmanually at the Gulf Site and the Bay Site from July 2006 to April2007 at 1.5 m water depth. Sediment cores were collected intriplicates using 20 cm acrylic core-liners (3.6 cm inner diameter)that permitted sampling of the sediment depth affected by advectivepore water exchange (Huettel and Rusch, 2000). Retrieved cores werestored on ice and immediately returned to the laboratory. Here theupper 12 cm of the retrieved cores were cut into 2 cm intervals andthe pore water from each sediment slice was extracted by pushing itout with nitrogen gas. Pore water samples then were filtered (0.7 mmglass fiber filters), acidified with hydrochloric acid to pH 2, andanalyzed on the Shimadzu TOC instrument in the same way as thewater column samples. For isotopic composition analysis of theupper sediment layer (0–2 cm), sediment samples were ground to apowder and acidified with hydrochloric acid to remove inorganiccarbon. Samples were analyzed on a Carlo Erba Elemental Analyzercoupled to a stable isotope mass spectrometer (Finnigan MAT deltaPLUS XP). Stable carbon isotope ratios are expressed using the delta(d) notation that represents deviations from the standard referencematerial Vienna-Pee Dee Belemnite (RVPDB¼0.0111797), whered13CVPDB (%)¼[(Rsample/Rstandard)�1]�1000, and R is the ratio13C/12C (Sharp, 2007).
2.4. Chlorophyll analysis
Chlorophyll contents of water and sediment were determinedspectrophotometrically according to the procedures described in

0
100
200
300
400
DO
C (µ
mol
L-1
)
2
3
mol
L-1
)
L. Chipman et al. / Continental Shelf Research 45 (2012) 116–125118
(Strickland and Parsons, 1984 and Knap et al., 1996). Water wascollected with pre-cleaned 1 L polycarbonate bottles in triplicatesat 1 m below the water surface and stored on ice until analysis.After measuring the exact volume of the samples, the water wasfiltered through pre-washed 47 mm GFF glass fiber filters (What-man). The filters were extracted overnight with 90% acetone at4 1C and the extract was then analyzed on a Shimadzu UV/Visspectrophotometer. Sediment for chlorophyll analysis was col-lected in triplicates using cut-off syringes (60 cm3) and stored onice for transport. In the laboratory, the upper 4 cm of thesediment were extracted with 90% acetone at 4 1C for 24 h withintermittent shaking. Then the samples were centrifuged and thefluid overlying the sediment was removed and analyzed on theShimadzu UV/Vis photometer. For the calculation of chlorophyll,the formulas as presented in Knap et al. (1996) were used.
0
1
DIC
(m0
10
20
30
J F M A M J J A S O N D J F M A
TN (µ
mol
L-1
)
Time (Month) 2006 2007
Fig. 2. Monthly DOC, DIC, and TN concentrations in the water column at the Gulf
Site (open symbols) and Bay Site (solid symbols) from February 2006 to April
2007. Shading indicates the approximate periods of the three seasonal peaks in
concentrations.
0
10
20
30
40
0
100
200
300
400
Baseline Jun/Jul Sep/Oct Jan/Feb
TN (µ
mol
L-1
)
DO
C (µ
mol
L-1
)
14
1813
21
Gulf
Bay0
10
20
30
40
0
100
200
300
400
23 10
13
15
Fig. 3. Water column DOC and TN concentrations during the ‘‘baseline’’ period
with relatively low concentrations and the peak periods with high concentrations.
White columns: DOC, black columns: TN. Error bars depict standard deviation.
Number above columns indicate C/N ratio.
3. Results
3.1. Water column time series
Over the one year study period, the average DOC concentra-tions at the exposed Gulf Site (171747 mmol L�1 (71SD)) weresignificantly different than (paired t-test, t¼�7.57, po0.05,df¼12, n¼13) and about 1.5-times lower than those at thesheltered Bay Site (264715 mmol L�1 (71SD)). The DOC timeseries were characterized by base line concentrations of approxi-mately 130 mM at the Gulf Site and 240 mM at the Bay Site, andtwo (Bay) or three (Gulf) seasonal concentration peaks, eachlasting two to three months. These temporal increases occurredduring the same time periods at both sites, reaching maximumvalues in June/July, October (Gulf only), and January/February(Fig. 2). The peak events started with rapid increases of DOCfollowed by a slower concentration decline.
At the Bay site, DIC concentrations showed maxima coincidingwith the DOC peaks in June/July and January/February, while DICat the Gulf site remained relatively constant throughout the studyperiod. However, DIC concentrations were not significantly cor-related with DOC concentrations at either site. DIC concentrationsat the Gulf Site were significantly different (paired t-test, t¼7.08,po0.05, df¼11, n¼12) and on average 1.3-fold higher than thosemeasured at the Bay Site (Gulf Site: 1.9970.07 mmol L�1
(71SD), Bay Site: 1.5470.18 mmol L�1 (71SD)) (Fig. 2). Thr-oughout the study period, the pH measurements produced highervalues in the Gulf water (8.170.2 (71SD)) than in the Bay water(7.970.1 (71SD)). Average total dissolved nitrogen in the watercolumn at the Gulf Site (1375 mmol L�1 (71SD)) was approxi-mately 1.4-fold lower than at the Bay Site (1873 mmol L�1 (71SD))and the values were significantly different between the sites (pairedt-test, t¼�3.13, po0.05, df¼11, n¼12) (Fig. 2).
The average DOC/TN ratio at the Bay Site (1573 (71SD)) washigher than at the Gulf Site (1474 (71SD)), indicating a largerfraction of fresher, degradable DOM in the Gulf water column,however these values were not significantly different throughoutthe study period (paired t-test, t¼�1.61, p40.05, df¼11, n¼12).In June/July and January/February, the temporary DOC increasesalso increased the C/N ratios, suggesting releases of DOC withrelatively low nitrogen content. During September/October, asimultaneous increase in TN lowered C/N ratios at the Gulf Sitefrom 13 to 10 and at the Bay Site from 14 to 13 (Fig. 3). Thetemporal fluctuations of water column DOC concentrations mir-rored pore water DOC concentrations of the upper sediment layer(0–2 cm), with concentration peaks occurring at the same time atGulf and Bay Sites, except for the concentration peak recorded atthe Gulf Site in October 2006 (Fig. 4).
Water column chlorophyll a concentrations were, on average,lower at the Gulf site (average of monthly measurements:2.2571.15 mg L�1 (71SD)) than at the Bay Site (5.8673.06 mg L�1

0.0
1.0
2.0
3.0
4.0
5.0
0.0
0.1
0.2
0.3
0.4
0.5
J J A S O N D J F M
Por
e w
ater
DO
C (m
mol
L-1
)
Wat
er c
olum
n D
OC
(mm
ol L
-1)
Time (Month)
Fig. 4. Comparison of water column (Gulf Site: open squares, Bay Site: solid
squares) and pore water (Gulf Site: open circles, Bay Site: solid circles) DOC
concentrations. Pore water concentrations are those from the upper 2 cm of the
sediment. Error bars depict standard deviation. Note order of magnitude differ-
ence in scales for water column and pore water.
0.0
0.5
1.0
1.5
2.0
2.5
3.0
0.0
0.2
0.4
0.6
0.8
1.0
Gul
f DO
C (m
mol
L-1
)
Bay
DO
C (m
mol
L-1
)
Time (month)J J A S O N D J F M
Fig. 5. Changes of sediment DOC integrated over the upper 12 cm of the bed over
time for Gulf (open symbols) and Bay (solid symbols) sites. Error bars depict
standard deviation.
L. Chipman et al. / Continental Shelf Research 45 (2012) 116–125 119
(71SD)), and these average water column chlorophyll a concentra-tions were significantly different between the two sites (paired t-test,t¼�4.18, po0.05, df¼12, n¼13).
3.2. Sediment time series
Pore water DOC concentrations averaged over the upper 12 cmwere about 3- (Gulf) and 5-times (Bay) higher, and significantlydifferent than the associated overlying water column concentra-tions (Gulf: paired t-test, t¼�4.39, po0.05, df¼8, n¼9; Bay:paired t-test, t¼4.36, po0.05, df¼8, n¼9). Total (9 month)average Bay Site pore water concentrations (13037706 mmol L�1
(71SD)) exceeded Gulf Site pore water DOC concentrations(4697159 mmol L�1 (71SD)) approximately 3-times, and thedifference in values between the sites was significant (paired t-test,t¼�4.30, po0.05, df¼8, n¼9). The pore water DOC concentrationtime series (integrated upper 12 cm) showed four distinct peaksduring the study period, spaced at approximately 2-month timeintervals (Fig. 5). These peaks occurred at the same times at bothstudy sites and the Gulf and Bay pore water DOC time series werebetter correlated (Pearson product moment correlation coefficient¼0.82, po0.05) than the Gulf and Bay water column DOC variations(Pearson product moment correlation coefficient¼0.47, p40.05).
Despite the 3-times higher DOC concentrations in the Baysediment, the general depth distribution of pore water DOC andthe evolution of the distribution patterns over time were verysimilar in Gulf and Bay sediments (Fig. 6). At both sites, thegeneral DOC depth distribution showed increased concentrationsin the surface layer (0–2 cm), a drop of concentration below thatlayer, and concentration increases starting again below 4 to 9 cm
depth. The Pearson correlation coefficient between the average(of triplicate measurements) monthly DOC depth distributionswas 0.74, though the values were not statistically significantlycorrelated (p40.05).
Over the study period, DOC pore water concentrations in theupper 6 cm of the sediment did not vary more than 41% (Gulf Site)and 51% (Bay Site). Below these depths, the seasonal variationsincreased to 115% (Gulf Site) and 117% (Bay Site) due to theaccumulation of DOC rich pore water in the 6–12 cm layersduring the summer months. The concentration of total particulateorganic carbon in the upper 1 cm of Gulf Site sediment was onaverage 0.1070.02% (dw/dw) (71SD), with a stable carbonisotope composition, d13C(VPDB), of �22.1270.62% (7 1SD).Corresponding values at Bay Site were 0.1970.11% (dw/dw)(71SD) and �1972% (71SD). The averages of monthly chlor-ophyll a concentrations measured in the top 4 cm of the sediment(Gulf: 0.9270.39 ng cm�3 (71SD), Bay: 4.772.58 ng cm�3
(71SD)) were significantly different between the two sites(paired t-test, t¼5.10, po0.05, df¼8, n¼9).
3.3. Environmental factors
The DOC water column and pore water data were compared toseveral environmental factors to examine the relationshipsbetween the observed DOC patterns and precipitation, riverdischarge, water temperature, wind speed, and chlorophyll a. Asthese factors are active on different time scales, we performed aseries of simple linear regressions to compare water column and/or pore water DOC with these factors.
Average monthly precipitation recorded at the city of Apalachi-cola (located on the northern shore of the Bay) and DOC in the Bayand adjacent Gulf waters showed a positive correlation for the Bay(r2¼0.40, po0.05, df¼12, n¼13) and Gulf (r2
¼0.38, po0.05,df¼12, n¼13) data, when allowing for a 1 month delay as suggestedby the offset of precipitation and DOC peak values (Fig. 7). Despitethis influence of precipitation, the average monthly Apalachicolariver discharge was not significantly correlated with DOC concen-trations at the Gulf and Bay sites (p40.05, df¼12, n¼13), mostlikely because the river discharge into the Bay is controlled by watermanagement agencies through a series of dams.
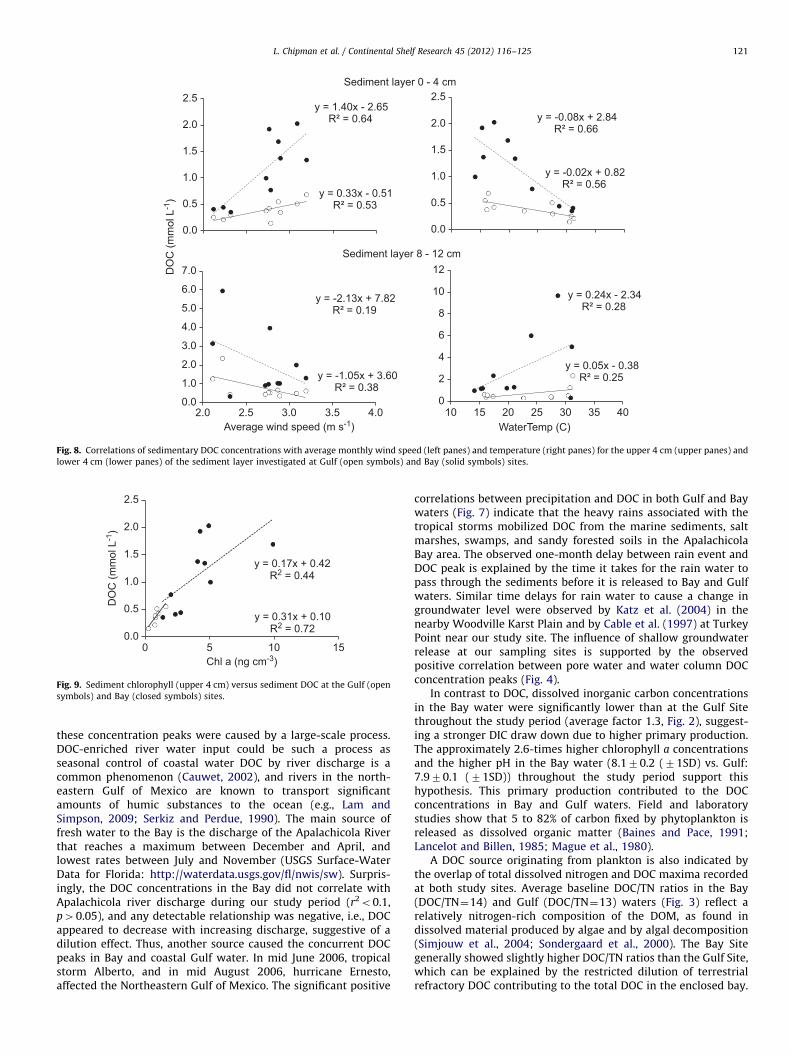
The comparison of DOC concentrations in the upper 4 cm ofsediment with wind speed, which we took as a proxy for flowintensity near the sediment-water interface, suggested a positivetrend (Fig. 8, Gulf: r2
¼0.53, Bay: r2¼0.64), but DOC and wind speed
were not statistically significantly correlated (p40.05, df¼8, n¼9).In the 8–12 cm sediment layer, DOC had a negative relationshipwith wind speed (Gulf: r2
¼0.38; Bay: r2¼0.19) but again was not
statistically significantly correlated (p40.05, df¼8, n¼9).At both sites, DOC in the sediment surface layer (upper 4 cm)
was negatively related to temperature (Bay: r2¼0.66, Gulf:
r2¼0.56, po0.05, df¼8, n¼9 for both regressions), while this
comparison for the subsurface layer (8–12 cm) suggested anopposite trend (Bay: r2
¼0.28, Gulf: r2¼0.25, p40.05, df¼8,
n¼9) (Fig. 8). In the surface layer, DOC concentrations werepositively correlated with sedimentary chlorophyll a (Gulf:r2¼0.72, Bay: r2
¼0.44, po0.05, df¼8, n¼9) (Fig. 9).
4. Discussion
Our study revealed distinct differences in DOC concentrationranges between the two study sites, combined with unexpectedsimilarities in the temporal and spatial distribution patterns ofGulf and Bay DOC. These similarities show that temporal pro-cesses effective at monthly time scales and spatial processes atregional scales influence the DOC dynamics at our two study sites.

Fig. 6. DOC distribution patterns in Gulf Site and Bay Site sediments and overlying water over time (2006–2007). Note different scales for DOC pore water concentrations.
0
5
10
15
20
0
100
200
300
F M A M J J A S O N D J F M A
Pre
cipi
tatio
n (c
m)
DO
C (µ
mol
L-1
)
Time (Month) 2006 2007
y = 6.41x + 110.60R² = 0.38
y = 4.99x + 216.09 R² = 0.40
0
100
200
300
400
0 5 10 15 20
DO
C (µ
mol
L-1
)
Precipitation (cm)
Fig. 7. Top: Monthly total precipitation (open symbols) and DOC (solid symbols)
at the Gulf Site (the Bay Site showed a similar pattern, data not shown). Bottom:
correlation between monthly total precipitation and water column DOC at the
Gulf (open symbols) and Bay (solid symbols) sites.
L. Chipman et al. / Continental Shelf Research 45 (2012) 116–125120
Known processes that occur at shorter time scales, (e.g., daily DOCfluctuations caused by photosynthetic activity (Otero et al.,2010)), and that likely contributed to the measured DOC concen-trations, are not resolved by our monthly sampling, which shouldbe considered when interpreting our data. The same generaltemporal DOC distribution patterns that we observed in thesediment at both study sites suggest that these short-termfluctuations did not obscure the processes that dominated DOCdistribution patterns at the larger temporal and spatial scales. Inthe following paragraphs, we propose mechanisms that canexplain these DOC patterns in water column and pore water,and discuss their ecological consequences.
4.1. Water column DOC
Except on one occasion in October 2006, water DOC concen-trations at the Bay Site water were significantly different than andabout a factor of 1.5 higher than those at the Gulf Site. Thesehigher concentrations are explained by the trapping of terrestrialDOC and nutrients released to Apalachicola Bay by the chain ofbarrier islands that slows water exchange with the Gulf. Modelcalculations by Huang and Spaulding (2002) indicate that theresidence time of water in Apalachicola Bay ranges between 3 and10 days, which allows the buildup of DOC in the Bay water andhelps to maintain a DOC gradient between the Bay and Gulf sidesof the island. This general DOC gradient between the Bay andcoastal Gulf sites is modulated by temporal concentration fluc-tuations observed at both study sites. Co-occurring water columnDOC maxima that were recorded in Bay and coastal Gulf waters inJune/July 2006 and January/February 2007 (Fig. 2) suggest that
y = 0.33x - 0.51 R² = 0.53
y = 1.40x - 2.65 R² = 0.64
0.0
0.5
1.0
1.5
2.0
2.5
DO
C (m
mol
L-1
)y = -0.02x + 0.82
R² = 0.56
y = -0.08x + 2.84 R² = 0.66
0.0
0.5
1.0
1.5
2.0
2.5
y = -1.05x + 3.60 R² = 0.38
y = -2.13x + 7.82 R² = 0.19
0.0
1.0
2.0
3.0
4.0
5.0
6.0
7.0
2.0 2.5 3.0 3.5 4.0Average wind speed (m s-1)
y = 0.05x - 0.38 R² = 0.25
y = 0.24x - 2.34 R² = 0.28
0
2
4
6
8
10
12
10 15 20 25 30 35 40WaterTemp (C)
Sediment layer 8 - 12 cm
Sediment layer 0 - 4 cm
Fig. 8. Correlations of sedimentary DOC concentrations with average monthly wind speed (left panes) and temperature (right panes) for the upper 4 cm (upper panes) and
lower 4 cm (lower panes) of the sediment layer investigated at Gulf (open symbols) and Bay (solid symbols) sites.
y = 0.31x + 0.10 R2 = 0.72
y = 0.17x + 0.42 R2 = 0.44
0.0
0.5
1.0
1.5
2.0
2.5
0 5 10 15
DO
C (m
mol
L-1
)
Chl a (ng cm-3)
Fig. 9. Sediment chlorophyll (upper 4 cm) versus sediment DOC at the Gulf (open
symbols) and Bay (closed symbols) sites.
L. Chipman et al. / Continental Shelf Research 45 (2012) 116–125 121
these concentration peaks were caused by a large-scale process.DOC-enriched river water input could be such a process asseasonal control of coastal water DOC by river discharge is acommon phenomenon (Cauwet, 2002), and rivers in the north-eastern Gulf of Mexico are known to transport significantamounts of humic substances to the ocean (e.g., Lam andSimpson, 2009; Serkiz and Perdue, 1990). The main source offresh water to the Bay is the discharge of the Apalachicola Riverthat reaches a maximum between December and April, andlowest rates between July and November (USGS Surface-WaterData for Florida: http://waterdata.usgs.gov/fl/nwis/sw). Surpris-ingly, the DOC concentrations in the Bay did not correlate withApalachicola river discharge during our study period (r2o0.1,p40.05), and any detectable relationship was negative, i.e., DOCappeared to decrease with increasing discharge, suggestive of adilution effect. Thus, another source caused the concurrent DOCpeaks in Bay and coastal Gulf water. In mid June 2006, tropicalstorm Alberto, and in mid August 2006, hurricane Ernesto,affected the Northeastern Gulf of Mexico. The significant positive
correlations between precipitation and DOC in both Gulf and Baywaters (Fig. 7) indicate that the heavy rains associated with thetropical storms mobilized DOC from the marine sediments, saltmarshes, swamps, and sandy forested soils in the ApalachicolaBay area. The observed one-month delay between rain event andDOC peak is explained by the time it takes for the rain water topass through the sediments before it is released to Bay and Gulfwaters. Similar time delays for rain water to cause a change ingroundwater level were observed by Katz et al. (2004) in thenearby Woodville Karst Plain and by Cable et al. (1997) at TurkeyPoint near our study site. The influence of shallow groundwaterrelease at our sampling sites is supported by the observedpositive correlation between pore water and water column DOCconcentration peaks (Fig. 4).
In contrast to DOC, dissolved inorganic carbon concentrationsin the Bay water were significantly lower than at the Gulf Sitethroughout the study period (average factor 1.3, Fig. 2), suggest-ing a stronger DIC draw down due to higher primary production.The approximately 2.6-times higher chlorophyll a concentrationsand the higher pH in the Bay water (8.170.2 (71SD) vs. Gulf:7.970.1 (71SD)) throughout the study period support thishypothesis. This primary production contributed to the DOCconcentrations in Bay and Gulf waters. Field and laboratorystudies show that 5 to 82% of carbon fixed by phytoplankton isreleased as dissolved organic matter (Baines and Pace, 1991;Lancelot and Billen, 1985; Mague et al., 1980).
A DOC source originating from plankton is also indicated bythe overlap of total dissolved nitrogen and DOC maxima recordedat both study sites. Average baseline DOC/TN ratios in the Bay(DOC/TN¼14) and Gulf (DOC/TN¼13) waters (Fig. 3) reflect arelatively nitrogen-rich composition of the DOM, as found indissolved material produced by algae and by algal decomposition(Simjouw et al., 2004; Sondergaard et al., 2000). The Bay Sitegenerally showed slightly higher DOC/TN ratios than the Gulf Site,which can be explained by the restricted dilution of terrestrialrefractory DOC contributing to the total DOC in the enclosed bay.

0
4
8
10
12
02468
1.5
J A S O N D J F M A
Chl
.a (µ
g L
)-1
Chl
. a G
ulf (
ng c
m-3
)
0
1
2
3
4
5
6
7W
ind
spee
d (m
s-1
)
1.0
0
0.5
Chl
. a B
ay (
ng c
m-3
)
Water
Sediment
Fig. 10. Wind speeds and chlorophyll a in water and sediment at the study sites.
Upper pane: Average daily wind speeds during the study period as reported by the
Apalachicola weather station (KAAF). Lower pane: chlorophyll a concentrations in
the water column and the upper 4 cm of the sediment at the Gulf (open symbols)
and Bay (solid symbols) sites.
L. Chipman et al. / Continental Shelf Research 45 (2012) 116–125122
The Gulf Site June/July DOC peak, which was proportionallyhigher than the corresponding peak at the Bay Site, was notsupported by TN, suggesting that an additional source of DOC, lowin nitrogen, contributed to this temporary increase. Because thispeak coincided with storm Alberto, refractory DOC released bysediment resuspension during the storm is a probable cause. Thiswould also explain why this peak was more pronounced at theGulf site, as the sediments of this exposed site were more affectedby the storm waves than those in the protected Bay. This findingand coinciding concentration peaks in water column and porewater DOC (Fig. 4) emphasize that benthic-pelagic couplingstrongly influences the water column DOC concentrations in boththe Bay and Gulf coastal waters.
4.2. Pore water DOC
Because DOC concentrations in the upper 2 cm of the sedimentexceeded those in the respective overlying water columns onaverage 2 (Bay) to 4 (Gulf) -fold, the sands at both study siteswere a net source of DOC. DOC concentrations in shelf sedimentsare typically about one order of magnitude higher than in theoverlying water (e.g., Alperin et al., 1994, 1999; Burdige andZheng, 1998; Martin and McCorkle, 1993), and the smallergradient found in this study can be attributed to the highpermeabilities of Gulf and Bay sediments that permitted efficientinterfacial water and solute exchange through pore water flowsdriven by boundary layer currents interacting with seabed topo-graphy (Huettel et al., 1996). The relatively high concentrations ofDOC in the Bay sediments are linked to the higher primaryproductivity in the Bay (Mortazavi et al., 2000a,, 2000b) and thePOC contents exceeding those of the Gulf sands by a factor of 1.9.The enclosed Bay acts as a trap for detritus particles, and theenrichment of the Bay sediment surface layer with respect to 13C(d13C(VPDB)¼�18.6572.03% (71SD)) relative to the Gulf Sitesediment (d13C(VPDB)¼�22.1270.62% (71SD)), indicates thecontribution of detritus originating from sea grasses and salt
marsh plants, which use the C4-dicarboxilyc acid pathway(C4 plant d13C: �9 to �23%) (Rounick and Winterbourn, 1986).In contrast, d13C values of the Gulf sand were closer to the rangetypically found for marine phytoplankton of temperate regions(d13C¼�23 to �18%) (Johnston, 1996; Leboulanger et al., 1995).These results suggest that the organic carbon in the sedimentswas dominated by local sources (aquatic plants/plankton), whileterrestrial carbon (d13C(VPDB)¼�25 to �29%, (Smith, 1972)) wasonly temporarily of importance after storm events.
4.3. DOC distribution in the sediments
Despite on average 3-times higher pore water DOC concentra-tions at the Bay Site compared to the Gulf Site, the temporalfluctuations in depth-integrated (0–12 cm) concentrations (Fig. 5)and the spatial and temporal distribution patterns of pore waterDOC were remarkably similar at both sites (Fig. 6). This suggestslarge-scale processes affecting the sedimentary concentrations asalso indicated above for the synchronized DOC fluctuationsobserved in Gulf and Bay water columns. Controls for thesepatterns were pore water flow, associated particle filtration, andtemperature. Pore water flows controlled DOC mainly throughacting on the sources of DOC, while temperature influenced DOCby affecting degradation rates and diffusive transport. The seaso-nal changes of these two major controls shape the distributionpatterns of DOC in the sediments at our two study sites. Threedistinct phases can be distinguished that produced similar DOCdistribution patterns at both sites: a summer phase (Jul 06–Oct06), with relatively low DOC concentrations in the upper 6 cm ofthe sediment but very high DOC concentrations below that layer,transition phases (Nov 06 and Mar 07), with high DOC concentra-tions throughout the investigated sediment depth, and a winterphase (Dec 06 to Feb 07), with high DOC concentrations in thesurface layer and deepest layer. The following paragraphs explainthe DOC distribution patterns during these phases.
4.3.1. Summer phase
During summer 2006, calm warm weather (low wind speeds,(Fig. 10)) at both study sites led to low DOC concentrations at 0 to4 cm sediment depth (Fig. 6). During this period, microbialdecomposition, boosted by the high temperatures (Aug. 06 Tw:Gulf: 31 1C, Bay: 29 1C), mineralized most of the degradable DOCin the upper layers. In addition, transport of degradable particlesinto the sand that could act as new DOC sources was limited, dueto reduced pore water filtration associated with the decreasedwind/wave action (Figs. 8 and 10). DOC concentrations at 0 to6 cm depth thus remained relatively low, and only in the upper-most layer (0–2 cm), could some slightly elevated DOC concen-trations be measured, likely caused by exopolymeric substancesrelease by microphytobenthos (Underwood and Smith, 1998;Ziervogel and Forster, 2006). These findings are supported byRusch et al. (2003b), who reported a surface DOC peak in MidAtlantic Bight shelf sands during summer. Weak pore water flowsand high summer temperatures at our sites permitted the buildupof DOC in the layers below 6 cm, fed by upward diffusion ofrefractory DOC produced in the deeper (410 cm) sediment layersduring the mineralization of buried organic carbon (Fig. 6). Thisupward diffusion led to the highest DOC concentrations measuredduring the study period, which reached 2.37 mmol L�1 at 8–10 cmdepth at the Gulf Site and 9.69 mmol L�1 at 10 cm depth at the BaySite. This DOC in the deeper layers can be considered more recalci-trant as it has been exposed for longer time periods to sedimentarymicrobial degradation (Burdige, 2001). In contrast, the DOC in theupper layers produced by degradation of algal cells transported into

L. Chipman et al. / Continental Shelf Research 45 (2012) 116–125 123
the sediment is more degradable as indicated by the relatively low C/N ratios we measured in the surface layer.
4.3.2. Fall transition
The summer DOC distribution changed drastically at both studysites when the first fall storms hit the area in October 2006(Figs. 6 and 10). At our shallow study sites, increased winds andassociated wave action translate directly into increased bottomcurrents (Liu and Huang, 2009). Webb and Theodor (1968,,1972)and Precht and Huettel (2004) showed, with in-situ measurementsat sites with similar water depths and sediment permeabilities, thatwaves and the oscillating boundary currents they generate produceadvective pore water exchange that can reach 10 cm sedimentdepth. The fall storms thus increased the depth of pore water flowsin the sand and mixed the pore water, resulting in relativelyhomogenous DOC concentrations throughout the sediment columnsat both study sites. The concentration of the ‘‘mixed’’ DOC ranged inbetween the concentrations measured in the surface and deep layersduring summer. Counter-intuitively, the enhanced pore flowsincreased the DOC concentrations in the upper sediment layer,producing a peak of DOC concentration at 1 cm sediment depth atboth study sites. Cross-correlation plots (Fig. 8) suggested that atboth sites, DOC in the upper 4 cm of the sediment increased withwind speed, while in the deeper layer (8–12 cm) this trend wasreversed (Gulf) or not present (Bay). As water column DOC con-centrations were one order of magnitude smaller than those in thesediment, filtration of DOC into the sediment can be excluded ascause for the DOC peak in the upper sand layer, indicating asedimentary source for this DOC, i.e., decay of organic matter andmicrobial production of DOC that exceeded DOC removal by porewater flows. Chlorophyll concentrations in the upper 4 cm of thebed showed a rapid increase in October (Fig. 10), indicatingenhanced filtration of phytoplankton cells into the upper sedimentlayer and/or microphytobenthos growth.
Huettel et al. (2007), Huettel and Rusch (2000), and Pilditchand Miller (2006) showed in flume and in-situ studies thatphytoplankton cells can rapidly be filtered into sandy sediments,where most cells are retained in the uppermost sediment layer.Billerbeck et al. (2006) suggested that degradation of this materialcauses seasonal changes in the pore water DOC concentration inpermeable intertidal sands. Ehrenhauss and Huettel (2004) andEhrenhauss et al. (2004) found with in-situ experiments inpermeable North Sea sands, a close link between particulate anddissolved organic matter concentrations in the surface layer ofthese sediments. In a recent study conducted with sedimentsfrom our Gulf study site, Chipman et al. (2010) demonstrated thatthis filtration of plankton into the sand and ensuing degradationleads to an increase of DOC in the upper 2 cm of the sediment. Thelink between sedimentary chlorophyll a and DOC concentrationsin the upper 4 cm of the sediment at both study sites is supportedby their positive correlations (po0.05 for both regressions)(Fig. 9). Microphytobenthos growth, boosted by enhanced porewater mixing and associated enhanced nutrient supply fromdeeper sediment layers, likely added to the sedimentary DOCincreases. Studies of Yallop et al. (1994) and Jahnke et al. (2008)demonstrated that the primary productivity of permeable sedi-ments can be comparable in magnitude to or exceed that of lesspermeable, muddy sediments.
4.3.3. Winter phase
Winds remained relatively high from October 06 to March 07(Fig. 10), maintaining sediment flushing and establishing a DOCdistribution pattern characterized by high concentrations in thesurface layer, lower concentrations between 4 and 10 cm depth,and increasing DOC concentrations below that layer. The filtration
of water through the sediment sustained transport of degradableorganic particles into the surface layer, and in the subsurfacelayers, suppressed the build-up of refractory DOC diffusingupward from deeper layers. As pore water flow attenuates rapidlywith increasing sediment depth (Huettel and Webster, 2000),these controls acted differently on the upper and lower sedimentlayers. Chipman et al. (2010) showed how microbial decomposi-tion processes and advective pore water flows with a stronghorizontal flow component can remove DOC from permeablesediment intermediate layers, producing a concentration mini-mum in the vertical DOC concentration profiles as we observedbetween 2 and 10 cm sediment depth. Below 10 cm depth, theweakening pore water flushing permitted concentration increasesfueled by upward diffusion of DOC from deeper sediment layers.Similar DOC distributions were reported by Rusch et al. (2003a)from Middle Atlantic Bight shelf sands, where winter pore waterprofiles showed elevated DOC concentrations in 0–1 cm and 6–8 cm depth, and from the North Sea (Billerbeck et al., 2006),where December DOC concentrations peaked at 2–4 and 10–14 cm sand depth. In our study, a brief spike in wind strength onDecember 25, 2006 (5.6 m s�1, Fig. 10) and ensuing DOC con-centration increases down to 8 cm depth recorded during ourJanuary sampling (Fig.6), demonstrate the immediate effect ofwind and waves on the DOC distribution in the upper 10 cm ofthe permeable sediments at our Bay and Gulf sites. In our shallowenvironments, changes in wind speed translate almost immedi-ately into increased flow velocities at the sediment water inter-face and thus also increased pore water exchange in the highlypermeable sediments.
4.3.4. Spring transition
In March 2007, a period of high winds (6.6 m s�1) initiated asecond transition phase marking the end of the winter phase. As inthe fall transition, we recorded a relatively even DOC distributionwith elevated concentrations throughout the studied sedimentdepth (Fig. 6) caused by the enhanced pore water mixing and deeplabile organic particle entrainment into the bed. After March, theincrease of DOC concentrations in the sediment layers below 8 cmsuggested the start of the warm-period DOC distribution with highconcentrations in the deep layers and low concentrations in thesurface layers as described above for the summer phase.
Our study emphasizes the influence of advective pore waterexchange on DOC concentrations and distribution patterns inpermeable coastal sands. In contrast to muddy, cohesive sedi-ments, where DOC is mainly controlled by decomposition ofburied organic matter and diffusive transport that producesrelatively stable concentration profiles steadily increasing withsediment depth (Burdige, 1991, 2001; Martin and McCorkle,1993; Sierra et al., 2001), DOC distribution in the surface layerof permeable sands closely reflects changes in advective porewater transport and associated supply of degradable particulatecarbon. The consequences are substantial seasonal changes in thesedimentary DOC concentrations and their spatial distributions,thereby influencing the benthic microbial community and foodweb. We conclude that benthic-pelagic coupling in coastal envir-onments with permeable sediments strongly influences watercolumn DOC and the dynamics of DOC concentrations in theupper 10 cm of the seabed. The biogeochemical processes in thesand surface layer thus may play a key role for the DOC dynamicsin the coastal zone.
Role of the funding source
The National Science foundation (NSF) provided funding forthis project (OCE-424967, OCE-0726754). NSF had no influence

L. Chipman et al. / Continental Shelf Research 45 (2012) 116–125124
on study design; in the collection, analysis, and interpretation ofdata; in the writing of the report; and in the decision to submitthe paper for publication.
Author contributions to the article
Lindsay Chipman, Markus Huettel and Matt Laschet all havematerially participated in the research and/or article preparation.Lindsay Chipman conducted the time series studies, samplecollection, DOC analysis, data analysis and manuscript writing.Markus Huettel designed and led this research project, partici-pated in the time series studies, sample collection, data analysis,data interpretation and manuscript writing. Matt Laschet partici-pated in the time series study, sample collection and chlorophyllanalysis. All authors have approved the manuscript.
Acknowledgments
We thank Yang Wang and Yingfeng Xu for performing theisotopic analyses of our samples at the National High FieldMagnetic Laboratory. Katie Higgs assisted with the field sampling.Thanks to Lee Edmiston and the management of St. George StatePark for the permission to study at sites within the parkboundaries. This study was funded by the National ScienceFoundation (OCE-424967, OCE-0726754).
References
Alperin, M.J., Albert, D.B., Martens, C.S., 1994. Seasonal-variations in productionand consumption rates of dissolved organic-carbon in an organic-rich coastalsediment. Geochimica et Cosmochimica Acta 58, 4909–4930.
Alperin, M.J., Martens, C.S., Albert, D.B., Suayah, I.B., Benninger, L.K., Blair, N.E.,Jahnke, R.A., 1999. Benthic fluxes and porewater concentration profiles ofdissolved organic carbon in sediments from the North Carolina continentalslope. Geochimica et Cosmochimica Acta 63, 427–448.
Baines, S.B., Pace, M.L., 1991. The production of dissolved organic-matter byphytoplankton and its importance to bacteria—patterns across marine andfresh-water systems. Limnology and Oceanography 36, 1078–1090.
Benner, R., Pakulski, J.D., McCarthy, M., Hedges, J.I., Hatcher, P.G., 1992. Bulkchemical characteristics of dissolved organic-matter in the ocean. Science 255,1561–1564.
Biddanda, B., Benner, R., 1997. Carbon, nitrogen, and carbohydrate fluxes duringthe production of particulate and dissolved organic matter by marinephytoplankton. Limnology and Oceanography 42, 506–518.
Billerbeck, M., Werner, U., Polerecky, L., Walpersdorf, E., deBeer, D., Huettel, M.,2006. Surficial and deep pore water circulation governs spatial and temporalscales of nutrient recycling in intertidal sand flat sediment. Marine Ecology-Progress Series 326, 61–76.
Burdige, D.J., 1991. The kinetics of organic-matter mineralization in anoxicmarine-sediments. Journal of Marine Research 49, 727–761.
Burdige, D.J., 2001. Dissolved organic matter in Chesapeake Bay sediment porewaters. Organic Geochemistry 32, 487–505.
Burdige, D.J., Zheng, S.L., 1998. The biogeochemical cycling of dissolved organicnitrogen in estuarine sediments. Limnology and Oceanography 43,1796–1813.
Cable, J.E., Burnett, W.C., Chanton, J.P., 1997. Magnitude and variations of ground-water seepage along a Florida marine shoreline. Biogeochemistry 38, 189–205.
Cauwet, G., 2002. DOM in the coastal zone. In: Hansell, D.A., Carlson, A.C. (Eds.),Biogeochemistry of Marine Dissolved Organic Matter. Elsevier, AcademicPress, Amsterdam, pp. 579–612.
Chipman, L., Podgorski, D., Green, S., Kostka, J., Cooper, W., Huettel, M., 2010.Decomposition of plankton-derived dissolved organic matter in permeablecoastal sediments. Limnology and Oceanography 55, 857–871.
Ehrenhauss, S., Huettel, M., 2004. Advective transport and decomposition of chain-forming planktonic diatoms in permeable sediments. Journal of Sea Research52, 179–197.
Ehrenhauss, S., Witte, U., Janssen, F., Huettel, M., 2004. Decomposition of diatomsand nutrient dynamics in permeable North Sea sediments. Continental ShelfResearch 24, 721–737.
Emery, K.O., 1968. Relict sediments on continental shelves of the world. AmericanAssociation of Petroleum Geologists Bulletin 52, 445–464.
Hansell, D.A., Carlson, C.A., 2002. Biogeochemistry of Marine Dissolved OrganicMatter, first ed. Academic Press.
Haynes, K., Hofmann, T.A., Smith, C.J., Ball, A.S., Underwood, G.J.C., Osborn, A.M.,2007. Diatom-derived carbohydrates as factors affecting bacterial community
composition in estuarine sediments. Applied and Environmental Microbiology73, 6112–6124.
Hedges, J.I., Keil, R.G., Benner, R., 1997. What happens to terrestrial organic matterin the ocean? Organic Geochemistry 27, 195–212.
Hopkinson, C.S., Fry, B., Nolin, A.L., 1997. Stoichiometry of dissolved organic matterdynamics on the continental shelf of the northeastern USA. Continental ShelfResearch 17, 473–489.
Hopkinson, C.S., Fry, B.D., 1994. Doc Dynamics During a Spring Bloom on theGeorges-Bank-Continental-Shelf. Abstracts of Papers of the American Chemi-cal Society 207, 93-GEOC.
Huang, W.R., Spaulding, M., 2002. Modelling residence-time response to fresh-water input in Apalachicola Bay, Florida, USA. Hydrological Processes 16,3051–3064.
Huettel, M., Cook, P., Janssen, F., Lavik, G., Middelburg, J.J., 2007. Transport anddegradation of a dinoflagellate bloom in permeable sublittoral sediment.Marine Ecology-Progress Series 340, 139–153.
Huettel, M., Rusch, A., 2000. Transport and degradation of phytoplankton inpermeable sediment. Limnology and Oceanography 45, 534–549.
Huettel, M., Webster, I.T., 2000. Porewater flow in permeable sediment. In:Boudreau, B.P., Jørgensen, B.B. (Eds.), The Benthic Boundary Layer: TransportProcesses and Biogeochemistry. Oxford University Press, pp. 144–179.
Huettel, M., Ziebis, W., Forster, S., 1996. Flow-induced uptake of particulate matterin permeable sediments. Limnology and Oceanography 41, 309–322.
Jahnke, R.A., Nelson, J.R., Richards, M.E., Robertson, C.Y., Rao, A.M.F., Jahnke, D.B.,2008. Benthic primary productivity on the Georgia midcontinental shelf:benthic flux measurements and high-resolution, continuous in situ PARrecords. Journal of Geophysical Research, 113.
Johnston, A.M., 1996. The effect of environmental variables on C-13 discriminationby two marine phytoplankton. Marine Ecology-Progress Series 132, 257–263.
Katz, B.G., Chelette, A.R., Pratt, T.R., 2004. Use of chemical and isotopic tracers toassess nitrate contamination and ground–water age, Woodville Karst Plain,USA. Journal of Hydrology 289, 36–61.
Knap, A., Michaels, A., Close, A., Ducklow, H., Dickson, A., 1996. Protocols for theJoint Global Ocean Flux Study (JGOFS) Core Measurements. Reprint of the IOCManuals and Guides No. 29, UNESCO 1994., JGOFS Report, p. viþ170 pp.
Lam, B., Simpson, A.J., 2009. Investigating aggregation in suwannee river, usa,dissolved organic matter using diffusion-ordered nuclear magnetic resonancespectroscopy. Environmental Toxicology and Chemistry 28, 931–939.
Lancelot, C., Billen, G., 1985. Carbon–nitrogen relationships in nutrient metabo-lism of coastal marine ecosystems. Jannasch, H.W. and P. J. L. Williams (Ed.).Advances in Aquatic Microbiology, 3. Academic Press Inc., Publishers: Orlando,Fla., USA; Academic Press Inc., (London) Ltd.: London, England. Xiþ335p Illus,263–322.
Leboulanger, C., Descolasgros, C., Fontugne, M.R., Bentaleb, I., Jupin, H., 1995.Interspecific variability and environmental influence on particulate organic-carbon delta(13) in cultured marine-phytoplankton. Journal of PlanktonResearch 17, 2079–2091.
Liu, X., Huang, W., 2009. Modeling sediment resuspension and transport inducedby storm wind in Apalachicola Bay, USA. Environmental Modelling & Software24, 1302–1313.
Lundkvist, M., Gangelhof, U., Lunding, J., Flindt, M.R., 2007. Production and fate ofextracellular polymeric substances produced by benthic diatoms and bacteria:a laboratory study. Estuarine Coastal and Shelf Science 75, 337–346.
Mague, T.H., Friberg, E., Hughes, D.J., Morris, I., 1980. Extracellular release ofcarbon by marine-phytoplankton—a physiological approach. Limnology andOceanography 25, 262–279.
Martin, W.R., McCorkle, D.C., 1993. Dissolved organic-carbon concentrations inmarine pore waters determined by high-temperature oxidation. Limnologyand Oceanography 38, 1464–1479.
Middelburg, J.J., Barranguet, C., Boschker, H.T.S., Herman, P.M.J., Moens, T., Heip,C.H.R., 2000. The fate of intertidal microphytobenthos carbon: an in situ C-13-labeling study. Limnology and Oceanography 45, 1224–1234.
Mortazavi, B., Iverson, R.L., Landing, W.M., Lewis, F.G., Huang, W.R., 2000a.Control of phytoplankton production and biomass in a river-dominatedestuary: Apalachicola Bay, Florida, USA. Marine Ecology-Progress Series 198,19–31.
Mortazavi, B., Iverson, R.L., Huang, W.R., Lewis, F.G., Caffrey, J.M., 2000b. Nitrogenbudget of Apalachicola Bay, a bar-built estuary in the northeastern Gulf ofMexico. Marine Ecology-Progress Series 195, 1–14.
Otero, M., et al., 2010. Fluorescence characterization of daily and intertidalchanges in estuarine water DOM related to the presence of Sarcocorniaperennis (L.) AJ Scott. Organic Geochemistry 41, 734–741.
Pilditch, C.A., Miller, D.C., 2006. Phytoplankton deposition to permeable sedimentsunder oscillatory flow: effects of ripple geometry and resuspension. Con-tinental Shelf Research 26, 1806–1825.
Precht, E., Huettel, M., 2004. Rapid wave-driven advective pore water exchange ina permeable coastal sediment. Journal of Sea Research 51, 93–107.
Rounick, J.S., Winterbourn, M.J., 1986. Stable carbon isotopes and carbon flow inecosystems. Bioscience 36, 171–177.
Rusch, A., Huettel, M., Reimers, C.E., Taghon, G.L., Fuller, C.M., 2003a. Activity anddistribution of bacterial populations in Middle Atlantic Bight shelf sands. FEMSMicrobiology Ecology 44, 89–100.
Rusch, A., Huettel, M., Reimers, C.E., Taghon, G.L., Fuller, C.M., 2003b. Activity anddistribution of bacterial populations in Middle Atlantic Bight shelf sands. FemsMicrobiology Ecology 44, 89–100.
Sharp, Z., 2007. Principles of Stable Isotope Geochemistry. Pearson Education.

L. Chipman et al. / Continental Shelf Research 45 (2012) 116–125 125
Serkiz, S.M., Perdue, E.M., 1990. Isolation of dissolved organic matter from thesuwannee river georgia usa using reverse osmosis. Water Research 24,911–916.
Sierra, M.M.D., Donard, O.F.X., Etcheber, H., Soriano-Sierra, E.J., Ewald, M., 2001.Fluorescence and DOC contents of pore waters from coastal and deep-seasediments in the Gulf of Biscay. Organic Geochemistry 32, 1319–1328.
Simjouw, J.P., Mulholland, M.R., Minor, E.C., 2004. Changes in dissolved organicmatter characteristics in Chincoteague Bay during a bloom of the pelagophyteAureococcus anophagefferens. Estuaries 27, 986–998.
Smith, B.N., 1972. Natural abundance of stable isotopes of carbon in biological-systems. Bioscience 22, 226–235.
Sondergaard, M., Williams, P.J.L., Cauwet, G., Riemann, B., Robinson, C., Terzic, S.,Woodward, E.M.S., Worm, J., 2000. Net accumulation and flux of dissolvedorganic carbon and dissolved organic nitrogen in marine plankton commu-nities. Limnology and Oceanography 45, 1097–1111.
Strickland, J.D.H., Parsons, T.R., 1984. A Practical Handbook of Seawater Analysis.Unipub Ottawa.
Underwood, G.J.C., Smith, D.J., 1998. Predicting epipelic diatom exopolymerconcentrations in intertidal sediments from sediment chlorophylla. MicrobialEcology 35, 116–125.
Webb, J.E., Theodor, J., 1968. Irrigation of submerged marine sands through waveaction. Nature 220, 682–685.
Webb, J.E., Theodor, J.L., 1972. Wave-induced circulation in submerged sands.
Journal of the Marine Biological Association of the UK 52, 903–914.Wetz, M.S., Hales, B., Wheeler, P.A., 2008. Degradation of phytoplankton-derived
organic matter: Implications for carbon and nitrogen biogeochemistry incoastal ecosystems. Estuarine Coastal and Shelf Science 77, 422–432.
Williams, P.M., Druffel, E.R.M., 1987. Radiocarbon in dissolved organic-matter inthe Central North Pacific-Ocean. Nature 330, 246–248.
Wilson, A.M., Huettel, M., Klein, S., 2008. Grain size and depositional environmentas predictors of permeability in coastal marine sands. Estuarine Coastal andShelf Science 80, 193–199.
Yallop, M.L., Dewinder, B., Paterson, D.M., Stal, L.J., 1994. Comparative structure,primary production and biogenic stabilization of cohesive and non-cohesive
marine sediments inhabited by microphytobenthos. Estuarine Coastal andShelf Science 39, 565–582.
Ziervogel, K., Forster, S., 2006. Do benthic diatoms influence erosion thresholds ofcoastal subtidal sediments? Journal of Sea Research 55, 43–53.