effect of behavioral biases on market efficiency and ...faculty.haas.berkeley.edu/odean/papers...
TRANSCRIPT
6 • MARCH 2007 ©2007, CFA Institute • cfapubs.org
Effect of Behavioral Biases on Market Efficiency and Investors’ WelfareTerrance OdeanWillis H. Booth Professor of Banking and FinanceUniversity of CaliforniaBerkeley, California
enjamin Graham once said, “The investor’s chiefproblem—and even his worst enemy—is likely to
be himself.” Why? Because to really understandfinance, an investor has to understand probability, andhuman beings have difficulty intuitively grasping thisconcept. Consequently, investors use a plethora ofmental shortcuts to make probability assessments.Sometimes, those mental shortcuts work reasonablywell. But often, they lead to systematic biases, andthese systematic biases lead many investors astray.
Eugene Fama, one of the major proponents of theefficient market hypothesis, defines an efficient mar-ket as one “in which prices always ‘fully reflect’ avail-able information.” Of course, not everybody agreeswith Fama that markets are efficient. Warren Buffettonce said, “I’d be a bum in the street with a tin cup ifthe markets were efficient.” Indeed, if the markets areefficient, there is no room for a Buffett—no room foractive money management. Personally, I believe mar-kets are not fully efficient. Some investors do generatea true alpha. But it is difficult to do, and it is earned atthe expense of ordinary investors, who make persis-tent and thoroughly typical mistakes.
Individual Investors and Market EfficiencyThe behavioral finance view of markets and marketefficiency encompasses five basic tenets. The first is
that institutional, or informed, traders are con-strained by risk aversion and other limits of arbitrage;in other words, informed traders are unable to alwayskeep prices efficient.
A second tenet of behavioral finance is that thetrading decisions of individual investors are biased.Individual investors make investment decisions forreasons that are often unrelated to the fundamentalvalue of a company or a stock.
Third, the purchases and sales of individualinvestors are highly correlated. If, instead, theseactions were random, these trades might be expectedto more or less cancel each other out. On the contrary,based on what other researchers and I have found,individual investors tend to be systematic in theirdecision making. They tend to get enthusiastic aboutthe same stocks at the same time and thus to buy andsell the same stocks at the same time.
This herding behavior leads to the fourth tenet,which is the potential for individual, or uninformed,investors to create buy–sell imbalances that driveprices away from fundamental value.
And finally, over time, prices will be pushed backtoward fundamental value by informed traders.
This presentation will focus mainly on the biasedtrading decisions of individual investors, which hasbeen the subject of most of my research.
Informed Traders’ Constraints. That informedtraders are constrained by risk aversion and otherlimits of arbitrage runs counter to the typical argu-ment used to support market efficiency: Wealthy,
Individual investors, in general, trade more than is good for them. Behavioral financeoffers several explanations for why this is true. The behavioral biases of individualinvestors as well as the constraints placed on institutional investors by risk aversion andother limits of arbitrage act in opposition to total market efficiency. The trading behaviorof the two constituencies creates a tug of war between stock prices and fundamentals.
This presentation comes from the Wealth Management Conference heldin Singapore on 29 June 2006.
B
March 07 CP.book Page 6 Monday, March 12, 2007 1:20 PM
©2007, CFA Institute • cfapubs.org MARCH 2007 • 7
Effect of Behavioral Biases on Market Efficiency and Investors’ Welfare
well-informed, risk-tolerant investors “know” whereprices should be, and when prices deviate from thatpoint, they push prices back in line. These wealthy,well-informed arbitrageurs cannot always pushprices back, however, because of the associated risks.These risks include information risk, model risk,liquidity risk, fundamental risk, noise-trader risk, andagency risks.
For example, in March 1998, Julian Robertsonand George Soros would have been on anyone’s shortlist of informed investors. Both ran hedge funds withreasonably similar exposures to high-tech stocks in1998 and early 1999. But by the summer of 1999,Robertson pulled out of the high-tech market, statingpublicly that the market was irrational and overval-ued. Soros made the opposite bet and upped hisfund’s exposure to 60 percent. So, clearly, it cannotbe that obvious, even to informed investors, whereprices are going or Robertson and Soros would nothave placed opposite bets.
Who was right? On the one hand, Robertson wasright because nine months after he made the decisionto get out of the high-tech market, it collapsed. On theother hand, Soros was right because in the fall of 1999,the NASDAQ went wild—before it collapsed.Another consideration is that money was pouringinto Soros’ hedge fund ($250 million) in November1999, while Robertson was hemorrhaging investors,ultimately closing his fund in March 2000. This exam-ple highlights one of the many risks that institutionalinvestors face: They may make the right decision butmake it too early. Clients often do not have a greatdeal of patience for being on the wrong side of themarket, even briefly.
Individual Investor Trading Decisions. Fourbiases typical of individual investors affect their trad-ing behavior. Individual investors tend to be overcon-fident, trade to reduce regret, have limited attention,and love to chase trends.
■ Overconfidence. Overconfidence is the state ofbelieving that your information is more accurate andprecise than it is and that your investment ability isoutstanding when it really is not. Overconfidentinvestors trade more frequently than is in their bestinterest and earn less than if they adopted a moreconservative buy-and-hold strategy. They tend tounderdiversify because, believing they are right, theysee no reason to hedge. Volatility also rises in a mar-ket populated by overconfident traders who tradefrequently and, often, speculatively.
I have tested this assertion in several studies,both alone and together with my colleague BradBarber. My first study was based on the tradingrecords of 10,000 clients of a discount brokerage firm(Odean 1999). I wanted to know if these investors
were trading more than they should, so I calculatedwhether the stocks they bought outperformed thosethey sold by enough to cover their trading costs.Based on a one-year horizon, the stocks these inves-tors bought, on average, underperformed the stocksthey sold by 3.22 percentage points (pps), and thatwas before deducting trading costs—commissionsand the bid–ask spread.
Of course, reasons other than pure speculationspur trading, such as harvesting tax losses or meetingliquidity needs. Therefore, I filtered out trades likelyto have been made for nonspeculative reasons. Forexample, only those trades where the investor sold astock for a profit and bought another stock withinthree weeks were selected. A profit-taking sale is notlikely to be tax motivated, and if it is followed quicklyby a purchase, it is also not likely to be liquiditydriven. Filtering out trades more likely to have beenmade for nonspeculative reasons left me with a sub-set of trades that were likely speculative. I reran myanalysis on these speculative trades, expecting thatinvestors’ performance would improve. To my sur-prise, I found the results were actually worse. Thestocks purchased underperformed the stocks sold by5.07 pps over a one-year horizon and by 8.61 pps overa two-year horizon. As Daniel Kahneman hasobserved about this study, “It is expensive for thesepeople to have ideas.”
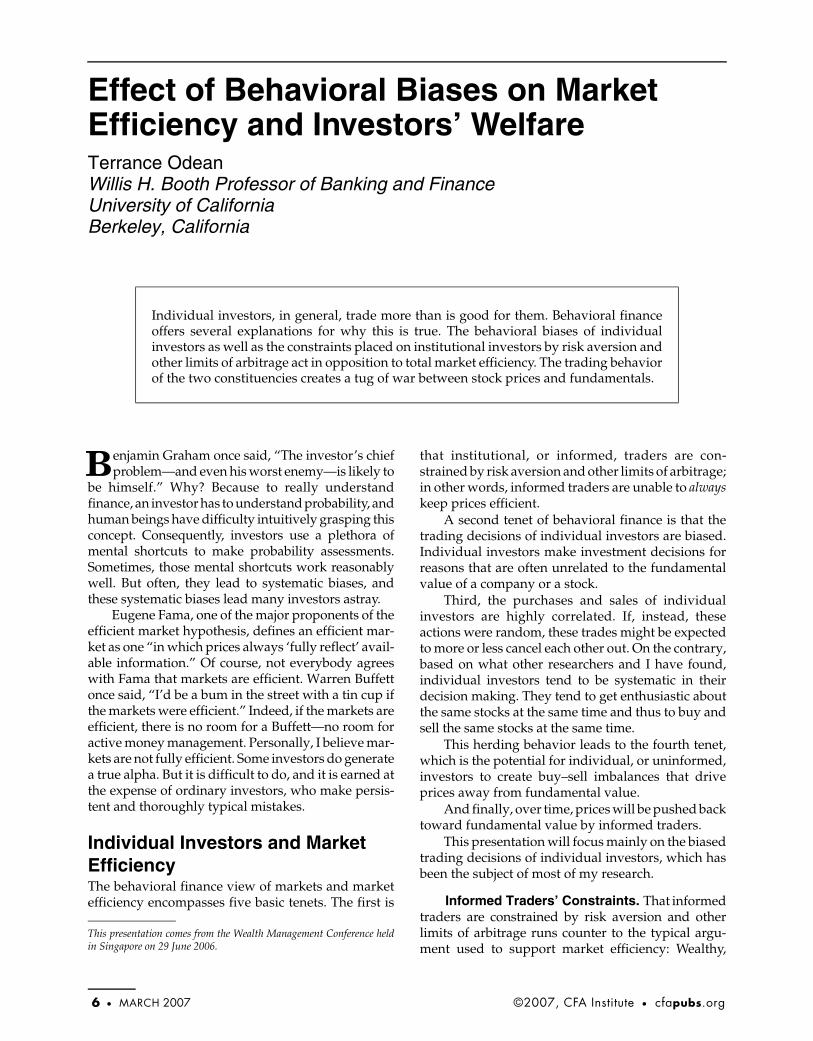
With a second, larger dataset (78,000 investors)from a discount brokerage firm, Barber and I retestedthe overconfidence hypothesis from a slightly differ-ent perspective (Barber and Odean 2000). We calcu-lated whether investors who traded more activelyearned less. Using portfolio turnover, we sorted the66,465 investors in our sample who were tradingcommon stocks into five groups ranging from buy-and-hold investors to the most active traders. Wecalculated the average net return (after commissions)for each group. Figure 1 shows the average net returnand monthly turnover for each of the five groups. Thebuy-and-hold investors (Group 1) outperformed themost active investors (Group 5), on average, by about6 pps a year.
We revisited the overconfidence theory inanother study in which we divided a large sample ofinvestors into those likely to be more overconfidentand those likely to be less overconfident (Barber andOdean 2001). Lacking a psychological assessment foreach of the traders in our sample, we used gender asa proxy for likely overconfidence. Psychologists havefound that men and women differ in their averagelevel of overconfidence, particularly so in areas per-ceived to be in the male domain, such as mathemat-ics, the mathematical sciences, and finance. To thesurprise of some, it is men who tend to be moreoverconfident in these areas.
March 07 CP.book Page 7 Monday, March 12, 2007 1:20 PM
8 • MARCH 2007 ©2007, CFA Institute • cfapubs.org
CFA Institute Conference Proceedings Quarterly
Using the same discount brokerage datasetdescribed earlier, we determined the gender of theperson who opened the account for about 30,000accounts. We then separated the sample into twosubsets: accounts opened by males and accountsopened by females. To control for situations wherean account was opened by one spouse but possiblytraded in by the other spouse, we divided each gen-der subset into two groups—married and single.
Our first prediction was that men would trademore than women, and in fact, that is what we found.Men traded 45 percent more actively than women,and single men traded 67 percent more actively thansingle women. Our second prediction was that trad-ing would hurt men’s returns more than women’s.For every account, we calculated annual buy-and-hold returns—what that account would have earnedif the investor had not traded at all—based on portfo-lio holdings at the beginning of each year. Next, wecalculated the actual return, less commissions, earnedin each account each year. The difference between thebuy-and-hold return and the actual return is what wecalled an “own benchmark annual net return.”
So, if an investor makes a couple of well-informed or just lucky trades, the own benchmarkreturn will be positive. If the investor does not tradeat all, it will be zero because the buy-and-hold andthe actual returns will be the same. And if the investormakes ill-informed or poor trades, the own bench-mark return will be negative. Not surprisingly, onaverage, both men and women underperform the
buy-and-hold return, so the own benchmark returntends to be negative for both men and women. Moresignificant, in our opinion, is that it is more negativefor men than for women. Men underperform the buy-and-hold approach by about 1 pp more a year thando women, and single men underperform by about1.4 pps more a year than do single women.
Online trading is an environment where investorscan easily become overconfident. I recall an advertise-ment some years back that said, “Online trading is likethe Old West. The slow die first.” Although the victorin the old western gunfights was the quickest draw,by the time the credits began rolling, the gunslingerswere usually lying dead in the street.
Barber and I thus analyzed the trading patternsand returns of 1,607 people who switched fromtelephone-based trading to computer-based tradingbetween 1991 and 1996 (Barber and Odean 2002). Wefound that most investors had better results beforethey began trading online; most accelerated theirtrading and traded more speculatively after goingonline. Subsequent to going online, their perfor-mance dropped. Our analysis focused on earlyadopters of online trading. Unfortunately, we havenot been able to acquire more recent data with whichto replicate this study.
One impetus for individual investors to trademore frequently online is a misperception of tradingcosts. They focus on the low commission rates andrationalize that at $8 a trade, how can I lose? Inaddition to spending the $8 to trade, individual
Figure 1. Monthly Turnover and Annual Performance of Individual Investors
1(low turnover)
5(high turnover)
2 3 4
Percent
25
20
15
10
5
0
Net Return Turnover
March 07 CP.book Page 8 Monday, March 12, 2007 1:20 PM
©2007, CFA Institute • cfapubs.org MARCH 2007 • 9
Effect of Behavioral Biases on Market Efficiency and Investors’ Welfare
investors pay the bid–ask spread and, typically,incur speculative losses; they are basically payinglow fees to lose money.
More frequent trading in an online environmentcan also occur because frictions that once took theplace of self-control have been removed. Online trad-ing may simply be too easy to do for some investors.They may trade more impulsively than they other-wise would.
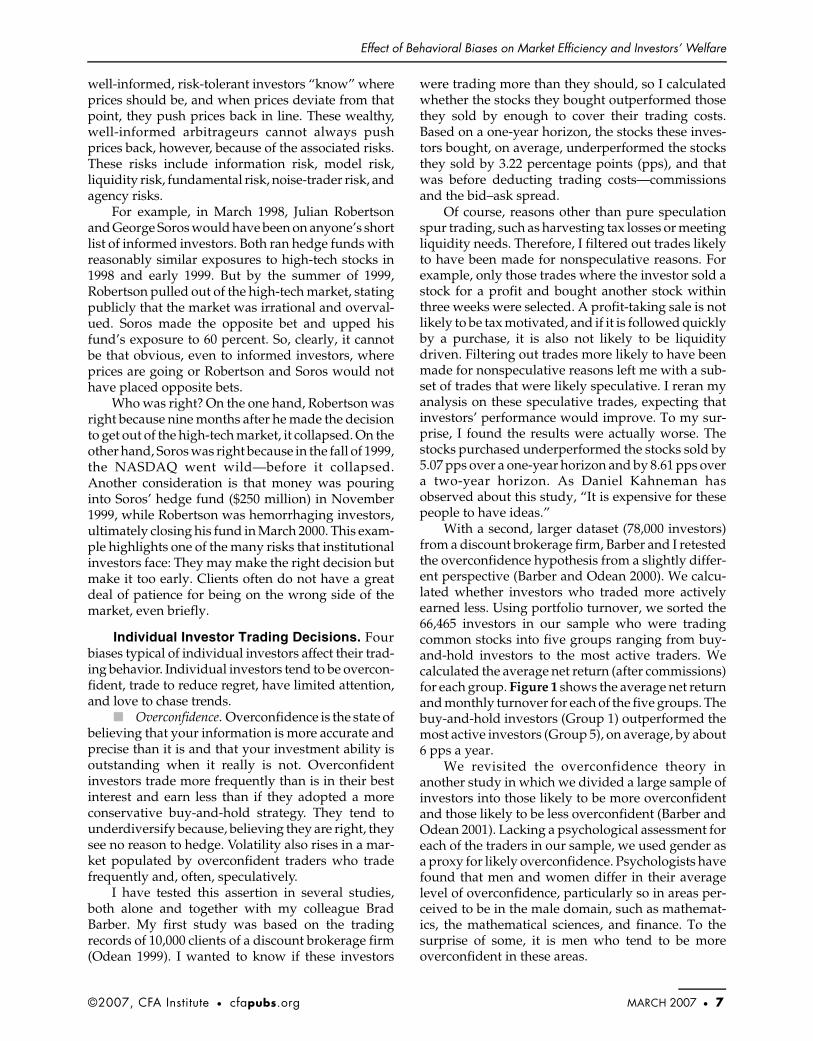
Figure 2 shows the annualized turnover of theaccounts in the online trading study before and afterthe commencement of online trading. The first onlinetrade is in Month 0 of this event study. The accountsthat switched to online trading are shown by the topline. For each of these accounts, we identified anotheraccount of similar size in the sample that was notswitched to online trading. Notice that the onlineinvestors tended to be more active investors evenbefore they went online. And immediately aftergoing online, they began to trade very actively, as ifthey were trying out a new toy. Of more seriousconcern, however, is that after this initial flurry oftrading activity, turnover settled at a higher plateauthan before these investors started trading online.They become more active—but not better—investors.
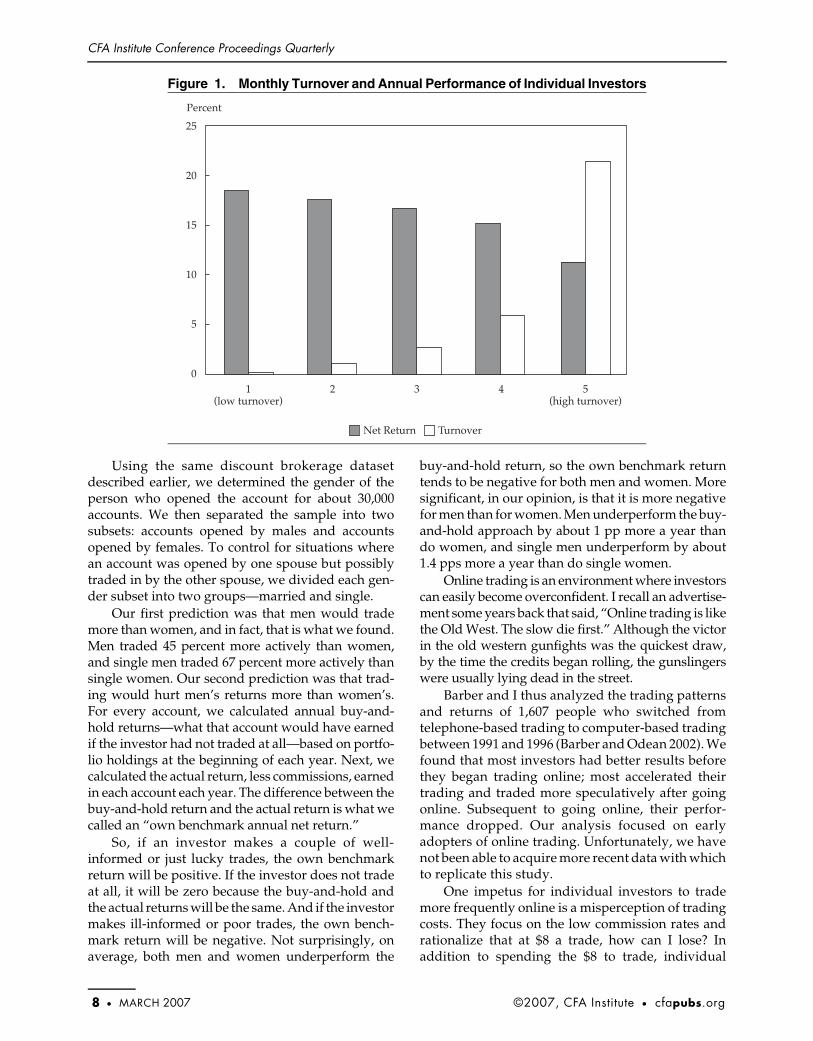
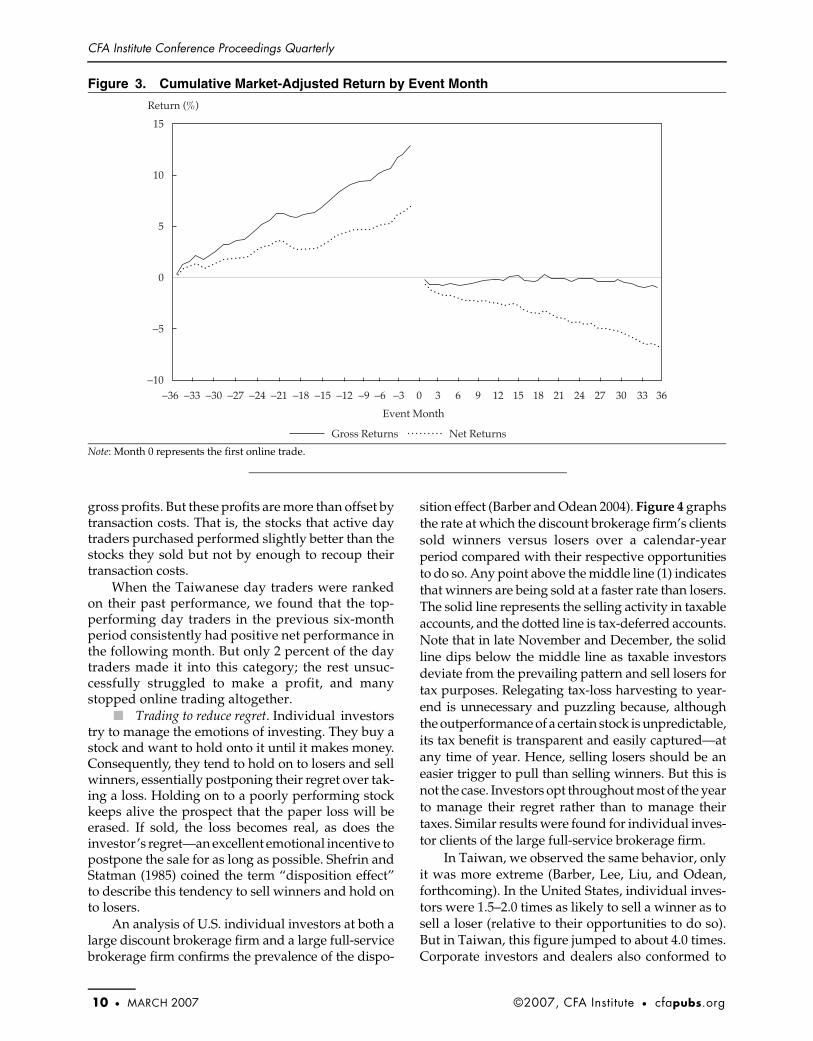
Figure 3 shows the performance results for theaccounts that were moved online. The top line is grossreturns, and the bottom line is net returns. Both aremarket adjusted (i.e., reduced by the market return for
the period). Before going online, these investors werebeating the market in terms of both gross and netreturns. After going online, their gross returns weremore or less equivalent to the market, but their netreturns were below that of the market. I doubt thatthese investors had skill that they suddenly lost whenthey went online. Rather, I suspect that their preonlineperformance was caused by luck and that after mak-ing the switch, their luck was average but theirturnover—and trading costs—was high. In any largegroup of traders, some are likely to do well for a while.By analogy, imagine that you have 1,000 coins and youflipped each of them 10 times. On average, one ofthose coins would come up heads all 10 times. Sup-pose that coin were a person; that person might beginto feel that he or she was remarkably accomplishedbecause he or she could consistently beat the market.In a sample of thousands of investors, some will dowell in any period. These investors were the ones mostlikely to go online to take advantage of the new trad-ing technology. Ironically, the new technology tookadvantage of them instead.
Another study that my colleagues and I con-ducted was to look at day traders in Taiwan (Barber,Lee, Liu, and Odean, forthcoming). We found, notsurprisingly, that most day traders lose money. Oneslightly surprising finding, however, was that themost active day traders, at least in Taiwan, do make
Figure 2. Annualized Turnover by Event Month
Note: Month 0 represents the first online trade.
Annualized Turnover (%)
140
60
40
120
100
80
20
0−24 −9 3 15−6 6 18−3 9 210−21 −18 −15 −12 12 24
Event Month
Online Size Matched
March 07 CP.book Page 9 Monday, March 12, 2007 1:20 PM
10 • MARCH 2007 ©2007, CFA Institute • cfapubs.org
CFA Institute Conference Proceedings Quarterly
gross profits. But these profits are more than offset bytransaction costs. That is, the stocks that active daytraders purchased performed slightly better than thestocks they sold but not by enough to recoup theirtransaction costs.
When the Taiwanese day traders were rankedon their past performance, we found that the top-performing day traders in the previous six-monthperiod consistently had positive net performance inthe following month. But only 2 percent of the daytraders made it into this category; the rest unsuc-cessfully struggled to make a profit, and manystopped online trading altogether.
■ Trading to reduce regret. Individual investorstry to manage the emotions of investing. They buy astock and want to hold onto it until it makes money.Consequently, they tend to hold on to losers and sellwinners, essentially postponing their regret over tak-ing a loss. Holding on to a poorly performing stockkeeps alive the prospect that the paper loss will beerased. If sold, the loss becomes real, as does theinvestor’s regret—an excellent emotional incentive topostpone the sale for as long as possible. Shefrin andStatman (1985) coined the term “disposition effect”to describe this tendency to sell winners and hold onto losers.
An analysis of U.S. individual investors at both alarge discount brokerage firm and a large full-servicebrokerage firm confirms the prevalence of the dispo-
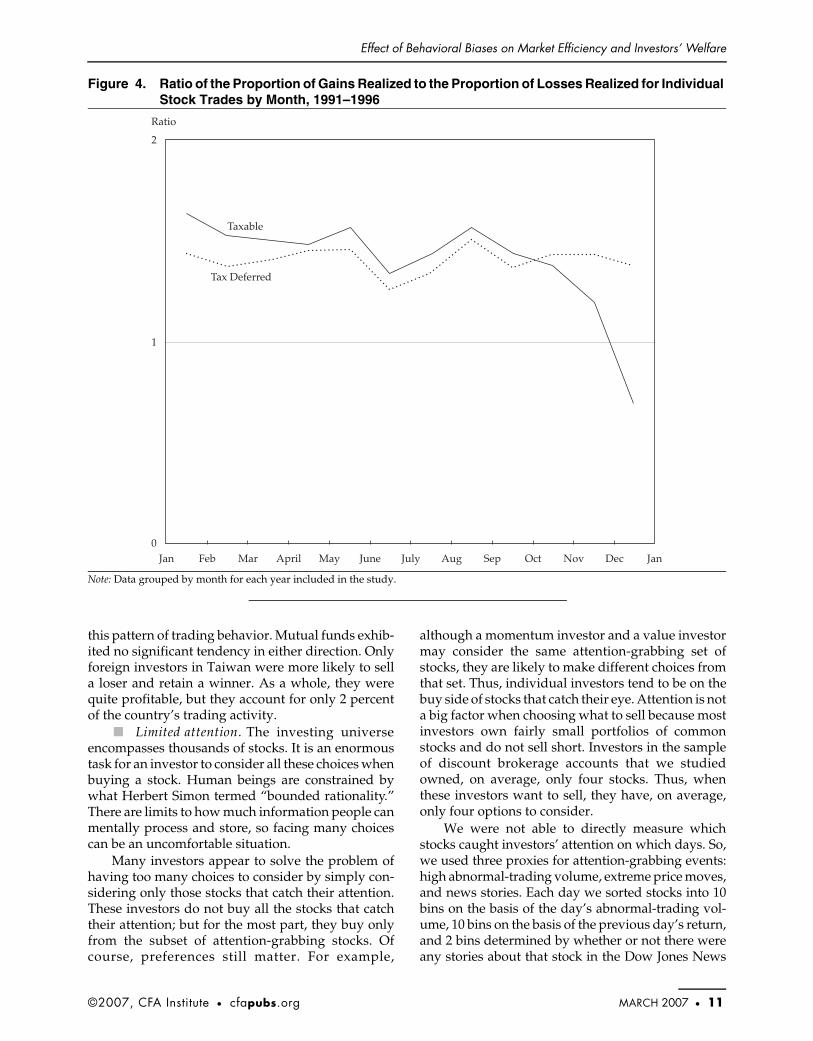
sition effect (Barber and Odean 2004). Figure 4 graphsthe rate at which the discount brokerage firm’s clientssold winners versus losers over a calendar-yearperiod compared with their respective opportunitiesto do so. Any point above the middle line (1) indicatesthat winners are being sold at a faster rate than losers.The solid line represents the selling activity in taxableaccounts, and the dotted line is tax-deferred accounts.Note that in late November and December, the solidline dips below the middle line as taxable investorsdeviate from the prevailing pattern and sell losers fortax purposes. Relegating tax-loss harvesting to year-end is unnecessary and puzzling because, althoughthe outperformance of a certain stock is unpredictable,its tax benefit is transparent and easily captured—atany time of year. Hence, selling losers should be aneasier trigger to pull than selling winners. But this isnot the case. Investors opt throughout most of the yearto manage their regret rather than to manage theirtaxes. Similar results were found for individual inves-tor clients of the large full-service brokerage firm.
In Taiwan, we observed the same behavior, onlyit was more extreme (Barber, Lee, Liu, and Odean,forthcoming). In the United States, individual inves-tors were 1.5–2.0 times as likely to sell a winner as tosell a loser (relative to their opportunities to do so).But in Taiwan, this figure jumped to about 4.0 times.Corporate investors and dealers also conformed to
Figure 3. Cumulative Market-Adjusted Return by Event Month
Note: Month 0 represents the first online trade.
Return (%)
15
0
10
5
−5
−10−36 −9 3 15−6 6 18−3 9 210−21−24−27−30−33 −18 −15 −12 12 24 27 30 33 36
Event Month
Gross Returns Net Returns
March 07 CP.book Page 10 Monday, March 12, 2007 1:20 PM
©2007, CFA Institute • cfapubs.org MARCH 2007 • 11
Effect of Behavioral Biases on Market Efficiency and Investors’ Welfare
this pattern of trading behavior. Mutual funds exhib-ited no significant tendency in either direction. Onlyforeign investors in Taiwan were more likely to sella loser and retain a winner. As a whole, they werequite profitable, but they account for only 2 percentof the country’s trading activity.
■ Limited attention. The investing universeencompasses thousands of stocks. It is an enormoustask for an investor to consider all these choices whenbuying a stock. Human beings are constrained bywhat Herbert Simon termed “bounded rationality.”There are limits to how much information people canmentally process and store, so facing many choicescan be an uncomfortable situation.
Many investors appear to solve the problem ofhaving too many choices to consider by simply con-sidering only those stocks that catch their attention.These investors do not buy all the stocks that catchtheir attention; but for the most part, they buy onlyfrom the subset of attention-grabbing stocks. Ofcourse, preferences still matter. For example,
although a momentum investor and a value investormay consider the same attention-grabbing set ofstocks, they are likely to make different choices fromthat set. Thus, individual investors tend to be on thebuy side of stocks that catch their eye. Attention is nota big factor when choosing what to sell because mostinvestors own fairly small portfolios of commonstocks and do not sell short. Investors in the sampleof discount brokerage accounts that we studiedowned, on average, only four stocks. Thus, whenthese investors want to sell, they have, on average,only four options to consider.
We were not able to directly measure whichstocks caught investors’ attention on which days. So,we used three proxies for attention-grabbing events:high abnormal-trading volume, extreme price moves,and news stories. Each day we sorted stocks into 10bins on the basis of the day’s abnormal-trading vol-ume, 10 bins on the basis of the previous day’s return,and 2 bins determined by whether or not there wereany stories about that stock in the Dow Jones News
Figure 4. Ratio of the Proportion of Gains Realized to the Proportion of Losses Realized for Individual Stock Trades by Month, 1991–1996
Note: Data grouped by month for each year included in the study.
Ratio
2
1
0Jan Oct Nov DecJuneMayAprilMarFeb July Aug Sep Jan
Taxable
Tax Deferred
March 07 CP.book Page 11 Monday, March 12, 2007 1:20 PM
12 • MARCH 2007 ©2007, CFA Institute • cfapubs.org
CFA Institute Conference Proceedings Quarterly
feed. We reasoned that high abnormal-trading vol-ume is indicative of investors paying attention to astock, that investors are likely to be paying attentionto stocks that have experienced extreme price moves,and that investors are more likely to pay attention tostocks that are in the news.
Analyzing data from the two brokerage firmsmentioned above (a large discount brokerage firmwith roughly 66,000 investors and a large retail bro-kerage firm with about 670,000 investors) and a thirdfirm (a small discount brokerage firm with around14,500 investors), we calculated the average dailyimbalance in purchases and sales for each bin. Theimbalance was calculated as the number of purchasesminus the number of sales divided by the number ofpurchases plus the number of sales. The higher thisratio, the greater the number of individual investorson the buy side of the market. Of course, the marketas a whole has an adding-up constraint in dollarterms; for every dollar bought, a dollar must be sold.Therefore, when individual investors are on the buyside of the market, other investors—institutionalinvestors of some sort—must be on the sell side of themarket. We found dramatic evidence that individualinvestors tend to be on the buy side of the market forattention-grabbing stocks.
■ Chasing trends . Although overconfidence,limited attention, and the disposition effect are perva-sive among individual investors and lead to lower netreturns, the strongest trading bias of all is trend chas-ing. In our large discount brokerage data sample, wefound that 39 percent of new money invested inmutual funds went into the 10 percent of funds thathad the best performance in the prior year, and morethan half the new money went into the top-performing20 percent of funds (Barber, Odean, and Zheng 2000).Individual investors thus chase the trend, hiringmoney managers who performed well in the prioryear despite the fact that academic studies haverepeatedly shown that one year’s performance is nota good predictor of a manager’s ability.
Not only do investors hire money managers theywish they had hired the previous year, but they alsotend to buy the stocks they wish they had owned theprevious year. I believe that most investors think themarket is more deterministic than it actually is.Although the market is not completely random, it ismore random than many investors acknowledge.Relying on their deterministic interpretations of themarket, investors expect past patterns to repeat anddoggedly chase these patterns. Human beings havean innate ability to quickly see patterns, both truepatterns and illusory ones. Although this abilityundoubtedly served us well in terms of evolutionarysurvival, it can be costly to the average investor. The
investor who constantly perceives patterns in themarket and trades on the assumption that these pat-terns will persist is, on average, a poorer investor.
Correlation of Purchases and Sales. Thethird behavioral finance tenet mentioned before isthat the purchases and sales of individual investorsare highly correlated. My colleagues Brad Barber andNing Zhu and I (Barber, Odean, and Zhu 2006b) havetested this hypothesis using several analyses anddifferent datasets. We obtained consistent resultsusing different methods and different data: The pur-chases and sales of individual investors are highlycorrelated both across stocks and over time. Forexample, we arbitrarily divided the 670,000 investorswith accounts at a large retail brokerage into twogroups. We calculated for each group the proportionof trades in each stock that were purchased eachmonth. We found that the correlation of these propor-tions between the two groups was quite high—75percent. Furthermore, the proportion of these inves-tors’ trades in a stock that was purchased one monthwas highly correlated with the proportion purchasedthe next month. In other words, individual investorstend to buy, or sell, the same stocks as each otherduring the same month and tend to buy, or sell, thesame stocks that they bought, or sold, the previousmonth. Because individual investors all jump in onthe same side of the market for a stock at the sametime, they have the potential to move a stock’s pricein a significant way.
Noise Traders’ and Informed Traders’ Effectson Prices. To test the fourth and fifth behavioralfinance tenets, that uninformed investors push pricesaway from fundamental value and that informed trad-ers push them back, Brad Barber, Ning Zhu, and I(Barber, Odean, and Zhu 2006a) analyzed 18 years oftransactional data on the NYSE, Amex, and NASDAQ.We used small trades as a proxy for trades by individ-ual investors and used an algorithm developed byCharles Lee and Mark Ready (Lee and Ready 1991) todetermine whether a trade was initiated by the buyeror the seller. We measured the proportion of smalltrades that were buyer initiated for each stock on aweekly and an annual basis and evaluated how theseproportions forecasted future returns. Using a weeklyanalysis, we found that the prices of stocks that werebought heavily by individual investors tended to riseduring the week that individuals were buying andduring the subsequent two weeks. A month later, thispattern reversed and these stocks underperformed.Thus, it appears that individual investors create pricepressures that push a stock’s price up for a couple ofweeks before it begins to drift back down.
March 07 CP.book Page 12 Monday, March 12, 2007 1:20 PM
©2007, CFA Institute • cfapubs.org MARCH 2007 • 13
Effect of Behavioral Biases on Market Efficiency and Investors’ Welfare
For our annual-horizon analysis, we constructedportfolios that were long stocks heavily bought bysmall traders during the previous year and shortstocks heavily sold. We calculated the buy-and-holdperformance of those long–short portfolios over thesubsequent year. We found that our long–short port-folio had an average annual return of –4.4 pps. Whenwe restricted our analysis to the 30 percent of stocksmost actively traded by small traders, the long–shortportfolio had an average annual return of –13.2 pps.This finding suggests that during the year when indi-viduals were mostly buying (selling) stocks, theydrove the prices too high (low); during the subse-quent year, stocks previously bought by individualsunderperformed those previously sold as the mis-pricing of the previous year reversed itself.
When we sorted stocks on both small and largetrades, we found that the stocks sold by individualinvestors and bought by institutional investors had apositive alpha the next year of about 20 bps a month.In contrast, the stocks bought by individuals and soldby institutions had a negative alpha the next year ofabout 28 bps a month. We also found that stocks withmostly buyer-initiated trades for both large and smalltrade sizes (i.e., individual and institutional inves-tors) tended to subsequently underperform stockswith mostly seller-initiated trades for both large andsmall trade sizes. Thus, it appears that when bothinstitutions and individuals get excited about thesame stocks, they drive the price too high and sufferthe consequences of a significant downward drift thefollowing year.
Investor WelfareTo protect their own welfare, individual investorswould do well to recognize that by trading actively,they not only pay high transaction costs but also runthe risk of trading with better informed institutionalinvestors.
Brad Barber, Yi-Tsung Lee, Yu-Jane Liu, and Iassessed the welfare implications of trading in “JustHow Much Do Investors Lose by Trading?” (Barber,Lee, Liu, and Odean 2006). We analyzed a databasethat included every trade and every order placed byevery investor on the Taiwan Stock Exchange from1995 through 1999. We calculated the gains andlosses, or gross trading profits, from trades betweenindividual investors and institutional investors inTaiwan as well as the gains and losses from markettiming, or gross market-timing profits; the commis-sions that both groups paid; and the 30 bp transactiontax levied on all sellers. The daily trading profits, netof transaction costs, can thus be measured in millions
of New Taiwan (NT) dollars.1 Institutional investors,even on a net-cost basis, came out well ahead, chalk-ing up mean daily net profits of NT$171.8 million.Individual investors, in contrast, lost money on theirtrading even before deducting commissions andtransaction taxes. Net losses of individual investorsin aggregate averaged a sizable NT$669.7 millioneach day. This result leads to the question: Are insti-tutional investors profiting from superior informa-tion or from the mistakes of individual investors?
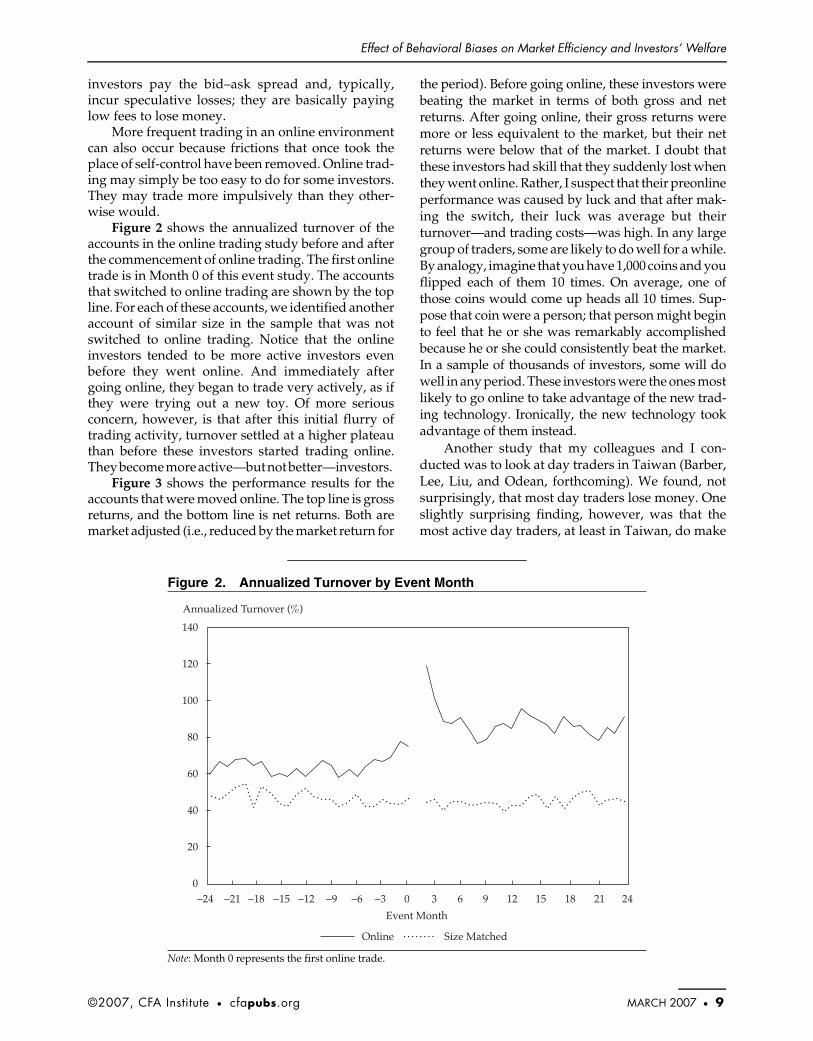
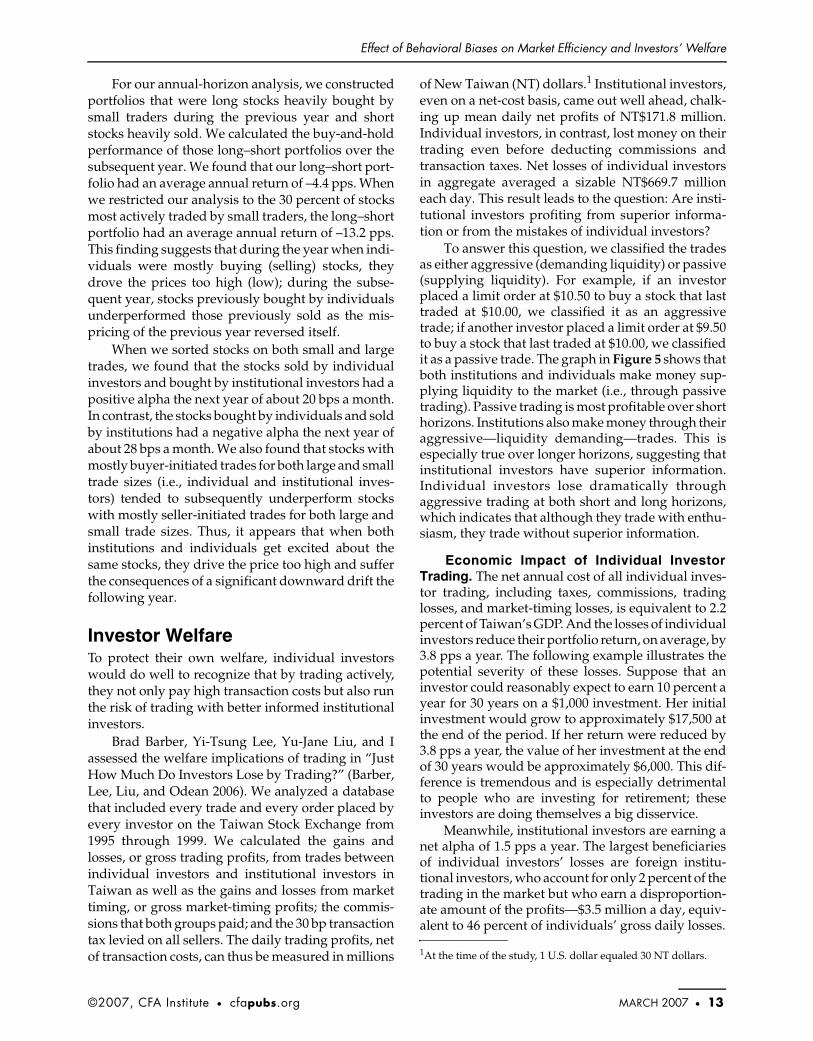
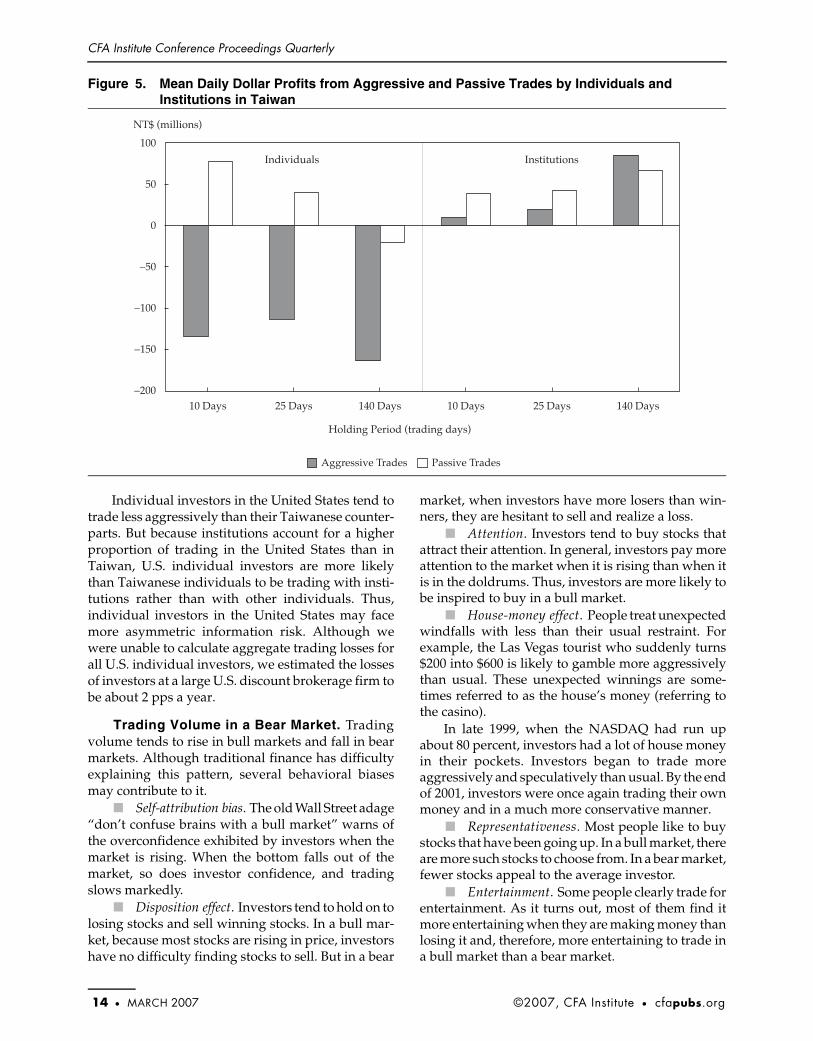
To answer this question, we classified the tradesas either aggressive (demanding liquidity) or passive(supplying liquidity). For example, if an investorplaced a limit order at $10.50 to buy a stock that lasttraded at $10.00, we classified it as an aggressivetrade; if another investor placed a limit order at $9.50to buy a stock that last traded at $10.00, we classifiedit as a passive trade. The graph in Figure 5 shows thatboth institutions and individuals make money sup-plying liquidity to the market (i.e., through passivetrading). Passive trading is most profitable over shorthorizons. Institutions also make money through theiraggressive—liquidity demanding—trades. This isespecially true over longer horizons, suggesting thatinstitutional investors have superior information.Individual investors lose dramatically throughaggressive trading at both short and long horizons,which indicates that although they trade with enthu-siasm, they trade without superior information.
Economic Impact of Individual InvestorTrading. The net annual cost of all individual inves-tor trading, including taxes, commissions, tradinglosses, and market-timing losses, is equivalent to 2.2percent of Taiwan’s GDP. And the losses of individualinvestors reduce their portfolio return, on average, by3.8 pps a year. The following example illustrates thepotential severity of these losses. Suppose that aninvestor could reasonably expect to earn 10 percent ayear for 30 years on a $1,000 investment. Her initialinvestment would grow to approximately $17,500 atthe end of the period. If her return were reduced by3.8 pps a year, the value of her investment at the endof 30 years would be approximately $6,000. This dif-ference is tremendous and is especially detrimentalto people who are investing for retirement; theseinvestors are doing themselves a big disservice.
Meanwhile, institutional investors are earning anet alpha of 1.5 pps a year. The largest beneficiariesof individual investors’ losses are foreign institu-tional investors, who account for only 2 percent of thetrading in the market but who earn a disproportion-ate amount of the profits—$3.5 million a day, equiv-alent to 46 percent of individuals’ gross daily losses.
1At the time of the study, 1 U.S. dollar equaled 30 NT dollars.
March 07 CP.book Page 13 Monday, March 12, 2007 1:20 PM
14 • MARCH 2007 ©2007, CFA Institute • cfapubs.org
CFA Institute Conference Proceedings Quarterly
Individual investors in the United States tend totrade less aggressively than their Taiwanese counter-parts. But because institutions account for a higherproportion of trading in the United States than inTaiwan, U.S. individual investors are more likelythan Taiwanese individuals to be trading with insti-tutions rather than with other individuals. Thus,individual investors in the United States may facemore asymmetric information risk. Although wewere unable to calculate aggregate trading losses forall U.S. individual investors, we estimated the lossesof investors at a large U.S. discount brokerage firm tobe about 2 pps a year.
Trading Volume in a Bear Market. Tradingvolume tends to rise in bull markets and fall in bearmarkets. Although traditional finance has difficultyexplaining this pattern, several behavioral biasesmay contribute to it.
■ Self-attribution bias. The old Wall Street adage“don’t confuse brains with a bull market” warns ofthe overconfidence exhibited by investors when themarket is rising. When the bottom falls out of themarket, so does investor confidence, and tradingslows markedly.
■ Disposition effect. Investors tend to hold on tolosing stocks and sell winning stocks. In a bull mar-ket, because most stocks are rising in price, investorshave no difficulty finding stocks to sell. But in a bear
market, when investors have more losers than win-ners, they are hesitant to sell and realize a loss.
■ Attention. Investors tend to buy stocks thatattract their attention. In general, investors pay moreattention to the market when it is rising than when itis in the doldrums. Thus, investors are more likely tobe inspired to buy in a bull market.
■ House-money effect. People treat unexpectedwindfalls with less than their usual restraint. Forexample, the Las Vegas tourist who suddenly turns$200 into $600 is likely to gamble more aggressivelythan usual. These unexpected winnings are some-times referred to as the house’s money (referring tothe casino).
In late 1999, when the NASDAQ had run upabout 80 percent, investors had a lot of house moneyin their pockets. Investors began to trade moreaggressively and speculatively than usual. By the endof 2001, investors were once again trading their ownmoney and in a much more conservative manner.
■ Representativeness. Most people like to buystocks that have been going up. In a bull market, thereare more such stocks to choose from. In a bear market,fewer stocks appeal to the average investor.
■ Entertainment. Some people clearly trade forentertainment. As it turns out, most of them find itmore entertaining when they are making money thanlosing it and, therefore, more entertaining to trade ina bull market than a bear market.
Figure 5. Mean Daily Dollar Profits from Aggressive and Passive Trades by Individuals and Institutions in Taiwan
25 Days10 Days 10 Days 25 Days 140 Days
NT$ (millions)
Individuals
Holding Period (trading days)
Institutions
100
50
0
−50
−100
−150
−200
Aggressive Trades Passive Trades
140 Days
March 07 CP.book Page 14 Monday, March 12, 2007 1:20 PM
©2007, CFA Institute • cfapubs.org MARCH 2007 • 15
Effect of Behavioral Biases on Market Efficiency and Investors’ Welfare
Inexperienced Investors. From 1995 to 1998,the number of U.S. households investing directly instocks grew by 30 percent. What advice should suchinvestors be given? Instead of focusing on beating themarket—a goal that the majority of individuals failat—individual investors should pay attention to thethings they can control. They should invest for thelong run, buy and hold, diversify, control tradingcosts and management fees, and pay attention totaxes—not focus on trying to beat the market. Mostfinancial advisers are not great stock pickers. Butgood advisers will steer their clients toward soundinvestment practices and restrain a client from shoot-ing himself or herself in the financial foot.
Advertising by the brokerage industry oftenencourages investors to trade actively. The advertis-ing industry knows which behavioral buttons topush. Advertisements by U.S. financial firms thatencourage do-it-yourself investing (trading) preachseveral lessons:• “You are in control.”• “Data equal expertise.”• “Trading is easy; anybody can do it.”• “Trading is fun and exciting.”• “Opportunities may arise at any moment, so
always be ready to trade.”One advertisement titled “Prefers to Do It Alone”depicts a sweet young woman. The ad reads, “Inde-pendent, confident, you are ready to trade futures onthe Internet. You do not need a broker’s help. Youwant it all. Speed, convenience, control.” If thisyoung woman walked into an investment adviser’soffice and asked if she should be trading futures onthe internet, how many would say, “Good idea”?
About six years ago at a friend’s dinner party, afellow guest, a doctor, started discussing commoditymarkets with me. I asked why she was so interestedin commodities, and she explained that she had justtaken a weekend course in how to trade futures onthe internet. When I responded that trading com-modities is rather risky, she said, “Oh, no, no. Theytaught us how to do this.” She actually said (remem-ber, she is a doctor), “If things go well enough, I thinkI might quit my job and start doing this seriously.”She had, at the time, invested only $5,000 in commod-
ity trading. Somewhat to her annoyance, I said that Ihoped—for her sake—that she lost most of that$5,000 quickly. The real tragedy, as I saw it, would bethat short-term gains would motivate her to investmore money and, inevitably, incur larger losses.
Many discount brokerage advertisements toutthat a firm will put the investor in control. Control ofwhat? The average investor wants control over retire-ment wealth, over the returns in his or her portfolio.But the brokerage firm can only give the investorcontrol over which stocks he or she buys and sells,not control over returns. This is like a casino adver-tising that gamblers are in control of the roulettewheel because the gamblers get to choose the num-bers that they bet on. Such control does not amountto very much.
Advertisements bombard investors from allangles—television, magazines, radio, online—encouraging spontaneous, frequent trading; assuringus that “anybody” can do it; championing the com-mon man’s, even the stay-at-home mom’s, ability totrade. But we do not live in a world where truckdrivers routinely buy islands with their trading prof-its. In our world, active, speculative trading resultsin lower returns for most investors.
ConclusionBehavioral finance offers insights into how the trad-ing biases of individual investors influence stockreturns and lower investor welfare. The tradingbehavior of individual investors reflects their over-confidence, a limited ability to assimilate largeamounts of data, the desire to postpone regret, and apenchant for chasing trends. Individual investortrading influences stock returns. Stocks heavilybought by individuals tend to outperform thoseheavily sold during the week in which trading ismeasured and during the following two weeks; sub-sequently, these stocks underperform. Active, specu-lative trading by individual investors leads tosubstantially lower portfolio performance.
This article qualifies for 0.5 PD credits.
March 07 CP.book Page 15 Monday, March 12, 2007 1:20 PM
16 • MARCH 2007 ©2007, CFA Institute • cfapubs.org
CFA Institute Conference Proceedings Quarterly
REFERENCES
Barber, Brad, and Terrance Odean. 2000. “Trading Is Hazardous toYour Wealth: The Common Stock Investment Performance of Indi-vidual Investors.” Journal of Finance, vol. 55, no. 2 (April):773–806.
———. 2001. “Boys Will Be Boys: Gender, Overconfidence, andCommon Stock Investment.” Quarterly Journal of Economics, vol. 116,no. 1 (February):261–292.
———. 2002. “Online Investors: Do the Slow Die First?” Review ofFinancial Studies, vol. 15, no. 2 (March):455–487.
———. 2004. “Are Individual Investors Tax Savvy? Evidence fromRetail and Discount Brokerage Accounts.” Journal of Public Econom-ics, vol. 88, nos. 1–2 (January):419–442.
Barber, Brad, Terrance Odean, and Lu Zheng. 2000. “The Behaviorof Mutual Fund Investors.” Working paper, University of Califor-nia at Davis (September).
Barber, Brad, Terrance Odean, and Ning Zhu. 2006a. “Do NoiseTraders Move Markets?” EFA 2006 Zurich Meetings Paper (Sep-tember): http://ssrn.com/abstract=869827.
———. 2006b. “Systematic Noise.” AFA 2004 San Diego MeetingsPaper (May): http://papers.ssrn.com/sol3/papers.cfm?abstract_id=474481.
Barber, Brad, Yi-Tsung Lee, Yu-Jane Liu, and Terrance Odean.2006. “Just How Much Do Individual Investors Lose by Trading?”AFA 2006 Boston Meetings Paper (October): http://ssrn.com/abstract=529062.
———. Forthcoming. “Is the Aggregate Investor Reluctant to Real-ize Losses? Evidence from Taiwan.” European Financial Management.
Lee, Charles M.C., and Mark Ready. 1991. “Inferring Trade Direc-tion from Intraday Data.” Journal of Finance, vol. 46, no. 2(June):733–746.
Odean, Terrance. 1999. “Do Investors Trade Too Much?” AmericanEconomic Review, vol. 89, no. 5 (December):1279–1298.
Shefrin, Hersh, and Meir Statman. 1985. “The Disposition to SellWinners Too Early and Ride Losers Too Long: Theory and Evi-dence.” Journal of Finance, vol. 40, no. 3 (July):777–790.
March 07 CP.book Page 16 Monday, March 12, 2007 1:20 PM
©2007, CFA Institute • cfapubs.org MARCH 2007 • 17
Q&A: Odean
Question and Answer SessionTerrance Odean
Question: Compared with your Taiwanese research, is there equiv-alent research on more mature mar-kets where the investor might be more educated or sophisticated?
Odean: Such research would require a time-series observation. Some psychological research sug-gests that cultural differences do influence such biases as overconfi-dence. The research suggests, for example, that the Chinese people, on average, tend to be more over-confident than those in the United States or Japan. This is consistent with the trading behavior we’ve observed. The data from Taiwan show extremely high turnover rates. Taiwanese investors are doing so poorly largely because they trade so much and run their trading costs up.
In Taiwan, because 89 percent of trades are made by individuals, there is about a 90 percent chance that the counterparty to an individ-ual’s trade is another individual who is no better informed than the first; there is not a big asymmetric information problem on the aver-age trade. In the United States, there is a higher chance that the individ-ual investor is placing a trade for which the counterparty is an insti-tutional investor, and hence, a greater asymmetric information risk exists for individual investors.
Another difference between the two countries is that Taiwanese investors are trading too much, triggering unnecessarily high transaction costs that offset the potential benefit of a more sym-metric information environment. In contrast, U.S. investors are trad-ing less actively, which keeps their costs down and lowers the perfor-mance drag of a more asymmetri-cal market in terms of information.
Question: Is your research being used by industry organizations or regulators to deal with the issue of misleading advice?
Odean: The American Associa-tion of Retired Persons (AARP) asked me if I would evaluate the trend in investment ads over the 1990s. We hired independent eval-uators to watch about 500 ads, and we found a definite trend toward more irresponsible ads—ads that pushed the psychological buttons of an illusion of control and over-confidence, encouraging underdi-versification and active trading. I agree that some of these ads push the boundary of reasonableness. In particular, the suggestion that buy-ing mutual funds is for losers is bad advice. The United States places a high premium on freedom of speech, even the freedom to say something that is not so clever or even correct.
Question: Can your findings be generalized to institutional investors?
Odean: I don’t think it is possible to extrapolate institutional inves-tor behavior from individual investor behavior. Institutional investors begin with the same human biases of individual inves-tors but are more likely to operate with developed rules learned from experience and assimilated theory. I am sure there are institutional investors who trade too much for their own good, but others have very active, successful strategies.
We do observe that institu-tional investors, like their individ-ual counterparts, indulge the tendency to hold on to losers and to sell winners. There are excep-tions, but in general, the disposi-tion effect holds for both institutional and individual inves-
tors; no one likes to accept that they make mistakes.
Question: What would be the most important, or the biggest, biases among institutional inves-tors from a behavioral finance point of view?
Odean: The most serious institu-tional behavioral bias is to have too much faith in your model. If you put too much faith in your model, you may start to believe that the world follows your model, rather than that your model, more or less, attempts to track the world.
There are different ways to frame what went wrong at Long-Term Capital Management, but one way of framing it is that the principals placed too much faith in their model. They developed a model based on historical returns and began to believe it explained “the way the world works.” In the institutional environment, the overconfidence that causes indi-viduals to trade can morph into too much faith in the model, too much leverage behind the strategy.
Question: Is there an area where individual investors are particu-larly vulnerable to their own often misguided trading behaviors?
Odean: Yes. One of my biggest concerns is retirement savings in the United States. Traditionally, most workers had pension plans through which they were guaran-teed a certain level of income in their retirement years. Now, com-panies are quickly shifting to 401(k) and 403(b) plans, which are defined-contribution plans. With these plans, investors get to make the investment decisions about the money they are saving for their retirement.
March 07 CP.book Page 17 Monday, March 12, 2007 1:20 PM
18 • MARCH 2007 ©2007, CFA Institute • cfapubs.org
CFA Institute Conference Proceedings Quarterly
This worries me because U.S. investors are not very sophisti-cated. The average 401(k) partici-pant has never been given any formal education in how markets work and is susceptible to making a lot of mistakes. No one wants to learn from mistakes that they can’t
recover from. Retirement savings is not a good arena for learning the ins and outs of investing. No one gets a second chance.
One of the biggest, and most prevalent, mistakes from an eco-nomic and risk perspective is for a worker to put all of his or her retire-
ment savings in the stock of the company he or she works for. Take, for example, Enron Corporation. When Enron went bankrupt, some employees in their late 50s and early 60s lost not only their jobs but also all of their retirement savings.
March 07 CP.book Page 18 Monday, March 12, 2007 1:20 PM