efficient locality approximation from timesteffan/workshops/08/cdp/shen.pdf · efficient locality...
TRANSCRIPT

Efficient Locality Approximation from Time
Xipeng ShenThe College of William and Mary
Joint work with Jonathan Shaw
at Shaw Technologies Inc., Tualatin, OR

Xipeng Shen @ College of William & Mary
Locality is Important
2
L1L2
L3
Mem
Threads
• Traditional reasons: memory wall, deeper memory hierarchy.
• New trends: more common and complex cache sharing.
Xipeng Shen @ College of William & Mary
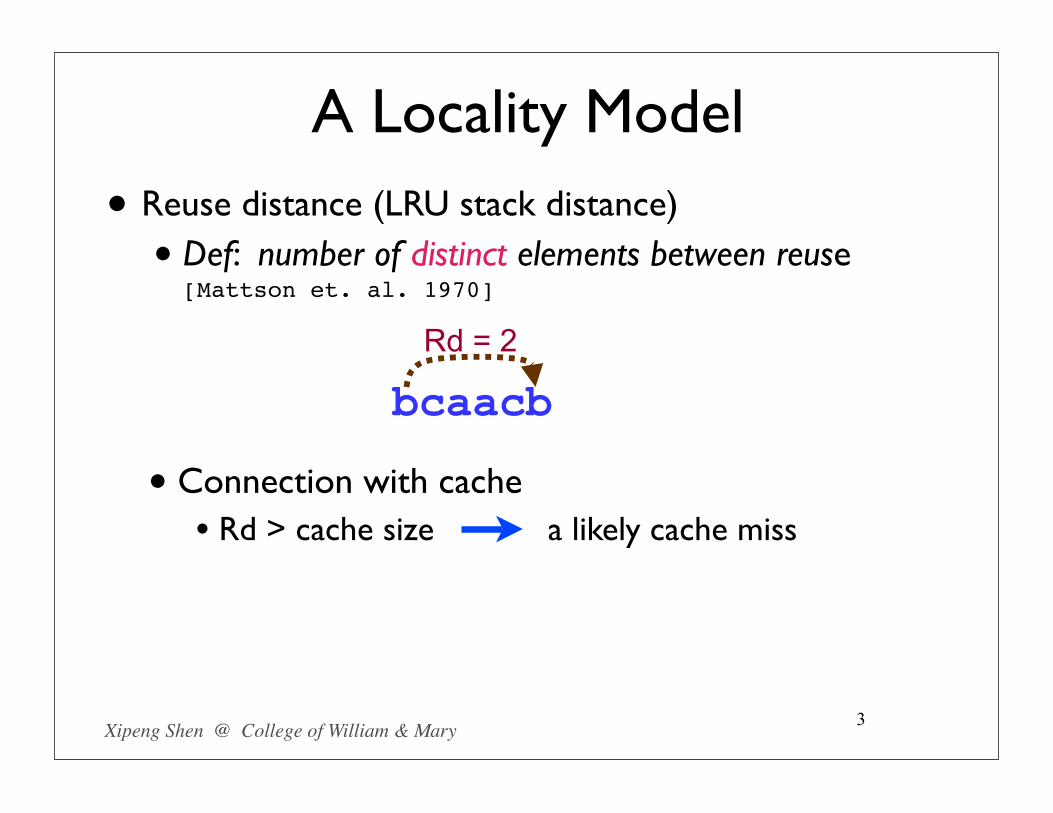
A Locality Model
• Reuse distance (LRU stack distance)
• Def: number of distinct elements between reuse[Mattson et. al. 1970]
bcaacbRd = 2
• Connection with cache• Rd > cache size a likely cache miss
3
Xipeng Shen @ College of William & Mary
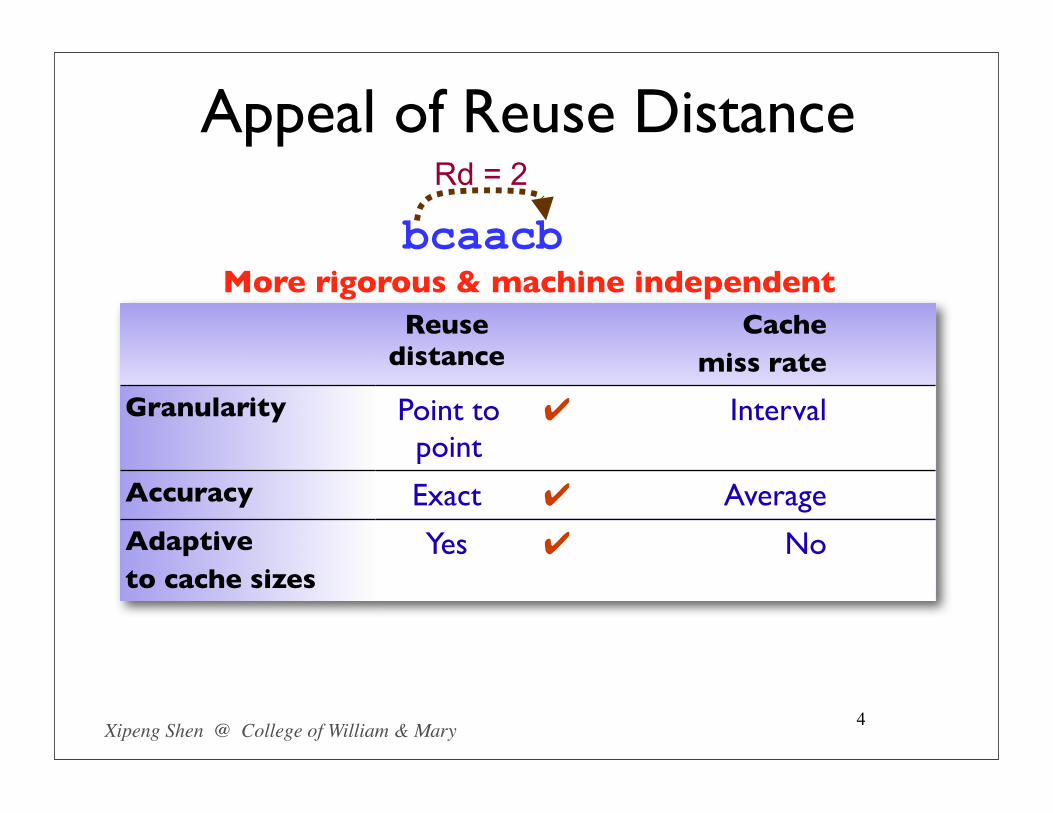
Appeal of Reuse Distance
4
Reuse distance
Cache miss rate
Granularity
Accuracy
Adaptiveto cache sizes
Point to point
✔ Interval
Exact ✔ Average
Yes ✔ No
bcaacbRd = 2
More rigorous & machine independent

Xipeng Shen @ College of William & Mary
Many Uses in Research• Study cache reuses [Ding+:SC04,Huang+:ASPLOS05]
• Guide and evaluate program transformation [Almasi+:MSP02, Ding+:PLDI03]
• Predict locality phases [Shen+:ASPLOS04]
• Discover locality-improving refactoring [Beyls+:HPCC06]
• Model cache sharing [Chandra+:HPCA05, Jiang+:EuroPar08]
• Insert cache hints [Beyls+:JSA05]
• Manage superpages [Cascaval+:PACT05]
• Guide memory disambiguation [Fang+:PACT05]
• Predict program performance [Marin+:SIGMETRICS04,Zhong+:TOC07]
• Model reference affinity [Zhong+:PLDI04]
• ... ...5
Xipeng Shen @ College of William & Mary
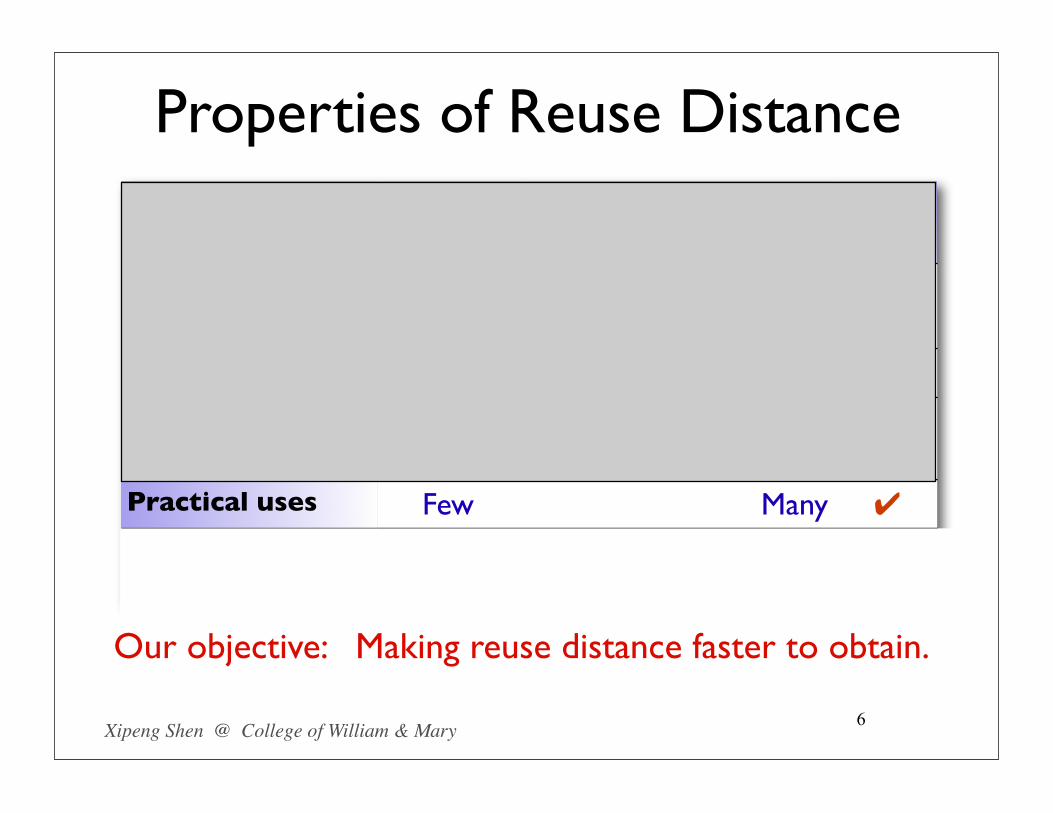
Properties of Reuse Distance
Our objective: Making reuse distance faster to obtain.
6
Reuse distance
Cache miss rate
Granularity
Accuracy
Adaptiveto cache sizes
Practical uses
Measure overhead
Point to point
✔ Interval
Exact ✔ Average
Yes ✔ No
Few Many ✔
Very high Low ✔

Xipeng Shen @ College of William & Mary
Outline
• Reuse distance measurement
• Efficient approximation of reuse distance (17X speedup)
• Algorithmic extensions (1 order of magnitude less)
• Implementation optimizations (3.3X speedup)
• Evaluation tool: trace generator
• Evaluation
• Conclusions
7
Xipeng Shen @ College of William & Mary
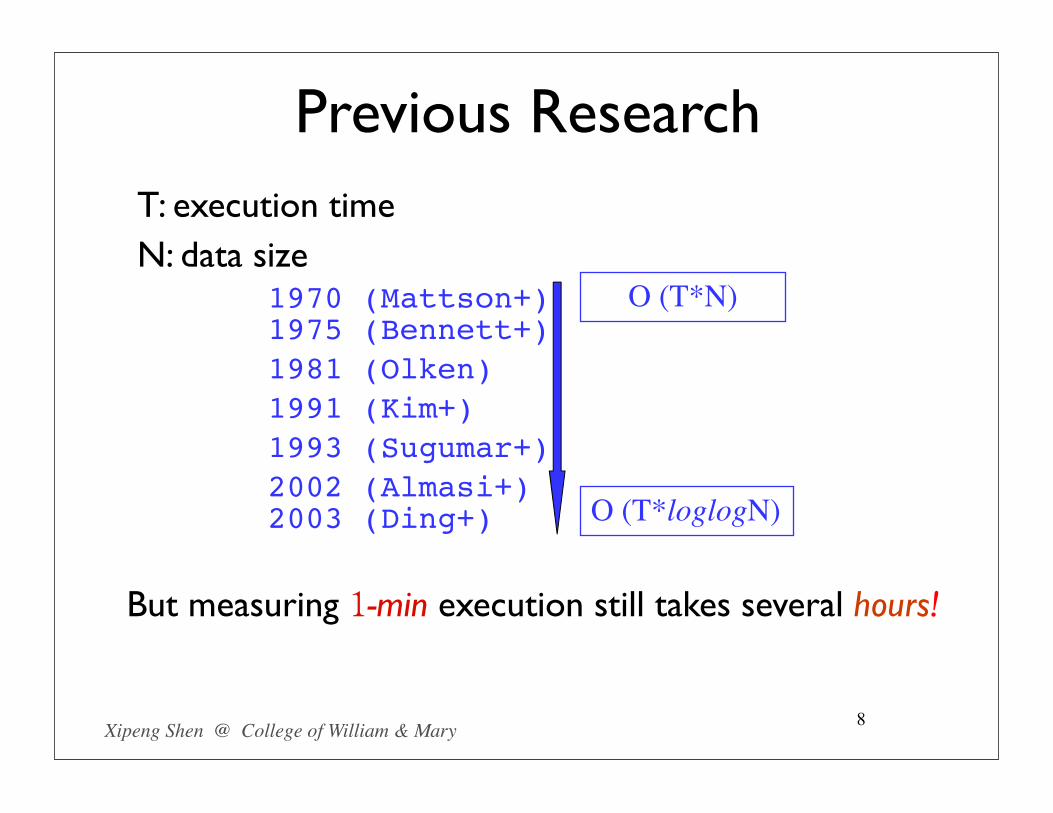
Previous ResearchT: execution timeN: data size
8
1970 (Mattson+)
2003 (Ding+)
O (T*N)
O (T*loglogN)
1975 (Bennett+)1981 (Olken)1991 (Kim+)1993 (Sugumar+)2002 (Almasi+)
But measuring 1-min execution still takes several hours!

Xipeng Shen @ College of William & Mary
A Different Path
• Key obstacle: Counting out repetitive references in an arbitrarily long interval.
• Previous methodsimplement the definition of reuse distance: “Counting” distinct data.
• Our approachuses some “cheap” program behavior to statistically approximate reuse distance.
9

Xipeng Shen @ College of William & Mary
The “Cheap” Behavior
• Time distance (TD)
• Def: number of elements between reuse.
• Reuse distance (RD)
• Def: number of distinct elements between reuse.
10
bcaacbTd = 5
bcaacbRd = 2
O(T)

Xipeng Shen @ College of William & Mary
• Is it possible?
11
No idea.
TD RD : Intuition
bxxxxb RD=1
TD histogram
RD=1, 2, 3, or 4 ?
b....bTD=5
• What if we know the following: totally 4 reuses; one TD is 5, three TDs are all 1.
Xipeng Shen @ College of William & Mary
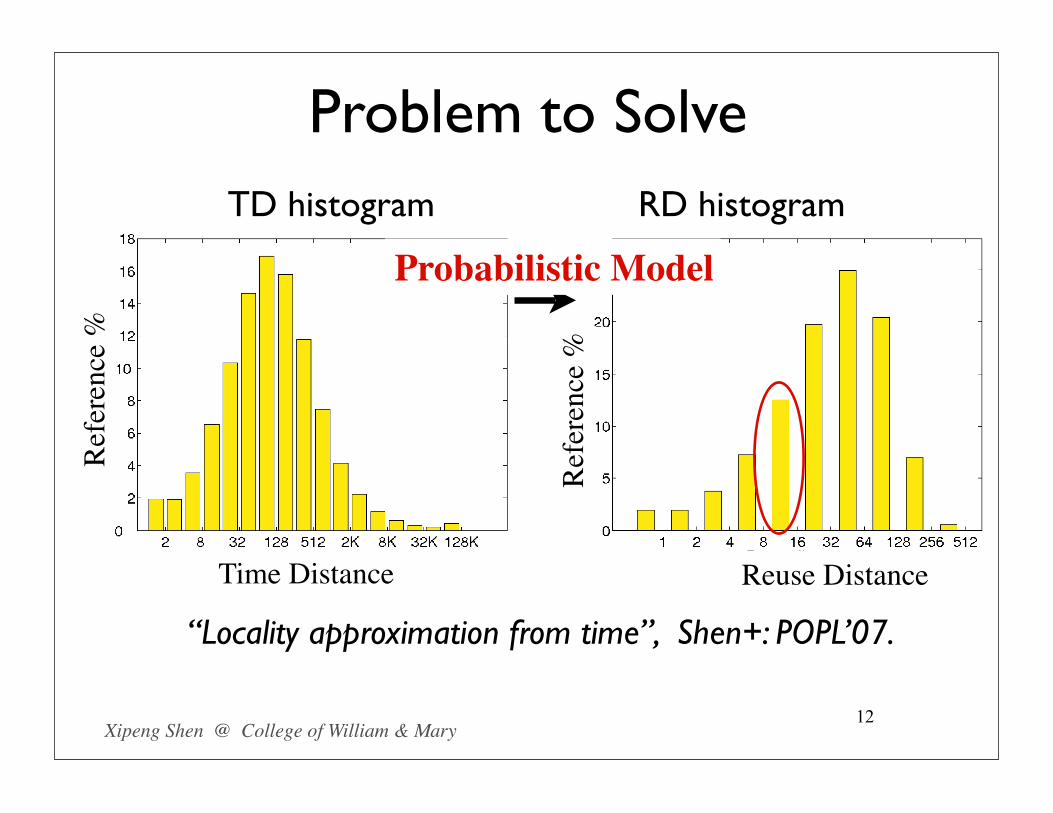
Problem to Solve
12
TD histogram
Time Distance
Refe
renc
e %
RD histogram
Reuse DistanceRe
fere
nce
%
?
“Locality approximation from time”, Shen+: POPL’07.
Probabilistic Model

Xipeng Shen @ College of William & Mary
Connection between TD and RD [Shen+:POPL’07]
Expectation of the probability for a variable to appear in a Δ-long interval:
13
TD histogram
Time Distance
Refe
renc
e %
δ

Xipeng Shen @ College of William & Mary
Connection between TD and RD [Shen+:POPL’07]
Expectation of the probability for a variable to appear in a Δ-long interval:
Probability for the interval to have k distinct variables (Bernoulli process):
14
TD histogram

Xipeng Shen @ College of William & Mary
• p(Δ): a variable to appear in a Δ-long interval.
• p’(τ): a variable’s last access before t is at time (t-τ).
Compute p(Δ)
15
τ=1
Δ p(Δ) = ∑ p’(τ)
p’(τ) = ∑ PT(δ)/(N-1)δ=τ+1
T
• The following is proved in [Shen+:POPL07]

Xipeng Shen @ College of William & Mary
Implementation Issues
• Scale: The model applies to every access, but not to histograms.
• The width of a bar must be 1.
• Overhead: high cost in measuring time distance.
• Bookkeeping and buffer boundary checking at every memory access.
16

Xipeng Shen @ College of William & Mary
Outline
• Reuse distance measurement
• Efficient approximation of reuse distance (17X speedup)
• Algorithmic extensions (1 order of magnitude less)
• Implementation optimizations (3.3X speedup)
• Evaluation tool: trace generator
• Evaluation
• Conclusions
17

Xipeng Shen @ College of William & Mary
Algorithm Extension
18
• Basic extension: assume all references in a bar have the same , denoted as .
p(bi) =
!"bi +
"#bi
2!
!=1
T!
"=!+1
1N " 1
PT (!).
1
p(bi) =
!"bi +
"#bi
2!
!=1
T!
"=!+1
1N " 1
PT (!).
p(k, bi) ="
N
k
#
p(bi)k(1 " p(bi))N!k.
1
• Time complexity: : number of bars in a TD histogram.
p(bi) =
!"bi +
"#bi
2!
!=1
T!
"=!+1
1N " 1
PT (!).
p(k, bi) ="
N
k
#
p(bi)k(1 " p(bi))N!k.
Complexity is
O(L3T )
1
p(bi) =
!"bi +
"#bi
2!
!=1
T!
"=!+1
1N " 1
PT (!).
p(k, bi) ="
N
k
#
p(bi)k(1 " p(bi))N!k.
Complexity is
O(L3T )
LT
1

Xipeng Shen @ College of William & Mary
Algorithmic Optimizations
• Decompose into 3 sub-equations to remove redundant computations.
19
p(bi) =
!"bi +
"#bi
2!
!=1
T!
"=!+1
1N " 1
PT (!).
p(k, bi) ="
N
k
#
p(bi)k(1 " p(bi))N!k.
Complexity is
O(L3T )
LT
p(bi) = P2(bi)/2 +i!1!
j=0
P2(bj)
P2(bi) = [LT!
j=i+1
P1(bj)"#bi "
!"bi
"#bj "!"
bj
"#bj !1!
!=!"bj
1" " 1
]
+ P1(bi)1
"#bi "
!"bi
"#bi !1!
!=!"bi +1
" "!"bi
" " 1
P1(bi) =!"bi + "#
bi " 32(N " 1)
PT (bi).
1

Xipeng Shen @ College of William & Mary
Algorithmic Optimizations
• Further optimizations
• mathematical approximation
• statistical approximation• Normal distribution with table-lookup for binomial
distribution calculation
• Time complexity
20
p(bi) =
!"bi +
"#bi
2!
!=1
T!
"=!+1
1N " 1
PT (!).
p(k, bi) ="
N
k
#
p(bi)k(1 " p(bi))N!k.
Complexity is
O(L3T )
LT
p(bi) = P2(bi)/2 +i!1!
j=0
P2(bj)
P2(bi) = [LT!
j=i+1
P1(bj)"#bi "
!"bi
"#bj "!"
bj
"#bj !1!
!=!"bj
1" " 1
]
+ P1(bi)1
"#bi "
!"bi
"#bi !1!
!=!"bi +1
" "!"bi
" " 1
P1(bi) =!"bi + "#
bi " 32(N " 1)
PT (bi).
m2!
i=m1
1i$ ln
m2 + 0.5m1 " 0.5
,
1
p(bi) =
!"bi +
"#bi
2!
!=1
T!
"=!+1
1N " 1
PT (!).
p(k, bi) ="
N
k
#
p(bi)k(1 " p(bi))N!k.
Complexity is
O(L3T )
1
p(bi) =
!"bi +
"#bi
2!
!=1
T!
"=!+1
1N " 1
PT (!).
p(k, bi) ="
N
k
#
p(bi)k(1 " p(bi))N!k.
Complexity is
O(L3T )
O(L2T )
LT
p(bi) = P2(bi)/2 +i!1!
j=0
P2(bj)
P2(bi) = [LT!
j=i+1
P1(bj)"#bi "
!"bi
"#bj "!"
bj
"#bj !1!
!=!"bj
1" " 1
]
+ P1(bi)1
"#bi "
!"bi
"#bi !1!
!=!"bi +1
" "!"bi
" " 1
P1(bi) =!"bi + "#
bi " 32(N " 1)
PT (bi).
m2!
i=m1
1i$ ln
m2 + 0.5m1 " 0.5
,
1
Details in [Shen+:LCPC’08].
Xipeng Shen @ College of William & Mary
Procedure RecordMemAcc (addr) buffer [index++] = addr;
if (index== BUFFERSIZE) then ProcessBuff(); endif
end
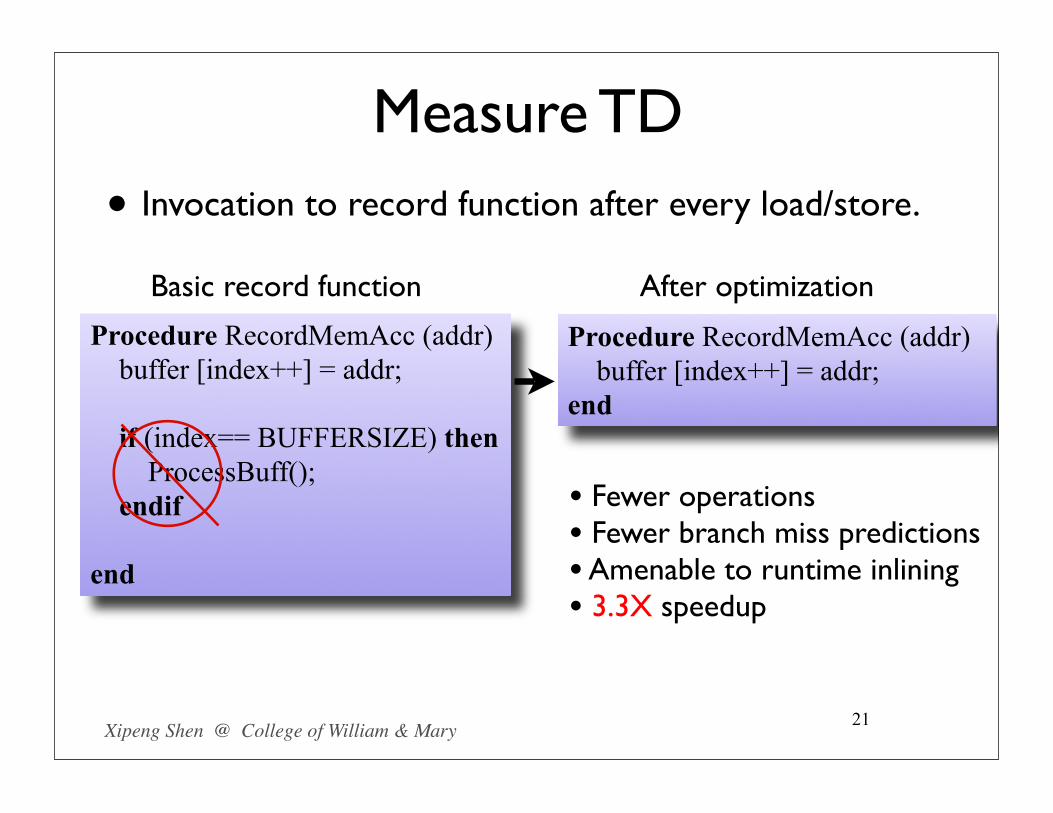
Measure TD
• Invocation to record function after every load/store.
21
Basic record function
Procedure RecordMemAcc (addr) buffer [index++] = addr;end
After optimization
• Fewer operations• Fewer branch miss predictions• Amenable to runtime inlining• 3.3X speedup

Xipeng Shen @ College of William & Mary
MMU Control
• Typical scheme:
• Control page permission & modify registers
• Not portable across architectures.
• Our approach:
• 2-page scheme
• Close & open permissions of the final 2 pages alternatively
22
Details in [Shen+:LCPC’08].

Xipeng Shen @ College of William & Mary
2-Page Scheme for Using MMU
23
...
Buffer
Page 1Page 2Page 3
Page N-1Final page
Process buffer
Signal
An option to resume: change target location by modifying register values. Not portable.

Xipeng Shen @ College of William & Mary
2-Page Scheme for Using MMU
24
...
Buffer
Page 1Page 2Page 3
Page N-1Final page
Process buffer

Xipeng Shen @ College of William & Mary
2-Page Scheme for Using MMU
25
...
Buffer
Page 1Page 2Page 3
Page N-1Final page
Using the last 2 pages alternatively to signal the end of buffer• Remove boundary check• More portable
Limitations• 2 page space waste• 1 data loss per buffer
Xipeng Shen @ College of William & Mary
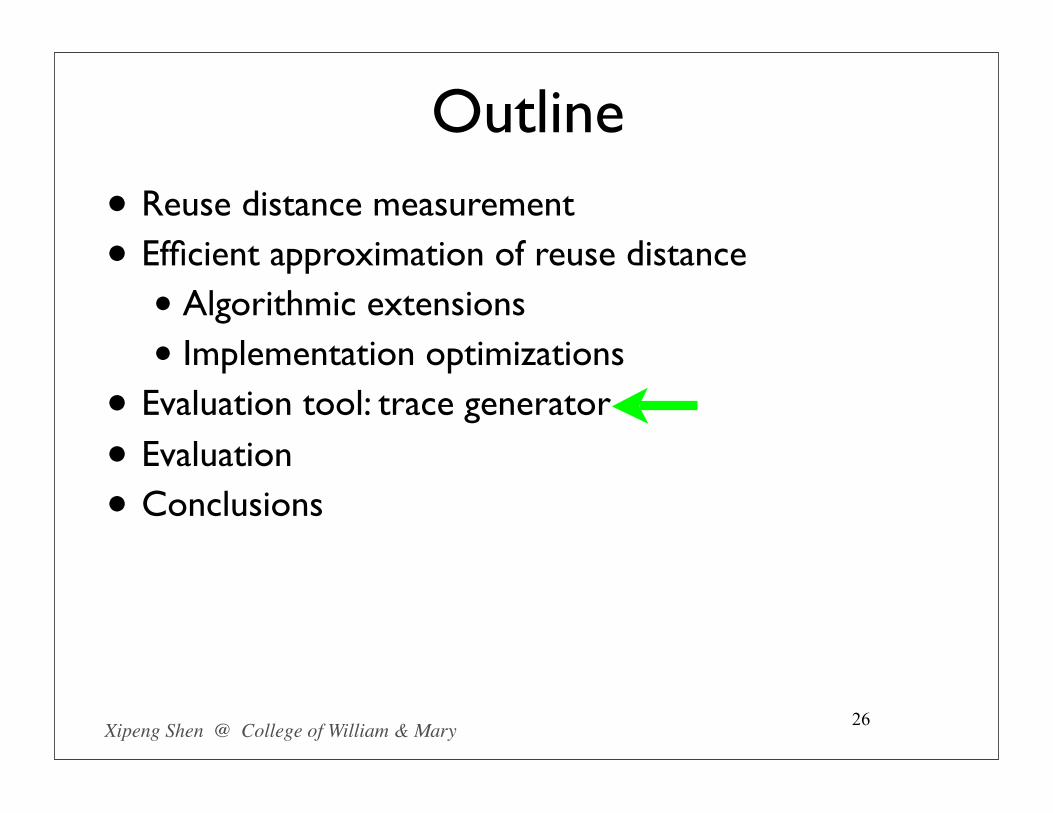
Outline
• Reuse distance measurement
• Efficient approximation of reuse distance
• Algorithmic extensions
• Implementation optimizations
• Evaluation tool: trace generator
• Evaluation
• Conclusions
26

Xipeng Shen @ College of William & Mary
A Reverse Problem: Trace Generation
• Reuse distance measurement or approximation
27
• Trace generator
Trace Reuse distance
Trace Reuse distance
Use: for evaluating locality techniques on various reuse patterns.
Xipeng Shen @ College of William & Mary
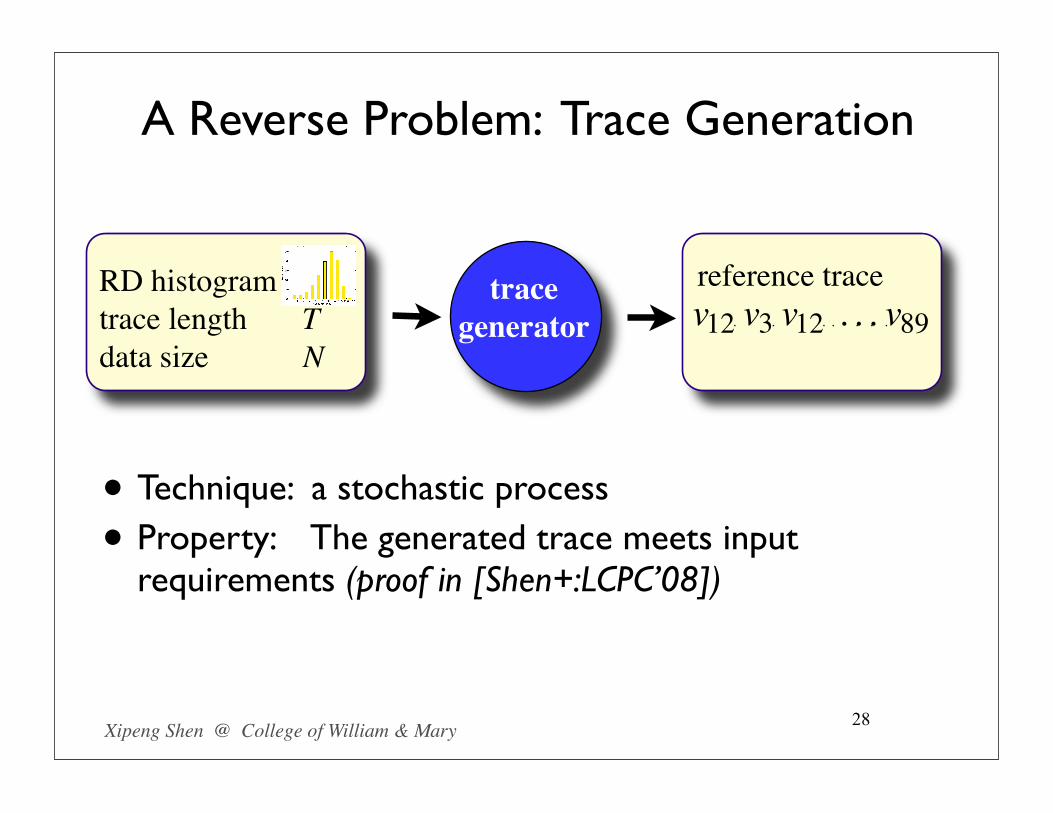
A Reverse Problem: Trace Generation
• Technique: a stochastic process
• Property: The generated trace meets input requirements (proof in [Shen+:LCPC’08])
28
RD histogramtrace length Tdata size N
reference tracetrace generator
Xipeng Shen @ College of William & Mary
Outline
• Reuse distance measurement
• Efficient approximation of reuse distance
• Algorithmic extensions
• Implementation optimizations
• Evaluation tool: trace generator
• Evaluation
• Conclusions
29

Xipeng Shen @ College of William & Mary
Evaluation (Pulse-like reuse distributions)
Time Distance Histogram
30
Reuse Distance Histogram
Xipeng Shen @ College of William & Mary
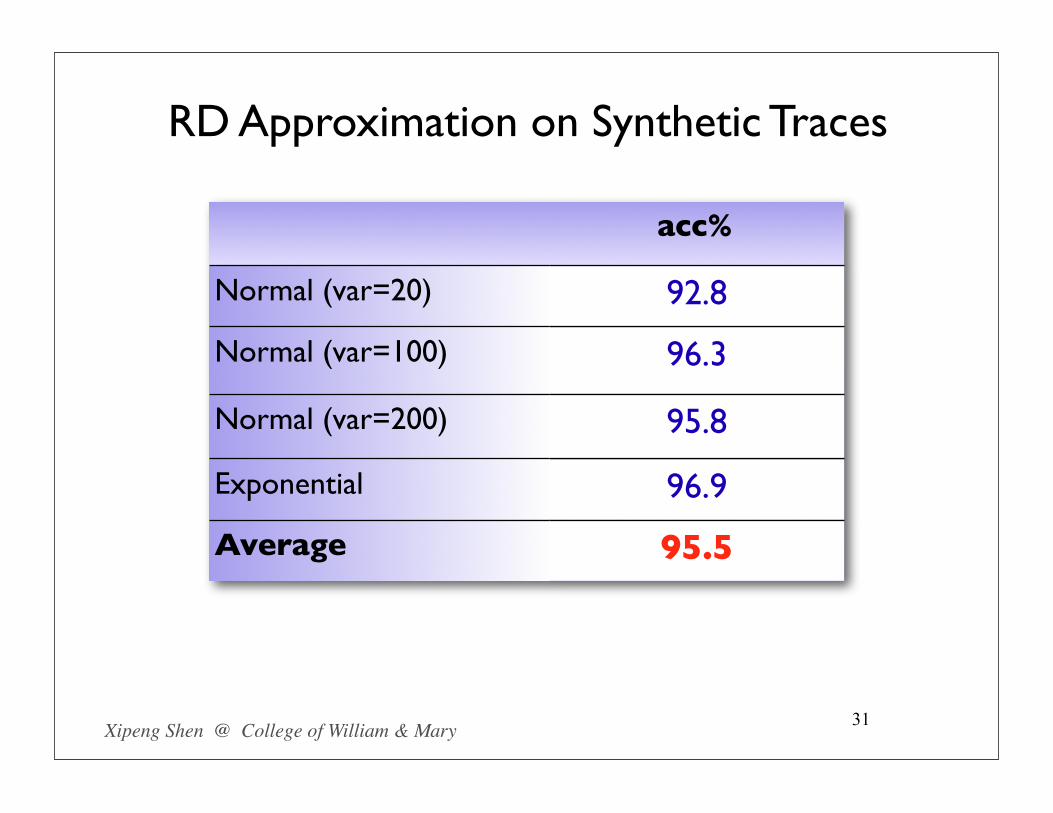
RD Approximation on Synthetic Traces
31
acc%
Normal (var=20)
Normal (var=100)
Normal (var=200)
Exponential
Average
92.8
96.3
95.8
96.9
95.5

Xipeng Shen @ College of William & Mary
Evaluation on Real Benchmarks
32
CPU Intel Xeon 2GHz
Instrumentor
Compiler
HW perf. measure
Benchmarks
PIN 3.4
GCC 3.4.4 (“-O3”)
PAPI 3.2
SPEC CPU2000 ref
Baseline: Ding+:PLDI’03.

Xipeng Shen @ College of William & Mary
Results on Real Benchmarks
33
Programs Element Cache line
gcc
gzip
mcf
twolf
ammp
applu
equake
mesa
mgrid
Average
acc% speedup acc% speedup
89.0 21.2X 99.4 16.7X
99.0 19.0X 99.5 17.0X
42.6 8.3X 94.0 18.2X
88.2 5.9X 98.1 20.2X
95.8 14.3X 99.2 21.5X
86.1 19.0X 99.2 21.4X
57.6 23.7X 98.5 15.1X
97.3 26.3X 100 14.0X
89.7 20.6X 99.6 21.5X
82.8 17.6X 98.6 18.4X

Xipeng Shen @ College of William & Mary
Uses in Cache Miss Rate Estimation
34
!
"!
#!
$!
%!
&!
'!
"(#(%()("'($#('%(
"#)(
#&'(
&"#("*#*%*)*"'*
!"#$"%&'$()*+"
!","-"*+".
+,-. /0123-1,4
!
"!
#!
$!
%!
&!
'!
(!
)!
*!
"!!
" # % ) "' $# '% "#) #&' &"#
!"#$"%&'$()*+"%,-.
!"/"0"*+"1
+,-. /0123-1,4
(a) mcf element reuse histogram (b) mcf cache line reuse histogram
Figure 4. The real and estimated reuse distance histograms of mcf, the benchmark with the largest approximation error. The X-axes are onlog scale.
0%
2%
4%
6%
8%
10%
12%
14%
128K 256K 512K 1M 2M 4M 8M
Cache size (Bytes)
Mis
s R
ateReal Estimated
0%
2%
4%
6%
8%
10%
12%
14%
128K 256K 512K 1M 2M 4M 8M
Cache size (Bytes)
Mis
s R
ate
Real Estimated
(a) mcf cache miss rate curves (b) ammp cache miss rate curves
Figure 5. The cache miss rates obtained from the real and estimated reuse distance histograms given different cache size of fully associativity.
distance. In 2002, Zhong et al. proposed an approximation algo-rithm using block tree [27]. Ding and Zhong further extended thealgorithm through dynamic tree compression in 2003 [9]. The ap-proximation algorithms trade accuracy for efficiency by increasingthe measurement granularity. A tree node contains a group of dataaccessed closely and assigns a single time stamp to all of them. Thetime complexity becomes O(T loglogN) and the space overheadis O(logN).This work tackles the problem by exploring the relations be-
tween time distance and reuse distance, which provides 17 timesspeedup than Ding and Zhong’s technique. The complexity formeasuring time distance is O(T ).The key component of the technique is a statistical model. In
1976, Smith gave us an excellent example of applying statisticalmodels to memory behavior characterization. He described a modelthat successfully approximated miss rates of set associative cachesgiven the miss ratio for fully associative caches [24].Compiler analysis has been successful in understanding and
improving locality in basic blocks and loop nests. McKinley andTemam carefully studied various types of locality within and be-
tween loop nests [19]. Cascaval presented a compiler algorithm thatmeasures reuse distance directly [6]. Allen and Kennedy discussedthe subject comprehensively in their book [1]. Thabit identified dataoften used together based on their access frequency [26]. Chilimbiused grammar compression to find hot data streams and reorga-nized data accordingly [7].
8. Conclusions
In this work, we demonstrates the strong connections between timeand locality. We propose a novel statistical model to approximateprogram locality from easily-obtained time distance histograms.Experiments show 17 times speedup over the state-of-the-art lo-cality measurement. The approximation accuracy is over 99% forcache block reuse and over 94% for element reuse. The model isgeneral enough to allow reuse distance histograms of any scale anddata reuse of different granularity to be approximated. The tech-nique eliminates the obstacles blocking efficient uses of reuse dis-tance and opens up opportunities for various efficient performancedebugging, performance prediction and program optimizations.
benchmarkmcf
For all benchmarks, error < 1.76%, average error = 0.42%.
(Details in Shen+:TR902)

Xipeng Shen @ College of William & Mary
Conclusions
• Strong connection exists between time and locality.
• Reuse distance can be approximated from time efficiently.
35
* Details in: “Locality approximation from time”, POPL’07. “Adaptive software speculation for enhancing the efficiency of behavior-oriented parallelization”, LCPC’08.
Xipeng Shen @ College of William & Mary
Acknowledgment
• Chen Ding (U of Rochester) suggested the use of 2 pages for MMU control.
• Brian Meeker (U of Rochester) collected preliminary data in the early stage.
• Supported by NSF.
36