eel (anguilla spp.): production and trade · eel (anguilla spp.): ... spp. smoked) - international...
TRANSCRIPT

GLOBEFISH RESEARCH PROGRAMME
Food and Agriculture Organization of the United NationsProducts, Trade and Marketing Service
Viale delle Terme di Caracalla00153 Rome, Italy
Tel.: +39 06 5705 4744Fax: +39 06 5705 3020
www.globefish.org
Eel (Anguilla spp.): Production and trade
Volume 114
GRP114coverB5.indd 1GRP114coverB5.indd 1 29/07/2014 16:36:3429/07/2014 16:36:34

Eel (Anguilla spp.): Production and trade according to
Washington Convention Legislation
by
Pierluigi Monticini
(July, 2014)
The GLOBEFISH Research Programme is an activity initiated by FAO's Products, Trade and Marketing Service, Fisheries and Aquaculture Policy and Economics Division, Rome, Italy and financed jointly by:
- National Marine Fisheries Service (NMFS), Washington DC, USA - Ministerio de Agricultura, Alimentación y Medio Ambiente, Madrid, Spain - European Commission, DG MARE, Brussels, EU - Norwegian Seafood Council, Tromsoe, Norway - FranceAgriMer, Montreuil-sous-Bois, France - Alaska Seafood Marketing Institute (ASMI), USA - Seafish, the Authority on Seafood, United Kingdom
Food and Agriculture Organization of the United Nations, GLOBEFISH, Products, Trade and Marketing Service, Fisheries and Aquaculture Policy and Economics Division Viale delle Terme di Caracalla, 00153 Rome, Italy - Tel: (39) 06570 54163 E-mail: [email protected]; [email protected] - Fax: (39) 06570 53020 - www.globefish.org

ii
The designations employed and the presentation of material in this information product do not imply the expression of any opinion whatsoever on the part of the Food and Agriculture Organization of the United Nations (FAO) concerning the legal or development status of any country, territory, city or area or of its authorities, or concerning the delimitation of its frontiers or boundaries. The mention of specific companies or products of manufacturers, whether or not these have been patented, does not imply that these have been endorsed or recommended by FAO in preference to others of a similar nature that are not mentioned. The views expressed in this information product are those of the author(s) and do not necessarily reflect the views of FAO.
Pierluigi MONTICINI, GLOBEFISH consultant. EEL (ANGUILLA SPP.): PRODUCTION AND TRADE ACCORDING TO WASHINGTON
CONVENTION LEGISLATION GLOBEFISH Research Programme, Vol. 114. Rome, FAO 2014. 78p. This report provides operators in the sector with up-to-date and complete information on the trade of Anguilla anguilla – eel. Statistical data from the last ten years has been examined, which represents a significant period for an economic evaluation of the sector and for assessing the availability and resilience of the various species, particularly the European eel. Layout: Gloria Loriente Cover photographs: Courtesy of Pierluigi Monticini
All rights reserved. FAO encourages the reproduction and dissemination of material in this information product. Non-commercial uses will be authorized free of charge, upon request. Reproduction for resale or other commercial purposes, including educational purposes, may incur fees. Applications for permission to reproduce or disseminate FAO copyright materials, and all queries concerning rights and licences, should be addressed by e-mail to [email protected] or to the Chief, Publishing Policy and Support Branch, Office of Knowledge Exchange, Research and Extension, FAO, Viale delle Terme di Caracalla, 00153 Rome, Italy.
© FAO 2014

iii
TABLE OF CONTENT
FOREWORD 1
1. BIOLOGY 3 1.1. CLASSIFICATION 3 1.2. EUROPEAN EEL 5 1.3. AMERICAN EEL 6 1.4. JAPANESE EEL 7 1.5. SHORT-FINNED EEL 8 1.6. TECHNICAL ASPECTS 8 1.7. WATER QUALITY CONTROL 9 1.8. FEEDING AND GROWTH RATE 10 1.9. DISEASES AND DISORDERS 10
2. STATISTICAL DATA 13 2.1. UNDATA 13 2.2. FAO FISHSTAT PLUS 13 2.3. EUROSTAT 13 2.4. TOTAL IMPORT QUANTITY 15 2.5. IMPORT VALUES 16 2.6. EXPORT QUANTITY 17 2.7. EXPORT VALUES 18 2.8. FAO-FISHSTAT PLUS DATA 18 2.9. COMMODITY CODE 30266 (EELS: FRESH OR CHILLED, WHOLE) 23 2.10. COMMODITY CODE 30376 (EELS: FROZEN, WHOLE) 34 2.11. COMMODITY CODE 30549 (EELS: SMOKED) 45 2.12. COMMODITY CODE 30192 (EELS: LIVE) 47
3. MARKETING OF EEL AS A SEAFOOD (AN OVERVIEW) 59 4. REGULATIONS 64
4.1. CONVENTION ON INTERNATIONAL TRADE OF ENDANGERED SPECIES OF WILD FAUNA AND FLORA (CITES) 64
4.2. COUNCIL REGULATION (EC) 1100/2007 64 4.3. PROTECTED SPECIES 65 4.4. IUCN RED LIST OF THREATENED SPECIES 67 4.5. UNITED STATES OF AMERICA LEGISLATIVE ASPECTS 68 4.6. JAPANESE LEGISLATION FOR ANGUILLA SPP. MARKET 70 4.7. SWOT ANALYSIS TOOL 74
5. REFERENCES 76 6. WEBLIOGRAPHY 78

iv
TABLES
1. GLOBAL, AQUACULTURE AND CAPTURE PRODUCTION
(TONNES) 14
2. TOTAL IMPORT QUANTITY (TONNES) 15 3. TOTAL IMPORT VALUE (‘000 USD) 16 4. TOTAL EXPORT QUANTITY (TONNES) 17 5. TOTAL EXPORT VALUE (‘000 USD) 18 6. WORLD GLOBAL PRODUCTION 18 7. GLOBAL PRODUCTION (TONNES). 20 8. WORLD AQUACULTURE PRODUCTION 20 9. AQUACULTURE PRODUCTION (TONNES) 21 10. WORLD CAPTURE PRODUCTION (TONNES) 21 11. CAPTURE PRODUCTION (TONNES) 22 12. 030192 EELS (ANGUILLA SPP. FRESH OR CHILLED) –
INTERNATIONAL EXPORT OF FISHERY COMMODITIES BY FAO 24
13. IMPORTER COUNTRIES (30266 – COMTRADE) 24 14. EXPORTERS COUNTRIES (30266 – COMTRADE) 25 15. IMPORT YEARS (30266 – COMTRADE) 25 16. EXPORT YEARS (30266 – COMTRADE) 25 17. IMPORT CHINA (30266 – UNDATA) 26 18. IMPORT HONG KONG (30266 – UNDATA) 26 19. IMPORT JAPAN (30266 – UNDATA) 27 20. IMPORT KOREA (30266 – UNDATA) 27 21. IMPORT EU-27 (30266 – UNDATA) 28 22. IMPORT ITALY (30266 – UNDATA) 28 23. IMPORT DENMARK (30266 – UNDATA) 29 24. IMPORT SPAIN (30266 – UNDATA) 29 25. EXPORT CHINA (30266 – UNDATA) 30 26. EXPORT HONG KONG (30266 – UNDATA) 30 27. RE-EXPORT HONG KONG (30266 – UNDATA) 31 28. EXPORT JAPAN (30266 – UNDATA) 31 29. EXPORT KOREA (30266 – UNDATA) 32 30. EXPORT EU-27 (30266 – UNDATA) 32 31. EXPORT ITALY (30266 – UNDATA) 33 32. EXPORT DENMARK (30266 – UNDATA) 33 33. EXPORT SPAIN (30266 – UNDATA) 34 34. 030376 EELS (ANGUILLA SPP. FROZEN) - INTERNATIONAL
EXPORT OF FISHERY COMMODITIES BY FAO 35
35. IMPORTER COUNTRIES (030376 – COMTRADE) 36 36. EXPORTER COUNTRIES (030376 – COMTRADE) 36 37. IMPORT YEARS (030376 – COMTRADE) 36

v
38. EXPORT YEARS (030376 – COMTRADE) 36 39. IMPORT CHINA (030376 – UNDATA) 37 40. IMPORT HONG KONG (030376 – UNDATA) 37 41. IMPORT JAPAN (030376 – UNDATA) 38 42. IMPORT KOREA (030376 – UNDATA) 38 43. IMPORT EU-27 (030376 – UNDATA) 39 44. IMPORT ITALY (030376 – UNDATA) 39 45. IMPORT DENMARK (030376 – UNDATA) 40 46. IMPORT SPAIN (030376 – UNDATA) 40 47. EXPORT CHINA (030376 – UNDATA) 41 48. EXPORT HONG KONG (030376 – UNDATA) 41 49. RE-EXPORT HONG KONG (030376 – UNDATA 42 50. EXPORT JAPAN (030376 – UNDATA) 42 51. EXPORT KOREA (030376 – UNDATA) 43 52. EXPORT EU-27 (030376 – UNDATA) 43 53. EXPORT ITALY (030376 – UNDATA) 44 54. EXPORT DENMARK (030376 – UNDATA) 44 55. EXPORT SPAIN (030376 – UNDATA) 45 56. 030549 EELS (ANGUILLA SPP. SMOKED) - INTERNATIONAL
EXPORTS OF FISHERY COMMODITIES BY FAO 46
57. IMPORTER COUNTRIES (030549 – COMTRADE) 46 58. EXPORTERS COUNTRIES (030549 – COMTRADE) 46 59. IMPORT YEARS (030549 – COMTRADE) 46 60. EXPORT YEARS (030549 – COMTRADE) 47 61. SMOKED EELS IMPORT FROM OUTSIDE EU MEMBER STATES 47 62. SMOKED EELS WITHIN THE EU MEMBER STATES 47 63. 030192 EELS (ANGUILLA SPP. LIVE) - INTERNATIONAL EXPORT
OF FISHERY COMMODITIES BY FAO 49
64. IMPORTER COUNTRIES (030192 – COMTRADE) 49 65. EXPORTERS COUNTRIES (030192 – COMTRADE) 49 66. IMPORT YEARS (030192 – COMTRADE) 49 67. EXPORT YEARS (030192 – COMTRADE) 50 68. IMPORT CHINA (030192 – UNDATA) 50 69. IMPORT HONG KONG (030192 – UNDATA) 51 70. IMPORT JAPAN (030192 – UNDATA) 51 71. IMPORT KOREA (030192 – UNDATA) 52 72. IMPORT EU-27 (030192 – UNDATA) 52 73. IMPORT ITALY (030192 – UNDATA) 53 74. IMPORT DENMARK (030192 – UNDATA) 53 75. IMPORT SPAIN (030192 – UNDATA) 54 76. EXPORT CHINA (030192 – UNDATA) 54 77. EXPORT HONG KONG (030192 – UNDATA) 55

vi
78. RE-EXPORT HONG KONG (030192 – UNDATA) 55 79. EXPORT JAPAN (030192 – UNDATA) 56 80. EXPORT KOREA (030192 – UNDATA) 56 81. EXPORT EU-27 (030192 – UNDATA) 57 82. EXPORT ITALY (030192 – UNDATA) 57 83. EXPORT DENMARK (030192 – UNDATA) 58 84. EXPORT SPAIN (030192 – UNDATA) 58 85. SWOT MATRIX 75

1
FOREWORD The primary aim of this report is to provide operators in the sector with up-to-date and complete information on the trade of Anguilla anguilla – eel. With numbers decreasing drastically, Anguilla anguilla is now featured on the list of protected species in Annex II of the Washington Convention on International Trade of Endangered Species (CITES). Eels have traditionally been caught, bred for trade and consumed live, fresh, chilled, frozen or smoked. They are part of the culinary traditions in countries located in quite distant geographical areas, ranging from the Japanese eel (Anguilla japonica) in countries of East Asia such as China and Korea to the European eel (Anguilla anguilla) in Europe. Countries in southern Europe, such as Italy and France, have made the eel market a segment of economic interest in the fisheries and aquaculture sector. For this study, we examined statistical data from the last ten years, which represents a significant period for an economic evaluation of the sector and for assessing the availability and resilience of the various species, particularly the European eel. Only a few of the roughly 15 species and their subspecies are of relevance from an economic point of view. These include: the European eel and the Japanese eel, as well as the American eel (Anguilla rostrata), and the short-finned Eel (Anguilla australis australis). Of these, only the European eel is subject to protection programmes after being listed as a protected species under the Washington Convention, due to the drastic drop in the number of wild eels since 2009. Its vulnerability is due to its relatively long biological cycle (being a catadromous species), the effects of numerous pathologies, some of which are typical to the species, and numerous anthropic threats such as overfishing, pollution, modified natural habitat and poaching. Due to these threats, an eel management plan has been implemented through Council Regulation (EC) 338/1997, which implements CITES within the European Union (EU) and Council Regulation (EC) 1100/2007 which establishes the measures for wild European eel stock recovery. For this study, we used United Nations Commodity Trade Statistics Data Base (UNData) from the last ten years to examine imports and exports in the major countries involved. We report findings in USD in terms according to Commodity Codes, i.e. fresh or chilled eel, frozen eel and live eel. In addition, data from the FAO FishStat Plus system was used for the homogenous categories of live, fresh or chilled, frozen and smoked eel, in terms of value and in terms of quantity (tonnes). Data on production typologies was examined according to global production, aquaculture production and capture production, in order to evaluate the quantities in terms of tonnes. Data from Eurostat 2010 data (Traffic report on the Trade in Anguilla spp., (Crook, 2010) was used for the smoked eel category. The FAO Code of Practice for Fish and Fishery Products (first edition) provided definitions for the various commodity codes and production processes. An analysis of the information and an assessment of the strengths, weaknesses, opportunities and threats (SWOT analysis) found a notable drop in the availability of wild fish for the market. The numerous anthropic threats seem to be the major cause of this drastic drop in the capture of wild eel, although often production data fails to consider elements such as over fishing and food fraud.

2
Currently, international discourse Legislation appears to be limited to recording a decline in the numbers, which have been dropping for some time, without offering a solution for the present situation. Only through the development of the strong points of the trade, and by establishing new opportunities for the future (full lifecycle completed in captivity and mass indoor reproduction for commercial purposes) with greater awareness at an international level, in particular for the biggest global importers, can we hope to protect the species from an inexorable decline and reap the benefits from sustainable production for future generations.

3
1. BIOLOGY
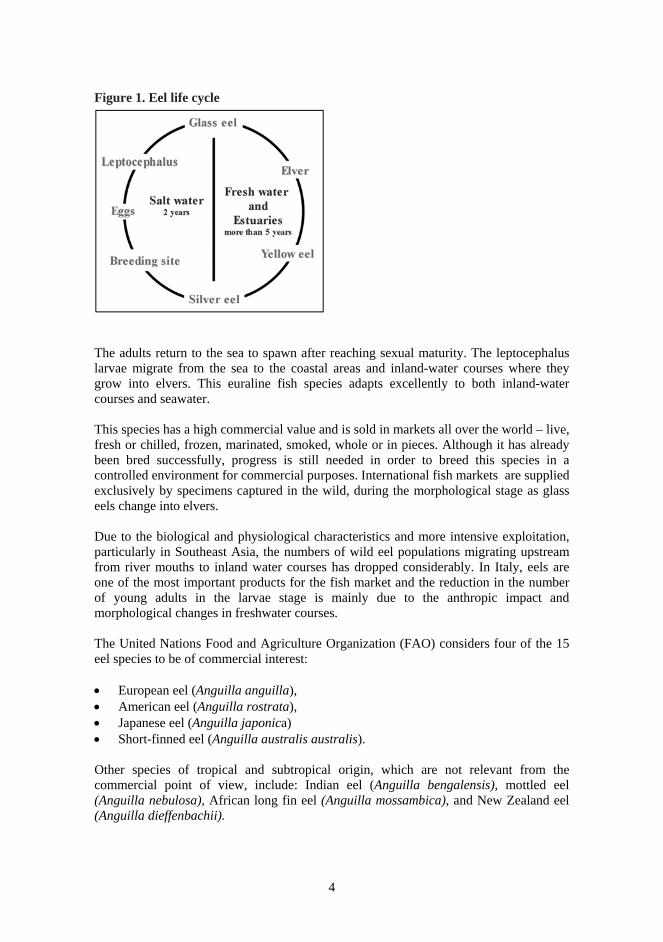
1.1. CLASSIFICATION Anguilla or eels: teleost species, anguilliforme order, easily recognizable by snake-shaped elongated body, with no ventral fins, small pectoral fins to swim along the river bottom, no pelvic cirdle, small cycloid-type scales, greenish brown or black color depending on habitat, with ventral part more clear, and length averages around 1 m. CLASSIFICATION (common in all species) Class: Teleostomi, Subclass: Actinopterygii Order: Anguilliformes, Suborder: Anguilloidei Family: Anguillidae Genus: Anguilla Species: more than 15 species and 5 subspecies – according different reports – with only a few of commercial interest. Eels also have characteristics in common with all the other Anguilliformes, namely: cycloid scales, no spiny fins, long dorsal and anal fins, multi-stages development, demersal species, catadromous. The very long lifecycle, which can be up to 20 years, can be divided in different stages. The eggs (pelagic) become leaf-like larvae (leptocephalus), which consume “marine snow” or small particles that float in the water. The larvae metamorphose into the glass eel stage, so called because at this point they have a transparent body, averaging around 5 cm length and weighing 1 g. They then become elver and yellow eels with freshwater and estuary habitats. The dark colored elvers reach 10 cm, and the yellow eels over 10 cm. The adult or silver eels live in freshwater or estuaries before moving to the sea for breeding. The yellow phase is long, ranging from 5 to 9 years, depending on species and habitat. Sexual maturity is 3 to 9 years for male and 5 to 18 years for female. The Anguilla species adult grows to 1 m and weighs 4–6 kg. The specimens live around 20 years. Some spend most of their lives in freshwater before going back to the sea for reproduction, while others remain all their lives in saltwater. All eel species die after the breeding season.
4
Figure 1. Eel life cycle
The adults return to the sea to spawn after reaching sexual maturity. The leptocephalus larvae migrate from the sea to the coastal areas and inland-water courses where they grow into elvers. This euraline fish species adapts excellently to both inland-water courses and seawater. This species has a high commercial value and is sold in markets all over the world – live, fresh or chilled, frozen, marinated, smoked, whole or in pieces. Although it has already been bred successfully, progress is still needed in order to breed this species in a controlled environment for commercial purposes. International fish markets are supplied exclusively by specimens captured in the wild, during the morphological stage as glass eels change into elvers. Due to the biological and physiological characteristics and more intensive exploitation, particularly in Southeast Asia, the numbers of wild eel populations migrating upstream from river mouths to inland water courses has dropped considerably. In Italy, eels are one of the most important products for the fish market and the reduction in the number of young adults in the larvae stage is mainly due to the anthropic impact and morphological changes in freshwater courses. The United Nations Food and Agriculture Organization (FAO) considers four of the 15 eel species to be of commercial interest: European eel (Anguilla anguilla), American eel (Anguilla rostrata), Japanese eel (Anguilla japonica) Short-finned eel (Anguilla australis australis). Other species of tropical and subtropical origin, which are not relevant from the commercial point of view, include: Indian eel (Anguilla bengalensis), mottled eel (Anguilla nebulosa), African long fin eel (Anguilla mossambica), and New Zealand eel (Anguilla dieffenbachii).

5
1.2. EUROPEAN EEL
Species: Anguilla anguilla (Linnaeus, 1758) Synonymous: Anguilla anguilla, Schrank, 1798 Anguilla vulgaris, Shaw, 1803 FAO common name: European eel (En) Anguille europe (Fr) Anguila europea (Sp) IUCN Red List status: not evaluated until 2006, Critically Endangered (2008) Convention on International Trade in Endangered Species of Fauna and Flora (CITES): Appendix II (in force from 13 March 2009), Council Regulation (EC) N. 338/1997 which implement CITES within European Union Resilience: very low, doubling time on average 15 years Vulnerability: very high, due to human impact FAO fishing area: Mediterranean and Black Sea (FAO fishing area 37), Atlantic Northeast (FAO fishing area 27) Geographical distribution: Mediterranean region, Iceland Madera, North Europe, North Africa. Anguilla anguilla is found in all European rivers and streams draining to the Mediterranean Sea, with low presence in Black Sea, very rare presence in northwest Russia and Barents Sea, and occasional in the Volga River drainage. This species breeds in the Sargasso Sea in Western Atlantic migrating across the Atlantic Ocean Climate: temperate Size and weight: female – 150 cm and more than 2 kg; male – 50 cm and 300 g. Usually less size reporting Description, biology: elongated, snake-like body like a snake, cylindrical anteriorly, dorsal and anal fins end in caudal fin. Pectoral fins small, no pelvic fins. Wide mouth, color varies in relation to the environment, size and stage of development. In freshwater gray or blackish on the back, white or yellowish belly. Some rare specimens have an orange coloring Habitat: Anguilla anguilla is found in all types of benthic environment, rivers, streams, estuaries and lakes that are connected to the sea. They spend their lives in freshwater and return to the sea for the breeding season
Courtesy: P. Monticini

6
1.3. AMERICAN EEL
Species: Anguilla rostrata (Lesueur, 1817) Synonymous: none FAO common name: American eel (En)
Anguille amerique (Fr) Anguila americana (Sp)
IUCN Red List status: not evaluated Convention on International Trade in Endangered Species of Fauna and Flora (CITES): Last concern Resilience: low, doubling time on average 9 years Vulnerability: very high, due to human impact FAO fishing area: Atlantic, Western Central (31) and Atlantic, Northwest (21) Geographical distribution: Western North Atlantic, Gulf of Mexico, Atlantic coast of USA and South of Canada. This species breed in the Sargasso Sea in Western Atlantic Climate: subtropical, range from 4 °C to 25 °C Size and weight: species close to European eel but smaller size, usually reaching 50 cm length, with females growing much larger than males Description, biology: see the Type Species (Anguilla anguilla) Although very close to European eel, the FAO Guide notes the following external phenotypic characters that distinguish Anguilla rostrata from all the other eel species: presence of cycloid scales near the pectoral fins, small teeth in upper and lower jaws, lower jaw beyond upper jaw Habitat: Anguilla rostrata is found in all types of benthic environments, rivers, streams, estuaries and lakes that are connected to the sea. They spend their lives in freshwater and return to the sea for the breeding season
Source: FAO

7
1.4. JAPANESE EEL
Species: Anguilla japonica (Temminck and & Schlegel, 1847) Synonymous: none FAO common name: Japanese eel (En) Anguille du Japan (Fr)
Anguila japonesa (Sp) IUCN Red List Status: not evaluated Convention on International Trade in Endangered Species of Fauna and Flora (CITES): last concern Resilience: low, on average 10 years Vulnerability: high to very high FAO fishing Area: Pacific Northwest (61) Geographical distribution: around Japan and China, Pacific Northwest Ocean, This species breed in the Mariana Ridge, Western Pacific Climate: Subtropical, range from 4 °C to 27 °C Size and weight: common length 40 cm maxiumum weight 1.90 kg Description, biology: see the Type Species (Anguilla anguilla) Habitat: Anguilla japonica is found in all types of benthic environments, rivers, streams, estuaries and lakes that are connected to the sea. They spend their lives in freshwater and return to the sea for the breeding season

8
1.5. SHORT-FINNED EEL
Species: Anguilla australis australis (Richardson, 1841) Synonymous: none FAO common name: short-finned eel IUCN Red List Status: not evaluated Convention on International Trade in Endangered Species of Fauna and Flora (CITES): last concern. Resilience: low, doubling time averages 9 years Vulnerability: very high, due to human impact FAO Fishing Area: Pacific Southwest (81) Geographical distribution: Pacific Southwest, Australia, New Zealand, North New Caledonia, American Samoa. The short-finned eel spawns in the Coral Sea, off New Caledonia Climate: Subtropical Size: male – maximum 130 cm; female 105 cm; standard size – 45–50 cm Description, biology, habitat: see the Type Species (Anguilla anguilla)
1.6. TECHNICAL ASPECTS
There are many factors that justify eel farming. Biologically, eel have a high rate of survival in captivity, better tolerance to different water parameters, good growth rates and high productivity, thanks to well-tested rearing methods. Eel aquaculture is based solely on glass eels (elvers) caught in the wild and grown in captivity. The most widely used farming techniques worldwide are: extensive systems such as vallicultura in Italy, intensive rearing in open recirculation systems and intensive rearing in closed systems. Extensive rearing is the traditional form of eel aquaculture in Europe. Fish are
reared in large earth ponds, characterized by low density stock, using no technical equipment or artificial oxygen, at a temperature range of 18 to 25 °C.

9
Intensive closed system in calls for artificial tanks of different sizes, each used for a specific purpose, (for different purposes: nursery, quarantine, growing or, treatment), and which and can be either cdifferent shapes (circular or rectangular). Usually they the tanks are made of PVC, fiberglass or concrete. The technical equipment is complete and controls all the water parameters and flow rate. An efficient recycling system can increase eEel biomass in the system with a relatively small quantity of water.
Intensive open system is set in medium size earth ponds, with medium to low density of elvers biomass. This technique is similar to valliculture, but less available surface area and water is required.
1.7. WATER QUALITY CONTROL
All Anguilla spp. species are robust fish and can be raised in high density (intensive farming). However, great attention to physical and chemical parameters is required to guarantee high growth rate and survival, as follows: Temperature is the most important factor for eel production. In valliculture, around
25 °C is optimal for the rearing system, although the temperature can range from 18 to 26 °C. In a closed system, the water must be heated, with optimal results at 24–26 °C. Eel growth ceases at 12 °C. Water temperature is not a problem during eel migration because, in the yellow stage, eel can tolerate a high temperature range.
Salinity parameter is is an extremely variable parameter, ranging from freshwater to around 36 percent saltwater. Eels are euryhaline and adapt to different environmental conditions. While elvers prefer freshwater or brackish water with a low saline concentration, silver eels prefer high salinity.
Oxygen concentration must be high, at levels depending on the rearing methods – whether it is a saltwater or freshwater environment, or open or closed system. Eels can survive in a low oxygen concentration, but the best concentration is a saturation of 40 to 50 percent. Oxygen consumption is affected by many behavioral and environmental factors such as temperature, eel size, quantity of food and health conditions. In an intensive closed system, the oxygen level can easily be monitored and regulated by electronic instruments and aerators.
Nitrogen compounds such as ammonia are highly toxic. However, Anguilla spp. is tolerant to nitrites and to the less toxic nitrates. Free ammonia is extremely toxic and harmful, especially for gill epithelia at certain situations, such as water with high pH value and high fish density. A high concentration of ammonia in the gills makes the fish susceptible to secondary infections and to fungi, such as Saprolegna spp. Thus, recycling, biological filters and frequent water changes are often used to remove harmful substances from the water.
pH value optimum for eel farming is pH 7–8. The ideal situation is the availability of freshwater and saltwater to obtain an optimal mix and regulate the pH value as required. Achieving this value is closely related to temperature, salinity and oxygen concentration.

10
NITROGEN COMPOUNDS, NH3
NH3 (NH4)
Ammoniac (ammonium)
NO2
Nitrite
NO3
Nitrate
1.8. FEEDING AND GROWTH RATE
Eel farming calls for various type of diet, depending on the type of rearing methods and eel size. All forms of intensive eel farming often use moist paste or an artificial diet. Natural food diets call for frozen or fresh fish (whole or chopped) such as shrimp
and sardines. This use is now decreasing. Artificial diets call for pellets and extruded food, which contain a high level of
protein (40–50 percent) and a variable level of fats (7–20 percent).
The quantity of the food depends on many factors such as type of diet, body weight, bio-mass and number of daily meals. Silver eels stop feeding before migration with a consequent reduction in stomach size. The composition of the food gives good results with a suitable level of crude proteins and fats: essential L-amino acids such as arginine and methionine, essential fatty acids such as linoleic acid, vitamins and minerals. Eels reach commercial size after about two years.
1.9. DISEASES AND DISORDERS Worldwide, many eel diseases are problematic in both wild, saltwater environments, and in farm environments, which can be either freshwater or saltwater. Commercial harvesting of live eels has contributed to an increase in the spread of various pathogens (not all endemic): parasites, bacteria, fungi and viruses. The growth of eel diseases can be due to incorrect fishing methods, bad management, environmental factors such as inadequate temperature, high salinity or free ammonia, and infectious biological agents.

11
1.9.1. Parasitic diseases Parasitic diseases occur due to certain rearing situations. In nature, parasites are usually not pathogenic, but can become so due to overcrowding and high density biomass associated with low water exchange. The parasites most frequently found in eel farming are: Crustacean: Argulus spp. – fish lice; Learnea spp. – copepod crustaceans,
commonly called anchor worms; and the Ergasiluss spp.; Trematodes: Gyrodactylus spp. and Dactylogyrus spp. – gills and skin worms Nematodes: Anguillicola crassum – swim bladder disease; Fungi: Saprolegna spp. as a result of poor water quality and as a secondary
infection; Ichthyophonus hoferi – widespread in eels but with no serious symptoms; Protozoa: Ichthyophthirius multifilis – white spot disease; Tricodina spp. –found
often in skin and gills.
1.9.2. Infectious diseases Infectious diseases occur in the presence of the bacterial agents: Aeromonas punctata – red fin disease; Pseudomonas hydrophila – fin rot disease; and Vibrio anguillarum – red eel pest. However, the major diseases caused by secondary bacterial infection can be eradicated by maintaining conditions such as: controlling stress factors, eliminating poor farming practices, following valid quarantine protocol, and having correct diagnosis and effective treatment. 1.9.3. Viral diseases Three viral diseases are known to affect eel: cauliflower disease (EV2) – an orthomyoxovirus group, specific to
Anguilla Anguilla; viral kidney disease (EVE) – an IPN-like birnaviridae that occurs in European and
Japanese eel with a high mortality rate, especially for juveniles; eel virus American (EVA) – occurs in European and American eel, with the
specimens showing signs of haemorrhages and necroses in the muscle tissue.

12
Nematode: Anguillicola crassum (Responsible for major losses in European eel farming). Family: Anguillicolidae Courtesy: Ian Paperna, 1996 Genus: Angullicola Disease: swim bladder nematode Host: potentially all freshwater and brackish water fish may be affected (Paperna, 1991). Fish are the intermediate or final host for nematode. Copepods are the first intermediate hosts for Angullicolidae Site: swim bladder Predisposing factors: overcrowding, incorrect quarantine protocol, live food Pathology: Anguillicola spp. occurs in Anguilla japonica and Anguilla australis eels. Often it is found in earth ponds, rarely in intensive farming systems Pathological infection varies with farming conditions and eel species, serious infection causes haemorrhagich inflammation of the swim bladder Lesions are evident in post-juvenile eels. Up to 20% losses caused by secondary bacterial infection Prevention and controlcontrol: effective quarantine period, continuous monitoring, elimination of predisposing factors (intermediate hosts), adequate sanitation should prevent infection with a direct life cycle (e.g. clean the bottom of the tanks) Treatment and cure: anthelminthic for adults. Encysted nematodes are difficult to treat

13
2. STATISTICAL DATA
2.1. UNDATA The United Nations Commodity Trade Statistic Data Base (UNData) contains over 1 million entries on the commercial exchange of the various Commodity Codes dating back to 1962. Every year, more than 140 UN Member States provide statistical data to calculate the figures of international trade. The data are updated at regular intervals. The Commodity Codes in question are those of the following homogeneous product categories: fish, mollusks, aquatic invertebrates (Cod. 03); fresh or chilled eels (Commodity Code 30266), frozen eels (Commodity Code 30376), live eels (Commodity Code 30192). The above Commodity Codes are also used for European classification.
2.2. FAO FISHSTAT PLUS FAOSTAT is part of FAO’s mission to improve statistical data collection and dissemination for development, and to fight against global hunger and malnutrition. Member States and regional areas have been involved in gathering and sharing data since 1961. The FAO Fisheries and Aquaculture Department compiles fisheries and aquaculture statistical data using FishStat Plus as a part of FAOSTAT. FishStat statistical data has been used to present an exhaustive overview of the eel market at global level, including: global production, aquaculture production and capture production. ASFIS Eel species considered in relation to statistical analysis are: European eel, American eel, Japanese eel and Short- finned eel. Data on global eel trade has been processed (aggregated) for live eels, fresh or chilled eels, frozen eels, smoked eels (FAOSTAT PLUS does not use Commodity Codes).
2.3. EUROSTAT EUROSTAT provides statistical details on the European Member States and candidate countries, through various statistical publications. This study extracted EUROSTAT data on the smoked eel trade from the 2010 TRAFFIC report on Trade in Anguilla species (Crook, 2010).
14
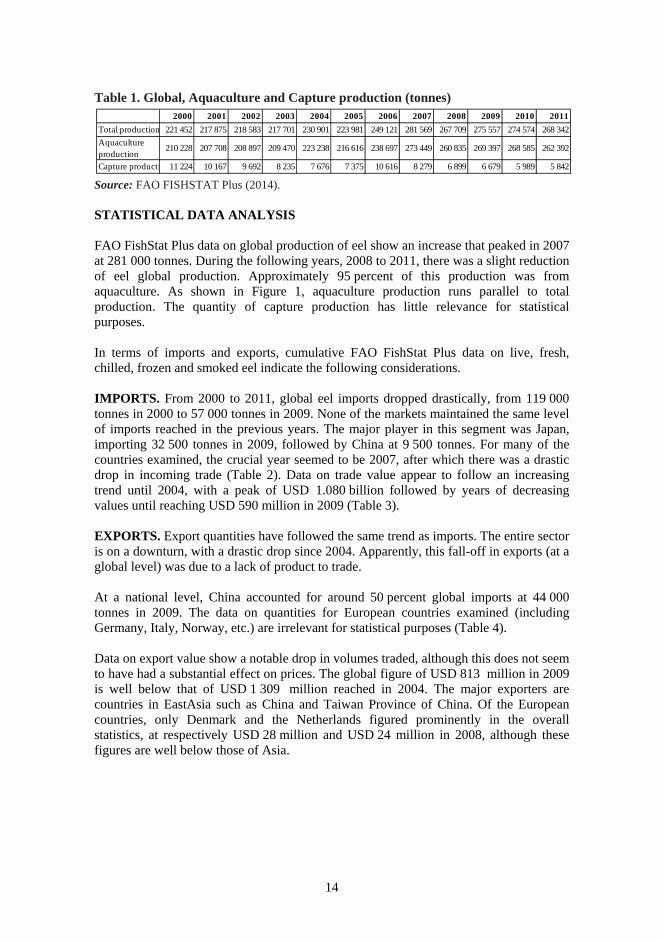
Table 1. Global, Aquaculture and Capture production (tonnes)
Source: FAO FISHSTAT Plus (2014). STATISTICAL DATA ANALYSIS FAO FishStat Plus data on global production of eel show an increase that peaked in 2007 at 281 000 tonnes. During the following years, 2008 to 2011, there was a slight reduction of eel global production. Approximately 95 percent of this production was from aquaculture. As shown in Figure 1, aquaculture production runs parallel to total production. The quantity of capture production has little relevance for statistical purposes. In terms of imports and exports, cumulative FAO FishStat Plus data on live, fresh, chilled, frozen and smoked eel indicate the following considerations. IMPORTS. From 2000 to 2011, global eel imports dropped drastically, from 119 000 tonnes in 2000 to 57 000 tonnes in 2009. None of the markets maintained the same level of imports reached in the previous years. The major player in this segment was Japan, importing 32 500 tonnes in 2009, followed by China at 9 500 tonnes. For many of the countries examined, the crucial year seemed to be 2007, after which there was a drastic drop in incoming trade (Table 2). Data on trade value appear to follow an increasing trend until 2004, with a peak of USD 1.080 billion followed by years of decreasing values until reaching USD 590 million in 2009 (Table 3). EXPORTS. Export quantities have followed the same trend as imports. The entire sector is on a downturn, with a drastic drop since 2004. Apparently, this fall-off in exports (at a global level) was due to a lack of product to trade. At a national level, China accounted for around 50 percent global imports at 44 000 tonnes in 2009. The data on quantities for European countries examined (including Germany, Italy, Norway, etc.) are irrelevant for statistical purposes (Table 4). Data on export value show a notable drop in volumes traded, although this does not seem to have had a substantial effect on prices. The global figure of USD 813 million in 2009 is well below that of USD 1 309 million reached in 2004. The major exporters are countries in EastAsia such as China and Taiwan Province of China. Of the European countries, only Denmark and the Netherlands figured prominently in the overall statistics, at respectively USD 28 million and USD 24 million in 2008, although these figures are well below those of Asia.
2000 2001 2002 2003 2004 2005 2006 2007 2008 2009 2010 2011
Total production 221 452 217 875 218 583 217 701 230 901 223 981 249 121 281 569 267 709 275 557 274 574 268 342
Aquaculture production
210 228 207 708 208 897 209 470 223 238 216 616 238 697 273 449 260 835 269 397 268 585 262 392
Capture producti 11 224 10 167 9 692 8 235 7 676 7 375 10 616 8 279 6 899 6 679 5 989 5 842

15
2.4. TOTAL IMPORT QUANTITY
Table 2. Total import quantity (tonnes)
Source: FAO FISHSTAT Plus (2014).
Country 2000 2001 2002 2003 2004 2005 2006 2007 2008 2009
China 2 479 1 955 1 342 721 1 604 5 679 7 671 11 067 10 288 9 439
Japan 85 673 86 782 80 639 66 367 75 362 55 960 55 726 56 732 32 708 32 547Korea, Republic of 2 868 5 784 5 484 4 537 5 486 1 775 2 188 587 2 748 288Taiwan Province of China 14 732 13 328 9 655 5 110 4 252 3 642 2 847 2 757 2 475 2 396
Denmark 1 299 2 586 1 786 1 542 1 552 1 262 864 1 055 742 1 074
France 248 347 262 241 166 175 207 216 183 215
Germany 2 270 2 443 2 162 2 194 1 953 3 124 2 301 3 051 2 126 2 153
Greece 15 14 693 700 587 564 481 661 357 284
Italy 1 169 1 096 719 929 794 906 866 845 780 682
Netherlands 2 438 3 181 2 420 2 744 2 499 2 335 1 638 2 163 1 815 2 170
Norway 1 <0.5 1 2 1 2 1 3 4 4
Spain 738 655 668 623 556 356 327 273 413 289
Sweden 90 264 159 156 202 199 235 205 175 34United Kingdom 175 358 268 187 264 275 268 423 373 287
Australia 48 63 54 105 97 75 159 101 46 69
Canada 595 470 429 383 383 563 484 448 567 519United States of America 1 253 1 123 1 158 1 225 1 312 1 744 1 870 1 042 1 507 976
Other 2 735 2 846 2 220 4 130 3 632 5 314 4 204 5 083 4 934 3 837
TOTAL 118 826 123 296 110 119 91 916 100 702 83 950 82 337 86 712 62 241 57 263

16
2.5. IMPORT VALUES Table 3. Total import value (‘000 USD)
Source: FAO FISHSTAT Plus (2014).
Country 2000 2001 2002 2003 2004 2005 2006 2007 2008 2009
China 2 698 2 881 1 654 1 087 1 865 4 974 8 762 11 258 9 721 11 657
Japan 899 310 661 252 648 994 556 555 885 370 772 290 727 265 649 290 516 787 425 642
Korea, Republic of 16 494 30 561 31 190 25 320 33 991 13 296 15 285 5 946 24 699 3 157
Taiwan Province of China 23 897 21 352 12 798 6 792 5 196 7 237 3 931 3 534 3 673 4 430
Denmark 8 928 17 395 11 805 13 627 17 924 20 314 13 879 16 217 12 056 11 596
France 2 893 3 954 3 476 3 120 5 816 9 601 7 477 8 811 7 619 3 428
Germany 16 523 18 814 16 831 20 214 20 689 34 538 27 983 43 061 33 305 27 199
Greece 144 265 4 678 5 238 6 773 6 362 6 321 8 024 5 696 2 488
Italy 5 932 6 858 4 806 7 572 8 565 10 649 10 026 9 927 8 809 7 426
Netherlands 12 166 16 887 14 280 18 231 24 777 26 578 18 922 28 274 26 159 26 193
Norway 5 13 22 18 13 38 24 94 112 49
Spain 16 490 13 761 14 759 12 743 14 857 22 390 13 409 13 700 13 278 5 969
Sweden 579 1 733 1 116 1 444 2 272 2 572 2 999 4 067 3 635 526
United Kingdom 4 310 4 921 4 664 4 581 7 657 13 028 6 122 6 424 15 040 4 186
Australia 279 362 355 716 782 774 1 667 1 016 675 908
Canada 1 370 1 158 1 158 1 443 1 480 1 905 1 915 1 613 2 250 3 214
United States of America 8 740 6 819 7 564 8 484 10 803 15 225 15 908 8 767 15 548 8 034
Other 19 276 20 089 18 807 27 479 30 533 41 361 37 992 63 247 65 558 45 824
TOTAL 1 040 033 829 075 798 957 714 664 1 079 363 1 003 132 919 887 883 270 764 620 591 926

17
2.6. EXPORT QUANTITY Table 4. Total export quantity (tonnes)
Source: FAO FISHSTAT Plus (2014).
Country 2000 2001 2002 2003 2004 2005 2006 2007 2008 2009
China 73 478 81 800 72 600 63 761 76 810 58 500 63 025 60 112 44 646 44 093
Japan 52 12 9 76 59 62 97 59 37 71
Korea, Republic of 57 9 2 106 38 95 23 62 47 28
Taiwan Province of China 26 048 25 216 27 891 22 236 23 150 14 665 10 783 16 662 9 406 6 933
Denmark 3 150 2 757 3 172 3 084 2 581 2 257 2 423 2 109 2 099 2 686
France 987 524 889 658 1 064 401 447 450 359 337
Germany 261 228 277 428 358 284 184 663 592 560
Greece 347 796 875 884 684 578 786 557 406 252
Italy 1 107 549 403 307 226 151 181 166 125 126
Netherlands 1 920 2 026 1 616 1 323 1 745 2 037 1 960 1 524 1 960 1 950
Norway 279 299 373 251 216 247 292 193 210 67
Spain 244 291 374 317 406 561 284 250 389 641
Sweden 824 799 389 370 677 848 766 542 566 464United Kingdom 929 932 876 682 598 559 420 487 570 493
Australia 515 574 425 349 369 273 234 306 245 169
Canada 602 443 323 580 2 553 1 938 1 619 1 427 1 426 1 632United States of America 1 773 3020 3 311 3 683 2 327 2 223 1660 1 958 2 378 2 347
Other 13 487 14 115 14 026 15 142 17 187 20 698 15 669 10 738 17 528 19 902
TOTAL 126 060 134 390 127 831 114 237 131 048 106 377 100 853 98 265 82 989 82 751

18
2.7. EXPORT VALUES Table 5. Total export value (‘000 USD)
Source: FAO FISHSTAT Plus (2014).
2.8. FAO-FISHSTAT PLUS DATA 2.8.1. Global Production Table 6. World global production
Source: FAO FISHSTAT Plus (2014).
Country 2000 2001 2002 2003 2004 2005 2006 2007 2008 2009
China 770 222 656 336 615 811 527 746 858 267 750 206 741 830 676 055 554 543 543 215
Japan 1 360 145 263 6 545 6 662 15 767 12 737 9 025 5 069 7 772
Korea, Republic of 579 317 304 214 634 275 205 68 61 223
Taiwan Province of China 212 906 169 644 184 745 171 414 227 367 187 471 131 083 165 210 141 471 90 295
Denmark 24 511 20 075 21 719 25 522 28 289 30 279 32 067 28 706 28 768 28 387
France 30 382 23 874 32 907 34 380 50 998 80 749 37 589 49 878 46 985 14 291
Germany 2 623 1 775 2 085 3 926 3 759 3 871 2 429 11 066 10 316 7 980
Greece 2 520 5 099 6 753 8 341 8 652 7 010 10 365 8 337 5 828 3 436
Italy 7 114 3 679 2 495 2 383 2 352 1 807 2 477 2 217 1 641 1 304
Netherlands 13 827 14 560 12 232 12 788 20 845 25 802 26 271 24 189 28 721 23 510
Norway 1 346 1 688 1 724 1 343 1 544 1 912 2 267 1 723 1 743 571
Spain 14 250 13 452 10 574 7 452 17 191 16 583 8 801 12 016 14 455 4 519
Sweden 5 257 5 001 2 334 2 813 6 796 9 455 9 090 7 678 7 264 5 082United Kingdom 7 168 6 723 7 998 8 759 13 136 21 265 9 501 11 396 9 926 7 446
Australia 3 157 3 753 3 608 3 552 4 083 3 341 3 528 4 002 4 138 2 605
Canada 2 522 1 820 1 827 3 471 7 098 8 183 6 204 6 902 4 898 5 385United States of America 4 838 7 121 6 581 7 793 6 183 8 583 6 416 10 618 8 932 7 966
Other 18 506 24 690 25 288 32 071 45 045 59 134 46 934 49 707 59 489 58 894
TOTAL 1 123 088 959 752 939 248 860 513 1 308 901 1 231 693 1 089 794 1 078 793 934 248 812 881
Species group 2001 2002 2003 2004 2005 2006 2007 2008 2009 2010 2011
Quantity tonnes 210 303 209 823 209 963 223 672 217 185 238 831 273 479 265 114 275 174 271 536 255 284Value (‘000 USD) 800 372 773 281 690 782 740 090 969 803 1 044 383 1 270 489 1 324 802 1 395 645 1 526 197 1 685 107
River eels

19
STATISTICAL DATA ANALISYS Global production. The tables and graphs on global production (in tonnes) have been drawn up on the basis of FAO FishStat Plus data for the years 2000 to 2011 (the most recent year for which data is available). The total aggregate data and the relevant graph show a substantial increase in the quantities produced, going against the trend of other available data, as the trend seems to be slightly on the increase. The figure for 2009, 275 000 tonnes, is slightly lower than that of 2007, 281 500 tonnes (Table 1). The previous tables show the major stakeholders at a global level in various geographical areas (Asian countries, EU-Member States plus Norway, Australia, Canada and USA). The data, which probably includes quantities of various eel species and thus is worthy of note in terms of trade, shows: China is the major player not only at a regional level, but also in global terms with a
market share of around 78 percent; Europe holds a share equal to approximately 3.5 percent at 9 200 tonnes (in 2008) –
the species in question for statistical purposes is surely Anguilla Anguilla; Market shares of Australia, Canada and the USA are not relevant.
In this case, we can assume the figures for Australia refer to the production of short-finned eel (Anguilla australis australis), while those for Canada and the USA refer to the production of American eel (Anguilla rostrata). These species have been subject to monitoring several times by the federal authorities in the USA and Ottawa in Canada due to the drastic reduction in wild eel catches all along the west coast of the Atlantic Ocean. Another point to consider in the above two cases is that none of the eel species is included in the FAO Production by Species Tables because they do not reach a minimum production of approximately 250 000 tonnes per year. Only the Anguilla japonica is currently included, although there are currently no protection programmes for this eel of East Asian origin (Table 8). The total values reported on Table 6 and Table 8 are very similar to the data on World Aquaculture Production by species groups, both in terms of value and quantity (tonnes). The two databases show a certain concurrence in terms of results and trends: a rising trend up to 2006 or 2007 with subsequent stabilization of the market and global production in the following years.

20
Table 7. Global production (tonnes).
Source: FAO FISHSTAT Plus (2014). 2.8.2. Aquaculture Production Table 8. World Aquaculture Production
Source: FAO FISHSTAT Plus (2014). STATISTICAL DATA ANALISYS Aquaculture production. FAO FishStat Plus data on aquaculture production indicates the share in global production. Tonnes are used as the unit of measure, and the period examined is from 2000 to 2011. In 2010 aquaculture production accounted for 97 percent of total production at 268 585 tonnes. The figure is significant and shows that most eel production is aquaculture production. In 2011, the total amount of aquaculture production is 253 000 tonnes. Data on China (the major stakeholder) show that approximately 99 percent of its production is from aquaculture. Taiwan Province of China, which has a more modest market share, follows the same trend.
Country 2000 2001 2002 2003 2004 2005 2006 2007 2008 2009 2010 2011
China 140 067 135 078 141 721 139 344 153 828 154 703 177 119 207 332 205 325 214 698 213 811 208 266
Japan 24 883 23 800 21 722 22 115 22 154 19 979 20 885 22 530 21222 22 673 20 788 22 360Korea, Republic of 2 725 2 644 2 968 4 332 5 205 5 610 7 966 10 597 6576 6 766 8 021 15 278Taiwan Province of China 30 480 34 160 34 862 35 116 33 480 28 481 23 838 24 822 21038 19 044 19 361 10 535
Netherlands 4 051 4 374 4 241 4 566 4 831 4 317 5 316 4 258 3956 3 003 3 301 3 369
Denmark 3 294 2 758 1735 2 632 2 357 2 204 2 279 2 145 1352 2 125 1 954 1 510
France 1 504 1 433 1 372 1 382 1 301 1 176 1 219 1 229 1221 1 116 1 300 1 318
Germany 836 788 786 401 565 614 870 734 775 690 698 885
Italy 3 249 2 946 2 101 2 008 1 607 1 247 871 1 109 626 654 736 1 048
Norway 281 304 310 240 237 249 296 194 211 69
Spain 481 401 517 379 481 482 489 529 594 569 476 489
Sweden 834 780 801 735 726 890 921 873 838 518 523 530United Kingdom 796 595 571 588 504 493 405 486 416 463 461 459
Australia 217 284 244 165 126 105 93 211 189 205 44 99
Canada 681 474 472 633 503 382 424 395 411 337 341 337United States of America 649 393 277 463 326 406 351 336 268 330 717 1751
Other 6 424 6 663 3 883 2 902 2 670 2 643 5 779 3 789 2 691 2 297
TOTAL 221 452 217 875 218 583 217 701 230 901 223 981 249 121 281 569 267 709 275 557 272 532 268 234
Species group 2002 2003 2004 2005 2006 2007 2008 2009 2010
Quantity tonnes 200 732 200 298 214 053 208 254 229 506 264 952 253 795 262 729 261 617
Value (‘000 USD) 718 240 619 366 649 018 879 906 940 326 1 170 440 1 242 023 1 320 056 1 441 566
Anguilla Japonica

21
Of the European countries, only the Netherlands with 3 000 tonnes and Denmark with 1 900 tonnes have market shares in the range of a few percentage points. The figure for Italy is interesting, as there has been a drastic drop in aquaculture eel production – from 2 700 tonnes in 2000 to 1 000 tonnes in 2011. This reduction is probably due to businesses which are no longer profitable and a conversion from eel to other fish species more profitable both in terms of market and price stability, such as sea bream (Sparus aurata) or seabass (Dicentrarchus labrax) or new species such as white sturgeon (Acipenser transmontanus). No figures are indicated for Australia, Canada and the USA, as aquaculture production of this species in these countries is irrelevant for statistical purposes. The aggregate trend of aquaculture production is in line with that of global production. Production stabilized in 2007, most probably in response to mature markets. In some cases, the introduction of catch quotas on juvenile eel limited the quantity of product for on-growing on farms. Aquaculture Production by Principal Species (Table 8. World aquaculture production) data provide only information on Anguilla japonica for the period 2002–2010. In 2009, this eel species held a major share of the market, equal to 262 769 tonnes of the total 269 397 tonnes. There are no figures for other eel species (including Anguilla anguilla) as the volume of these in 2010 was less than 250 000 tonnes. Table 9. Aquaculture production (tonnes)
Source: FAO FISHSTAT Plus (2014). 2.8.3. Capture production Table 10. World capture production (tonnes)
Source: FAO FISHSTAT Plus (2014).
Country 2000 2001 2002 2003 2004 2005 2006 2007 2008 2009 2010 2011
China 140 067 135 078 141 721 139 344 153 828 154 703 177 119 207 332 205 325 214 698 213 811 208 266
Japan 24 118 23 123 21 112 21 526 21 540 19 495 20 583 22 241 20 952 22 406 20 543 22 006
Korea, Republic of 2 725 2 644 2 968 4 312 5 205 5 575 7 966 10 557 6 480 6 621 7 902 7 185Taiwan Province of China 30 480 34 160 34 862 35 116 33 480 28 481 23 838 24 822 21 038 19 044 19 361 10 521
Denmark 2 674 2 100 1 166 2 012 1 823 1 673 1 699 1 614 895 1 658 1 900 1 154
Germany 150 150 150 150 322 329 567 440 447 385 398 660
Greece 602 639 433 544 557 372 385 454 489 428 430 320
Italy 2 700 2 500 1 699 1 550 1 220 1 132 807 1 000 551 567 647 1 000
Netherlands 3 700 4 000 3 868 4 200 4 500 4 000 5 000 4 000 3 700 2 800 3 000 3 000
Spain 411 339 424 339 424 427 403 479 534 488 423 427
Other 2 601 2 975 494 377 339 429 330 510 424 302 170
TOTAL 210 228 207 708 208 897 209 470 223 238 216 616 238 697 273 449 260 835 269 397 268 585 254 539
Species group 2004 2005 2006 2007 2008 2009 2010 2011
River eels 11 791 9 578 13 643 10 917 8 845 8 938 8 440 7 546

22
STATISTICAL DATA ANALISYS Capture production. FAO FishStat Plus data on capture production indicate the share of global production, in tonnes, from 2000 to 2011. The market share represented a small percentage of the global production, and therefore of little economic importance, and was reported merely for completeness purposes. This data was not in line with Capture Production by Group of Species data for river eels (Table 10). The total capture production in 2010 was 5 989 tonnes and 4 342 tonnes in 2011. France had the largest market share in 2011, with 1 318 tonnes or approximately 23 percent of the total. After a remarkable drop in the capture of wild eel, some countries such as New Zealand, established quotas in order to limit the capture of wild eel enforcing locally the international regulation, These fishing limits affected both the fresh product to send to markets (capture production) and eel to send to fish farms for fattening (aquaculture production). Table 11. Capture production (tonnes)
Source: FAO FISHSTAT Plus (2014).
Country 2000 2001 2002 2003 2004 2005 2006 2007 2008 2009 2010 2011
Japan 765 677 610 589 614 484 302 289 270 263 245 230
Korea, Republic of
0 0 0 20 0 35 0 40 96 145 119 72
Denmark 620 658 569 620 534 531 580 531 457 467 422 356
France 1 462 1 391 1 372 1 382 1 301 1 176 1 219 1 229 1 221 1 194 1 300 1 318
Germany 686 638 636 251 243 285 303 294 328 305 298 225
Italy 549 446 402 458 387 115 64 109 75 87 64 48
Netherlands 351 374 373 366 331 317 316 258 256 253 307 369
Norway 281 304 310 240 237 249 296 194 211 69 32 32
Sweden 561 580 634 565 568 668 730 698 666 518 523 355
United Kingdom
796 595 571 588 504 493 405 486 416 463 461 459
Australia 170 213 200 133 118 97 85 70 84 57 44 36
Canada 681 474 472 633 503 382 604 547 411 409 349 313
United States of America
649 393 277 463 326 406 351 336 268 330 384 529
Other 3 653 3 424 3 266 1 927 2 110 2 137 5 361 3 198 2 140 2 119 1 441
TOTAL 11 224 10 167 9 692 8 235 7 676 7 375 10 616 8 279 6 899 6 679 5 989 4 342

23
2.9. COMMODITY CODE 30266 (EELS: FRESH OR CHILLED, WHOLE) Fresh fish. The definition of fresh fish, in accordance with FAO Code of Practice for Fish and Fisheries Products specifies: products that have received no preserving treatment other than chilling. The chilling facility should be capable of maintaining the temperature of the stock between 0 and 4 °C. The chilled product must meet the requirements for preventing development of pathogens in foodstuffs for several days. This system is a discrete limiting factor against the proliferation of bacteria, preventing also enzyme activity. The available free water activity (AW) value is decreased, and temperatures are maintained at a few degrees (°C) above zero, as lower temperatures would freeze the product. The fish must be healthy and chilled as soon as possible after being caught, entering a continuous, uninterrupted cold-chain process, which is a technique used to keep foodstuffs for short periods of time. STATISTICAL DATA ANALISYS Fresh or chilled eel. In terms of the Commodity Code for fresh or chilled eel, UN Data divides the market into two macro geographical areas: EastAsia and European Union (EU). This study examined China, Hong Kong, Japan and Korea in Southeast Asia, and Italy, Spain and Denmark in the EU. It considered the last ten years of eel trade, imports and exports, up to and including the last year on which data is available. Imports. At the European level (EU-27 data), the effect of the Washington Convention, with the inclusion of Anguilla anguilla in Appendix II of CITES, has proven irrelevant. Since the peak volumes were reached in 2004, there has been a considerable drop in incoming trade volume, in terms of value and, in particular, in terms of quantity. The figures for Spain and Denmark have also followed this trend. However, data concerning Italian imports are not in line with this trend, so it isn't easy to draw conclusions. Data on imports into Asian countries first and foremost are incomplete. The statistical data are unreliable for Japan, China and Korea, although Hong Kong has shown a clear drop since 2008. Exports. The volume of European trade (Table 30) has been practically equal to zero since 2005 up to 2010. In 2012 the volume raised and reached 2003 figure. Therefore we can only assume that all the product is consumed by the home market. Denmark is the only country with a slight and constant increase in exports, although the figures for 2010 are notably lower than those for 2008. Quantities traded seem to be constant and, therefore, at the same levels for the period in question. As statistical data on Asian countries is incomplete, it is impossible to establish a medium-term trend, but there has obviously been a drastic reduction in exports from China and especially Hong Kong (both exports and re-exports). These data are quite significant for the last 5-year period, 2008-2012, with an evident reduction that corresponds to the inclusion of the

24
European eel in Appendix II of CITES. In this case, we assume that product is scarce, and therefore available stocks are used almost entirely on the home market. As for the species considered in this segment, it is unclear (in particular for the Asian area) whether data refers to the Japanese eel or also to the European eel. We can assume the drop in the European eel figures has been compensated by an over exploitation of the Japanese eel (there are no international limits on this species). Unfortunately, for this analysis, we only have raw, often incomplete data to consider, based on non-homogeneous information that, for example refers to different eel species. The trade policies of the various countries are almost unknown as are the various market interactions – it is impossible to know how effective international regulations are and to what extent they are enforced in each country. However, it is clear that the peak for this market segment (fresh – chilled eel) has already been reached. We should be able to consider the impact of international legislation on Anguilla anguilla over the next five years, as well as the possibility of adding a new endangered species, such as the American eel (Anguilla rostrata) to the CITES appendixes. UN Data are available only until 2012, although it must be specified that data on this last year are not consolidated. FAO FishStat Plus Data on the 3-year period 2007–2009, Commodity Code 30266: Table 12. 030192 Eels (Anguilla spp. fresh or chilled) – International export of Fishery Commodities by FAO
Source: FAO FISHSTAT Plus (2014). Data from United Nations Commodity Trade Statistics Database (UN ComTrade) was obtained from the major global importers with the value of imports and exports for the four years: 2008 to 2011. Table 13. Importer Countries (30266 – COMTRADE)
Source: United Nations Commodity Trade Statistic Database (COMTRADE).
Year 2009 2010 2011
Quantity (tonnes) 5 280 1 801 1 042
Value (‘000 USD) 28 697 15 547 9 227
Country Value (USD)
Germany 8 729 000
Italy 6 256 000
Spain 4 824 000
United Kingdom 3 884 000
China, Hong Kong SAR 1 968 000
Other Reporters 13 206 000
Total 38 869 000

25
Table 14. Exporters countries (30266 – COMTRADE)
Source: United Nations Commodity Trade Statistic Database (COMTRADE). Table 15. Import years (30266 – COMTRADE)
Source: United Nations Commodity Trade Statistic Database (COMTRADE). Table 16. Export years (30266 – COMTRADE)
Source: United Nations Commodity Trade Statistic Database (COMTRADE).
Country Value (USD)
Indonesia 39 538 000
Denmark 17 789 000
Sweden 4 501 000
Netherlands 3 344 000
France 3 264 000
Other Reporters 12 693 000
Total 81 129 000
Year Value (USD)
2011 7 180 000
2010 6 313 000
2009 11 343 000
2008 14 031 000
Country Value (USD)
2011 7 432 000
2010 15 819 000
2009 28 550 000
2008 29 329 000

26
2.9.1 Import Table 17. Import China (30266 – UNdata)
Source: UNdata, United Nations Statistic Division, Commodity Trade Statistics Database. Table 18. Import Hong Kong (30266 – UNdata)
Source: UNdata, United Nations Statistic Division, Commodity Trade Statistics Database.
Country or Area Year Comm. Code Commodity Trade (USD) Weight (kg)
China import 2001 30266 Eels, fresh or chilled, whole NA NA
China import 2002 30266 Eels, fresh or chilled, whole NA NA
China import 2003 30266 Eels, fresh or chilled, whole NA NA
China import 2004 30266 Eels, fresh or chilled, whole NA NA
China import 2005 30266 Eels, fresh or chilled, whole NA NA
China import 2006 30266 Eels, fresh or chilled, whole 198 113
China import 2007 30266 Eels, fresh or chilled, whole 13 838 10 200
China import 2008 30266 Eels, fresh or chilled, whole 1 209 47
China import 2009 30266 Eels, fresh or chilled, whole 3 780 145
China import 2010 30266 Eels, fresh or chilled, whole 3 379 153
China import 2011 30266 Eels, fresh or chilled, whole 2 941 107
China import 2012 30266 Eels, fresh or chilled, whole NA NA
Country or Area Year Comm. Code Commodity Trade (USD) Weight (kg)
China, Hong Kong SAR import 2001 30266 Eels, fresh or chilled, whole 565 903 219 135
China, Hong Kong SAR import 2002 30266 Eels, fresh or chilled, whole 442 902 233 440
China, Hong Kong SAR import 2003 30266 Eels, fresh or chilled, whole 105 887 10 249
China, Hong Kong SAR import 2004 30266 Eels, fresh or chilled, whole 43 056 1 921
China, Hong Kong SAR import 2005 30266 Eels, fresh or chilled, whole 621 235 230 020
China, Hong Kong SAR import 2006 30266 Eels, fresh or chilled, whole 1 459 945 512 630
China, Hong Kong SAR import 2007 30266 Eels, fresh or chilled, whole 1 002 634 272 469
China, Hong Kong SAR import 2008 30266 Eels, fresh or chilled, whole 1 601 036 310 355
China, Hong Kong SAR import 2009 30266 Eels, fresh or chilled, whole 134 692 51 025
China, Hong Kong SAR import 2010 30266 Eels, fresh or chilled, whole 34 284 1 239
China, Hong Kong SAR import 2011 30266 Eels, fresh or chilled, whole 198 259 9 250
China, Hong Kong SAR import 2012 30266 Eels, fresh or chilled, whole 270 667 14 948

27
Table 19. Import Japan (30266 – UNdata)
Source: UNdata, United Nations Statistic Division, Commodity Trade Statistics Database. Table 20. Import Korea (30266 – UNdata)
Source: UNdata, United Nations Statistic Division, Commodity Trade Statistics Database.
Country or Area Year Comm. Code Commodity Trade (USD) Weight (kg)
Japan import 2001 30266 Eels, fresh or chilled, whole 176 981 22 039
Japan import 2002 30266 Eels, fresh or chilled, whole NA NA
Japan import 2003 30266 Eels, fresh or chilled, whole 16 034 1 562
Japan import 2004 30266 Eels, fresh or chilled, whole 11 701 1 000
Japan import 2005 30266 Eels, fresh or chilled, whole NA NA
Japan import 2006 30266 Eels, fresh or chilled, whole NA NA
Japan import 2007 30266 Eels, fresh or chilled, whole NA NA
Japan import 2008 30266 Eels, fresh or chilled, whole NA NA
Japan import 2009 30266 Eels, fresh or chilled, whole NA NA
Japan import 2010 30266 Eels, fresh or chilled, whole NA NA
Japan import 2011 30266 Eels, fresh or chilled, whole NA NA
Japan import 2012 30266 Eels, fresh or chilled, whole NA NA
Country or Area Year Comm. Code Commodity Trade (USD) Weight (kg)
Rep. of Korea import 2001 30266 Eels, fresh or chilled, whole 3 661 470
Rep. of Korea import 2002 30266 Eels, fresh or chilled, whole
Rep. of Korea import 2003 30266 Eels, fresh or chilled, whole 14 897 1 883
Rep. of Korea import 2004 30266 Eels, fresh or chilled, whole 3 875 600
Rep. of Korea import 2005 30266 Eels, fresh or chilled, whole
Rep. of Korea import 2006 30266 Eels, fresh or chilled, whole
Rep. of Korea import 2007 30266 Eels, fresh or chilled, whole
Rep. of Korea import 2008 30266 Eels, fresh or chilled, whole 73 5
Rep. of Korea import 2009 30266 Eels, fresh or chilled, whole
Rep. of Korea import 2010 30266 Eels, fresh or chilled, whole 81 10

28
Table 21. Import EU-27 (30266 – UNdata)
Source: UNdata, United Nations Statistic Division, Commodity Trade Statistics Database. Table 22. Import Italy (30266 – UNdata)
Source: UNdata, United Nations Statistic Division, Commodity Trade Statistics Database.
Country or Area Year Comm. Code Commodity Trade (USD) Weight (kg)
EU-27 import 2001 30266 Eels, fresh or chilled, whole 663 138 115 400
EU-27 import 2002 30266 Eels, fresh or chilled, whole 266 161 68 737
EU-27 import 2003 30266 Eels, fresh or chilled, whole 297 727 42 109
EU-27 import 2004 30266 Eels, fresh or chilled, whole 1 107 235 129 307
EU-27 import 2005 30266 Eels, fresh or chilled, whole 348 078 78 420
EU-27 import 2006 30266 Eels, fresh or chilled, whole 404 177 60 621
EU-27 import 2007 30266 Eels, fresh or chilled, whole 489 209 61 900
EU-27 import 2008 30266 Eels, fresh or chilled, whole 168 310 21 200
EU-27 import 2009 30266 Eels, fresh or chilled, whole 101 493 12 700
EU-27 import 2010 30266 Eels, fresh or chilled, whole NA NA
EU-27 import 2011 30266 Eels, fresh or chilled, whole 32 232 1 905
EU-27 import 2012 30266 Eels, fresh or chilled, whole NA NA
Country or Area Year Comm. Code Commodity Trade (USD) Weight (kg)
Italy import 2001 30266 Eels, fresh or chilled, whole 673 061 123 355
Italy import 2002 30266 Eels, fresh or chilled, whole 392 997 69 051
Italy import 2003 30266 Eels, fresh or chilled, whole 390 068 53 412
Italy import 2004 30266 Eels, fresh or chilled, whole 503 913 68 508
Italy import 2005 30266 Eels, fresh or chilled, whole 1 543 594 160 081
Italy import 2006 30266 Eels, fresh or chilled, whole 978 920 102 421
Italy import 2007 30266 Eels, fresh or chilled, whole 634 994 47 339
Italy import 2008 30266 Eels, fresh or chilled, whole 1 161 688 108 657
Italy import 2009 30266 Eels, fresh or chilled, whole 1 638 090 139 081
Italy import 2010 30266 Eels, fresh or chilled, whole 1 432 408 120 683
Italy import 2011 30266 Eels, fresh or chilled, whole 2 024 426 129 012
Italy import 2012 30266 Eels, fresh or chilled, whole 189 971 13 932

29
Table 23. Import Denmark (30266 – UNdata)
Source: UNdata, United Nations Statistic Division, Commodity Trade Statistics Database. Table 24. Import Spain (30266 – UNdata)
Source: UNdata, United Nations Statistic Division, Commodity Trade Statistics Database.
Country or Area Year Comm. Code Commodity Trade (USD) Weight (kg)
Denmark import 2001 30266 Eels, fresh or chilled, whole 2 895 438 454 854
Denmark import 2002 30266 Eels, fresh or chilled, whole 976 580 144 622
Denmark import 2003 30266 Eels, fresh or chilled, whole 919 686 116 963
Denmark import 2004 30266 Eels, fresh or chilled, whole 627 476 65 638
Denmark import 2005 30266 Eels, fresh or chilled, whole 1 558 771 143 666
Denmark import 2006 30266 Eels, fresh or chilled, whole 904 166 81 907
Denmark import 2007 30266 Eels, fresh or chilled, whole 530 627 46 241
Denmark import 2008 30266 Eels, fresh or chilled, whole 648 137 55 280
Denmark import 2009 30266 Eels, fresh or chilled, whole 331 835 36 147
Denmark import 2010 30266 Eels, fresh or chilled, whole 272 763 31 454
Denmark import 2011 30266 Eels, fresh or chilled, whole 134 449 11 195
Denmark import 2012 30266 Eels, fresh or chilled, whole 423 449 29 250
Country or Area Year Comm. Code Commodity Trade (USD) Weight (kg)
Spain import 2001 30266 Eels, fresh or chilled, whole 8 829 315 563 951
Spain import 2002 30266 Eels, fresh or chilled, whole 10 503 386 699 374
Spain import 2003 30266 Eels, fresh or chilled, whole 7 037 116 434 251
Spain import 2004 30266 Eels, fresh or chilled, whole 8 312 334 453 026
Spain import 2005 30266 Eels, fresh or chilled, whole 13 018 257 222 034
Spain import 2006 30266 Eels, fresh or chilled, whole 7 762 427 190 993
Spain import 2007 30266 Eels, fresh or chilled, whole 7 482 360 345 354
Spain import 2008 30266 Eels, fresh or chilled, whole 1 920 818 285 035
Spain import 2009 30266 Eels, fresh or chilled, whole 1 619 460 192 496
Spain import 2010 30266 Eels, fresh or chilled, whole 1 284 272 131 141
Spain import 2011 30266 Eels, fresh or chilled, whole 1 976 931 166 432
Spain import 2012 30266 Eels, fresh or chilled, whole 824 382 54 328

30
2.9.2. Export and Re-export Table 25. Export China (30266 – UNdata)
Source: UNdata, United Nations Statistic Division, Commodity Trade Statistics Database. Table 26. Export Hong Kong (30266 – UNdata)
Source: UNdata, United Nations Statistic Division, Commodity Trade Statistics Database.
Country or Area Year Comm. Code Commodity Trade (USD) Weight (kg)
China export 2001 30266 Eels, fresh or chilled, whole 1 932 951 542 848
China export 2002 30266 Eels, fresh or chilled, whole 52 624 16 489
China export 2003 30266 Eels, fresh or chilled, whole 38 860 8 295
China export 2004 30266 Eels, fresh or chilled, whole NA NA
China export 2005 30266 Eels, fresh or chilled, whole 418 280 69 835
China export 2006 30266 Eels, fresh or chilled, whole 537 191 129 938
China export 2007 30266 Eels, fresh or chilled, whole 17 464 6 035
China export 2008 30266 Eels, fresh or chilled, whole 1 878 283
China export 2009 30266 Eels, fresh or chilled, whole 4 833 262
China export 2010 30266 Eels, fresh or chilled, whole 114 420 20 520
China export 2011 30266 Eels, fresh or chilled, whole 176 267 27 312
China export 2012 30266 Eels, fresh or chilled, whole 4 366 560 564 175
Country or Area Year Comm. Code Commodity Trade (USD) Weight (kg)
China, Hong Kong SAR export 2001 30266 Eels, fresh or chilled, whole 3 889 535
China, Hong Kong SAR export 2003 30266 Eels, fresh or chilled, whole NA NA
China, Hong Kong SAR export 2003 30266 Eels, fresh or chilled, whole 38 109 6 125
China, Hong Kong SAR export 2004 30266 Eels, fresh or chilled, whole 14 018 2 000
China, Hong Kong SAR export 2005 30266 Eels, fresh or chilled, whole 20 443 3 180
China, Hong Kong SAR export 2006 30266 Eels, fresh or chilled, whole 48 774 11 284
China, Hong Kong SAR export 2007 30266 Eels, fresh or chilled, whole 63 008 7 478
China, Hong Kong SAR export 2008 30266 Eels, fresh or chilled, whole 133 269 11 078
China, Hong Kong SAR export 2009 30266 Eels, fresh or chilled, whole 17 802 6 062
China, Hong Kong SAR export 2010 30266 Eels, fresh or chilled, whole NA NA
China, Hong Kong SAR export 2011 30266 Eels, fresh or chilled, whole 3 854 1 902
China, Hong Kong SAR export 2012 30266 Eels, fresh or chilled, whole 32 964 4 398

31
Table 27. Re-export Hong Kong (30266 – UNdata)
Source: UNdata, United Nations Statistic Division, Commodity Trade Statistics Database. Table 28. Export Japan (30266 – UNdata)
Source: UNdata, United Nations Statistic Division, Commodity Trade Statistics Database.
Country or Area Year Comm.Code Commodity Trade (USD) Weight (kg)
China, Hong Kong SAR re-export 2001 30266 Eels fresh or chilled, whole 1 619 250
China, Hong Kong SAR re-export 2002 30266 Eels fresh or chilled, whole NA NA
China, Hong Kong SAR re-export 2003 30266 Eels fresh or chilled, whole 38 109 6 125
China, Hong Kong SAR re-export 2004 30266 Eels fresh or chilled, whole 14 018 2 000
China, Hong Kong SAR re-export 2005 30266 Eels fresh or chilled, whole 20 443 318
China, Hong Kong SAR re-export 2006 30266 Eels fresh or chilled, whole 48 774 11 284
China, Hong Kong SAR re-export 2007 30266 Eels fresh or chilled, whole 63 008 7 478
China, Hong Kong SAR re-export 2008 30266 Eels fresh or chilled, whole 133 269 11 078
China, Hong Kong SAR re-export 2009 30266 Eels fresh or chilled, whole 17 802 6 062
China, Hong Kong SAR re-export 2010 30266 Eels fresh or chilled, whole NA NA
China, Hong Kong SAR re-export 2011 30266 Eels fresh or chilled, whole 3 854 1 902
China, Hong Kong SAR re-export 2012 30266 Eels fresh or chilled, whole 32 964 4 398
Country or Area Year Comm. Code Commodity Trade (USD) Weight (kg)
Japan export 2001 30266 Eels, fresh or chilled, whole 14 172 1 159
Japan export 2002 30266 Eels, fresh or chilled, whole 4 454 300
Japan export 2003 30266 Eels, fresh or chilled, whole 5 640 288
Japan export 2004 30266 Eels, fresh or chilled, whole 5 012 61
Japan export 2005 30266 Eels, fresh or chilled, whole NA NA
Japan export 2006 30266 Eels, fresh or chilled, whole NA NA
Japan export 2007 30266 Eels, fresh or chilled, whole NA NA
Japan export 2008 30266 Eels, fresh or chilled, whole 6 202 120
Japan export 2009 30266 Eels, fresh or chilled, whole NA NA
Japan export 2010 30266 Eels, fresh or chilled, whole 8 120 264
Japan export 2011 30266 Eels, fresh or chilled, whole 7 008 155
Japan export 2012 30266 Eels, fresh or chilled, whole 24 605 366

32
Table 29. Export Korea (30266 – UNdata)
Source: UNdata, United Nations Statistic Division, Commodity Trade Statistics Database. Table 30. Export EU-27 (30266 – UNdata)
Source: UNdata, United Nations Statistic Division, Commodity Trade Statistics Database.
Country or Area Year Comm. Code Commodity Trade (USD) Weight (kg)
Rep. of Korea export 2001 30266 Eels, fresh or chilled, whole 1 617 291
Rep. of Korea export 2002 30266 Eels, fresh or chilled, whole 2 352 598
Rep. of Korea export 2003 30266 Eels, fresh or chilled, whole 5 472 975
Rep. of Korea export 2004 30266 Eels, fresh or chilled, whole NA NA
Rep. of Korea export 2005 30266 Eels, fresh or chilled, whole 16 136 1 580
Rep. of Korea export 2006 30266 Eels, fresh or chilled, whole 6 223 1 062
Rep. of Korea export 2007 30266 Eels, fresh or chilled, whole NA NA
Rep. of Korea export 2008 30266 Eels, fresh or chilled, whole 9 094 302
Rep. of Korea export 2009 30266 Eels, fresh or chilled, whole 3 258 174
Rep. of Korea export 2010 30266 Eels, fresh or chilled, whole 939 136
Rep. of Korea export 2011 30266 Eels, fresh or chilled, whole NA NA
Rep. of Korea export 2012 30266 Eels, fresh or chilled, whole 2 068 148
Country or Area Year Comm. Code Commodity Trade (USD) Weight (kg)
EU-27 export 2001 30266 Eels, fresh or chilled, whole 2 647 940 23 911
EU-27 export 2002 30266 Eels, fresh or chilled, whole 1 376 254 7 403
EU-27 export 2003 30266 Eels, fresh or chilled, whole 1 577 937 212 550
EU-27 export 2004 30266 Eels, fresh or chilled, whole 6 658 928 628 384
EU-27 export 2005 30266 Eels, fresh or chilled, whole 11 127 1 152
EU-27 export 2006 30266 Eels, fresh or chilled, whole 6 687 340
EU-27 export 2007 30266 Eels, fresh or chilled, whole 41 192 1 995
EU-27 export 2008 30266 Eels, fresh or chilled, whole 8 608 384
EU-27 export 2009 30266 Eels, fresh or chilled, whole 3 197 145
EU-27 export 2010 30266 Eels, fresh or chilled, whole 2 476 NA
EU-27 export 2011 30266 Eels, fresh or chilled, whole 308 674 10 781
EU-27 export 2012 30266 Eels, fresh or chilled, whole 1 535 964 45 530

33
Table 31. Export Italy (30266 – UNdata)
Source: UNdata, United Nations Statistic Division, Commodity Trade Statistics Database. Table 32. Export Denmark (30266 – UNdata)
Source: UNdata, United Nations Statistic Division, Commodity Trade Statistics Database.
Country or Area Year Comm. Code Commodity Trade (USD) Weight (kg)
Italy export 2001 30266 Eels, fresh or chilled, whole 58 825 6 647
Italy export 2002 30266 Eels, fresh or chilled, whole 40 851 4 124
Italy export 2003 30266 Eels, fresh or chilled, whole 11 831 1 588
Italy export 2004 30266 Eels, fresh or chilled, whole 5 903 409
Italy export 2005 30266 Eels, fresh or chilled, whole 26 892 1 983
Italy export 2006 30266 Eels, fresh or chilled, whole 8 614 517
Italy export 2007 30266 Eels, fresh or chilled, whole 90 494 7 029
Italy export 2008 30266 Eels, fresh or chilled, whole 17 428 1 038
Italy export 2009 30266 Eels, fresh or chilled, whole 5 823 492
Italy export 2010 30266 Eels, fresh or chilled, whole 6 513 431
Italy export 2011 30266 Eels, fresh or chilled, whole 18 123 854
Italy export 2012 30266 Eels, fresh or chilled, whole 37 233 1 888
Country or Area Year Comm. Code Commodity Trade (USD) Weight (kg)
Denmark export 2001 30266 Eels, fresh or chilled, whole 2 591 627 287 17
Denmark export 2002 30266 Eels, fresh or chilled, whole 2 911 873 338 65
Denmark export 2003 30266 Eels, fresh or chilled, whole 3 811 342 366 37
Denmark export 2004 30266 Eels, fresh or chilled, whole 3 921 799 298 46
Denmark export 2005 30266 Eels, fresh or chilled, whole 3 409 593 221 655
Denmark export 2006 30266 Eels, fresh or chilled, whole 3 438 168 213 930
Denmark export 2007 30266 Eels, fresh or chilled, whole 3 917 083 225 339
Denmark export 2008 30266 Eels, fresh or chilled, whole 5 663 736 389 147
Denmark export 2009 30266 Eels, fresh or chilled, whole 4 268 912 316 923
Denmark export 2010 30266 Eels, fresh or chilled, whole 4 706 635 374 964
Denmark export 2011 30266 Eels, fresh or chilled, whole 3 149 939 158 707
Denmark export 2012 30266 Eels, fresh or chilled, whole 4 581 991 221 155

34
Table 33. Export Spain (30266 – UNdata)
Source: UNdata, United Nations Statistic Division, Commodity Trade Statistics Database.
2.10. COMMODITY CODE 30376 (EELS: FROZEN, WHOLE) Definition of frozen fish, in accordance with FAO Code of practice for Fish and Fisheries Products: products subject to a freezing process sufficient to reduce the temperature of the whole product to a level low enough to preserve the inherent quality of the fish. The facility should be capable of maintaining the temperature of the fish below -18 °C. Frozen products are usually kept at a temperature of -10 °C (-18 °C seafood). This long-term preservation process maintains the sanitary and organoleptic characteristics of the foodstuff unchanged and delays the oxidation of fats. Bacteria cannot proliferate at such a low temperature and at a low aw value (at -10 °C the percentage of residue water is 18 percent, while at -18 °C, it is equal to 14 percent with an AW value of 0.84 – bacteria growth is inhibited to a great extent at aw values of less than 0.90). An increase in the preservation time results in an increase in bacteria destruction. The sensitivity of microorganisms to the freezing process therefore depends on various factors: the bacteria strain, the temperature at which the product is frozen, the efficiency and speed of the freezing process, chemical factors of the foodstuff and the health and wholesomeness of the fish stock. STATISTICAL DATA ANALISYS A frozen product, for which the cold chain is continuous and in accordance with the FAO Code of Practice for Fish and Fishery Products, can also be sold far from the place the fish is caught. In fact the product is preserved for relatively long periods of time. UN Data available was gathered from 2001 to 2012,
Country or Area Year Comm. Code Commodity Trade (USD) Weight (kg)
Spain export 2001 30266 Eels, fresh or chilled, whole 1 829 530 74 942
Spain export 2002 30266 Eels, fresh or chilled, whole 1 563 332 119 695
Spain export 2003 30266 Eels, fresh or chilled, whole 2 277 166 113 339
Spain export 2004 30266 Eels, fresh or chilled, whole 1 819 743 160 976
Spain export 2005 30266 Eels, fresh or chilled, whole 1 608 640 272 279
Spain export 2006 30266 Eels, fresh or chilled, whole 1 147 465 98 397
Spain export 2007 30266 Eels, fresh or chilled, whole 2 226 982 40 848
Spain export 2008 30266 Eels, fresh or chilled, whole 855 735 46 719
Spain export 2009 30266 Eels, fresh or chilled, whole 1 056 194 44 618
Spain export 2010 30266 Eels, fresh or chilled, whole 630 620 6 700
Spain export 2011 30266 Eels, fresh or chilled, whole 1 039 249 103 960
Spain export 2012 30266 Eels, fresh or chilled, whole 2 664 486 216 216

35
Imports. Imports amounted to USD 10.3 million in 2010, making China the leading importer of frozen product for the home market in Asia. Following a trend of constant growth from 2004 to 2008, in 2010 there was a drop of approximately USD 3.5 million from the previous year (USD 6.19 million). It is to be noted that between 2009 and 2012, following the introduction of European Eel into CITES Appendix, China’s imports showed a remarkable decline due to the difficulty in obtaining frozen stock availability. Hong Kong imported a considerable volume, amounting to USD 6 million in 2009 and USD 5 million in 2010. These figures are approximately 50 percent lower than those relative to China. Note that Hong Kong appears to have started importing in 2008 as, in previous years, very little product had been imported. Imports in Japan and Korea are negligible. The value of imports by the EU (EU-27) shows approximately USD 16.25 million in 2009 and USD 11.20 million in 2010, figures similar to China’s. However, EU import quantities are notably lower than those of the Asian country. Frozen eel imports are irrelevant in Spain and Italy, although Denmark can boast figures similar to those of Hong Kong with a volume of around USD 4.50 million in 2009. EU shows an import trend similar to China, with a noticeable decrease in the years 2011 and 2012, which underlines the effects of the enforcement of international legislation. Exports. China registered the highest trend values (Table 47) respectively with USD 13.20 million in 2009, 13.80 million in 2010, and reaching the highest figure of USD 26.584 in 2011. Data available about 2012 seems to be unreliable, since they show a drop of over 23.00. The trend in other Asian countries is not only negative, but also irrelevant for statistical purposes both in terms of value and quantity traded. In the European Union, only Denmark with exports amounting to USD 5.54 million in 2009 and USD 4.00 million in 2010, registered a significant result for outgoing products. Denmark, as a major stakeholder, shows considerable stability, maintaining the same level of exports over the last four years (Table 54). In the other European Union countries, the frozen product is consumed almost entirely on the home market. These figures are confirmed also by the EU-27 report with export volumes of little economic significance. Un Data are available up to 2012, although it must be noted that data of last year is not consolidated. FAO FishStat Plus data on the 3-year period 2007-2009 Commodity Code 30376: Table 34. 030376 Eels (Anguilla spp. frozen) - International export of Fishery Commodities by FAO
Year 2009 2010 2011 Quantity (tonnes) 10 940 10 880 13 061 Value (‘000 USD) 39 923 38 267 64 707
Source: FAO FISHSTAT Plus (2014).

36
Data from United Nations Commodity Trade Statistics Database (UN ComTrade) was obtained from the major global importers with the value of imports and exports for the four years: 2008 to 2011: Table 35. Importer countries (030376 – COMTRADE)
Country Value (USD) China 31 381 000 USA 31 155 000 Poland 30 387 000 Germany 26 905 000 China, Hong Kong SAR 21 256 000 Other Reporters 82 495 000 Total 223 581 000
Source: United Nations Commodity Trade Statistic Database (COMTRADE). Table 36. Exporter countries (030376 – COMTRADE)
Country Value (USD) China 65 108 000 Canada 16 088 000 Denmark 15 160 000 USA 14 044 000 India 11 234 000 Other Reporters 55 631 000 Total 177 267 000
Source: United Nations Commodity Trade Statistic Database (COMTRADE). Table 37. Import years (030376 – COMTRADE)
Year Value (USD) 2011 42 775 000 2010 49 057 000 2009 58 521 000 2008 73 226 000
Source: United Nations Commodity Trade Statistic Database (COMTRADE). Table 38. Export years (030376 – COMTRADE)
Country Value (USD) 2011 65 654 000 2010 37 513 000 2009 38 350 000 2008 39 726 000
Source: United Nations Commodity Trade Statistic Database (COMTRADE).

37
2.10.1. Import Table 39. Import China (030376 – UNdata)
Source: UNdata, United Nations Statistic Division, Commodity Trade Statistics Database. Table 40. Import Hong Kong (030376 – UNdata)
Source: UNdata, United Nations Statistic Division, Commodity Trade Statistics Database.
Country or Area Year Comm. Code Commodity Trade (USD) Weight (kg)
China import 2001 30376 Eels, frozen, whole 2 371 258 1 850 834
China import 2002 30376 Eels, frozen, whole 1 169 648 1 254 302
China import 2003 30376 Eels, frozen, whole 878 637 664 462
China import 2004 30376 Eels, frozen, whole 1 066 111 1 376 795
China import 2005 30376 Eels, frozen, whole 4 129 342 488 523
China import 2006 30376 Eels, frozen, whole 5 394 041 638 144
China import 2007 30376 Eels, frozen, whole 8 593 887 10 619 173
China import 2008 30376 Eels, frozen, whole 8 706 019 10 028 078
China import 2009 30376 Eels, frozen, whole 10 350 219 9 118 879
China import 2010 30376 Eels, frozen, whole 6 912 528 5 430 168
China import 2011 30376 Eels, frozen, whole 5 412 317 3 497 541
China import 2012 30376 Eels, frozen, whole 6 352 818 2 905 916
Country or Area Year Comm. Code Commodity Trade (USD) Weight (kg)
China, Hong Kong SAR import 2001 30376 Eels, frozen, whole 1 309 726 215 284
China, Hong Kong SAR import 2002 30376 Eels, frozen, whole 757 780 221 624
China, Hong Kong SAR import 2003 30376 Eels, frozen, whole 1 654 781 462 663
China, Hong Kong SAR import 2004 30376 Eels, frozen, whole 846 891 352 892
China, Hong Kong SAR import 2005 30376 Eels, frozen, whole 1 301 025 337 931
China, Hong Kong SAR import 2006 30376 Eels, frozen, whole 502 712 149 252
China, Hong Kong SAR import 2007 30376 Eels, frozen, whole 917 944 204 724
China, Hong Kong SAR import 2008 30376 Eels, frozen, whole 2 610 782 537 315
China, Hong Kong SAR import 2009 30376 Eels, frozen, whole 5 979 391 540 046
China, Hong Kong SAR import 2010 30376 Eels, frozen, whole 5 020 455 596 337
China, Hong Kong SAR import 2011 30376 Eels, frozen, whole 7 646 325 1 198 686
China, Hong Kong SAR import 2012 30376 Eels, frozen, whole 2 040 439 420 476

38
Table 41. Import Japan (030376 – UNdata)
Source: UNdata, United Nations Statistic Division, Commodity Trade Statistics Database. Table 42. Import Korea (030376 – UNdata)
Source: UNdata, United Nations Statistic Division, Commodity Trade Statistics Database.
Country or Area Year Comm. Code Commodity Trade (USD) Weight (kg)
Japan import 2001 30376 Eels, frozen, whole 17 771 117
Japan import 2002 30376 Eels, frozen, whole 48 303 2 233
Japan import 2003 30376 Eels, frozen, whole 57 575 769
Japan import 2004 30376 Eels, frozen, whole 41 253 2 365
Japan import 2005 30376 Eels, frozen, whole 46 777 199
Japan import 2006 30376 Eels, frozen, whole 40 267 129
Japan import 2007 30376 Eels, frozen, whole 29 429 110
Japan import 2008 30376 Eels, frozen, whole 53 891 99
Japan import 2009 30376 Eels, frozen, whole 7 288 810
Japan import 2010 30376 Eels, frozen, whole NA NA
Japan import 2011 30376 Eels, frozen, whole NA NA
Japan import 2012 30376 Eels, frozen, whole NA NA
Country or Area Year Comm. Code Commodity Trade (USD) Weight (kg)
Rep. of Korea import 2001 30376 Eels, frozen, whole 43 901 15 330
Rep. of Korea import 2002 30376 Eels, frozen, whole 99 65 17 712
Rep. of Korea import 2003 30376 Eels, frozen, whole 61 700 9 000
Rep. of Korea import 2004 30376 Eels, frozen, whole 78 002 8 976
Rep. of Korea import 2005 30376 Eels, frozen, whole 3 885 510
Rep. of Korea import 2006 30376 Eels, frozen, whole 66 399 24 368
Rep. of Korea import 2007 30376 Eels, frozen, whole 2 744 756
Rep. of Korea import 2008 30376 Eels, frozen, whole 20 050 2 951
Rep. of Korea import 2009 30376 Eels, frozen, whole 47 411 5 336
Rep. of Korea import 2010 30376 Eels, frozen, whole 7 717 1 195
Rep. of Korea import 2011 30376 Eels, frozen, whole 212 235 22 498
Rep. of Korea import 2012 30376 Eels, frozen, whole 320 042 26 946

39
Table 43. Import EU-27 (030376 – UNdata)
Source: UNdata, United Nations Statistic Division, Commodity Trade Statistics Database. Table 44. Import Italy (030376 – UNdata)
Source: UNdata, United Nations Statistic Division, Commodity Trade Statistics Database.
Country or Area Year Comm. Code Commodity Trade (USD) Weight (kg)
EU-27 import 2001 30376 Eels, frozen, whole 13 359 259 2 363 200
EU-27 import 2002 30376 Eels, frozen, whole 5 410 558 1 017 921
EU-27 import 2003 30376 Eels, frozen, whole 5 097 757 850 672
EU-27 import 2004 30376 Eels, frozen, whole 10 521 061 1 497 844
EU-27 import 2005 30376 Eels, frozen, whole 17 614 219 2 369 830
EU-27 import 2006 30376 Eels, frozen, whole 11 090 221 1 357 314
EU-27 import 2007 30376 Eels, frozen, whole 35 502 443 3 758 300
EU-27 import 2008 30376 Eels, frozen, whole 27 775 654 2 850 108
EU-27 import 2009 30376 Eels, frozen, whole 16 250 338 2 062 709
EU-27 import 2010 30376 Eels, frozen, whole 11 220 378 1 169 632
EU-27 import 2011 30376 Eels, frozen, whole 5 447 232 500 981
EU-27 import 2012 30376 Eels, frozen, whole 3 681 008 331 343
Country or Area Year Comm. Code Commodity Trade (USD) Weight (kg)
Italy import 2001 30376 Eels, frozen, whole 299 277 72 607
Italy import 2002 30376 Eels, frozen, whole 98 322 28 066
Italy import 2003 30376 Eels, frozen, whole 86 906 19 960
Italy import 2004 30376 Eels, frozen, whole 66 871 12 556
Italy import 2005 30376 Eels, frozen, whole 123 130 20 733
Italy import 2006 30376 Eels, frozen, whole 241 044 39 982
Italy import 2007 30376 Eels, frozen, whole 333 362 47 593
Italy import 2008 30376 Eels, frozen, whole 253 092 26 401
Italy import 2009 30376 Eels, frozen, whole 135 191 24 058
Italy import 2010 30376 Eels, frozen, whole 121 707 25 126
Italy import 2011 30376 Eels, frozen, whole 297 040 51 502
Italy import 2012 30376 Eels, frozen, whole 100 041 4 782

40
Table 45. Import Denmark (030376 – UNdata)
Source: UNdata, United Nations Statistic Division, Commodity Trade Statistics Database. Table 46. Import Spain (030376 – UNdata)
Source: UNdata, United Nations Statistic Division, Commodity Trade Statistics Database.
Country or Area Year Comm. Code Commodity Trade (USD) Weight (kg)
Denmark import 2001 30376 Eels, frozen, whole 4 372 568 681 974
Denmark import 2002 30376 Eels, frozen, whole 2 403 932 352 334
Denmark import 2003 30376 Eels, frozen, whole 2 195 528 260 249
Denmark import 2004 30376 Eels, frozen, whole 641 087 59 315
Denmark import 2005 30376 Eels, frozen, whole 926 370 88 085
Denmark import 2006 30376 Eels, frozen, whole 619 960 54 983
Denmark import 2007 30376 Eels, frozen, whole 4 587 209 408 956
Denmark import 2008 30376 Eels, frozen, whole 1 746 393 165 142
Denmark import 2009 30376 Eels, frozen, whole 4 469 820 564 957
Denmark import 2010 30376 Eels, frozen, whole 1 416 973 157 462
Denmark import 2011 30376 Eels, frozen, whole 379 081 25 724
Denmark import 2012 30376 Eels, frozen, whole 724 862 41 498
Country or Area Year Comm. Code Commodity Trade (USD) Weight (kg)
Spain import 2001 30376 Eels, frozen, whole 264 774 37 002
Spain import 2002 30376 Eels, frozen, whole 322 785 21 275
Spain import 2003 30376 Eels, frozen, whole 409 515 20 425
Spain import 2004 30376 Eels, frozen, whole 567 22 18 673
Spain import 2005 30376 Eels, frozen, whole 964 241 48 727
Spain import 2006 30376 Eels, frozen, whole 780 804 59 974
Spain import 2007 30376 Eels, frozen, whole 1 838 876 36 802
Spain import 2008 30376 Eels, frozen, whole 1 370 103 27 519
Spain import 2009 30376 Eels, frozen, whole 382 026 19 486
Spain import 2010 30376 Eels, frozen, whole 348 115 8 649
Spain import 2011 30376 Eels, frozen, whole 476 371 13 066
Spain import 2012 30376 Eels, frozen, whole 223 429 20 215

41
2.12.2. Export and Re-export Table 47. Export China (030376 – UNdata)
Source: UNdata, United Nations Statistic Division, Commodity Trade Statistics Database. Table 48. Export Hong Kong (030376 – UNdata)
Source: UNdata, United Nations Statistic Division, Commodity Trade Statistics Database.
Country or Area Year Comm. Code Commodity Trade (USD) Weight (kg)
China export 2001 30376 Eels, frozen, whole 5 510 148 1 489 180
China export 2002 30376 Eels, frozen, whole 826 401 251 055
China export 2003 30376 Eels, frozen, whole 1 625 144 366 110
China export 2004 30376 Eels, frozen, whole 6 355 475 977 615
China export 2005 30376 Eels, frozen, whole 9 147 943 1 743 527
China export 2006 30376 Eels, frozen, whole 6 996 616 2 048 378
China export 2007 30376 Eels, frozen, whole 8 843 056 1 474 661
China export 2008 30376 Eels, frozen, whole 11 541 320 1 579 819
China export 2009 30376 Eels, frozen, whole 13 195 364 1 385 649
China export 2010 30376 Eels, frozen, whole 13 787 290 1 271 945
China export 2011 30376 Eels, frozen, whole 26 584 197 1 754 884
China export 2012 30376 Eels, frozen, whole 3 048 049 387 443
Country or Area Year Comm. Code Commodity Trade (USD) Weight (kg)
China, Hong Kong SAR export 2001 30376 Eels, frozen, whole 201 631 109 969
China, Hong Kong SAR export 2002 30376 Eels, frozen, whole 22 143 2 659
China, Hong Kong SAR export 2003 30376 Eels, frozen, whole 365 193 138 802
China, Hong Kong SAR export 2004 30376 Eels, frozen, whole 217 641 95 287
China, Hong Kong SAR export 2005 30376 Eels, frozen, whole 116 947 63 286
China, Hong Kong SAR export 2006 30376 Eels, frozen, whole 17 677 10 252
China, Hong Kong SAR export 2007 30376 Eels, frozen, whole 214 215 39 540
China, Hong Kong SAR export 2008 30376 Eels, frozen, whole 1 742 475 221 820
China, Hong Kong SAR export 2009 30376 Eels, frozen, whole 494 982 136 761
China, Hong Kong SAR export 2010 30376 Eels, frozen, whole 227 384 31 219
China, Hong Kong SAR export 2011 30376 Eels, frozen, whole 1 730 053 622 401
China, Hong Kong SAR export 2012 30376 Eels, frozen, whole 2 040 439 420 476

42
Table 49. Re-export Hong Kong (030376 – UNdata
Source: UNdata, United Nations Statistic Division, Commodity Trade Statistics Database. Table 50. Export Japan (030376 – UNdata)
Source: UNdata, United Nations Statistic Division, Commodity Trade Statistics Database.
Country or Area Year Comm. Code Commodity Trade (USD) Weight (kg)
China, Hong Kong SAR re-export 2001 30376 Eels, frozen, whole 201 631 109 969
China, Hong Kong SAR re-export 2002 30376 Eels, frozen, whole 22 143 2 659
China, Hong Kong SAR re-export 2003 30376 Eels, frozen, whole 365 193 138 802
China, Hong Kong SAR re-export 2004 30376 Eels, frozen, whole 217 641 95 287
China, Hong Kong SAR re-export 2005 30376 Eels, frozen, whole 116 947 63 286
China, Hong Kong SAR re-export 2006 30376 Eels, frozen, whole 17 677 10 252
China, Hong Kong SAR re-export 2007 30376 Eels, frozen, whole 214 215 39 540
China, Hong Kong SAR re-export 2008 30376 Eels, frozen, whole 1 742 475 221 820
China, Hong Kong SAR re-export 2009 30376 Eels, frozen, whole 494 982 136 761
China, Hong Kong SAR re-export 2010 30376 Eels, frozen, whole 227 384 31 219
China, Hong Kong SAR re-export 2011 30376 Eels, frozen, whole 1 730 053 622 401
China, Hong Kong SAR re-export 2012 30376 Eels, frozen, whole 2 040 439 420 476
Country or Area Year Comm. Code Commodity Trade (USD) Weight (kg)
Japan export 2001 30376 Eels, frozen, whole 64 778 7 745
Japan export 2002 30376 Eels, frozen, whole 28 123 2 221
Japan export 2003 30376 Eels, frozen, whole 15 817 986
Japan export 2004 30376 Eels, frozen, whole 81 203 3 658
Japan export 2005 30376 Eels, frozen, whole 23 478 1 065
Japan export 2006 30376 Eels, frozen, whole 6 412 227
Japan export 2007 30376 Eels, frozen, whole 10 451 440
Japan export 2008 30376 Eels, frozen, whole 19 869 2 815
Japan export 2009 30376 Eels, frozen, whole 8 501 365
Japan export 2010 30376 Eels, frozen, whole 20 798 710
Japan export 2011 30376 Eels, frozen, whole 14 342 180
Japan export 2012 30376 Eels, frozen, whole 8 181 150

43
Table 51. Export Korea (030376 – UNdata)
Source: UNdata, United Nations Statistic Division, Commodity Trade Statistics Database. Table 52. Export EU-27 (030376 – UNdata)
Source: UNdata, United Nations Statistic Division, Commodity Trade Statistics Database.
Country or Area Year Comm. Code Commodity Trade (USD) Weight (kg)
Rep. of Korea export 2001 30376 Eels, frozen, whole 1 028 2 100
Rep. of Korea export 2002 30376 Eels, frozen, whole NA NA
Rep. of Korea export 2003 30376 Eels, frozen, whole 65 174 98 498
Rep. of Korea export 2004 30376 Eels, frozen, whole NA NA
Rep. of Korea export 2005 30376 Eels, frozen, whole 124 748 59 937
Rep. of Korea export 2006 30376 Eels, frozen, whole NA NA
Rep. of Korea export 2007 30376 Eels, frozen, whole 56 540 60 835
Rep. of Korea export 2008 30376 Eels, frozen, whole 51 834 46 661
Rep. of Korea export 2009 30376 Eels, frozen, whole 34 488 24 083
Rep. of Korea export 2010 30376 Eels, frozen, whole 613 73
Rep. of Korea export 2011 30376 Eels, frozen, whole 172 855 39 044
Rep. of Korea export 2012 30376 Eels, frozen, whole 75 437 11 142
Country or Area Year Comm. Code Commodity Trade (USD) Weight (kg)
EU-27 export 2001 30376 Eels, frozen, whole 345 023 33 331
EU-27 export 2002 30376 Eels, frozen, whole 540 020 57 459
EU-27 export 2003 30376 Eels, frozen, whole 379 240 35 33
EU-27 export 2004 30376 Eels, frozen, whole 385 105 30 033
EU-27 export 2005 30376 Eels, frozen, whole 492 329 44 348
EU-27 export 2006 30376 Eels, frozen, whole 547 548 91 710
EU-27 export 2007 30376 Eels, frozen, whole 620 868 48 643
EU-27 export 2008 30376 Eels, frozen, whole 138 272 24 140
EU-27 export 2009 30376 Eels, frozen, whole 112 732 19 999
EU-27 export 2010 30376 Eels, frozen, whole 348 416 27 533
EU-27 export 2011 30376 Eels, frozen, whole 1 286 411 93 969
EU-27 export 2012 30376 Eels, frozen, whole 2 050 367 156 985

44
Table 53. Export Italy (030376 – UNdata)
Source: UNdata, United Nations Statistic Division, Commodity Trade Statistics Database. Table 54. Export Denmark (030376 – UNdata)
Source: UNdata, United Nations Statistic Division, Commodity Trade Statistics Database.
Country or Area Year Comm. Code Commodity Trade (USD) Weight (kg)
Italy export 2001 30376 Eels, frozen, whole 242 33
Italy export 2002 30376 Eels, frozen, whole 1 171 384
Italy export 2003 30376 Eels, frozen, whole 4 923 5 623
Italy export 2004 30376 Eels, frozen, whole 3 264 2 581
Italy export 2005 30376 Eels, frozen, whole 698 584
Italy export 2006 30376 Eels, frozen, whole 1 329 1 123
Italy export 2007 30376 Eels, frozen, whole 499 387
Italy export 2008 30376 Eels, frozen, whole 1 013 732
Italy export 2009 30376 Eels, frozen, whole 463 352
Italy export 2010 30376 Eels, frozen, whole 11 846 563
Italy export 2011 30376 Eels, frozen, whole 15 940 1 015
Italy export 2012 30376 Eels, frozen, whole 10 826 696
Country or Area Year Comm. Code Commodity Trade (USD) Weight (kg)
Denmark export 2001 30376 Eels, frozen, whole 3 557 186 466 616
Denmark export 2002 30376 Eels, frozen, whole 3 084 479 417 063
Denmark export 2003 30376 Eels, frozen, whole 2 899 035 316 696
Denmark export 2004 30376 Eels, frozen, whole 1 994 096 160 191
Denmark export 2005 30376 Eels, frozen, whole 2 083 873 153 895
Denmark export 2006 30376 Eels, frozen, whole 2 066 782 187 661
Denmark export 2007 30376 Eels, frozen, whole 2 718 113 188 297
Denmark export 2008 30376 Eels, frozen, whole 1 471 499 111 556
Denmark export 2009 30376 Eels, frozen, whole 5 539 351 651 981
Denmark export 2010 30376 Eels, frozen, whole 4 015 325 423 065
Denmark export 2011 30376 Eels, frozen, whole 3 957 766 296 914
Denmark export 2012 30376 Eels, frozen, whole 4 433 202 262 233

45
Table 55. Export Spain (030376 – UNdata)
Source: UNdata, United Nations Statistic Division, Commodity Trade Statistics Database.
2.11. COMMODITY CODE 30549 (EELS: SMOKED) Smoked fish. The definition of smoked fish, in accordance with FAO Code of Practice for Fish and Fisheries Products (according to the first edition of the FAO Code which is under development): Smoking is not exactly a method of preserving food, but more of a complementary method used with other foodstuffs preservation technologies. It is widely used to add flavor to foodstuffs, and involves leaving the product in smoke produced by burning various types of wood (also aromatized). The smoking process modifies the organoleptic properties of the foodstuff, leaving the surface of the product dry. This type of procedure can have consequences at a toxic-health level, as the combustion produces polycyclic aromatics (IPA or PHA) with a lipophilic action, and therefore potentially oncogenic. The water activity value for smoked products is around 0.95 aw. STATISTICAL DATA ANALISYS Smoking eel improves the quality of the meat and its flavour, and, at the same time, keeps the food healthy. After smoking, eels are often canned for exporting. There is no data on this Commodity Code in the UN Data database, so EUROSTAT 2010 data was used to illustrate imports into and within EU Member States. EU-27 import data was also used from 2001 to 2008. Both in terms of value and quantity, trade tables 61 and 62 are not relevant.
Country or Area Year Comm. Code Commodity Trade (USD) Weight (kg)
Spain export 2001 30376 Eels, frozen, whole 242 197 9 975
Spain export 2002 30376 Eels, frozen, whole 176 131 14 422
Spain export 2003 30376 Eels, frozen, whole 105 770 10 252
Spain export 2004 30376 Eels, frozen, whole 166 931 56 708
Spain export 2005 30376 Eels, frozen, whole 695 772 156 44
Spain export 2006 30376 Eels, frozen, whole 250 274 50 481
Spain export 2007 30376 Eels, frozen, whole 282 963 39 991
Spain export 2008 30376 Eels, frozen, whole 224 501 58 981
Spain export 2009 30376 Eels, frozen, whole 70 467 10 880
Spain export 2010 30376 Eels, frozen, whole 83 908 14 789
Spain export 2011 30376 Eels, frozen, whole 122 908 16 208
Spain export 2012 30376 Eels, frozen, whole 3 247 799

46
Data on smoked eel (cumulative) for the period 2007 – 2009 relevant to Commodity Code 030549 (other Fish, including fillets, smoked) in the FAO FishStat Plus database reported below: Table 56. 030549 Eels (Anguilla spp. Smoked) - International exports of fishery commodities by FAO
Year 2009 2010 2011 Quantity (tonnes) 10 940 10 880 13 061 Value (‘000 USD) 39 923 38 267 64 707
Source: FAO FISHSTAT Plus (2014). Data from United Nations Commodity Trade Statistics Database (UN Comtrade) was obtained from the major Global Importers with the value of imports and exports in the last four years, from 2008 to 2011(other fish, including fillets, smoked, not only Eels): Table 57. Importer countries (030549 – COMTRADE)
Country Value (USD) Germany 410 235 000 Japan 199 047 000 USA 170 065 000 Belgium 82 241 000 Italy 78 255 000 Other Reporters 474 566 000 Total 1 414 413 000
Source: United Nations Commodity Trade Statistic Database (COMTRADE). Table 58. Exporters countries (030549 – COMTRADE)
Country Value (USD) Denmark 289 806 000 Poland 220 854 000 Chile 168 721 000 Turkey 109 095 000 Thailand 76 628 000 Other Reporters 547 950 000 Total 1 413 056 000
Source: United Nations Commodity Trade Statistic Database (COMTRADE). Table 59. Import years (030549 – COMTRADE)
Year Value (USD) 2011 391 431 000 2010 347 744 000 2009 338 733 000 2008 336 503 000
Source: United Nations Commodity Trade Statistic Database (COMTRADE).

47
Table 60. Export years (030549 – COMTRADE)
Year Value (USD) 2011 380 047 000 2010 357 622 000 2009 330 190 000 2008 345 196 000
Source: United Nations Commodity Trade Statistic Database (COMTRADE). Table 61. Smoked eels import from outside EU Member States
Source: EUROSTAT (2010). Table 62. Smoked eels within the EU Member States
Source: EUROSTAT (2010).
2.12. COMMODITY CODE 30192 (EELS: LIVE) In accordance with FAO first edition of Code of practice for Fish and Fisheries Products, the definition of Live Eel has not been finalized yet.
Country or Area Year Comm. Code Commodity Trade ('000 Euro) Weight (kg)
EU-27 imports 2001 30549 Eels, smoked 100 18 800
EU-27 imports 2002 30549 Eels, smoked 100 10 000
EU-27 imports 2003 30549 Eels, smoked NA 2 700
EU-27 imports 2004 30549 Eels, smoked 100 6 100
EU-27 imports 2005 30549 Eels, smoked 100 4 400
EU-27 imports 2006 30549 Eels, smoked NA 9 600
EU-27 imports 2007 30549 Eels, smoked NA 9 400
2008 30549 Eels, smoked 100 20 900
2009 30549 Eels, smoked NA NA
2010 30549 Eels, smoked NA NA
EU-27 imports
Country or Area Year Comm. Code Commodity Trade ('000 Euro) Weight (kg)
EU-27 2001 30549 Eels, smoked 5 600 553 800
EU-27 2002 30549 Eels, smoked 8 200 726 500
EU-27 2003 30549 Eels, smoked 8 000 745 400
EU-27 2004 30549 Eels, smoked 9 700 644 600
EU-27 2005 30549 Eels, smoked 9 600 530 500
EU-27 2006 30549 Eels, smoked 7 500 406 300
EU-27 2007 30549 Eels, smoked 5 600 263 700
2008 30549 Eels, smoked 5 200 324 600
2009 30549 Eels, smoked NA NA
2010 30549 Eels, smoked NA NA
EU-27

48
Live Eel. The live product must be caught and stored to be sent to markets or distribution centres as quickly as possible, without causing excessive stress for the fish. The product must be in a good state of health without skin damage or the evident presence of ectoparasites. Eels are usually sold live, as they can live for a long time out of water. STATISTICAL DATA ANALISYS By definition, live fish, must be sold as close as possible to the place where it is caught (even though Anguilla spp. can survive for a long time out of the water). We can therefore assume to a greater extent that the data refer to the European eel (Anguilla anguilla) for the European market, and the Japanese eel (Anguilla japonica) and subtropical species for the Asian market. The following tables illustrate data relative to macrogeographical areas, including EU-27 data, with the focus on major stakeholders. Imports. As for imports into Asian countries, there was a notable drop for China in 2009, while figures were stable in the previous period from 2003 to 2008. Hong Kong peaked in 2008 before levelling out at positive values. Japan registered the highest imports at USD 431 million for 2011 (the highest ever). European imports were significantly lower both in terms of value and quantities. Apparently most of the trade was between Member States. Italian imports are positive at USD 10.60 million in 2012, making Italy one of the leading countries of the European Union (Table 73). Exports. Chinese exports in 2012 reached USD 156 million, making China the major player in the Asian block – although this figure is much lower than the all-time high of USD 182 million of 2008. Apparently, the major end markets are Japan and Hong Kong, as can be seen from the figures on imports. The data on Japanese exports indicate minimal figures. Data on exports from Hong Kong are interesting, when considered with RE-Export data, they show a considerable outgoing volume for 2010 amounting to around USD 23 million. In Europe, Denmark leads the way with USD 14 million in exports, a figure which is a far cry from the USD 22 million reached in 2005 and the USD 21.5 million in 2008. In the ensuing years, there was a remarkable contraction of exports that went down to USD 13 million. It is to be noted that for this segment, and in particular for the macro-Asian area, it is impossible to establish the percentage of live product that doesn't belong to the Anguilla japonica species. These species presumably belonging to tropical eel species found locally in this fishing area (FAO Fishing Area 61 and adjacent zones), which are considered of little commercial value, such as the New Zealand eel (Anguilla dieffebachii) or long-finned eel (Anguilla reinhardtii). UN Data are only available up to 2012, although it must be noted that data on this last year are not consolidated. FAO FishStat Plus data on the three years 2007–2009 – Commodity Code 30192:

49
Table 63. 030192 Eels (Anguilla spp. Live) - International export of Fishery Commodities by FAO
Source: FAO FISHSTAT Plus (2014). Data from United Nations Commodity Trade Statistics Database (UN Comtrade) was obtained from the major global importers with the value of imports and exports in from 2008 to 2011: Table 64. Importer countries (030192 – COMTRADE)
Source: United Nations Commodity Trade Statistic Database (COMTRADE). Table 65. Exporters countries (030192 – COMTRADE)
Source: United Nations Commodity Trade Statistic Database (COMTRADE). Table 66. Import years (030192 – COMTRADE)
Source: United Nations Commodity Trade Statistic Database (COMTRADE).
Year 2009 2010 2011
Quantity (tonnes) 33 243 36 932 28 548
Value (‘000 USD) 307 679 417 111 461 702
Country Value (USD)
Japan 1 367 852 000
Rep. of Korea 257 619 000
China, Hong Kong SAR 95 383 000
Netherland 70 251 000
Germany 54 177 000
Other Reporters 177 358 000
Total 2 022 644 000
Country Value (USD)
China 593 784 000
Other Asian countries 344 811 000
France 104 174 000
Denmark 67 441 000
Netherlands 53 993 000
Other Reporters 299 113 000
Total 1 463 319 000
Year Value (USD)
2011 594 220 000
2010 572 637 000
2009 301 177 000
2008 554 609 000

50
Table 67. Export years (030192 – COMTRADE)
Source: United Nations Commodity Trade Statistic Database (COMTRADE) 2.12.1. Import Table 68. Import China (030192 – UNdata)
Source: UNdata, United Nations Statistic Division, Commodity Trade Statistics Database.
Country Value (USD)
2011 419 559 000
2010 403 391 000
2009 292 011 000
2008 348 356 000
Country or Area Year Comm. Code Commodity Trade (USD) Weight (kg)
China import 2001 30192 Eels, live 5 478 214 73 931
China import 2002 30192 Eels, live 10 506 517 112 557
China import 2003 30192 Eels, live 5 373 071 64 191
China import 2004 30192 Eels, live 5 062 546 155 294
China import 2005 30192 Eels, live 7 314 737 226 275
China import 2006 30192 Eels, live 6 369 152 249 799
China import 2007 30192 Eels, live 7 529 198 252 139
China import 2008 30192 Eels, live 6 563 631 229 052
China import 2009 30192 Eels, live 2 319 766 218 834
China import 2010 30192 Eels, live 4 190 971 256 220
China import 2011 30192 Eels, live 2 382 318 245 578
China import 2012 30192 Eels, live 1 983 610 88 355

51
Table 69. Import Hong Kong (030192 – UNdata)
Source: UNdata, United Nations Statistic Division, Commodity Trade Statistics Database. Table 70. Import Japan (030192 – UNdata)
Source: UNdata, United Nations Statistic Division, Commodity Trade Statistics Database.
Country or Area Year Comm. Code Commodity Trade (USD) Weight (kg)
China, Hong Kong SAR import 2001 30192 Eels, live 20 779 699
China, Hong Kong SAR import 2002 30192 Eels, live 16 937 289 1 930 655
China, Hong Kong SAR import 2003 30192 Eels, live 15 027 468 2 099 893
China, Hong Kong SAR import 2004 30192 Eels, live 16 974 867 1 604 971
China, Hong Kong SAR import 2005 30192 Eels, live 15 570 363 1 726 871
China, Hong Kong SAR import 2006 30192 Eels, live 10 938 067 1 691 399
China, Hong Kong SAR import 2007 30192 Eels, live 18 358 753 3 376 521
China, Hong Kong SAR import 2008 30192 Eels, live 27 756 834 4 161 834
China, Hong Kong SAR import 2009 30192 Eels, live 19 582 078 3 166 712
China, Hong Kong SAR import 2010 30192 Eels, live 21 573 544 3 025 453
China, Hong Kong SAR import 2011 30192 Eels, live 26 471 214 1 269 382
China, Hong Kong SAR import 2012 30192 Eels, live 42 582 529 2 779 093
Country or Area Year Comm. Code Commodity Trade (USD) Weight (kg)
Japan import 2001 30192 Eels, live 113 695 481 17 375 779
Japan import 2002 30192 Eels, live 159 323 358 20 886 468
Japan import 2003 30192 Eels, live 207 982 365 24 053 350
Japan import 2004 30192 Eels, live 295 405 205 26 604 701
Japan import 2005 30192 Eels, live 357 856 392 23 560 334
Japan import 2006 30192 Eels, live 265 846 280 20 241 018
Japan import 2007 30192 Eels, live 250 890 775 21 302 445
Japan import 2008 30192 Eels, live 336 370 709 15 898 951
Japan import 2009 30192 Eels, live 190 859 662 12 087 496
Japan import 2010 30192 Eels, live 409 623 590 14 855 344
Japan import 2011 30192 Eels, live 430 998 288 9 667 756
Japan import 2012 30192 Eels, live 387 448 521 4 685 775

52
Table 71. Import Korea (030192 – UNdata)
Source: UNdata, United Nations Statistic Division, Commodity Trade Statistics Database. Table 72. Import EU-27 (030192 – UNdata)
Source: UNdata, United Nations Statistic Division, Commodity Trade Statistics Database.
Country or Area Year Comm. Code Commodity Trade (USD) Weight (kg)
Rep. of Korea import 2001 30192 Eels, live 33 612 164 5 496 779
Rep. of Korea import 2002 30192 Eels, live 37 808 354 5 112 650
Rep. of Korea import 2003 30192 Eels, live 30 997 337 3 886 579
Rep. of Korea import 2004 30192 Eels, live 46 096 996 4 737 959
Rep. of Korea import 2005 30192 Eels, live 39 309 785 1 526 693
Rep. of Korea import 2006 30192 Eels, live 31 056 388 2 052 584
Rep. of Korea import 2007 30192 Eels, live 24 552 025 434 024
Rep. of Korea import 2008 30192 Eels, live 77 540 336 2 647 617
Rep. of Korea import 2009 30192 Eels, live 15 424 303 155 718
Rep. of Korea import 2010 30192 Eels, live 77 527 004 3 036 232
Rep. of Korea import 2011 30192 Eels, live 87 128 332 490 694
Rep. of Korea import 2012 30192 Eels, live 84 419 323 146 592
Country or Area Year Comm. Code Commodity Trade (USD) Weight (kg)
EU-27 import 2001 30192 Eels, live 6 416 947 1 010 746
EU-27 import 2002 30192 Eels, live 5 449 116 934 800
EU-27 import 2003 30192 Eels, live 6 274 302 970 306
EU-27 import 2004 30192 Eels, live 7 868 283 951 430
EU-27 import 2005 30192 Eels, live 7 895 583 824 924
EU-27 import 2006 30192 Eels, live 7 689 255 839 038
EU-27 import 2007 30192 Eels, live 7 640 265 780 996
EU-27 import 2008 30192 Eels, live 8 120 500 800 237
EU-27 import 2009 30192 Eels, live 5 653 117 580 172
EU-27 import 2010 30192 Eels, live 4 871 822 489 634
EU-27 import 2011 30192 Eels, live 5 492 532 428 027
EU-27 import 2012 30192 Eels, live 3 944 167 285 005

53
Table 73. Import Italy (030192 – UNdata)
Source: UNdata, United Nations Statistic Division, Commodity Trade Statistics Database. Table 74. Import Denmark (030192 – UNdata)
Source: UNdata, United Nations Statistic Division, Commodity Trade Statistics Database.
Country or Area Year Comm. Code Commodity Trade (USD) Weight (kg)
Italy import 2001 30192 Eels, live 5 846 718 892 456
Italy import 2002 30192 Eels, live 5 008 696 740 745
Italy import 2003 30192 Eels, live 7 394 828 890 234
Italy import 2004 30192 Eels, live 8 150 042 718 547
Italy import 2005 30192 Eels, live 9 058 545 732 14
Italy import 2006 30192 Eels, live 9 381 774 767 075
Italy import 2007 30192 Eels, live 8 911 916 747 160
Italy import 2008 30192 Eels, live 8 168 492 711 431
Italy import 2009 30192 Eels, live 6 769 194 640 911
Italy import 2010 30192 Eels, live 9 599 890 1 159 116
Italy import 2011 30192 Eels, live 10 374 619 942 979
Italy import 2012 30192 Eels, live 10 611 531 731 616
Country or Area Year Comm. Code Commodity Trade (USD) Weight (kg)
Denmark import 2002 30192 Eels, live 7 768 254 1 250 497
Denmark import 2003 30192 Eels, live 10 316 424 1 050 382
Denmark import 2004 30192 Eels, live 14 053 384 1 189 495
Denmark import 2005 30192 Eels, live 15 750 421 1 135 219
Denmark import 2006 30192 Eels, live 11 753 059 919 826
Denmark import 2007 30192 Eels, live 9 197 057 605 161
Denmark import 2008 30192 Eels, live 7 068 417 635 686
Denmark import 2009 30192 Eels, live 5 358 446 358 741
Denmark import 2010 30192 Eels, live 4 458 595 294 696
Denmark import 2011 30192 Eels, live 6 460 693 299 933
Denmark import 2012 30192 Eels, live 5 853 625 212 427

54
Table 75. Import Spain (030192 – UNdata)
Source: UNdata, United Nations Statistic Division, Commodity Trade Statistics Database. 2.12.2. Export and Re-Export Table 76. Export China (030192 – UNdata)
Source: UNdata, United Nations Statistic Division, Commodity Trade Statistics Database.
Country or Area Year Comm. Code Commodity Trade (USD) Weight (kg)
Spain import 2001 30192 Eels, live 6 697 418 114 832
Spain import 2002 30192 Eels, live 5 552 872 183 841
Spain import 2003 30192 Eels, live 6 164 702 173 816
Spain import 2004 30192 Eels, live 7 841 747 158 360
Spain import 2005 30192 Eels, live 8 457 527 104 424
Spain import 2006 30192 Eels, live 5 348 310 103 165
Spain import 2007 30192 Eels, live 6 088 121 103 791
Spain import 2008 30192 Eels, live 11 408 069 160 217
Spain import 2009 30192 Eels, live 4 704 789 125 592
Spain import 2010 30192 Eels, live 4 136 462 47 526
Spain import 2011 30192 Eels, live 4 557 135 54 667
Spain import 2012 30192 Eels, live 2 999 383 44 219
Country or Area Year Comm. Code Commodity Trade (USD) Weight (kg)
China export 2001 30192 Eels, live 34 286 001 6 446 705
China export 2002 30192 Eels, live 28 342 846 5 337 453
China export 2003 30192 Eels, live 58 631 440 9 733 890
China export 2004 30192 Eels, live 124 675 986 14 972 520
China export 2005 30192 Eels, live 164 288 363 14 237 083
China export 2006 30192 Eels, live 146 956 078 14 201 653
China export 2007 30192 Eels, live 93 410 260 10 448 745
China export 2008 30192 Eels, live 182 603 835 14 370 228
China export 2009 30192 Eels, live 120 490 859 10 592 782
China export 2010 30192 Eels, live 132 184 422 8 674 383
China export 2011 30192 Eels, live 158 505 705 5 638 345
China export 2012 30192 Eels, live 155 815 888 3 845 555

55
Table 77. Export Hong Kong (030192 – UNdata)
Source: UNdata, United Nations Statistic Division, Commodity Trade Statistics Database. Table 78. Re-export Hong Kong (030192 – UNdata)
Source: UNdata, United Nations Statistic Division, Commodity Trade Statistics Database.
Country or Area Year Comm. Code Commodity Trade (USD) Weight (kg)
China, Hong Kong SAR export 2001 30192 Eels, live 17 128 078 3 017 712
China, Hong Kong SAR export 2002 30192 Eels, live 12 831 805 753 644
China, Hong Kong SAR export 2003 30192 Eels, live 11 392 452 420 216
China, Hong Kong SAR export 2004 30192 Eels, live 3 726 016 443 111
China, Hong Kong SAR export 2005 30192 Eels, live 4 034 211 190 841
China, Hong Kong SAR export 2006 30192 Eels, live 4 116 549 157 827
China, Hong Kong SAR export 2007 30192 Eels, live 3 712 794 152 903
China, Hong Kong SAR export 2008 30192 Eels, live 10 547 829 240 943
China, Hong Kong SAR export 2009 30192 Eels, live 7 778 106 240 831
China, Hong Kong SAR export 2010 30192 Eels, live 11 861 612 420 361
China, Hong Kong SAR export 2011 30192 Eels, live 15 115 472 430 069
China, Hong Kong SAR export 2012 30192 Eels, live 13 994 714 280 665
Country or Area Year Comm. Code Commodity Trade (USD) Weight (kg)
China, Hong Kong SAR re-export 2001 30192 Eels, live 17 128 078 3 017 712
China, Hong Kong SAR re-export 2002 30192 Eels, live 12 831 805 753 644
China, Hong Kong SAR re-export 2003 30192 Eels, live 11 392 452 420 216
China, Hong Kong SAR re-export 2004 30192 Eels, live 3 726 016 443 111
China, Hong Kong SAR re-export 2005 30192 Eels, live 4 034 211 190 841
China, Hong Kong SAR re-export 2006 30192 Eels, live 4 116 549 157 827
China, Hong Kong SAR re-export 2007 30192 Eels, live 3 712 794 152 903
China, Hong Kong SAR re-export 2008 30192 Eels, live 10 547 829 240 943
China, Hong Kong SAR re-export 2009 30192 Eels, live 7 252 934 239 449
China, Hong Kong SAR re-export 2010 30192 Eels, live 11 588 095 419 525
China, Hong Kong SAR re-export 2011 30192 Eels, live 15 115 472 430 069
China, Hong Kong SAR re-export 2012 30192 Eels, live 13 994 714 280 665

56
Table 79. Export Japan (030192 – UNdata)
Source: UNdata, United Nations Statistic Division, Commodity Trade Statistics Database. Table 80. Export Korea (030192 – UNdata)
Source: UNdata, United Nations Statistic Division, Commodity Trade Statistics Database.
Country or Area Year Comm. Code Commodity Trade (USD) Weight (kg)
Japan export 2001 30192 Eels, live 64 629 3 074
Japan export 2002 30192 Eels, live 230 137 6 534
Japan export 2003 30192 Eels, live 6 606 525 74 656
Japan export 2004 30192 Eels, live 6 696 969 54 769
Japan export 2005 30192 Eels, live 15 485 614 2 259 354
Japan export 2006 30192 Eels, live 12 723 512 94 868
Japan export 2007 30192 Eels, live 8 868 363 58 900
Japan export 2008 30192 Eels, live 4 862 520 33 996
Japan export 2009 30192 Eels, live 7 778 766 71 214
Japan export 2010 30192 Eels, live 4 123 646 27 722
Japan export 2011 30192 Eels, live 5 030 231 36 475
Japan export 2012 30192 Eels, live 5 278 856 10 385
Country or Area Year Comm. Code Commodity Trade (USD) Weight (kg)
Rep. of Korea export 2001 30192 Eels, live 1 822 385 273 459
Rep. of Korea export 2002 30192 Eels, live 1 309 272 2 654
Rep. of Korea export 2003 30192 Eels, live 6 407 163 879 066
Rep. of Korea export 2004 30192 Eels, live 10 427 093 22 265
Rep. of Korea export 2005 30192 Eels, live 123 807 3 207
Rep. of Korea export 2006 30192 Eels, live 1 437 079 5 767
Rep. of Korea export 2007 30192 Eels, live 8 709 1 068
Rep. of Korea export 2008 30192 Eels, live 245 858 480
Rep. of Korea export 2009 30192 Eels, live 590 203 4 750
Rep. of Korea export 2010 30192 Eels, live 100 879 483
Rep. of Korea export 2011 30192 Eels, live 1 043 388 28 566
Rep. of Korea export 2012 30192 Eels, live 4 746 521 79 866

57
Table 81. Export EU-27 (030192 – UNdata)
Source: UNdata, United Nations Statistic Division, Commodity Trade Statistics Database. Table 82. Export Italy (030192 – UNdata)
Source: UNdata, United Nations Statistic Division, Commodity Trade Statistics Database.
Country or Area Year Comm. Code Commodity Trade (USD) Weight (kg)
EU-27 export 2001 30192 Eels, live 14 572 164 2 186 619
EU-27 export 2002 30192 Eels, live 19 437 294 116 107
EU-27 export 2003 30192 Eels, live 21 403 383 96 102
EU-27 export 2004 30192 Eels, live 31 060 904 64 304
EU-27 export 2005 30192 Eels, live 68 000 151 77 002
EU-27 export 2006 30192 Eels, live 18 738 399 37 844
EU-27 export 2007 30192 Eels, live 42 383 297 71 003
EU-27 export 2008 30192 Eels, live 38 814 763 59 701
EU-27 export 2009 30192 Eels, live 4 301 650 15 721
EU-27 export 2010 30192 Eels, live 18 082 716 24 204
EU-27 export 2011 30192 Eels, live 1 105 750 6 925
EU-27 export 2012 30192 Eels, live 2 133 137
Country or Area Year Comm. Code Commodity Trade (USD) Weight (kg)
Italy export 2001 30192 Eels, live 3 615 833 541 647
Italy export 2002 30192 Eels, live 2 435 027 397 205
Italy export 2003 30192 Eels, live 2 357 707 298 241
Italy export 2004 30192 Eels, live 2 345 356 224 434
Italy export 2005 30192 Eels, live 1 759 065 146 833
Italy export 2006 30192 Eels, live 2 435 387 179 007
Italy export 2007 30192 Eels, live 2 068 470 156 393
Italy export 2008 30192 Eels, live 1 550 466 115 467
Italy export 2009 30192 Eels, live 1 239 779 117 496
Italy export 2010 30192 Eels, live 1 776 847 177 902
Italy export 2011 30192 Eels, live 2 742 012 197 619
Italy export 2012 30192 Eels, live 1 668 389 96 635

58
Table 83. Export Denmark (030192 – UNdata)
Source: UNdata, United Nations Statistic Division, Commodity Trade Statistics Database Table 84. Export Spain (030192 – UNdata)
Source: UNdata, United Nations Statistic Division, Commodity Trade Statistics Database.
Country or Area Year Comm. Code Commodity Trade (USD) Weight (kg)
Denmark export 2001 30192 Eels, live 11 925 052 1 836 081
Denmark export 2002 30192 Eels, live 14 121 503 2 316 570
Denmark export 2003 30192 Eels, live 18 369 485 2 407 065
Denmark export 2004 30192 Eels, live 19 163 282 1 888 422
Denmark export 2005 30192 Eels, live 22 397 169 1 958 303
Denmark export 2006 30192 Eels, live 23 848 240 2 060 198
Denmark export 2007 30192 Eels, live 22 426 852 1 883 207
Denmark export 2008 30192 Eels, live 21 535 697 1 870 683
Denmark export 2009 30192 Eels, live 17 496 136 1 667 767
Denmark export 2010 30192 Eels, live 14 147 426 1 366 822
Denmark export 2011 30192 Eels, live 13 822 010 963 213
Denmark export 2012 30192 Eels, live 13 091 344 894 602
Country or Area Year Comm. Code Commodity Trade (USD) Weight (kg)
Spain export 2001 30192 Eels, live 12 347 964 217 659
Spain export 2002 30192 Eels, live 8 811 740 240 319
Spain export 2003 30192 Eels, live 5 502 189 193 524
Spain export 2004 30192 Eels, live 15 756 564 192 996
Spain export 2005 30192 Eels, live 22 199 102 153 041
Spain export 2006 30192 Eels, live 7 532 477 136 992
Spain export 2007 30192 Eels, live 9 829 588 167 679
Spain export 2008 30192 Eels, live 13 512 789 293 062
Spain export 2009 30192 Eels, live 3 563 906 586 339
Spain export 2010 30192 Eels, live 5 919 334 200 846
Spain export 2011 30192 Eels, live 4 047 545 238 553
Spain export 2012 30192 Eels, live 2 570 998 30 880

59
3. MARKETING OF EEL AS A SEAFOOD (AN OVERVIEW) Eel species are harvested and marketed globally for human consumption. They are distributed both live and refrigerated and prepared according to local traditions including marinated and grilled in Japan, or smoked and stewed in northern Europe and North America. While eel is closely linked to local customs in terms of consumption, it has an established presence and interest in global trade. The variety of eel found in the European and Asian markets extends beyond the species of greatest commercial interest. The eel traded is identified by Commodity Codes, includes eel that is live, fresh or chilled, frozen, or prepared as a marinated, salted, dried, smoked and canned product. This section presents a snapshot of various global markets and their characteristics. Italy Food balance sheet of fish and fish contribution to protein supply: average 25 kg per capita – data refer to 2007 (Source FAO-FIPS, 2009). The consumption of eel meat in Italy is linked to regional culinary traditions, especially in the north and east areas of the country with lakes and streams, which are ideal inland water habitats. At retail, most eels are sold live or fresh, directly in fish markets or through major distribution chains, in particular for traditional feasts. Eaten as a typical dish, it is served in steaks prepared on the basis of traditional local recipes of, for example, the Tuscan region or near Venice. Eel is quite hard to obtain due to the non-uniformity of the fish, the type of sale (live), the high price and the difficulties involved in its preparation and consumption compared with other fish product types both farmed and caught in the wild. Saltwater sea bream and gilthead, and freshwater trout, salmon and Nile perch are sold by major distribution chains as vacuum-packed fillets, which are easy to prepare and offered at a very competitive price. The retail price at the time of writing was around EUR 10.5 per kg). Eel – is sold whole, making it quite unsuitable for small portions or slices for daily consumption. Supply chains follows two lines: producer – local market (live or fresh) – final customer. producer – supermarket (live, fresh, marinated, etc.) – final customer. The biggest wholesale fish market in Italy is in Milan, in terms of quantity, quality and the freshness of the products sold. In addition, Venice and Chioggia have Adriatic Sea fish markets of notable importance.

60
Fish consumption in Italy was around 25 kg per capita in 2007. Fresh seafood, the main product group purchased by Italian families, accounted for 50 percent of purchases, followed by frozen seafood (23 percent) and canned seafood (20 percent). Due to the increasing consumption and declining domestic supply, Italy is a net importer of seafood. Eel is mostly sold as a live product and typically consumed as a speciality dish at Christmas. Venice fish market. A statistical survey on European eel sales in the Venice fish market (wholesale market) during August – October 2012 found: European eel adult size (imported product) average price from EUR 11.00 to EUR 20.00 European eel adult size (Italian national product) average price from EUR 9.00 to EUR 20.90 European eel adult size (Italian local product) average price from EUR 8.76 to EUR 16.00 European eel small-medium size (imported product) average price from EUR 7.50 to EUR 20.00 European eel small-medium size (Italian local product) average price from n/a to EUR 20.00 Chioggia seafood market. A statistical survey on Anguilla anguilla sales in the Chioggia wholesale seafood market for the end of November 2012 found: European eel medium size (Italian national product) average price from. EUR 10.00 to EUR 19.95 European eel medium size, whole (Adriatic Sea, local) average price EUR 15.00 (no fluctuation) National retail supermarket price for live eel averaged EUR 25.00/kg, according to October 2012 statistical survey, with weight ranging from 0.5 to 1 kg. No data on other eel products currently available. Germany Food balance sheet of fish and fishery products in live weight and fish contribution to protein supply: average 15 kg per capita – data refer to 2007 (Source FAO-FIPS, 2009). In North European countries, processed fishery products are of significant commercial importance. In Germany alone they are processed in numerous ways by processing facilities, smoking being a widely used technique. Smoking is one of the traditional techniques used to preserve eel meat. However, fresh eel is not very popular in Germany. According to numerous reports, over 75 percent of the German eel market is smoked high value, derived from European eel from the Baltic Sea and has a high fat content. Smoking improves the quality of the meat and its flavour, and also preserves the product. Due to their organoleptic properties, eels from other areas are of lower value due to their

61
low fat content. In Germany, the eels sold for smoking are around 300–600 g which is larger than the standard 120–180 g size sold in Denmark or Holland. Evaluating the Globefish Commodity Update Report, eel trade and the eel market in Germany play a marginal role in the global economy of the fish market. Smoked eel is the only segment of relevance, mainly due to tradition. France Food balance sheet of fish and fishery products in live weight and fish contribution to protein supply: average 34 kg per capita – data refer to 2007 (Source FAO-FIPS, 2009). France is one of the most important seafood markets in Europe, with high per capita fish consumption. The national market supplies over 70 percent of seafood consumption. France is a big consumer of scallops and oysters. These products are essentially traditional and seasonal, e.g. scallops are mainly consumed in December (as is Italy, but with a different impact in terms of domestic market share). According to numerous reports and authors on the seafood market, eel trade does not seem to be of great importance for the French market. In fact, all French eel production is exported to Spain and Italy. Spain Food balance sheet of fish and fishery products in live weight and fish contribution to protein supply: average 43.0 kg per capita – data refer to 2007 (Source FAO-FIPS, 2009). Consumer expenditures for fish and seafood products have increased in recent years with a high level of seafood consumption, equal to 43 kg per capita. Demersal fish such as flounder, and pelagic fish are the main types of seafood consumed in Spain. Seafood is consumed in a variety of ways but mostly whole, fresh and frozen. Prepared products, with the exception of canned tuna, are less popular and therefore less important for the economy. Fresh fish is mostly consumed at home, while frozen seafood is consumed at the restaurant. The fish commodities exported by Spain are tuna, pelagic specimens and molluscs. The supply chain is similar to that of the other southern European countries such as Italy, with consumers purchasing seafood from the supermarket and hypermarket, abandoning traditional local markets (typical of the eel trade) in favour of large-scale retail. Fried glass eel is very popular in Spain where it is a typical national dish. Most of the product is marketed in Spain by frozen food distributors, who organize their supply chain in the national sea food processing sector – one of the largest in the EU (Globefish, 2008). According to ANFACO-CECOPESCA, around 150 companies operate in the sector, with particular emphasis on canned tuna.

62
Eel is a traditional market segment with small but stable share. In the MERCABARNA Market, in February 2012, smoked European eel, small size 100 g packet, was sold for EUR 4.2/kg. An exhaustive list of Spanish seafood operators (importers, exporters, farmers and distributors) is available in Globefish, Volume 96 "The Seafood Market in Spain". China Food balance sheet of fish and fishery products in live weight and fish contribution to protein supply: average 32.0 Kg per capita – data refer to 2007 (Source FAO-FIPS, 2009). China is a major eel aquaculture producer, not only because of growing domestic demand, but also due to the high demand from other countries such as Japan. Eels are certainly one of the 700 species of freshwater species of great economic importance in terms of inland water fishery resources. However, since the 1960s, inland fishery resources have decreased considerably due to over-fishing, land losses caused by urbanization and growing pollution. Eels (mostly Anguilla japonica) have around a 1 percent share of the Chinese fish market (Globefish, 2004). Most national eel farming facilities and processing plants export only to Japan due to high demand. The major export areas are the East Asian region (Japan and South Korea) and the European Union (mainly Italy, France and Spain). Export of eel in all forms, including live and roasted (in particular) and of processed products to Japan and Korea, is of great relevance for this market segment. In 2002, roasted eel accounted for a volume of around 67 000 tonnes, worth USD 590 million. Kabayaki fried eel also has a high impact on exports to Japan. The average price for eel exported from Guangdong Province to Japan in 2008 was USD 26.0 kg. Market In general, the Chinese prefer live seafood, followed by frozen fish and then canned. Less than 5 percent of total aquaculture production is treated or processed for local or overseas markets. For this reason and due to the high eel quotations, most national production is exported. Of the 32 kg per capita of fish consumption, only a small part is eel consumption, indicating that eel farming in China is almost exclusively for export.

63
Japan Food balance sheet of fish and fishery products in live weight and fish contribution to protein supply: average 54.0 kg per capita – data refer to 2007 (Source FAO-FIPS, 2009). According to FAO, Japan is the biggest eel market. In fact, Japan has the largest fish market in the world, located in the Tsukiji district close to Tokyo. Its aquaculture sector cannot meet the high demand for eel. Japanese eel is sold at different prices according to the fish origin: lake, river or pond. The price fluctuations are determined by the seasonal nature of the product, and the availability of eels of a commercial size (not only Anguilla japonica but also Anguilla anguilla). According to Japanese tradition, eels are consumed during July and August, a period during which eel dishes are the most expensive seafood. The product varies according to the concentration of fatty acids, which again depends on its diet. In Japan, the average price of live eel (no data on whether Anguilla anguilla or Anguilla japonica, or both) rose 50 percent during the first half of 2012. Markets Imports of live eels for human consumption amount to 400 tonnes, worth JPY 1 247 million in the last analysed period. Imports from China dropped by around 35 percent in volume and an average of 2 percent in value from the previous year, while those from Taiwan Province of China to China dropped 70 percent in volume and 55 percent in value. Around 90 percent of eel (all Anguilla spp.) consumed in Japan is consumed as kabayaki, a Japanese dish prepared using 100–200 g eels. The eel is marinated in soy sauce and then steamed or grilled. Considering that this seafood fish market is the most important, and given the significant decrease in the number of wild specimens available, it would be best to change this situation, with greater focus on eel issues, promoting the consumption and cultivation of large specimens.

64
4. REGULATIONS
4.1. CONVENTION ON INTERNATIONAL TRADE OF ENDANGERED SPECIES OF WILD
FAUNA AND FLORA (CITES) The Washington Convention on International Trade of Endangered Species (CITES) regulates trade in terms of exportation, re-exportation, importation, transit, transfer and detention for any reason, of some endangered animal and plant species. Established in 1975 and administered by United Nations Environment Programme (UNEP), Member Countries (Parties) currently number 169. CITES regulates the international trade of approximately 30 000 species, of which approximately 25 000 are plant species. These species are listed in three appendices. Each country has its own management authority. On 1 January 1984, the EU implemented the CITES regulations with legislation which is stricter for some species than the actual CITES regulations. Regulation (EC) 338/1997 (Protection of wild flora and fauna species through trade control) was followed by other regulations and significant modifications to define the species to protect in detail, classifying the same in various annexes. The following EU regulations are currently in force: Council Regulation (EC) 338/1997 on the protection of species of wild fauna and flora by regulating trade therein. Commission Regulation (EC) 407/2009 (annexes of Regulation 338/97 with the lists of the protected wild flora and fauna species), that repealing and replacing the (EC) 318/2008. Commission Regulation (EC) 865/2006 (indicating the method of application of the Council Regulation (EC) 338/97. Commission Regulation (EC) 100/2008 (with modifications and integrations of Regulation (EC) 865/2006). Commission Regulation (EC) 359/2009 (suspending the introduction in the EU of some wild fauna and flora species and annulling Commission Regulation 1037/2007 and Regulation 811/2008. Council Regulation (EC) 1100/2007 (establishing measures for the recovery of the stock of the European eel on 18 September 2007).
4.2. COUNCIL REGULATION (EC) 1100/2007 The EU Member States adopted Council Regulation (EC) No. 1100/2007, establishing measures for the recovery of European eel stock (Anguilla anguilla, Linneo, 1758). This rule includes measures for the EU Member States concerning the restocking of European eels and, in particular, special requirements to increase the number of eels measuring less than 12 cm in length through the implementation of an eel management plan. This Regulation established guidelines for the exploitation of the European eel in community and transboundary water, in costal lagoons, in estuaries and rivers that flow into the sea (art. 1).

65
It requires all Member States to identify the river basins in their national territory that constitute natural habitats for the eels (freshwater eel in natural habitat). Eel Management Plan. For each habitat, Member States need to prepare an eel management plan. The main goal of the Eel Management Plan is to reduce anthropogenic mortalities to let around 40 percent of the silver eel biomass escape to the sea. Each document shall contain a detailed description of the present eel population situation in the river basin. In the Eel Management Plan, each Member State shall also implement measures to decrease eel losses caused by non-fishery factors, including hydroelectric turbines and biological predators. An Eel Management Plan may contain the following measures: restocking of specimens, reducing commercial fishing activity (legal and illegal), certain measures related to aquaculture, and the elimination of predators (art. 2). The reduction in catches may be replaced in whole or in part by immediate measures concerning other anthropogenic loss factors (art. 5). The measures concerning restocking eels of less than 12 cm are in art. 7.
4.3. PROTECTED SPECIES The list of CITES protected species (formally referred to as Specimens) are periodically revised (dynamic lists). The various species are listed in three appendices on the basis of the level of protection required. Appendix I includes protected species in the strictest sense, actually in danger of
extinction. Trade is forbidden, use may be allowed in exceptional circumstances. Appendix II includes protected species, which are not in imminent danger of
extinction. These species are subject to control (trade must be compatible with survival of the same and is subject to authorization through CITES certification).
Appendix III includes species protected by single member states (typically in states that attempt to protect special endemic species)
Various species can be added or cancelled from Appendices I and II or moved from one appendix to another only after joint Party decisions in conferences held by member states using proposal procedures. Species in Appendix III can only be included or cancelled from the list by unilateral decision of the relevant country. APPENDIX I Permission to import must be requested from the state authorities. This is only given if the species in question is not traded for commercial purposes but for the purpose of protecting the species – the same is valid for re-exportation requests. Permission is only given if the animal was obtained with legal means. In the case of live animals or plants, the effects of stress during transportation must be kept to a minimum.
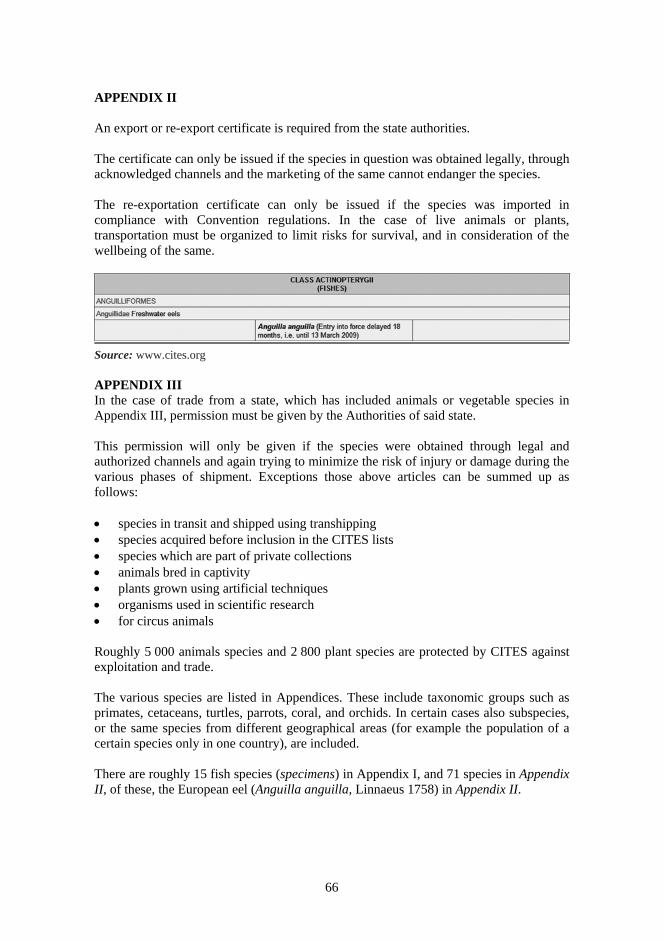
66
APPENDIX II An export or re-export certificate is required from the state authorities. The certificate can only be issued if the species in question was obtained legally, through acknowledged channels and the marketing of the same cannot endanger the species. The re-exportation certificate can only be issued if the species was imported in compliance with Convention regulations. In the case of live animals or plants, transportation must be organized to limit risks for survival, and in consideration of the wellbeing of the same.
Source: www.cites.org APPENDIX III In the case of trade from a state, which has included animals or vegetable species in Appendix III, permission must be given by the Authorities of said state. This permission will only be given if the species were obtained through legal and authorized channels and again trying to minimize the risk of injury or damage during the various phases of shipment. Exceptions those above articles can be summed up as follows: species in transit and shipped using transhipping species acquired before inclusion in the CITES lists species which are part of private collections animals bred in captivity plants grown using artificial techniques organisms used in scientific research for circus animals Roughly 5 000 animals species and 2 800 plant species are protected by CITES against exploitation and trade. The various species are listed in Appendices. These include taxonomic groups such as primates, cetaceans, turtles, parrots, coral, and orchids. In certain cases also subspecies, or the same species from different geographical areas (for example the population of a certain species only in one country), are included. There are roughly 15 fish species (specimens) in Appendix I, and 71 species in Appendix II, of these, the European eel (Anguilla anguilla, Linnaeus 1758) in Appendix II.

67
4.4. IUCN RED LIST OF THREATENED SPECIES IUCN Red List of Threatened Species was established in 1948 and represents the most extensive database of information and data on the conservation status of plant and animal species around the world. The list is compiled by the International Union for the Conservation of Nature and Natural Resources (IUCN), which is the entity responsible. The IUCN Red List is based on precise criteria to assess the extinction risk of thousands of species and subspecies. The IUCN Red List of Threatened Species is produced annually and grades the threat of species that have been evaluated by its assessment criteria. Some 30 percent of all fish species recently assessed by the World Conservation Union were designated in threatened categories. Species are classified as: extinct (EX) extinct in the wild (EW) critically endangered (CR) endangered (EN) vulnerable (VU) lower risk/conservation dependent (LR/CD) near threatened (NT) least concern (LC) data deficient (DD), when data are inconclusive
Freshwater fish are particularly vulnerable due to their habitat, while marine fish (excluding anadromous species) are less threatened than freshwater fish (Akcakaya, 2004). Indeed there are no documented cases of saltwater species going extinct as a result of human activities (Robert and Hawkins, 1999). However over fishing has caused local extirpation and some marine fish population have declined within a few generation (Reynolds et al., 2001). The European eel, Anguilla anguilla is among the new additions to the 2008 IUCN Red List of Threatened Species. Anguilla anguilla was classified as critically endangered (CR) in the 2008 Red List because its small population has suffered dramatic declines (around 90 percent of wild

68
juvenile stock) in recent years due to human impact. All the other eel species suitable for commercial purposes (A. japonica, A. rostrata, etc.) are listed as last concern (LC) or not evaluated.
4.5. UNITED STATES OF AMERICA LEGISLATIVE ASPECTS Regulation of Aquaculture in the United Stated of America. Regulation of aquaculture in the USA is both at the federal and state level. At the federal level, the most important agencies are the Food and Drug Administration (FDA), the Department of Agriculture (USDA) and the Environmental Protection Agency (EPA). Each one regulates a specific part of the aquaculture sector. The FDA covers all matters concerning food and safety regulations and drug approval. However, there are other agencies at the federal level involved in aquaculture activities: Centre for Veterinary Medicine in the FDA, the Animal and Plants Health inspection Service (APHIS) in the USDA, (APHIS), and the US Fish and Wildlife Service (FWS) of the Department of the Interior. At the federal level, aquaculture, is defined by the National Aquaculture Act of 1980. Regarding the eel market, some laws are involved with a different purpose. This study analyses two in particular: the Lacey Act and the Endangered Species Act (ESA). 4.5.1. Wildlife – Fish Regulation. The Lacey Act The Lacey Act is a conservation law that prohibits the transportation of illegally captured or endangered animals across state borders. It was the first federal law for protecting wildlife, and is still in effect, though it has been revised and amended several times: 1969, 1981, 1989 and 2008. It is mainly applied to prevent the importation or spread of potentially dangerous and non-native species, such as the eel swim bladder parasite Anguillicola crassum. The Lacey Act is administered by the U.S. Departments of the Interior, Commerce and Agriculture through their respective agencies. These include the U.S. Fish and Wildlife Service, National Marine Fisheries Service, and Animal and Plant Health Inspection Service (APHIS). Selected definitions Fish or wildlife includes: wild animals dead or alive, including wild mammals, birds, reptiles, amphibians, fish, molluscs, crustacean, arthropods, coelenterates or other invertebrates, and including any part, product, egg or offspring. Import includes: land on, bring into or introduce into any place subject to U.S. jurisdiction. Plant or plants: a wild member of the plant kingdom, including roots, seeds and other parts (but not common food crops) indigenous to a state and either listed on an appendix to the Convention on International Trade in Endangered Species of Wild Fauna and Flora, or under a state conservation status. Prohibitions on activities: This Act makes it illegal to import, export, transport, sell, receive, acquire or purchase fish, wildlife or plants taken, possessed, transported or sold in violation of a federal law, treaty, regulation or Indian tribal law. It is also illegal for a

69
person to import, export, transport, sell, receive, acquire or purchase in interstate or foreign commerce: fish or wildlife taken, possessed, transported or sold in violation of a state law, state regulation or foreign law; plants taken, possessed, transported or sold in violation of a state law or regulation. The Act also makes it illegal to possess within the special maritime and territorial jurisdiction of the U.S.: fish or wildlife taken, possessed, transported or sold in violation of a state law, state regulation, foreign law or Indian tribal law; plants taken, possessed, transported or sold in violation of a state law or regulation. 4.5.2. Federal laws related to wildlife control: Endangered Species Act (ESA) Several agencies are involved in the regulation of the wildlife control industry. The major agencies involved are the U.S. Fish and Wildlife Service (FWS) and the U.S. Environmental Protection Agency (EPA) and the Department of Agriculture, Animal and Plant Health Inspection Service (APHIS), which provides federal leadership in addressing wildlife damage issues, but doesn't have a regulatory role. All the U.S agencies help manage wildlife to reduce damage to agriculture and natural resources, to minimize risks to human health and safety, and to help protect endangered and threatened species. The Endangered Species Act protects animal species that are listed by the federal government as "endangered" or "threatened". These species, in fact, cannot be killed, harmed or collected except under some carefully described circumstances, and then, only with permits. Two sections, 7 and 9, are the most important. Section 7 applies not to private parties but to federal agencies and Section 9 makes it illegal for anyone to "take" a listed animal, and this includes significantly modifying its habitat. The procedures for listing a species are in Section 4 of this law, an "endangered" species is one that is "in danger of extinction" throughout all or a significant portion of its range. Congress refined these definitions into five criteria, any one of which will justify listing: impacts to the species' habitat or range, overuse of the species by humans, disease or predators, inadequacy of existing legal protection, or "other natural or man-made factors" affecting the species' continued existence. When the agency determines that a species is endangered or threatened, it must designate the species' "critical habitat". The critical habitat includes the areas within the geographic area occupied by the species, whose physical or biological features are "essential to the conservation of the species" and which may require special management considerations or protection. Most states have their own state endangered species laws and their lists of species based on state law, and there are many specific-state lists on endangered species. The Fish and Wildlife Service (FWS) reviewed the status of the American eel (Anguilla rostrata) in 2007 and found that Endangered Species Act protection for this species was not warranted. All available information about the eel population from Greenland south along the North America coast to Brazil in South America show that declines of eel population in some areas had not put the overall population in danger of extinction. The FWS received another more comprehensive document in 2010 to extend the protection at the federal level to the American eel. This paper presents new and substantial environmental data and information that provides the beginning of the review of the

70
species status. New information indicates that changes in ocean conditions and the correlation of the climate change may be negatively impacting the Anguilla rostrata breeding rates. At the regional level, the Government of Ontario, Canada, also banned commercial American eel fishing in Lake Ontario and the upper St. Lawrence River. Other eel fisheries activities (maybe Anguilla anguilla) continue in various parts of Canada.
4.6. JAPANESE LEGISLATION FOR ANGUILLA SPP. MARKET There is no legal definition of aquaculture in Japan. However, its Fisheries Law defines fishery as "an industry which carries on gathering, taking or culturing of aquatic animals and plants". The Japanese Government is a member of the following international organizations: World Trade Organization (WTO), Southeast Asian Fisheries Development Center (SEAFDEC), Convention on Biological Diversity (CBD) and Convention on International Trade in Endangered Species of Wild Fauna and Flora (CITES). Japanese law concerning the eel market (mainly European and Japanese eels) defines different levels and involves different agencies. It depends on whether the issues are related to trade or are related to health regulations and the protection of endangered species. Japan’s Ministry of Agriculture, Forestry and Fisheries (MAFF) and the Ministry of the Environment (MOE) is in charge of any other aspects (animal health legislation, welfare and wildlife legislation) are the two Government bodies involved. The MAFF: Ministry of Agriculture, Forestry and Fisheries
The Ministry administrates any matters related to agricultural, forestry and fisheries products, from production to consumption and also regulates rural development and promotes the welfare of rural inhabitants in order to achieve a stable food supply and sound development of the agriculture, forestry and fisheries industries, and upgrade the welfare of rural inhabitants (however in practice many tasks have been delegated to the local governments).
The MOE: Ministry of the Environment The Ministry has developed Guidelines for Local Biodiversity Strategy, and New Technology to Help Restore Coral Reefs. It cooperates in campaigns for reducing waste and has an important role in the climate change policy. The Ministry also has published Measures to Be Taken against Invasive Alien Species.
4.6.1. Law on the Protection of Fisheries Resources (Act No. 78 of 1996) This Law is primarily aimed at preventing the spread of fish disease to Japan through the import of marine aquatics animals for use in aquaculture. The Ministry of Agriculture, Forestry and Fisheries (MAFF), has the necessary expertise regarding this law. The most interesting section of this law covers Import Quarantine of Aquatic Animals for different purpose (Article 13-2 - 13-5). Other laws include the Fisheries Basic Act (Act No. 89 of 2001), and the Law of Maintenance of Sustainable Aquaculture Production (Act No. 51 of 1999).

71
Fisheries Basic Act (Act No 89 of 2001) The aims of this Act are to control water quality, and protect and provide nursery grounds of aquatic animals, in order to conserve and improve the environment for fish. The Fisheries Basic Act provides measures for the conservation and management of living aquatic resources, research and study of living aquatic resources, and promotion of production of aquatic animals. Law of Maintenance of Sustainable Aquaculture Production (Act No. 51 of 1999). This Act aims to assure sustainable aquaculture production by taking measures to promote the improvement of aquaculture areas, and by taking measures to prevent the spread of certain infectious diseases in farm-raised aquatic organisms. The MAFF establishes the basic policy for the sustainable aquaculture production. This Act also provides for: obligations of persons engaged in aquaculture to report specified diseases, restrictions on the movement of farm-raised aquatic animals, and compensation for losses caused by specified diseases.. 4.6.2. Wildlife protection system There are still many problems regarding wildlife trade in Japan, mainly because the present laws regulating wildlife trade are insufficient to curb illegal trade and do not provide sufficient deterrents, even if many laws have been revised. Law No. 75 of 1992 remains defective and ineffective (www.panda.org). To protect wildlife and preserve endangered species, it is important to protect habitat, regulate hunting, prevent illegal killing and implement any other measures necessary. The wildlife protection system of Japan preserves wildlife by enforcing the Wildlife Protection and Hunting Law and the Law for the Conservation of Endangered Species of Wild Flora and Fauna. 4.6.3. Law for the Conservation of Endangered Species of Wild Fauna and Flora
(LCES) in Japan (1992, Law No. 75) Japan became a member of the Convention on International Trade in Endangered Species of Wild Fauna and Flora (CITES) in 1980. In Japan, the Ministry of International Trade and Industry is the Management Authority, while the Environment Agency and the Ministry for Agriculture, Forestry and Fisheries (MAFF) are the Scientific Authorities. The Japanese Government applies the Customs Law and the Foreign Exchange and Foreign Trade Control Law for border control relating to CITES. Japan also controls the transfer of CITES Appendix I specimens within the country under the Law for the Conservation of Endangered Species of Wild Fauna and Flora (1992, Law n. 75). Objectives. The Law for the Conservation of Endangered Species of Wild Fauna and Flora recognizes the importance of wild fauna and flora as essential to life. Its objectives are to ensure the conservation of endangered species of wild fauna and flora and as a result contribute to the conservation of natural surroundings for present and future generations.

72
Definitions. “National endangered species” (NES) refers only to the endangered species that are native to Japan, while "international endangered species" (IES) are those species listed in Appendix I of CITES or species listed as protected species in any of the bilateral migratory bird agreements/conventions with the United States of America, Australia, China or the Russian Federation. At the moment, Japanese eel (Anguilla japonica) or other Indo-Pacific eel species are not included in this list. The National Guidelines for Conservation of Endangered Species. Adopted by the Japanese Government, the National Guidelines for the Conservation of Endangered Species include the fundamental concept of and basic methodology for protection of organisms, protection and rehabilitation of natural habitats, and maintenance of viable population for the conservation of endangered species. Prohibition on Acquisition and Transfer of Endangered Species. Hunting, taking, killing or injuring any living NES specimens is prohibited unless a permit has been granted by the Director-General of the Environment Agency. The transfer of NES or IES organisms, whether dead or alive, for commercial or non-commercial purposes, and including whole organisms, parts or derivatives, is forbidden except in the following cases: a) when permission to transfer for specific purposes has been granted by the Director-General of the Environment Agency; b) if the NES is exempt from the provisions of the law; c) if the specific IES parts or products (manufactured in Japan) are exempt from the provision of the law; and d) if the IES organisms have been designated or when specific materials have been previously registered. Regulations on Transfer of IES Parts. Parties that intend to transfer certain IES parts (non-processed) within the country must first register these at the Japan Wildlife Research Centre. The IES parts can be registered if a) they have been produced from captive-bred animals or artificially propagated plants or b) they were obtained before the CITES measures came into force. If the IES parts have not been registered in this manner, the Director-General of the Environment Agency must issue permission to transfer the IES parts for specific purposes. Registered entities may issue management cards to indicate the legality of the parts they handle. Furthermore, entities engaged in manufacturing final products made of specified materials with properly filed management cards may place on each product a mark issued by the Director-General of the Agency, relevant ministers, or designated public organizations. 4.6.4 Other Indo-Pacific Legislation on the Eel (Australia and New Zealand) Australia. According to Queensland authorities that have managed the eel fishery since 1990, freshwater eels are the only eel species that may be taken for trade in Queensland freshwaters. The targets are two Indo-Pacific eel species: long-finned eel (Anguilla reinhardtii); short-finned eel (Anguilla australis australis).
There is a minimum size limit of 30 cm for each adult specimen, and juvenile eels may be sold to authorized aquaculture enterprises for growing only. Exporting juvenile eels is not permitted. Adult eel catch is exported as live product to Southeast Asia – mainly to

73
China and Taiwan Province of China (almost certainly long-fin eels, Anguilla reinhardtii). The Queensland commercial eel fishery is operated in accordance with the Fisheries Act, 1994 and the Fisheries Regulation 2008. New Zealand. New Zealand’s freshwater environment supports a number of species that are used and valued in different ways. For this reason, the Ministry of Fisheries has developed a National Fisheries Plan (NFP) for Freshwater. All native freshwater eel species (Anguilla dieffenbachiii and Anguilla australis) are under the Quota Management System, which establishes a catch limit for certain fish species. The Fisheries Act of 1996 is the relevant legislation in force and the NFP role includes the stock and fishing activities that are managed under this Act. The primary fisheries are for two freshwater eel species: short-fin eel (Anguilla australis) and long-fin eel (Anguilla dieffenbachiidieffenbachia). The Australasian long-fin (Anguilla reinhardtii) is relatively uncommon. 4.6.5. Illegal trade and food fraud Illegal trade is defined as the clandestine trade in goods or other products for which trade is regulated or prohibited by policies (at a national or international level) for limitation and control. Illegal trade is standard practice in the trade of eels, as can be seen in numerous international documents and reports. In particular, the live eel black market (glass eels) has increased due to lack of availability for farming, caused mainly by limited trade associated with the listing in the Annex II of the CITES legislation. Only listing Anguilla anguilla in CITES may produce false information, in particular for processed (not-whole) products. False labeling of such products is well known in Japan or China but also in Italy. There are substitutions of species of less value, in particular those of the Congridae family, Conger conger (Linnaeus, 1758). Bio piracy is the illegal appropriation of wildlife, micro-organisms, plants and animals and the traditional cultural knowledge that accompanies it. Bio piracy is a violation of an international agreement and the corresponding domestic regulations (if they exist). Poaching continues to represent a threat for controllers; the capture of protected species has become widespread.

74
4.7. SWOT ANALYSIS TOOL
SWOT analysis is a strategic tool often used by private sector businesses and non-governmental organizations. Normally it is formed by a matrix with four sections, which represent internal and external factors, in the present situation and in the close future. Internal factors: The strengths: a resource of the system that it can use to reach its objectives (in the
present). The weaknesses: an internal limit of the system that prevents reaching the
objectives (in the present). External factors: The opportunities: a favorable situation external to the system, which favors the
strategy (environment in the future). The threats: an unfavorable situation in the external environment, which potentially
hinders the strategy (the environment in the future).
The identification phase of the SWOT is crucial for the subsequent decision making. In fact, it is a key element of strategic choice. We decided to use this tool to analyze the eel situation, under all aspects other than biology, resilience, human impact, environment and the future concerning the sustainability of the international market. Strengths: strong adaptability and tolerance to different water parameters, adaptable
to artificial diet, high rate of survival in captivity, good growth rate Weaknesses: only few species have commercial interest, particularly vulnerable due
to their very long life cycle, susceptibility to many diseases and high farming temperature. Significant differences in the growth rates of specimens, high cost of the artificial food, cases of cannibalism among specimens, escapes from farm.
Opportunities: potential new controlled reproductive technologies, life cycle is not yet fully investigated, if regulated at international level the trade becomes sustainable, international legislation.
Threats: essential food for many predators, trade in eels provide a source of income for people mainly in Asian and European countries, over fishing, pollution, natural mortality, modified natural habitats due to human impacts, natural parasites, impact of invasive species, illegal trade, poaching.

75
Table 85. SWOT matrix
INTERNAL S
tren
gths
Strong adaptability and tolerance
to different water parameters Easy to keep Adaptable to artificial diet High rate of survival in captivity Good growth rate Highly productive and well-tested
rearing methods
Only few species of commercial
interest Particularly vulnerable due to
their very long lifecycle Susceptible to many diseases High farming temperature Significant differences in the
growth rates between specimens High cost of artificial food Cases of cannibalism among
specimens Escapes from farm
Wea
knes
ses
EXTERNAL
Opp
ortu
niti
es
Potential new reproductive
controlled technologies Lifecycle is not yet fully
investigated If regulated at international level,
the trade becomes sustainable International legislation
Essential food for many
predators Eel trade provides a source of
income for people, mainly in Asian and European countries Over fishing Pollution, natural mortality Modified natural habitats due to
human impacts Parasites Impact of invasive species Illegal trade Poaching
Thr
eats
SWOT ANALISYS SUMMARY From an analysis of the SWOT matrix, it is clear that at present, the threats due to the external pressure are very important. The increased human activities, and the increasing demand for the international market are the causes of the dramatic decline of wild population of Japanese as well as European eels. At the moment, the international legislation seems unable to reverse the negative trend and European eel is currently regulated by law. Only new breeding techniques (without use of wild stock), and a greater compliance and enforcement against illegal trade, such as through an international agreement, can resolve this situation.
Developed by Pierluigi Monticini.

76
5. REFERENCES
Akacakaya H.R. 2004. Species Conservation and Management, Oxford University Press Inc.
Barnabe G. 1989. Aquaculture Vol.2, Ellis Horwood Publishing, New York USA, pp. 756–785.
Cataudella S. & Bronzi P. 2001. Acquacoltura responsabile, verso le produzioni acquatiche del terzo millennio, Unimar – Uniprom, Roma, pp.508-517.
Cockum E. 1980, Zoologia 2nd Italian Edition, Piccin Editore Padova, ITALY, pp. 330, 601 – 610.
Colavita G. 2008. Igiene e Tecnologie degli alimenti di Origine animale, Le Point Veterinarie ITALIE SRL, Milan pp. 80-83, , 269–272.
Costa F. 1991. Atlante dei pesci dei Mari Italiani, Mursia Editore spa, pp. 24–25. Crook V. 2010. Trade in Anguilla species, with a focus on recent trade in European eel
A. anguilla, A TRAFFIC Report for the European Commission. D’Ancona U. 1960. Trattato di Zoologia 2nd Italian Edition, UTET, Torino ITALY,
pp. 382–959. FAO-FIPS. 2009. Food balance sheet of fish and fishery products in live weight and
fish contribution to protein supply, World by continent, FAO Rome. Ghittino P. 1983. Tecnologia e Patologia in Acquacoltura Vol. 1, Tipografia Emilio
Bono Torino, pp. 53, 71, 350, 408. Globefish. 2008. The Seafood Market in Spain, Globefish Research Programme FAO
Rome. Globefish. 2004. Fishery Industry in China, Globefish Research Programme FAO Rome Jordan D. 1923. A Classification of Fishes, Including Families and Genera, Stanford
University, California USA, p. 130. Manzoni P. & Tepedino V. 2008. Grande Enciclopedia illustrata dei pesci, Euro-
fishmarket srl, Trebbo di Reno Bologna, pp. 121–122. Melotti P. & Giordani G. 1984. Elementi di Acquacoltura Edizioni Agricole Calderini
Bologna, pp. 337–351. Monticini P. 2012. Commercial values of Anguilla anguilla at a European and national
level, IL PESCE Magazine N. 3/2012 Edizioni Pubblicità Italia srl, 41100 Modena (MO), pp. 83–91.
Noga J. 1999. Fish Diseases, Diagnosis and Treatment, Blackwell Publishing, USA pp.166- 167–168.
Paperna I. 1996. Parasites, Infections and Diseases of Fishes in Africa, an Update. CIFA Technical Paper 31, Food Agriculture Organization Rome Italy, pp.157 – 159.
Reynolds J.D. & Jennings S. & Dulvy N.K. 2001. Cited in Akacakaya H.R. 2004. Species Conservation and Management, Oxford University Press Inc. p.195.
Richard D. 2005. Fisiologia degli Animali, Zanichelli Editore spa, Bologna ITALY,pp. 159–490.
Robert & Hawkins. 1999. Cited in Akacakaya H.R. 2004, Species Conservation and Management, Oxford University Press Inc.p.195.
Saroglia M. & Ingle E. 1992. Tecniche di Acquacoltura Edizioni Agricole Calderini Bologna, pp. 150–156.
Thorpe J.E. 2003. The Eel, Fifth Edition, Blackwell Science and The Fisheries Society of the British Isles, Blackwell Publishing Ed. UK.
Tortonese E. 1970. Fauna d Italia, OSTEICHTHYES (pesci ossei) parte prima, Edizioni Calderini Bologna, pp.303–307.

77
Trentini M. 1997. Appunti di zoologia generale e speciale veterinaria. Bologna Edizioni Nautilus, pp. 71–76. 198–203.
Van den Thillart G. & Rankin C. & Dufour S. 2009. Spawning Migration of the European Eel: Reproduction Index, a Useful Tool for Conservation Management, Springer Verlag.

78
6. WEBLIOGRAPHY www.fao.org/fishery/culturedspecies/Anguilla_anguilla/en http://it.wikipedia.org/wiki/Anguilla_anguilla www.fishbase.org/summary/Anguilla-anguilla.html http://eur-lex.europa.eu/LexUriServ/LexUriServ.do?uri=OJ:L:2007:248:0017:0023:E
N:PDF www.cites.org/eng/app/appendices.php www.globefish.org http://it.wikipedia.org/wiki/Analisi_SWOT www.traffic.org/trade/ www.iucnredlist.org/details/60344/0 www.ices.dk/indexfla.asp www.fao.org/fishery/shared/faolextrans.jsp?xp_ISIS_MFN=066684&xp_faoLexLan
g=E&xp_lang=en www.fao.org/fishery/legalframework/nalo_japan/en http://comtrade.un.org/db/default.aspx http://it.wikipedia.org/wiki/Analisi_SWOT www.panda.org www.fao.org/FI/STAT/summary/FBS_bycontinent.pdf www.fao.org/FI/STAT/summary/b-1.pdf

GLOBEFISH MARKET RESEARCH PROGRAMME
Vol 116 The European market for bivalves other than mussels (53p.) May-14 € 30 Vol 115 The European market for mussels (65p.) Apr-14 € 30 Vol 114 Eel (Anguilla spp.): Production and trade (78p.) * Jul-14 --- Vol 113 Exchange rates and the seafood trade (43p.) * Jan-14 € 30 Vol 112 By-products of tuna processing (48p.) Jul-13 € 30 Vol 111 Technical guide to fish canning (69p.) May-13 € 30 Vol 110 Innovative uses of fisheries by-products (53p.) Feb-13 € 30 Vol 109 Seafood markets in Southern Africa: Potential of regional trade and
aquaculture development (53p.)
Jan-13
€ 30 Vol 108 Risks and benefits of seafood consumption (29p.) * Jan-13 € 30 Vol 107 El eco-etiquetado de productos pesqueros en España (56p.) Sep-12 € 30 Vol 106 El mercado de productos pesqueros en España: Efectos de la crisis en la
producción y el consumo (73p.)
Aug-12
€ 30 Vol 105 The European market for shrimp: Trade interactions in the import of warm
water and coldwater shrimp to the main European shrimp markets (39p.)
Aug-12
€ 30 Vol 104 The French market for seafood (48p.) Aug-11 € 30 Vol 103 Turbot - Production technology and markets (31p.) Feb-11 € 30 Vol 102 The Ornamental Fish trade (134p.) Nov-10 € 40 Vol 101 Markets for Tilapia (37p.) Jun-10 € 30 Vol 100 Importance of APEC in world fisheries and aquaculture (34p.) Mar-10 € 30 Vol 99 VietNam Seafood from waterland (124p.) Mar-10 € 30 Vol 98 The Seafood market in Greece (33p.) Mar-10 € 30 Vol 97 Private standards in fisheries and aquaculture (64p.) Apr-09 € 30 Vol 96 The Seafood market in Spain (59p.) Nov-08 € 30 * Free electronic version available at www.globefish.org/globefish-research-programme.html ***********************************************************************
ORDER FORM COPIES ARE AVAILABLE FROM:
FAO - GLOBEFISH - Fisheries and Aquaculture Policy and Economics Division
Viale delle Terme di Caracalla, 00153 Rome, Italy Tel: (39-06) 570 52692 - Fax: (39-06) 570 53020 - Email: [email protected] - http://www.globefish.org
20% DISCOUNT IS OFFERED IF YOU ORDER TWO OR MORE COPIES
I would like to order _________ copy(ies) of the following GRPs ________________________ €_________ By bank cheque/draft in €_______ payable to GLOBEFISH (see address above) By credit card: Card No: ______________________ Visa Mastercard Expiry date: ____________________ Signature: _____________________ Bank transfer to: FAO Trust Fund (EUR), HSBC Bank Plc, 8 Canada Square, London E14 5HQ, UK A/C No: 67115083 (Swift Code MIDLGB22) - IBAN GB04MIDL40051567115083, referencing GLOBEFISH Name: _________________________________ Company: ______________________________ Street Address: ____________________________________________________________________________ City and Postcode: _______________________ Country: _______________________________ Tel: ________________ Fax: _______________ E-mail: _________________________________

GLOBEFISH RESEARCH PROGRAMME
Food and Agriculture Organization of the United NationsProducts, Trade and Marketing Service
Viale delle Terme di Caracalla00153 Rome, Italy
Tel.: +39 06 5705 4744Fax: +39 06 5705 3020
www.globefish.org
The European market for bivalves other than mussels
Volume 116GRP116coverB5.indd 1GRP116coverB5.indd 1 14/05/2014 16:49:0114/05/2014 16:49:01