effectsofcholesterolandunsaturateddopclipidonchainpacking...
TRANSCRIPT
126 Gen. Physiol. Biophys. (2009), 28, 126–139
Effects of cholesterol and unsaturated DOPC lipid on chain packingof saturated gel-phase DPPC bilayers
Thalia T. Mills1, Juyang Huang2, Gerald W. Feigenson3 and John F. Nagle1
1 Department of Physics, Carnegie Mellon University, Pittsburgh, Pennsylvania 15213, U.S.A.2 Department of Physics, Texas Tech University, Lubbock, Texas 79409, U.S.A.3 Field of Biophysics, Cornell University, Ithaca, New York 14853, U.S.A.
Abbreviations: WAXS, wide angle x-ray scattering; Chol, cholesterol; DOPC, 1,2-dioleoyl-sn-glycero-3-phosphocholine; DPPC, 1,2-dipalmitoyl-sn-glycero-3-phosphocholine; Lo, liquid ordered; Ld, liquid disordered; X, mole fraction; Lβ, tilted gel; Pβ’, ripple phase gel; TP, pretransition temperature; Tm, main transition temperature; DMPC, 1,2-dimyristoyl-sn-glycero-3-phosphocholine; GUV, giant unilamellar vesicle; NMR, nuclear magnetic resonance; DSC, differential scanning calorimetry; D, lamellar repeat; d, lipid WAXS spacing; LAXS/SAXS, low/small angle x-ray scattering; MLV, multilamellar vesicle; HWHM, half width at half maximum; CHESS, Cornell high energy synchrotron source; S, sample-to-detector; α, incident angle of x-ray beam on the oriented samples; CCD, charge coupled device; q, magnitude of scattering wavevector; qr and qz, horizontal and vertical components of the scattering wavevector; φ, angle on the detector between qr and qz; β, lipid chain tilt angle with respect to normal.
Abstract. Wide angle x-ray scattering (WAXS) from oriented lipid multilayers was used to study the effect of adding cholesterol (Chol) or 1,2-dioleoyl-sn-glycero-3-phosphocholine (DOPC) to gel-phase1,2-dipalmitoyl-sn-glycero-3-phosphocholine (DPPC) bilayers. Small quantities (X < 0.10 mole frac-tion) of both molecules disrupt the tight packing of tilted chains of pure gel-phase DPPC, forming a more disordered, untilted phase. The addition of larger quantities of DOPC causes the sampleto phase-separate into a gel phase, characterized by a narrow WAXS peak, and liquid disordered phase, characterized by wide, diffuse WAXS scattering. In contrast, two WAXS peaks indicative oftwo coexisting phases were not observed in Chol/DPPC mixtures (XChol = 0.07 to 0.40). Instead, Chol caused a gradual increase in the width of the WAXS peak, consistent with a gradual change from a more gel-like to a more liquid-like state rather than passing through a region of two phase coexistence. Our WAXS data include a huge amount of information. A new method of analysis sug-gests that WAXS data may provide definitive results relating to the disagreements between previouslypublished phase diagrams for Chol/DPPC.
Key words: Cholesterol — Liquid ordered — Lipid bilayers — Chain packing — Phase diagram
Correspondence to: John F. Nagle, Department of Physics, Cegie Mellon University, 5000 Forbes Avenue, Wean Hall, Rm. 7322, Pittsburgh, Pensylvania 15213, U.S.A.E-mail: [email protected]
Introduction
Cholesterol (Chol) has an important role in maintaining a cell membrane that has high fluidity (fast lateral diffu-sion) but is relatively rigid and impermeable (Lindblom
et al. 1981; Yeagle 1985; Finegold 1993). These seeminglyconflicting properties result from two of Chol‘s ratherunique properties: i) its ability to orientationally order chains of fluid phase-lipids (Sankaram and Thompson1990; Huang and Feigenson 1999), which leads to increased bilayer thickness (Gallová et al. 2004; Kučerka et al. 2008), smaller partial molecular volume (Greenwood et al. 2006) and area (Edholm and Nagle 2005), and decreased perme-ability (Mathai et al. 2008); and ii) its ability to cause po-sitional/translational disordering of gel-phase lipids while
127Cholesterol and DOPC perturb gel-phase DPPC
still maintaining a high degree of orientational ordering (Ipsen et al. 1987). The high Chol content state character-ized by low positional order and fast diffusion but highorientational/conformational order is termed the “liquid ordered (Lo) phase.”
Mixtures of dipalmitoylphosphatidylcholine (DPPC) and Chol are perhaps the most studied system for characterizing the change from the well-ordered gel phase in pure DPPC to the Lo phase with increasing Chol content. Pure DPPC is in a tightly packed arrangement of tilted chains (Lβ’ phase) below its pretransition temperature (TP = 34°C) (Tardieu et al. 1973; Janiak et al. 1976; Tristram-Nagle et al. 1993). It is also generally agreed that the addition of sufficient amountsof Chol results in a state that is conventionally called the Lo phase. However, there is disagreement over how the Lo phase develops thermodynamically as a function of Chol concentration.
The much-cited Vist and Davis (1990) phase diagramproposes gel and Lo phase coexistence for mole fraction of Chol (XChol) from 0.07 to 0.22 when the temperature is below the main transition temperature which occurs at Tm = 37°C for deuterated DPPC (the ripple phase was ignored in that phase diagram). That phase diagram alsohas the coexistence of liquid disordered (Ld) and Lo phases at higher temperatures. Similar phase diagrams have been published for other binary sterol/lipid mixtures, such as Chol/DMPC (Almeida et al. 1993) and ergosterol/DPPC (Hsueh et al. 2005). Different techniques report differentphase boundaries; for instance, an early volumetric study presented evidence for phase coexistence for XChol = 0.20 to 0.29 for T < Tm (41°C for undeuterated DPPC) (Melchior et al. 1980). Some methods report no phase coexistence, most notably fluorescence microscopy images of giant unilamellarvesicles (GUVs), which are uniform at all temperatures for Chol/DPPC and other binary Chol/phospholipid mixtures (Feigenson and Buboltz 2001; Veatch and Keller 2005). The microscopy results suggest that any spatial variationsin composition could only involve domains less than one micron in diameter.
Differences in time and distance scales probed by differenttechniques (Bloom and Thewalt 1995) do not fully accountfor discrepancies in the literature. For instance, reports of phase coexistence in the Chol/DPPC system using nuclear magnetic resonance (NMR) and/or differential scanningcalorimetry (DSC) strongly disagree over the location of phase boundaries and nature of the phases (Vist and Davis 1990; Huang et al. 1993; McMullen and McElhaney 1995). Whether nanoscale heterogeneities, observable by spectro-scopic methods but not by optical microscopy, constitute true thermodynamic phases has also been questioned (Huang et al. 1993; Feigenson and Buboltz 2001; Heerklotz and Tsam-aloukas 2006; McConnell and Radhakrishnan 2006; Veatch et al. 2006; Krivanek et al. 2008).
Most of the x-ray diffraction literature concerning phasebehavior of Chol/DPPC mixtures focuses on the low tempera-ture region, and again there are differences. There are somereports of gel/fluid phase coexistence based on the observationof two lamellar repeat (D) spacings in low angle x-ray scatter-ing (LAXS, often called SAXS) (Rand et al. 1980; Meyer et al.1997) or two wide angle x-ray scattering (WAXS) spacings d (Engelman and Rothman 1972), but these reports are not in agreement with the location of phase boundaries (XChol = 0.03 to 0.10 in Rand et al. (1980), Meyer et al. (1997); and XChol = 0.20 to 0.33 in Engelman and Rothman (1972)). In other reports, no x-ray evidence was found for gel/fluid phaseseparation in Chol/DPPC (Ladbrooke et al. 1968; Karmakar et al. 2006) and Chol/DMPC (Hui and He 1983; Finean 1990). There are also indirect x-ray reports of high temperature Ld/Lo coexistence in Chol/DPPC mixtures (Richter et al. 2001; Petrache et al. 2005; Chen et al. 2007), but two clearly resolved lamellar repeat or WAXS spacings were not observed in these studies. The majority of x-ray measurements have been carriedout on unoriented multilamellar vesicle (MLV) samples, but in recent small angle x-ray studies of Chol/DPPC oriented samples (Karmakar and Raghunathan 2003), experiments at 98% relative humidity revealed a new gel phase and novel phase diagram. However, this new phase was not observed in a subsequent study by the same group conducted at higher hy-dration (Karmakar et al. 2006), as only single lamellar repeats were observed over a range of Chol concentrations.
As discussed in a previous publication (Mills et al. 2008b), LAXS can be inadequate to detect the presence/absence of phase coexistence because the absence of two lamellar repeats does not necessarily imply a single phase (Rand et al. 1980). Because it is capable of detecting phase separation within single bilayers, WAXS has an advantage over lamel-lar repeat scattering. Hui and He (1983) published one of the most extensive wide angle scattering studies of binary Chol/lipid mixtures in isotropic MLV samples. For XCho l = 0.075 to 0.45 in DMPC and temperatures ranging from 2 to 40°C, Hui and He (1983) observed only a single broad wide angle x-ray and electron diffraction band. Because of thefailure to observe the coexistence of a narrow WAXS peak (characteristic of gel) and broader WAXS peak (characteristic of fluid), this study concluded that the gradual change inthe wide angle pattern “indicates that there is a continuous change in structure as the Chol content increases, rather than a coexistence of two phase-separated regions in the specimen.”
Oriented samples can give information about orienta-tional ordering not available from unoriented MLV samples, as has been shown for fluid phases (Levine and Wilkins 1971;Mills et al. 2008a) but also for gel phase packing and orienta-tion (Smith et al. 1990; Tristram-Nagle et al. 1993). Therefore,a re-examination of the Chol/DPPC system focusing on WAXS data from oriented multilayer samples is of value not

128 Mills et al.
only for examining the question of phase coexistence, but also in better characterizing the structure (positional and orientational ordering) in these mixtures.
Although the high temperature (T > Tm) portion of the Vist and Davis phase diagram has received great attention because of the possible relevance of Ld/Lo phase coexistence to cell membrane rafts, Vist and Davis’s proposed phase dia-gram is strongly based on data collected in the low tempera-ture (T < Tm) region. The low temperature behavior of thesemixtures (the focus of this report) is of interest because of the conflict between Hui and He’s result and phase diagramswhich predict gel/Lo coexistence and also because of the large structural changes in gel-phase chain packing caused by Chol, which are directly measurable with WAXS.
While a single miscible fluid phase with smoothly chang-ing properties is thermodynamically feasible, the transition from a solid with crystalline long range order to a disordered fluid most commonly occurs via a first order phase transi-tion; therefore, a gradual/continuous change from pure DPPC gel to the Lo phase at high Chol concentrations, as suggested from some reports (Hui and He 1983; Feigenson and Buboltz 2001), might seem impossible. However, the gel phase does not have three dimensional crystalline order. Thegel phase involves order in two dimensions, but long range order cannot exist in two dimensional systems (Mermin and Wagner 1966; Mermin 1968), so even though the positional order, as measured by the (2,0) peak (Sun et al. 1994), extends over at least 290 nm, this conceptual argument for a firstorder transition is flawed.
For comparison, we first present WAXS results for the lesscontroversial system DOPC/DPPC. When DOPC is added to DPPC, the mixture separates into DPPC-rich gel phase domains and DOPC-rich fluid phase domains, as has beendirectly observed by fluorescence microscopy (Veatch andKeller 2003; Li and Cheng 2006). Chol or DOPC can both be considered “impurities” which disrupt the tight gel-phase packing of DPPC; however, the structural changes to pure DPPC gel phase are very different for these two impuritiesas we show in this paper.
In a previous study (Mills et al. 2008b), we focused on using WAXS to examine Ld/Lo phase coexistence in ternary mixtures containing DOPC, DPPC, and Chol. Phase behav-ior of Chol/DPPC and DOPC/DPPC binary mixtures are also important with regard to constructing a complete phase diagram of this DOPC/DPPC/Chol ternary system because the binary systems form two sides of the triangle commonly used to represent ternary systems.
Materials and Methods
For all sample preparations (oriented and unoriented), mixtures of DPPC (Avanti Polar Lipids, Alabaster, AL),
DOPC (Avanti Polar Lipids), and Chol (Avanti Polar Lipids; Nu Chek Prep, Elysian, MN) were prepared from stock solutions in high-performance liquid chromatography grade chloroform (Fisher Scientific, Pittsburgh, PA). Pu-rity >99.5% was confirmed by thin layer chromatography.The molar concentrations of the phospholipid stock solu-tions were determined by phosphate assay (Kingsley and Feigenson 1979).
Oriented samples consisting of ~1800 bilayers (10 μm thick) were prepared using the rock and roll technique (Tristram-Nagle 2007). For oriented samples, 4 mg total of lipid was dissolved in 200 μl organic solvent (chloroform/methanol in ratios varying from 3 : 1 to 20 : 1) and then deposited on a 30 × 15 × 1 mm silicon wafer. After thoroughdrying, the samples were trimmed to a 5 mm strip occupy-ing only the center of the 15-mm wide silicon wafer. Thesamples were annealed in a high-humidity chamber at 50°C for typically 4–12 h, and then allowed to slowly cool to room temperature over ~4–8 h. According to previously reported rocking curves (Mills et al. 2008a), this method produced samples with mosaicities less than 0.03° half width at half maximum (HWHM).
As has been described elsewhere, the sample cham-ber (Kučerka et al. 2005) provided a carefully regulated thermal environment that allowed achievement of full hydration from the vapor for oriented samples. However, it is a challenge to reach full hydration without depositing a layer of excess water on top of the oriented lipid stack (“flooding”). Water scattering in the WAXS region can obscure the lipid scattering (Mills et al. 2008a). To avoid flooding, we typically took WAXS data with D = 2–5 Å below the fully hydrated value that was determined from experiments on unoriented MLVs immersed in water in capillaries.
x-ray data were collected at both the Cornell high energy synchrotron source (CHESS) and at a rotating an-ode source, and oriented data presented here are labeled “synchrotron” or “rotating anode.” The synchrotron setupat the CHESS D-1 station has been previously described (Mills et al. 2008a). Scattering as a function of detector pixels was converted to intensity as a function of the scat-tering wavevector, q = 4πsinθ/λ, where 2θ is the total angle through which the x-rays scatter and λ is the x-ray wave-length. Further data collection and analysis procedures, which were essentially the same for the synchrotron and rotating anode, have also been described in detail previ-ously (Mills et al. 2008a).
Rotating anode x-ray measurements on oriented samples at Carnegie Mellon used a 1 × 1 mm beam from the Cu Kα line (λ = 1.5418 Å) of a Rigaku RUH3R rotating anode (Woodlands, TX) equipped with a Xenocs FOX2D focusing collimator. Scans were collected using a 1K × 1K Rigaku Mercury CCD detector with a pixel size of 68.0 μm/pixel.
129Cholesterol and DOPC perturb gel-phase DPPC
Sample-to-detector (S) distances of 96.64 and 97.7 mm were calibrated with silver behenate (D = 58.367 Å). Tempera-ture was controlled with a Julabo controller (Allentown, PA) and monitored with a Cole-Parmer thermistor ther-mometer (Vernon Hills, IL). As for the synchrotron setup, the incident angle α of the beam on the flat samples wasadjustable to 0.01° precision by a rotation stage inside the chamber. Data were collected at α = 0.1°, and mylar window scattering was eliminated from the images by subtracting a “light background” in which the sample was rotated to –α. During the long 10–20 min WAXS exposures, an extension on a Mo beamstop blocked the strong lamellar orders. This extension was moved in order to obtain D spacing measurements, which were short exposures (~30 s) collected while continuously rotating the oriented sample from α = –3 to 7°.
MLVs in excess water were prepared in several ways and measured with different setups. Preparation and setupconditions are referred to in the text as MLV 1, MLV 2 and MLV 3 and are described as follows:• MLV 1: MLVs were made using the "low temperature
trapping" method. This method, which helps preventartifactual Chol precipitation, has been described in detail elsewhere (Huang et al. 1999). Briefly, 1.5 mg lipidwas lyophilized from chloroform, while controlling the temperature so that the chloroform remained solid. Afterremoval of bulk solvent, the powders were kept at –20°C under vacuum for about 12 h. Samples were hydrated with excess water, vortexed, and then loaded into 1 mm glass capillaries (Charles Supper Co., Cambridge, MA) and centrifuged at 5000 × g for 15 min to produce a dense pellet. Capillaries were sealed by paraffin wax under argongas. x-ray diffraction measurements at room temperature(T = 24°C) were performed at the A-1 beamline at the macromolecular diffraction facility at the CHESS (Mac-CHESS) as described previously (Huang et al. 1999). An S distance of 295 mm was used, which allowed the low and wide angle diffraction data (q = 0.06 Å–1 to 1.65 Å–1) to be collected on the same image. Exposure times were 10–100 s.
• MLV 2: WAXS data from one DOPC/DPPC mixture is presented in Figure 2 using the sample preparation protocol and x-ray setup previously described (Zhao et al. 2007). Briefly, ~5 mg lipid was lyophilized at –10°Cfrom a cyclohexane/methanol mixture (containing <10% methanol) for 1–2 h. Then 6 μl of water wereadded to the lipid, yielding a final concentration of~1 : 1 water : lipid. Samples were then cycled 3 times between –196°C (liquid nitrogen temperature) and 75°C, mechanically mixing during each cycle. x-ray measurements at Cornell used a Ni-filtered Cu Kα line (λ = 1.5418 Å) of a Rigaku RU3HR rotating anode Woodlands x-ray source operated at 38 kV and 50 mA.
x-rays were focused using orthogonal Franks mirrors, and tantalum slits trimmed the beam to 1 × 1 mm. WAXS images were collected on a homebuilt 1K × 1K pixel CCD detector (Tate et al. 1997). The S distance of 95.7 mm was calibrated with p-bromo-benzoic acid. Exposure time was 40 min. Sample temperature was controlled with a water-cooled Peltier controller (Mel-cor Inc., Trenton, NJ). The beamline including samplechamber were kept evacuated during measurements to reduce air scattering background.
• MLV 3: Lamellar repeats for DOPC/DPPC and Chol/DPPC mixtures have been previously reported (see Supplement Data S5 for Mills et al. 2008a). Briefly, these MLVs were prepared by adding water to a dry lipid film for a final water : lipid mass ratio of 5 : 1 to 10 : 1 and then carrying the lipid through three freeze/thaw cy-cles (Mills et al. 2008a). The x-ray measurements were performed using the same rotating anode and detector as described for MLV 2, but with a longer S distance of 385.8 or 306.7 mm, as calibrated with silver behen-ate.
Results and Discussion
DOPC removes DPPC chain tilt and induces gel/fluid phasecoexistence
Fig. 1A shows oriented WAXS data from pure DPPC at 25°C. As has been known for many years (Tardieu et al. 1973; McIntosh 1978; Tristram-Nagle et al. 1993) DPPC has an equatorial (2,0) peak and the (1,1) peak lifted offfrom the equator. This is often designated the Lβ’ phase, although it is more precisely designated the L β’I phase (Smith et al. 1990) where the final I subscript indicates thatthe chains are tilted toward nearest neighbors. The satellitepeaks (Sun et al. 1994) on the (1,1) Bragg rod may also be seen in Fig. 1A. The qr width of the (2,0) peak in Fig. 1A is resolution limited, so it shows experimental resolution for this study.
In contrast, scattering from pure Ld phase DOPC is very broad as shown in Fig. 1C. The breadth in the qr direction indicates positional disorder and the breadth in the φ di-rection indicates orientational disorder (Mills et al. 2008a). Fig. 1B shows data for equimolar DOPC/DPPC. There isclearly a broad diffuse band that is instrumentally resolved.We assign this to an Ld phase that is similar to the Ld phase of pure DOPC. There is also a prominent, relatively sharppeak that we ascribe to a gel phase. This peak is broaderthan the gel phase peaks in Fig. 1A. The fact that this peakis instrumentally resolved means that there is less positional order in this DOPC/DPPC gel phase than in the pure DPPC gel phase.

130 Mills et al.
The gel phase in the DOPC/DPPC mixture is even morestrikingly different from the pure DPPC gel phase as there isonly one relatively sharp component centered on the equator in Fig. 1B. This suggests that it is an Lβ phase with an average chain tilt of zero. These differences compared to the pureDPPC gel phase in Fig. 1A are proof that it is not pure DPPC and that whatever concentration of DOPC is in the gel phase is sufficient to remove the tilt of the hydrocarbon chains. Itmay be noted that this disagrees with a recent polarization microscopy study (Li and Cheng 2006) that concluded that the gel phase coexisting with the fluid phase in DOPC/DPPCmixtures was either Lβ’ or Pβ’, depending on composition and temperature. However, our DOPC/DPPC gel phases have very clear WAXS signatures, and we only saw evidence of an untilted (Lβ-like) phase.
Fig. 2 shows unoriented WAXS data for equimolar DOPC/DPPC at 25°C. Narrow (gel) and broad (fluid)peaks are clearly discernable in the data for this system. In contrast, in another study (Chen et al. 2007) the broad fluid-phase WAXS peak was not observed for this samelipid mixture. The data shown in Fig. 2 are a best-case sce-nario for collecting high lipid signal to noise (minimal 1 : 1
water : lipid mass ratio, entire beamline under vacuum). Usually, in order to ensure full hydration and mixing of unoriented samples, we make samples with mass ratios 5 : 1 to 10 : 1 water : lipid, closer to the 4 : 1 ratio used in the other study (Chen et al. 2007). Under these conditions, the broad WAXS fluid peak can be obscured because ofincrease in the high-q water scattering near q = 2.0 Å–1. Oriented samples avoid this excess water problem and, more importantly, they also give additional information about the chain orientation/tilt.
Fig. 3 shows that the structure of 0.10/0.90 DOPC/DPPC is sensitive to hydration/equilibration. After first loading thesample into the hydration chamber, the chains are tilted, as in pure gel phase DPPC (Fig. 3A). The equatorial and tiltedpeaks are still observable after 3.5 h. (Fig. 3B), but only anequatorial peak is observable after the sample equilibratedovernight at high humidity (Fig. 3C). The transformation isnot simply hydration-dependent, as the data shown in Fig. 3B,C have nearly equal D spacings, showing that equilibra-tion time is also a factor. Furthermore, this transformation is reversible by reducing the relative humidity as seen in Fig. 3D. Samples of 0.15/0.85 and 0.05/0.95 DOPC/DPPC
1
Mills_Fig1 Figure 1. Linear grayscale CCD images show high intensity with white pixels. The spatial axes have been approximately converted toscattering vector components qz along the normal to the bilayers and qr in the plane of the bilayers. The scattering near qr = 0 is LAXS lamellar scattering that is mostly absorbed by a beamstop extension. WAXS scattering is concentrated near q ~ 1.5 Å–1. All three images were taken with the same setup at CHESS. A. DPPC in the Lβ’ phase at 25°C (D = 63.4 Å; same as fully hydrated data obtained with setup MLV 3). B. Equimolar DOPC/DPPC at 25°C (D = 62.8 Å; compared with D = 63.2 Å for MLV 3). C. DOPC in the Ld phase at 25°C (D = 60.9 Å compared with 63 Å for MLVs). The bottom row shows the corresponding I(q) plots integrated over a φ ranges of 5–15°. Data collection and processing are described in detail in a previous paper (Mills et al. 2008a). All synchrotron data.

131Cholesterol and DOPC perturb gel-phase DPPC
mixtures exhibited similar behavior. However, the time for disappearance of the tilted peak occurred faster for the larger DOPC concentrations (less than 3 h for the 0.15/0.85 DOPC/DPPC sample). Dependence of gel-phase structure on hydration conditions has been studied in great detail for pure DMPC (Smith et al. 1990; Tristram-Nagle et al. 2002), where dehydration reduces the chain tilt as well as changing the azimuthal in-plane direction of the tilt. In contrast, in Fig. 3 dehydration increases the chain tilt and there is no evidence for change in tilt direction.
Based on previous reports (Lentz et al. 1976; Veatch and Keller 2003), 0.10/0.90 DOPC/DPPC at 25°C should be just within the gel-fluid coexistence region. If so, the gel phase observed for this mixture should have the same properties as the gel phase in the equimolar mixture. For instance, Fig. 3A, if it represented the hydrated, equilib-rium structure, would be inconsistent with Fig. 1B. These results show that the gel phase bilayer structure can be strongly dependent on equilibration time and hydration,
and so it is important to use a chamber capable of retain-ing high humidity over a long time if oriented sample data are to be compared with other measurements taken in excess water conditions.
Even smaller amounts of DOPC also remove the chain tilt from DPPC bilayers, as we have verified for 0.05/0.95DOPC/DPPC (data not shown). Presumably, there is some smaller DOPC concentration, call it X0tilt, below which there is a chain tilt. It is interesting to compare to the effectof DOPC on DSPC lipid which also forms the Lβ’ phase. According to previous measurements (Zhao et al. 2007), equimolar DOPC/DSPC consists of a tilted gel phase co-existing with a fluid phase. However, for this mixture, thegel/fluid boundary is thought to be even closer to pure DSPC.We therefore suggest that X2phase < X0tilt, so that addition of DOPC to DSPC causes phase separation before it eliminates the average chain tilt, whereas in DPPC phase separation requires more DOPC in the gel phase and this additional DOPC eliminates the average chain tilt.
2
Mills_Fig2 Figure 2. A. Unoriented WAXS data for a fully hydrated sample of equimolar DOPC/DPPC prepared from a lyophilized powder with a 1 : 1 water : lipid mass ratio. Data collected with setup MLV 2 as described in Materials and Methods. B. Corresponding I(q) plot integrated over the entire image.
3
Mills_Fig3 Figure 3. Time series of oriented WAXS data for 0.10/0.90 DOPC/DPPC after loading the sample into the chamber and beginning hy-dration at time t = 0: A. t = 30 min., D = 60.9 Å; B. T = 3.5 h, D = 63.8 Å; C. T = 18 h, D = 63.5 Å; D. after blowing a weak stream of dryhelium over the sample, D = 61.0 Å. All rotating anode data.

132 Mills et al.
Small amounts of Chol cause dramatic changes in chain packing and orientation
Fig. 4 shows that small concentrations of Chol have a drastic ef-fect on chain packing and orientation in DPPC bilayers at 25°C. As previously discussed in connection with Figs. 1A and 4A reminds us that DPPC is in the tilted Lβ’ phase. For a 0.02/0.98 Chol/DPPC mixture, two clearly separated WAXS peaks are still observable as seen in Fig. 4B; however, for 0.07/0.93 Chol/DPPC Fig. 4C shows only an equatorial concentration of intensity, suggesting that the average tilt of the chains is zero. Fig. 4D shows for comparison oriented WAXS data for DPPE, which has a single equatorial peak (at d = 4.12 Å), in agreement with McIntosh (1980) that DPPE is in the untilted Lβ phase at 25°C.
This untilting with addition of Chol is similar to the untiltingthat occurs when small amounts of DOPC are added to DPPC. In the latter case, the untilting is not associated with the phase coexistence that occurs at higher concentrations of DOPC, so it is also not necessary to associate the untilting of chains at low concentrations of Chol with a two phase coexistence region.
While not as definitive as data from oriented samples, theWAXS data from unoriented MLVs in Fig. 5 also show that the narrow (2,0) peak and broader (1,1) peak, which are char-acteristic of the Lβ’ phase, are gradually replaced by a single broader peak with the addition of Chol. An advantage of MLV data is that the lamellar D spacing may easily be obtained for samples that are always fully hydrated. The D spacing data in Fig. 6 are also consistent with dramatic changes that occur at
4
Mills_Fig4 Figure 4. Linear grayscale CCD images as described in Fig. 1. A. gel phase (Lβ’) DPPC (D = 61.8 Å); B. 0.02/0.98 Chol/DPPC (D = 63.1 Å); C. 0.07/0.93 Chol/DPPC (D = 82.9 Å); D. DPPE (D = 60.4 Å), all at 25°C. All rotating anode data.
5
Mills_Fig5 Figure 5. Intensity I(q) plots from unoriented Chol/DPPC MLVs at room temperature (24°C). Data collected with setup MLV 1 as described in Materials and Methods.
6
Mills_Fig6 Figure 6. Lamellar repeat D is plotted versus mole fraction Chol for unoriented MLV samples of Chol/DPPC at 24°C. Filled circles and open circles represent two different data sets. Data collected withsetup MLV 1 as described in Materials and Methods.

133Cholesterol and DOPC perturb gel-phase DPPC
low concentrations of Chol. The 20 Å increase in D that oc-curs for XChol = 0.08 has been attributed to ~7 Å increase in bilayer thickness, which is consistent with the removal of chain tilt, and ~13 Å increase in the water spacing (Ladbrooke et al. 1968). This remarkable increase in water spacing, followedby the more gradual decrease in D at higher concentration, requires major changes in the interactions between bilayers, and the swelling has been attributed to either a decrease in van der Waals attraction between bilayers or an increase in repul-sion (Rand et al. 1980). It may also be noted that, while low concentrations of Chol and DOPC both remove DPPC chain tilt, the effect on D is very different; all of the DOPC/DPPCmixtures we studied (both unoriented and oriented samples) had lamellar repeats in the 63–64 Å range.
The HWHM of the scattering peak is inversely related to thecorrelation length, and therefore it reports on the positional or-dering in the sample. For the DPPC and DPPE images shown in Fig. 4A and D, the HWHM for an I(q) plot integrated over a 5° < φ < 10° range was 0.04 Å–1. Previous high-resolution WAXS data collected on unoriented MLV samples of gel-phase DPPC indicate that the true HWHMintrinsic of the (2,0) peak is ~0.002 Å–1 (Sun et al. 1994). For our resolution-limited data HWHMintrinsic was estimated as:
HWHMintrinsic = (HWHM2obs − HWHM2
res)1/2
where HWHMobs is the measured value and HWHMres is the resolution limit obtained from our gel phase DPPC (2,0) peak. This gives HWHMintrinsic = 0.06 Å–1 for 0.07/0.93 Chol/DPPC, which is ~30 times larger than the non-resolution limited value for pure DPPC. So small amounts of Chol not only cause untilting of the chains but also introduce disorder into the regular packing of the chains in gel-phase DPPC.
The dependence on φ (defined in Fig. 1) of the orientedWAXS data gives information about acyl chain orienta-tion. Fig. 7 shows I(φ) plots of the WAXS images shown in Fig. 4, which help identify the intensity maximum, from which a tilt angle can be calculated. (Note that intensities at small angles (below φ ~ 5°) are decreased greatly due to absorption artifacts (Mills et al. 2008a).) For 0.02/0.98 Chol/DPPC, the relative intensity of the (1,1) peak vs. the (2,0) peak is diminished in comparison with pure DPPC. In addition, the location of the maximum decreases by roughly 1° compared to pure DPPC, for which the tilt angle has been reported to be 32° (Tristram-Nagle et al. 1993), indicating that the chains are still tilted for at least some part of the sample at nearly the same angle as in pure DPPC. Interestingly, for 0.035/0.965 Chol/DPPC, the chain tilt might be changing to an Lβ’F state with chains tilting between nearest neighbors (Smith et al. 1990). For 0.07/0.93 Chol/DPPC, there is no obvious maximum at a nonzero φ value, indicating that no part of the sample consists of well-correlated, tilted chains.
The effect of Chol on gel phase lipids has been reportedusing x-ray scattering before (Ladbrooke et al. 1968; McIn-tosh 1978; Rand et al. 1980; Hui and He 1983; Needham et al. 1988; Lemmich et al. 1997). It was concluded, as we do, that the large increase in lamellar repeat (Ladbrooke et al. 1968; McIntosh 1978) and the disappearance (Hui and He 1983) of the characteristic wide angle pattern in unoriented wide angle scattering data (see Fig. 5) indicates a loss of chain tilt with the addition of Chol.
The language of “chain tilt” is clear when referring towell-ordered gel phases, but it is confusing when referring to disordered phases. As an extreme example, in the Ld phase, the average angle β at which the chains tilt with respect to the membrane normal is zero (i.e. the director points along the membrane normal), but the chains are orientationally disordered, and so <|β|> ≠ 0. Our oriented WAXS data indi-cate that the average tilt angle, <β>, in 0.07/0.93 Chol/DPPC is zero, as in pure Lβ phase DPPE. However, the HWHM is broader for 0.07/0.93 Chol/DPPC compared with DPPE, in agreement with previous studies of Chol/DMPC (below Tm for DMPC), which described these bilayers as a “very defec-tive lattice” (Hui and He 1983) or “weakly solid” (Needham et al. 1988). In addition to showing that 0.07/0.93 Chol/DPPC is more positionally disordered than DPPE, the oriented WAXS data show that 0.07/0.93 Chol/DPPC is more orientation-ally disordered, based on the broader I(φ) distribution (see
7
Mills_Fig7 Figure 7. I(φ) plots (intensities integrated over a q = 0.8 to 1.8 Å–1 range) for the images shown in Fig. 4, plus a sample with XChol = 0.035 (D = 77.8 Å).
134 Mills et al.
Fig. 7), indicating a broader distribution of chain tilt angles. So, although the chain orientation director may point along the membrane normal (i.e. <β> = 0) for both these samples, <|β|> appears to be greater for 0.07/0.93 Chol/DPPC.
Gradual changes in chain packing observed at moderate Chol concentrations (XChol = 0.07 to 0.40)
In comparison with the dramatic change in DPPC chain packing and orientation which occurs for XChol between 0
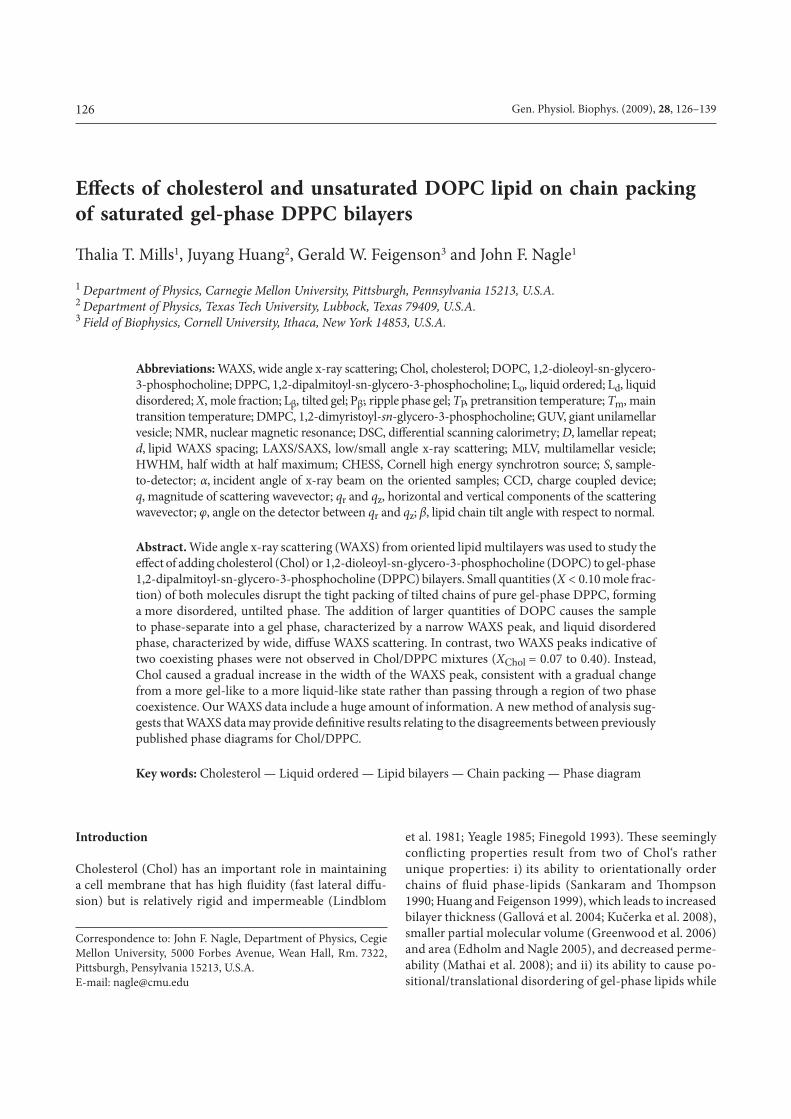
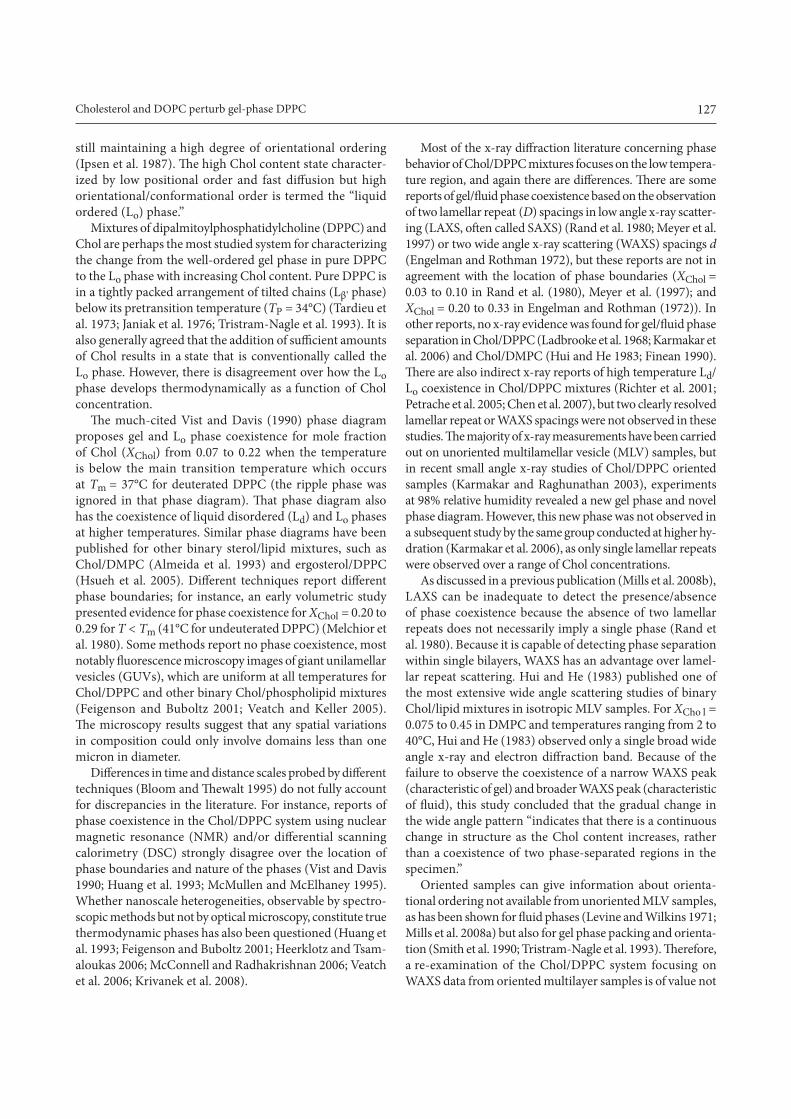
and 0.07 (seen in Fig. 4), Fig. 8 shows that the changes in the WAXS data are more gradual for higher Chol concentrations. In agreement with previous reports (Vist and Davis 1990; Scheidt et al. 2005), for XChol up to 0.40, the lipid maintains a high degree of orientational order, as is evident by the concentration of the scattering intensity near φ = 0 for all the Chol concentrations shown in Fig. 8. However, Fig. 9A shows that HWHMintrinsic increases steadily for XChol = 0.07 to 0.40, indicating that Chol gradually decreases the positional ordering. The HWHMintrisic of 0.18 Å–1 in the
8
Mills_Fig8 Figure 8. 2D CCD images for: A. 0.10/0.90 Chol/DPPC (D = 77.5 Å; compared with D = 80.5 Å for MLV 3); B. 0.15/0.85 Chol/DPPC (D = 75.9 Å; compared with D = 78.4 Å for MLV 3); C. 0.25/0.75 Chol/DPPC (D = 68.2 Å; compared with D = 73.5 Å for MLV 3); D. 0.40/0.60 Chol/DPPC (D = 66.7 Å; compared with D = 67.3 Å for MLV 3) (all at 25°C). The bottom row shows the correspondingI(q) plots integrated over φ ranges of 5–15°, 15–25°, ..., 75–85°. Data collection and processing are described in detail in a previous paper (Mills et al. 2008a). Uncertainties in measured intensities are 1% of the maximum intensity. All synchrotron data.
9
Mills_Fig9 Figure 9. HWHM (A) and peak maximum position, q0 (B), as a function of mole fraction Chol for Chol/DPPC I(q) plots (intensity integrated over a φ = 5 to 10° range).

135Cholesterol and DOPC perturb gel-phase DPPC
I(q) plot falls in the range we have observed (0.14–0.18 Å–1) for fluid phases with varying degrees of Chol (Mills et al.2008a). Another relevant x-ray parameters to track is the position q0 of the peak maximum. Fig. 9B shows that Chol decreases q0, as has been reported previously for a number of phospholipids (Hui and He 1983; Finean 1990). Although this might suggest an increase in chain separation, one must keep in mind that the total scattering includes Chol-lipid and Chol-Chol scattering.
Fig. 10 shows that increasing temperature also causes an increase in the HWHM. In contrast to the gradual change in the HWHM as a function of Chol, the increase in the HWHM occurs in a narrow range of temperature in 0.15/0.85 Chol/DPPC, as one expects due to the main chain melting which necessarily involves positionally disordering. However, for 0.40/0.60 Chol/DPPC, there is no significantjump; at 25°C the HWHM is 0.18 Å–1 and at 45°C it is 0.16 Å–1 (Mills et al. 2008a). The broadening and gradual dis-appearance of the jump in the HWHM vs. temperature plot has been documented previously for Chol/DMPC mixtures (Hui and He 1983). The gradual disappearance of a thermaltransition as more Chol is added has also been observed in many other measurements: DSC (Mabrey et al. 1978), NMR first moment (Jacobs and Oldfield 1979; Vist and Davis 1990;Scheidt et al. 2005), translational diffusion (Rubenstein et al.1979), and volume (Melchior et al. 1980).
Interpretation of x-ray data regarding phase coexistence
As previously formulated (Mills et al. 2008b), there are several x-ray criteria for phase coexistence. These criteriainclude: 1 – the observation of two lamellar D spacings and 2 – the observation of two WAXS d spacings. Either of these traditional criteria is sufficient but not necessary forphase coexistence. As already presented, in the equimolar mixture of DOPC and DPPC at 25°C for which GUV im-ages clearly show coexisting gel and fluid domains (Veatchand Keller 2003), we only observed a single lamellar repeat, so x-ray criterion 1 is not necessary for phase coexistence. Reasons for the non-necessity of criterion 1 are that a phase-separated sample can have a single lamellar repeat either be-cause the two phases have similar D spacings or else because the domains do not align across bilayers (Rand et al. 1980; Mills et al. 2008b). For the same equimolar DOPC/DPPC sample, the oriented WAXS data clearly showed a sharp peak (gel) and broad peak (Ld), so x-ray criterion 2 is suf-ficient to establish phase coexistence. However, this crite-rion may also not be necessary; for example, in the case of Ld/Lo phase coexistence, only a single WAXS peak may be observed because the scattering from both phases is diffuseand overlapping. Because these two traditional x-ray criteria can give false negative diagnoses of phase coexistence, we previously developed a third x-ray criterion involving fitting
of I(φ) data (Mills et al. 2008b). Unfortunately, that third criterion is only applicable to liquid-liquid coexistence and should not be used on gel phases. In this section, we discuss our data and the literature with regard to the two traditional x-ray criteria and we introduce a fourth criterion.
Previous studies (Rand et al. 1980; Meyer et al. 1997) have reported two lamellar repeats (criterion 1) in Chol/DPPC mixtures, but for XChol = 0.03 to 0.10, much lower than the Vist and Davis coexistence region. In Chol/DPPC mixtures, we observed only a single lamellar repeat in both oriented and fully hydrated MLV samples. Engelman and Rothman (1972) reported two WAXS peaks in Chol/DPPC mixtures in the range of XChol = 0.20 to 0.33. In contrast, in oriented WAXS Chol/DPPC samples, we only observed a single WAXS peak. Therefore, in our hands, neither ofthe two traditional criteria was sufficient to predict phasecoexistence. Together with the observation of uniform fluorescence in microscopy images of GUVs (Feigenson andBuboltz 2001; Veatch and Keller 2005), one might conclude that there is no phase coexistence in Chol/DPPC mixtures at 25°C. However, neither of the traditional x-ray criteria is necessary, and the fluorescence microscopy can only con-clude that phase coexistence would occur on length scales smaller than microns.
As a possible reason for not observing two wide angle peaks, Hui and He (1983) noted that their samples were measured immediately after preparation, which may notallow sufficient time for a gel phase to form. However, weobserved no change in the WAXS pattern for a 0.15/0.85 Chol/DPPC sample after 3 days at high humidity, indicat-ing that insufficient equilibration time is not the reason wefail to observe two WAXS peaks in a region where other measurements suggest gel/fluid phase separation. Therefore,
10
Mills_Fig10 Figure 10. HWHM of the I(q) plot (intensity integrated over a φ = 5 to 10° range) is plotted versus temperature for 0.15/0.85 Chol/DPPC.
136 Mills et al.
our WAXS data are inconsistent with a fluid coexisting witha highly ordered gel phase. However, as pointed out previ-ously (Clarke et al. 2006), for a “disordered gel” phase in coexistence with an Lo phase, one might expect the WAXS data to overlap, as in the case of diffuse WAXS data fromtwo coexisting liquid phases.
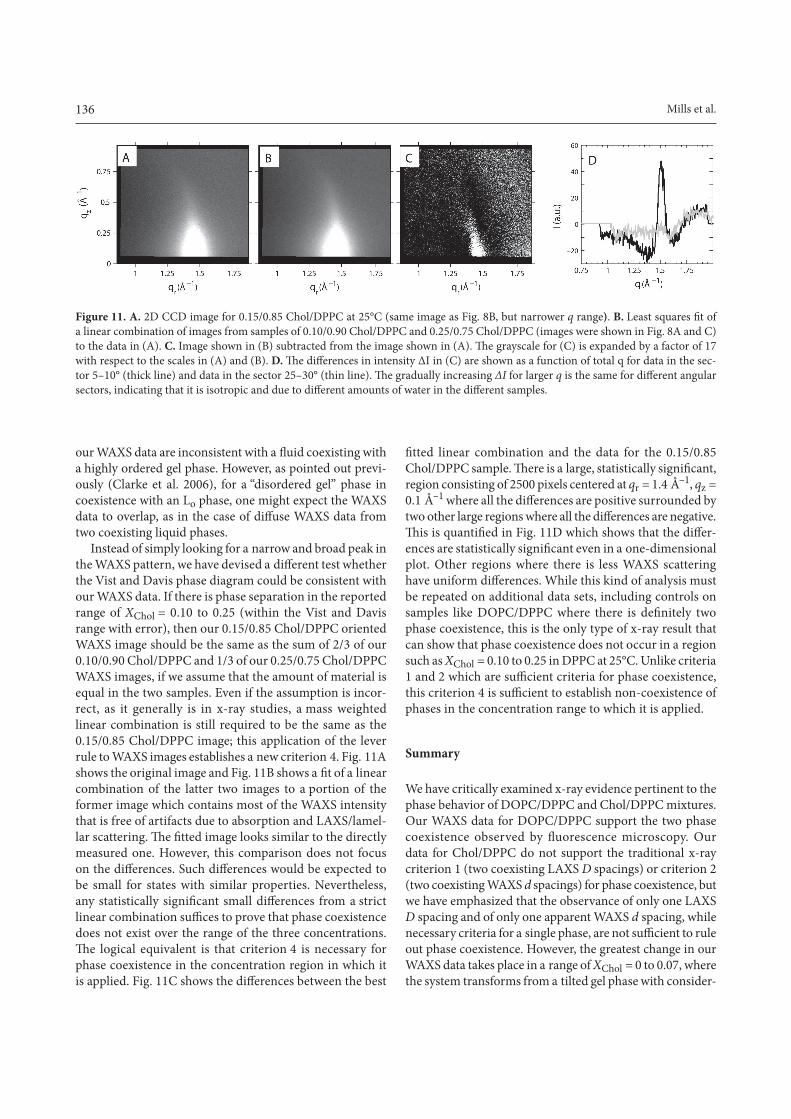
Instead of simply looking for a narrow and broad peak in the WAXS pattern, we have devised a different test whetherthe Vist and Davis phase diagram could be consistent with our WAXS data. If there is phase separation in the reported range of XChol = 0.10 to 0.25 (within the Vist and Davis range with error), then our 0.15/0.85 Chol/DPPC oriented WAXS image should be the same as the sum of 2/3 of our 0.10/0.90 Chol/DPPC and 1/3 of our 0.25/0.75 Chol/DPPC WAXS images, if we assume that the amount of material is equal in the two samples. Even if the assumption is incor-rect, as it generally is in x-ray studies, a mass weighted linear combination is still required to be the same as the 0.15/0.85 Chol/DPPC image; this application of the lever rule to WAXS images establishes a new criterion 4. Fig. 11A shows the original image and Fig. 11B shows a fit of a linearcombination of the latter two images to a portion of the former image which contains most of the WAXS intensity that is free of artifacts due to absorption and LAXS/lamel-lar scattering. The fitted image looks similar to the directlymeasured one. However, this comparison does not focus on the differences. Such differences would be expected tobe small for states with similar properties. Nevertheless, any statistically significant small differences from a strictlinear combination suffices to prove that phase coexistencedoes not exist over the range of the three concentrations. The logical equivalent is that criterion 4 is necessary forphase coexistence in the concentration region in which it is applied. Fig. 11C shows the differences between the best
fitted linear combination and the data for the 0.15/0.85Chol/DPPC sample. There is a large, statistically significant,region consisting of 2500 pixels centered at qr = 1.4 Å–1, qz = 0.1 Å–1 where all the differences are positive surrounded bytwo other large regions where all the differences are negative.This is quantified in Fig. 11D which shows that the differ-ences are statistically significant even in a one-dimensionalplot. Other regions where there is less WAXS scattering have uniform differences. While this kind of analysis mustbe repeated on additional data sets, including controls on samples like DOPC/DPPC where there is definitely twophase coexistence, this is the only type of x-ray result that can show that phase coexistence does not occur in a region such as XChol = 0.10 to 0.25 in DPPC at 25°C. Unlike criteria 1 and 2 which are sufficient criteria for phase coexistence,this criterion 4 is sufficient to establish non-coexistence ofphases in the concentration range to which it is applied.
Summary
We have critically examined x-ray evidence pertinent to the phase behavior of DOPC/DPPC and Chol/DPPC mixtures. Our WAXS data for DOPC/DPPC support the two phase coexistence observed by fluorescence microscopy. Ourdata for Chol/DPPC do not support the traditional x-ray criterion 1 (two coexisting LAXS D spacings) or criterion 2 (two coexisting WAXS d spacings) for phase coexistence, but we have emphasized that the observance of only one LAXS D spacing and of only one apparent WAXS d spacing, while necessary criteria for a single phase, are not sufficient to ruleout phase coexistence. However, the greatest change in our WAXS data takes place in a range of XChol = 0 to 0.07, where the system transforms from a tilted gel phase with consider-
11
Mills_Fig11 Figure 11. A. 2D CCD image for 0.15/0.85 Chol/DPPC at 25°C (same image as Fig. 8B, but narrower q range). B. Least squares fit ofa linear combination of images from samples of 0.10/0.90 Chol/DPPC and 0.25/0.75 Chol/DPPC (images were shown in Fig. 8A and C) to the data in (A). C. Image shown in (B) subtracted from the image shown in (A). The grayscale for (C) is expanded by a factor of 17with respect to the scales in (A) and (B). D. The differences in intensity ∆I in (C) are shown as a function of total q for data in the sec-tor 5–10° (thick line) and data in the sector 25–30° (thin line). The gradually increasing ∆I for larger q is the same for different angularsectors, indicating that it is isotropic and due to different amounts of water in the different samples.

137Cholesterol and DOPC perturb gel-phase DPPC
able short range order to a more disordered, untilted solid state. For XChol > 0.07 the changes in the WAXS data are much smaller. In contrast, phase diagrams in the literature predict phase coexistence in Chol concentration ranges with a minimum value greater than XChol = 0.07. We have intro-duced a new criterion 4 that involves global comparison of WAXS data at three concentrations. At this time, our result using criterion 4 implies that phase coexistence does not encompass the concentration range from XChol = 0.10 to 0.25 in Chol/DPPC mixtures at 25°C, and this result is consistent with the traditional, but inconclusive, criteria 1 and 2.
Acknowledgements. J. F. Nagle. appreciates being asked to contribute a paper to honor Prof. Pavol Balgavy, and to partially repay him for sending his former student Dr. Norbert Kučerka to be a postdoc in our lab. We acknowledge Prof. Stephanie Tristram-Nagle for help with experiments and analysis. T. T. Mills thanks Dr. Gilman Toombes for discussions and Dr. Mark Tate for help with those rotating anode experiments on unoriented samples that were performed at the Cor-nell facility, supported by Department of Energy award DE-FG02-97ER62443 to Prof. Sol Gruner. We acknowledge beamline support from Dr. Detlef-M. Smilgies and use of beam time at CHESS which is supported by the National Science Foundation and the National Insti-tutes of Health/National Institute of General Medical Sciences under NSF award DMR-0225180. Thisworkwassupportedbygrants fromtheNational Institutes of Health (GM 44976) to J. F. Nagle and the National Science Foundation (MCB-0315330) to G. W. Feigenson. T. T. Mills was supported in part by NIH research award (1-T32-GM08267).
References
Almeida P. F. F., Vaz W. L. C., Thompson T. E. (1993): Percolationand diffusion in three-component lipid bilayers: effect ofcholesterol on an equimolar mixture of two phosphati-dylcholines. Biophys. J. 64, 399–412; doi:10.1016/S0006-3495(93)81381-X
Bloom M., Thewalt J. L. (1995): Time and distance scales of mem-brane domain organization. Mol. Membr. Biol. 12, 9–13; doi:10.3109/09687689509038489
Chen L., Yu Z. W., Quinn P. J. (2007): The partition of choles-terol between ordered and fluid bilayers of phosphati-dylcholine: a synchrotron x-ray diffraction study.Biochim. Biophys. Acta 1768, 2873–2881; doi:10.1016/j.bbamem.2007.07.023
Clarke J. A., Heron A. J., Seddon J. M., Law R. V. (2006): Thediversity of the liquid ordered (Lo) phase of phos-phatidylcholine/cholesterol membranes: a variable temperature multinuclear solid-state NMR and x-ray diffraction study. Biophys. J. 90, 2383–2393; doi:10.1529/biophysj.104.056499
Edholm O., Nagle J. F. (2005): Areas of molecules in membranes consisting of mixtures. Biophys. J. 89, 1827–1832; doi:10.1529/biophysj.105.064329
Engelman D. M., Rothman J. E. (1972): The planar organiza-tion of lecithin-cholesterol bilayers. J. Biol. Chem. 247, 3694–3697
Feigenson G. W., Buboltz J. T. (2001): Ternary phase diagram of dipalmitoyl-PC/dilauroyl-PC/cholesterol: nanoscopic domain formation driven by cholesterol. Biophys. J. 80, 2775–2788; doi:10.1016/S0006-3495(01)76245-5
Finean J. B. (1990): Interaction between cholesterol and phospholi-pid in hydrated bilayers. Chem. Phys. Lipids 54, 147–156; doi:10.1016/0009-3084(90)90008-F
Finegold L. (1993): Cholesterol in Membrane Models. CRC Press, Boca Raton
Gallová J., Uhríková D., Islamov A., Kuklin A., Balgavý P. (2004): Effect of cholesterol on the bilayer thickness in unila-mellar extruded DLPC and DOPC liposomes: SANS contrast variation study. Gen. Physiol. Biophys. 23, 113–128
Greenwood A. I., Tristram-Nagle S., Nagle J. F. (2006): Partial mo-lecular volumes of lipids and cholesterol. Chem. Phys. Li-pids 143, 1–10; doi:10.1016/j.chemphyslip.2006.04.002
Heerklotz H., Tsamaloukas A. (2006): Gradual change or phase transition: characterizing fluid lipid-cholesterol mem-branes on the basis of thermal volume changes. Biophys. J. 91, 600–607; doi:10.1529/biophysj.106.082669
Hsueh Y.-W. Gilbert K., Trandum C., Zuckermann M., ThewaltJ. (2005): The effect of ergosterol on dipalmitoylphos-phatidylcholine bilayers: a deuterium NMR and ca-lorimetric study. Biophys. J. 88, 1799–1808; doi:10.1529/biophysj.104.051375
Huang J. Y., Feigenson G. W. (1999): A microscopic interaction model of maximum solubility of cholesterol in lipid bilayers. Biophys. J. 76, 2142–2157; doi:10.1016/S0006-3495(99)77369-8
Huang J. Y., Buboltz J. T., Feigenson G. W. (1999): Maximum solubil-ity of cholesterol in phosphatidylcholine and phosphati-dylethanolamine bilayers. Biochim. Biophys. Acta 1417, 89–100; doi:10.1016/S0005-2736(98)00260-0
Huang T. H., Lee C. W., Das Gupta S. K., Blume A., Griffin R.G. (1993): A 13C and 2H nuclear magnetic resonance study of phosphatidylcholine/cholesterol interactions: characterization of liquid-gel phases. Biochemistry 32, 13277–13287; doi:10.1021/bi00211a041
Hui S. W., He N. B. (1983): Molecular organization in choles-terol-lecithin bilayers by x-ray and electron diffractionmeasurements. Biochemistry 22, 1159–1164; doi:10.1021/bi00274a026
Ipsen J. H., Karlström G., Mouritsen O. G., Wennerström H., Zuck-ermann M. J. (1987): Phase equilibria in the phosphatidyl-choline-cholesterol system. Biochim. Biophys. Acta 905, 162–172; doi:10.1016/0005-2736(87)90020-4
Jacobs R., Oldfield E. (1979): Deuterium nuclear magnetic reso-nance investigation of dimyristoyllecithin-dipalmitoyl-lecithin and dimyristoyllecithin-cholesterol mixtures. Biochemistry 18, 3280–3285; doi:10.1021/bi00582a013
Janiak M. J., Small D. M., Shipley G. G. (1976): Nature of the thermal pretransition of synthetic phospholipids: dimyristoyl- and dipalmitoyllecithin. Biochemistry 15, 4575–4580; doi:10.1021/bi00666a005
Karmakar S., Raghunathan V. A. (2003): Cholesterol-induced modulated phase in phospholipid membranes. Phys. Rev. Lett. 91, 098102; doi:10.1103/PhysRevLett.91.098102

138 Mills et al.
Karmakar S., Sarangi B. R., Raghunathan V. A. (2006): Phase behaviour of lipid-cholesterol membranes. Solid State Commun. 139, 630–634; doi:10.1016/j.ssc.2006.05.045
Kingsley P. B., Feigenson G. W. (1979): Synthesis of a perdeu-terated phospholipid: 1,2-dimyristoyl-sn-glycero-3-phosphocholine-d72. Chem. Phys. Lipids 24, 135–147; doi:10.1016/0009-3084(79)90083-5
Krivanek R., Okoro L., Winter R. (2008): Effect of cholesterol andergosterol on the compressibility and volume fluctuationsof phospholipid-sterol bilayers in the critical point region: a molecular acoustic and calorimetric study. Biophys. J. 94, 3538–3548; doi:10.1529/biophysj.107.122549
Kučerka N., Liu Y. F., Chu N. J., Petrache H. I., Tristram-Nagle S., Nagle J. F. (2005): Structure of fully hydrated fluid phaseDMPC and DLPC lipid bilayers using x-ray scattering from oriented multilamellar arrays and from unilamel-lar vesicles. Biophys. J. 88, 2626–2637; doi:10.1529/biophysj.104.056606
Kučerka N., Perlmutter J. D., Pan J., Tristram-Nagle S., Kat-saras J., Sachs J. N. (2008): The effect of cholesterol onshort- and long-chain monounsaturated lipid bilayers as determined by molecular dynamics simulations and x-ray scattering. Biophys. J. 95, 2792–2805; doi:10.1529/biophysj.107.122465
Ladbrooke B. D., Williams R. M., Chapman D. (1968): Stud-ies on lecithin-cholesterol-water interactions by dif-ferential scanning calorimetry and x-ray diffraction.Biochim. Biophys. Acta 150, 333–340; doi:10.1016/0005-2736(68)90132-6
Lemmich J., Mortensen K., Ipsen J. H., Hønger T., Bauer R., Mouritsen O. G. (1997): The effect of cholesterol insmall amounts on lipid-bilayer softness in the region ofthe main phase transition. Eur. Biophys. J. 25, 293–304; doi:10.1007/s002490050041
Lentz B. R., Barenholz Y., Thompson T. E. (1976): Fluorescencedepolarization studies of phase transitions and fluidityin phospholipid bilayers. 2. Two-component phosphati-dylcholine liposomes. Biochemistry 15, 4529–4537; doi:10.1021/bi00665a030
Levine Y. K., Wilkins M. H. F. (1971): Structure of oriented lipid bilayers. Nature New Biol. 230, 69–72
Li L., Cheng J.-X. (2006): Coexisting stripe- and patch-shaped domains in giant unilamellar vesicles. Biochemistry 45, 11819–11826; doi:10.1021/bi060808h
Lindblom G., Johansson L. B.-A., Arvidson G. (1981): Effect ofcholesterol in membranes. Pulsed nuclear magnetic resonance measurements of lipid lateral diffusion. Bio-chemistry 20, 2204–2207; doi:10.1021/bi00511a020
Mabrey S., Mateo P. L., Sturtevant J. M. (1978): High-sensitivity scanning calorimetric study of mixtures of cholesterol with dimyristoyl- and dipalmitoylphosphatidylcholines. Biochemistry 17, 2464–2468; doi:10.1021/bi00605a034
Mathai J. C., Tristram-Nagle S., Nagle J. F., Zeidel M. L. (2008): Structural determinants of water permeability through the lipid membrane. J. Gen. Physiol. 131, 69–76; doi:10.1085/jgp.200709848
McConnell H., Radhakrishnan A. (2006): Theory of the deute-rium NMR of sterol-phospholipid membranes. Proc.
Natl. Acad. Sci. U.S.A. 103, 1184–1189; doi:10.1073/pnas.0510514103
McIntosh T. J. (1978): The effect of cholesterol on the structure ofphosphatidylcholine bilayers. Biochim. Biophys. Acta 513, 43–58; doi:10.1016/0005-2736(78)90110-4
McIntosh T. J. (1980): Differences in hydrocarbon chain tiltbetween hydrated phosphatidylethanolamine and phosphatidylcholine bilayers: a molecular packing model. Biophys. J. 29, 237–246; doi:10.1016/S0006-3495(80)85128-9
McMullen T. P., McElhaney R. N. (1995): New aspects of the interac-tion of cholesterol with dipalmitoylphosphatidylcholine bilayers as revealed by high-sensitivity differential scan-ning calorimetry. Biochim. Biophys. Acta 1234, 90–98; doi:10.1016/0005-2736(94)00266-R
Melchior D. L., Scavitto F. J., Steim J. M. (1980): Dilatometry of dipalmitoyllecithin-cholesterol bilayers. Biochemistry 19, 4828–4834; doi:10.1021/bi00562a018
Mermin N. D., Wagner H. (1966): Absence of ferromagnetism or antiferromagnetism in one- or two-dimensional isotropic Heisenberg models. Physiol. Rev. Lett. 17, 1133–1136; doi:10.1103/PhysRevLett.17.1133
Mermin N. D. (1968): Crystalline order in two dimensions. Physiol. Rev. 176, 250–254; doi:10.1103/PhysRev.176.250
Meyer H. W., Semmler K., Quinn P. J. (1997): The effect of sterolson structures formed in the gel/subgel phase state of di-palmitoylphosphatidylcholine bilayers. Mol. Membr. Biol. 14, 187–193; doi:10.3109/09687689709048181
Mills T. T., Toombes G. E. S., Tristram-Nagle S., Smilgies D.-M., Feigenson G. W., Nagle J. F. (2008a): Order parameters and areas in fluid-phase oriented lipid membranes us-ing wide angle x-ray scattering. Biophys. J. 95, 669–681; doi:10.1529/biophysj.107.127845
Mills T. T., Tristram-Nagle S., Heberle F. A., Morales N. F., Zhao J., Wu J., Toombes G. E. S., Nagle J. F., Feigenson G. W. (2008b): Liquid-liquid domains in bilayers detected by wide angle x-ray scattering. Biophys. J. 95, 682–690; doi:10.1529/biophysj.107.127910
Needham D., McIntosh T. J., Evans E. (1988): Thermomechanicaland transition properties of dimyristoylphosphatidylcho-line/cholesterol bilayers. Biochemistry 27, 4668–4673; doi:10.1021/bi00413a013
Petrache H. I., Harries D., Parsegian V. A. (2005): Alteration of lipid membrane rigidity by cholesterol and its metabolic precursors. Macromol. Symp. 219, 39–50; doi:10.1002/masy.200550105
Rand R. P., Parsegian V. A., Henry J. A., Lis L. J., McAlister M. (1980): The effect of cholesterol on measured interactionand compressibility of dipalmitoylphosphatidylcholine bilayers. Can. J. Biochem. 58, 959–968
Richter F., Rapp G., Finegold L. (2001): Miscibility gap in fluiddimyristoylphosphatidylcholine: cholesterol as “seen” by x-rays. Phys. Rev. E 63, 051914; doi:10.1103/PhysRevE.63.051914
Rubenstein J. L. R., Smith B. A., McConnell H. M. (1979): Lateral diffusion in binary mixtures of cholesterol and phos-phatidylcholines. Proc. Natl. Acad. Sci. U.S.A. 76, 15–18; doi:10.1073/pnas.76.1.15

139Cholesterol and DOPC perturb gel-phase DPPC
Sankaram M. B., Thompson T. E. (1990): Modulation of phos-pholipid acyl chain order by cholesterol. A solid-state 2H nuclear magnetic resonance study. Biochemistry 29, 10676-10684; doi:10.1021/bi00499a015
Scheidt H. A., Huster D., Gawrisch K. (2005): Diffusion ofcholesterol and its precursors in lipid membranes studied by 1H pulsed field gradient magic angle spin-ning NMR. Biophys. J. 89, 2504–2512; doi:10.1529/biophysj.105.062018
Smith G. S., Sirota E. B., Safinya C. R., Plano R. J., Clark N. A. (1990):X-ray structural studies of freely suspended ordered hy-drated DMPC multimembrane films. J. Chem. Phys. 92, 4519–4529; doi:10.1063/1.457764
Sun W. J., Suter R. M., Knewtson M. A., Worthington C. R., Tristram-Nagle S., Zhang R., Nagle J. F. (1994): Order and disorder in fully hydrated unoriented bilayers of gel phase dipalmitoylphosphatidylcholine. Phys. Rev. E 49, 4665–4676; doi:10.1103/PhysRevE.49.4665
Tardieu A., Luzzati V., Reman F. C. (1973): Structure and poly-morphism of the hydrocarbon chains of lipids: a study of lecithin-water phases. J. Mol. Biol. 75, 711–733; doi:10.1016/0022-2836(73)90303-3
Tate M. W., Gruner S. M., Eikenberry E. F. (1997): Coupling format variations in x-ray detectors based on charge coupled devices. Rev. Sci. Instrum. 68, 47–54; doi:10.1063/1.1147611
Tristram-Nagle S., Zhang R., Suter R. M., Worthington C. R., Sun W. J., Nagle J. F. (1993): Measurement of chain tilt angle in fully hydrated bilayers of gel phase leci-thins. Biophys. J. 64, 1097–1109; doi:10.1016/S0006-3495(93)81475-9
Tristram-Nagle S., Liu Y. F., Legleiter J., Nagle J. F. (2002): Struc-ture of gel phase DMPC determined by x-ray diffrac-
tion. Biophys. J. 83, 3324–3335; doi:10.1016/S0006-3495(02)75333-2
Tristram-Nagle S. (2007): Preparation of oriented, fully hydrated lipid samples for structure determination using x-ray scattering. In: Methods in Membrane Lipids. (Ed. A. M. Dopico), pp. 63–75, Humana Press, Totowa; doi:10.1385/1-59745-519-9:63
Veatch S. L., Keller S. L. (2003): Separation of liquid phases in giant vesicles of ternary mixtures of phospholipids and cho-lesterol. Biophys. J. 85, 3074–3083; doi:10.1016/S0006-3495(03)74726-2
Veatch S. L., Keller S. L. (2005): Seeing spots: complex phase behav-ior in simple membranes. Biochim. Biophys. Acta 1746, 172–185; doi:10.1016/j.bbamcr.2005.06.010
Veatch S. L., Gawrisch K., Keller S. L. (2006): Closed-loop miscibil-ity gap and quantitative tie-lines in ternary membranes containing diphytanoyl PC. Biophys. J. 90, 4428–4436; doi:10.1529/biophysj.105.080283
Vist M. R., Davis J. H. (1990): Phase equilibria of cholesterol/di-palmitoylphosphatidylcholine mixtures: 2H nuclear magnetic resonance and differential scanning calorimetry.Biochemistry 29, 451–464; doi:10.1021/bi00454a021
Yeagle P. L. (1985): Cholesterol and the cell membrane. Biochim. Biophys. Acta 822, 267–287
Zhao J., Wu J., Heberle F. A., Mills T. T., Klawitter P., Huang G., Costanza G., Feigenson G. W. (2007): Phase studies of model biomembranes: complex behavior of DSPC/DOPC/Chol. Biochim. Biophys. Acta 1768, 2764–2776; doi:10.1016/j.bbamem.2007.07.008
Received: October 6, 2008Final version accepted: February 4, 2009