educator preparation performance report ... - ade data … · educator preparation performance...
TRANSCRIPT
1
2015 Educator Preparation Performance Report
Arkansas
Arkansas Educator Preparation Performance Report
Table of Contents
I. Introduction ......................................................................................................................................................................................................................................... 2
II. Enrollment and Demographic Data ................................................................................................................................................................................................ 6
III. Program Completers from Arkansas EPPs ................................................................................................................................................................................. 9
IV. Three-year Average Number of Teachers Prepared By Subject Area ................................................................................................................................. 12
V. Number of Program Completers Working in Arkansas Public Schools (first-year) .............................................................................................................. 15
VI. Supervised Clinical Experience and Faculty Numbers............................................................................................................................................................ 17
VII. Praxis® Licensure Test Pass Rates ........................................................................................................................................................................................... 19
VIII. Praxis® Licensure Test Summary Pass Rates ....................................................................................................................................................................... 38
IX Surveys of Novice Teacher Perceptions of Preparation .......................................................................................................................................................... 40
X. Glossary ........................................................................................................................................................................................................................................... 45
2
2015 Educator Preparation Performance Report
Arkansas
I. Introduction
Highly effective teachers and principals are paramount to producing college and career ready learners. To continuously improve the quality of the state’s educator preparation providers (EPP), the Arkansas Department of Education (ADE) is working collaboratively with the institutions of higher education (IHE) and the Arkansas Department of Higher Education (ADHE) to report data through Educator Preparation Performance Report (EPPR). The intent of the report is two-fold: 1) to report information on enrollees and graduates at the institutions and 2) to report demographic and statistical data to inform policy decisions. The commitment of EPPs to providing accurate, relevant data in a timely manner demonstrates their dedication and contribution to the success of this effort. All parties involved share an interest in preparing the best possible educators to provide a quality education to all Arkansas students. Identification of the metrics and the report format were developed in collaboration with a representative committee from all Arkansas EPPs (Table 1). Table 1. Arkansas EPPs
EPP IHE Type Program Type EPP IHE Type Program Type
AR Prof. Pathway to Ed. Licensure (APPEL) Public Nontraditional Southern Arkansas University (SAU) Public Both
Arkansas State University (ASU) Public Both Teach For America – AR (TFA) Public Nontraditional
Arkansas Tech University (ATU) Public Both U of A – Fayetteville (UAF) Public Traditional
Central Baptist College (CBC) Independent Traditional U of A - Fort Smith (UAFS) Public Traditional
Harding University (HU) Independent Both U of A - Little Rock (UALR) Public Both
Henderson State University (HSU) Public Both U of A – Monticello (UAM) Public Both
Hendrix College (HC) Independent Traditional U of A - Pine Bluff (UAPB) Public Both
John Brown University (JBU) Independent Traditional University of Central Arkansas (UCA) Public Both
Lyon College (LC) Independent Traditional University of The Ozarks (UO) Independent Traditional
Ouachita Baptist University (OBU) Independent Traditional Williams Baptist College (WBC) Independent Traditional
Philander Smith College (PSC) Independent Traditional
The abbreviations above are utilized throughout this document.
3
2015 Educator Preparation Performance Report
Arkansas
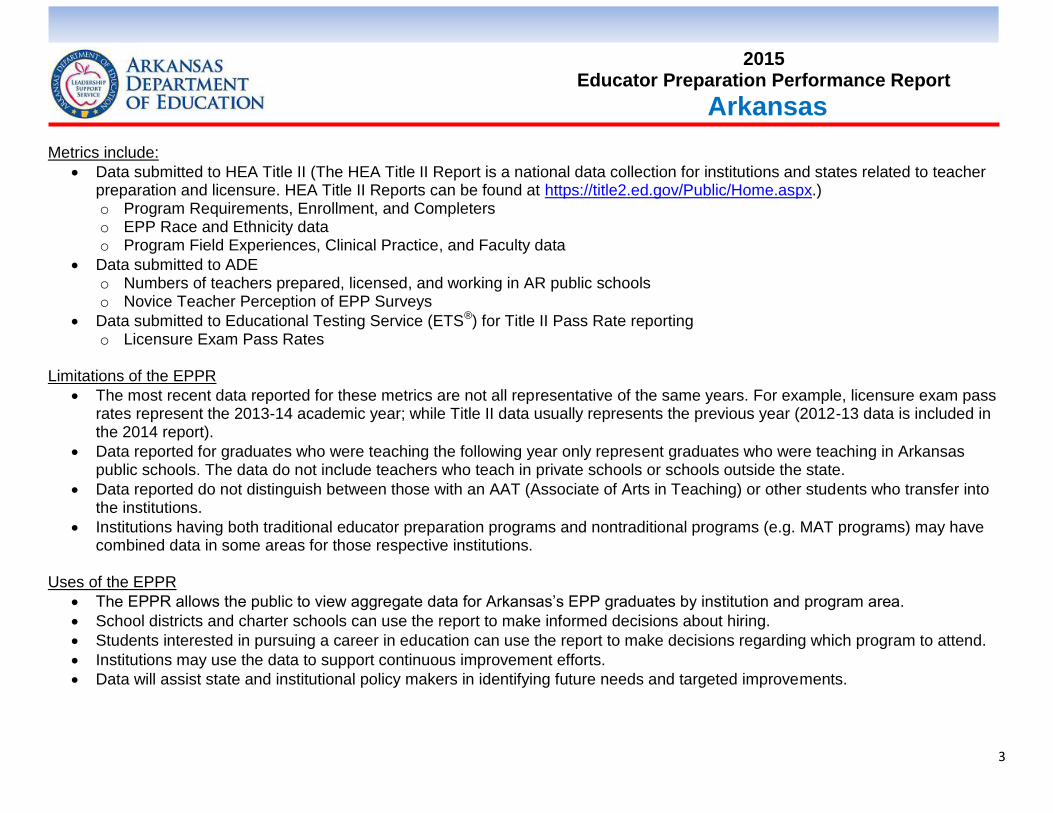
Metrics include:
Data submitted to HEA Title II (The HEA Title II Report is a national data collection for institutions and states related to teacher preparation and licensure. HEA Title II Reports can be found at https://title2.ed.gov/Public/Home.aspx.) o Program Requirements, Enrollment, and Completers o EPP Race and Ethnicity data o Program Field Experiences, Clinical Practice, and Faculty data
Data submitted to ADE o Numbers of teachers prepared, licensed, and working in AR public schools o Novice Teacher Perception of EPP Surveys
Data submitted to Educational Testing Service (ETS®) for Title II Pass Rate reporting o Licensure Exam Pass Rates
Limitations of the EPPR
The most recent data reported for these metrics are not all representative of the same years. For example, licensure exam pass rates represent the 2013-14 academic year; while Title II data usually represents the previous year (2012-13 data is included in the 2014 report).
Data reported for graduates who were teaching the following year only represent graduates who were teaching in Arkansas public schools. The data do not include teachers who teach in private schools or schools outside the state.
Data reported do not distinguish between those with an AAT (Associate of Arts in Teaching) or other students who transfer into the institutions.
Institutions having both traditional educator preparation programs and nontraditional programs (e.g. MAT programs) may have combined data in some areas for those respective institutions.
Uses of the EPPR
The EPPR allows the public to view aggregate data for Arkansas’s EPP graduates by institution and program area.
School districts and charter schools can use the report to make informed decisions about hiring.
Students interested in pursuing a career in education can use the report to make decisions regarding which program to attend.
Institutions may use the data to support continuous improvement efforts.
Data will assist state and institutional policy makers in identifying future needs and targeted improvements.

4
2015 Educator Preparation Performance Report
Arkansas
Arkansas Public Schools (APS) employ over 2,000 new teachers each year. Table 2 demonstrates that many teachers return and continue to teach, but some do not. Since 2005 approximately 14 percent of new teachers do not return to APS after one (1) year of teaching. Twenty-eight percent do not return after three (3) years, and 34 percent are lost after five (5) years. These state numbers are far below the often-reported national average of 50% after five (5) years; however, the ADE is committed to keeping as many effective teachers in classrooms as possible. Table 2. Teacher Attrition
Year # New
Teachers # attrition after
1 year % attrition after
1 year # attrition
after 3 years % attrition after
3 years # attrition
after 5 years % attrition after
5 years
2005-06 2,304 148 6.42% 589 25.56% 757 32.86%
2006-07 2,504 173 6.91% 613 24.48% 798 31.87%
2007-08 2,507 342 13.64% 672 26.80% 861 34.34%
2008-09 2,284 326 14.27% 641 28.06% 798 34.94%
2009-10 2,413 326 13.51% 728 30.17% 961 39.83%
2010-11 2,266 343 15.14% 709 31.29%
2011-12 2,432 403 16.57% 849 34.91%
2012-13 2,959 697 23.56%
2013-14 2,937 469 15.97%
2014-15 3,524
1-yr attrition (2005-2014)
22,606 3227 Avg = 14.27%
3-yr attrition (2005-2012)
16,710
4801 Avg = 28.73%
5-yr attrition (2005-2010)
12,012
4175 Avg = 34.76%
1-yr attrition = the average % of teachers not returning in Arkansas Public Schools after one year 3-yr attrition = the average % of teachers not returning in Arkansas Public Schools after three years 5-yr attrition = the average % of teachers not returning in Arkansas Public Schools after five years Source: ADE Data Administration

5
2015 Educator Preparation Performance Report
Arkansas
Another issue that requires attention is teacher licensure shortage areas. Currently the state has identified shortage areas in first-time license areas of Art, Foreign Language (FL), Drama/Speech, Family & Consumer Science (F&CS), and Mathematics. Examining these data annually will help the state to address areas of need. Figure 1 is an example of some changes that are evident as a result of efforts to address shortage areas. Although it is not the only factor involved, increasing the numbers of teachers prepared in these areas over time is surely a step in the right direction. Figure 1. Number prepared by AR EPPs over 3 years in 5 shortage areas
Source: HEA Title II Reports – 2012, 2013, 2014
0
20
40
60
80
100
120
140
160
2012 2013 2014
Art
FL
Drama/Speech
F&CS
Math
6
2015 Educator Preparation Performance Report
Arkansas
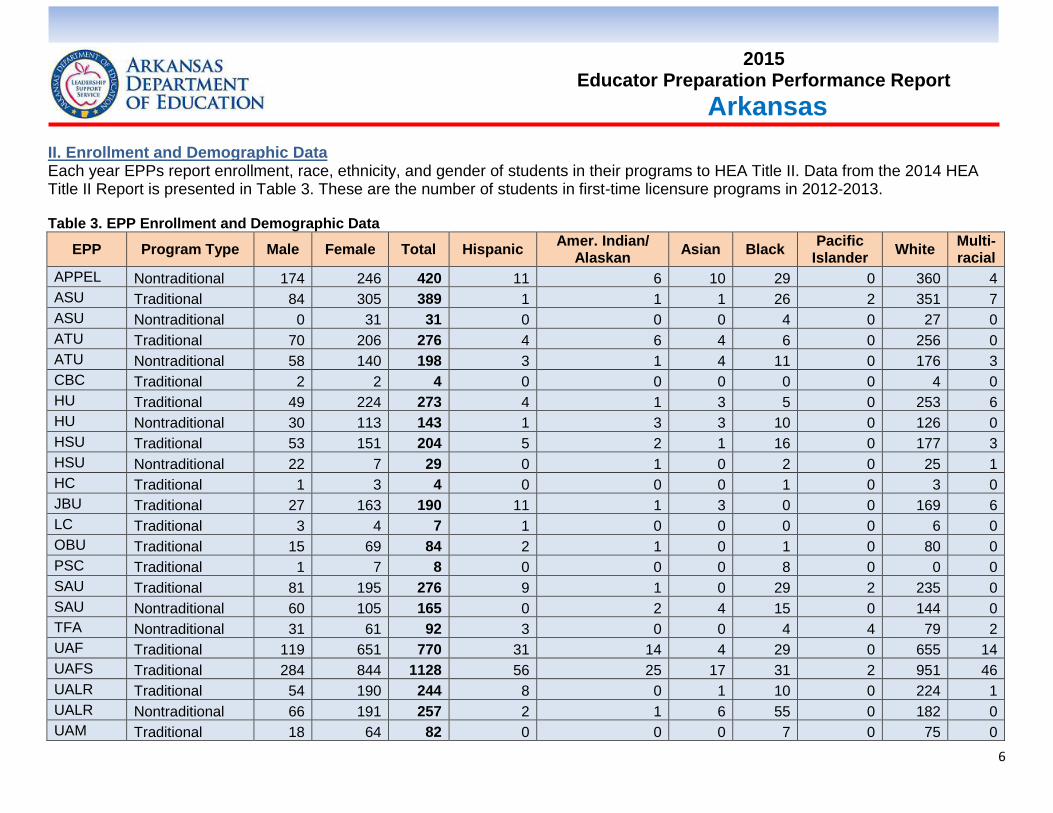
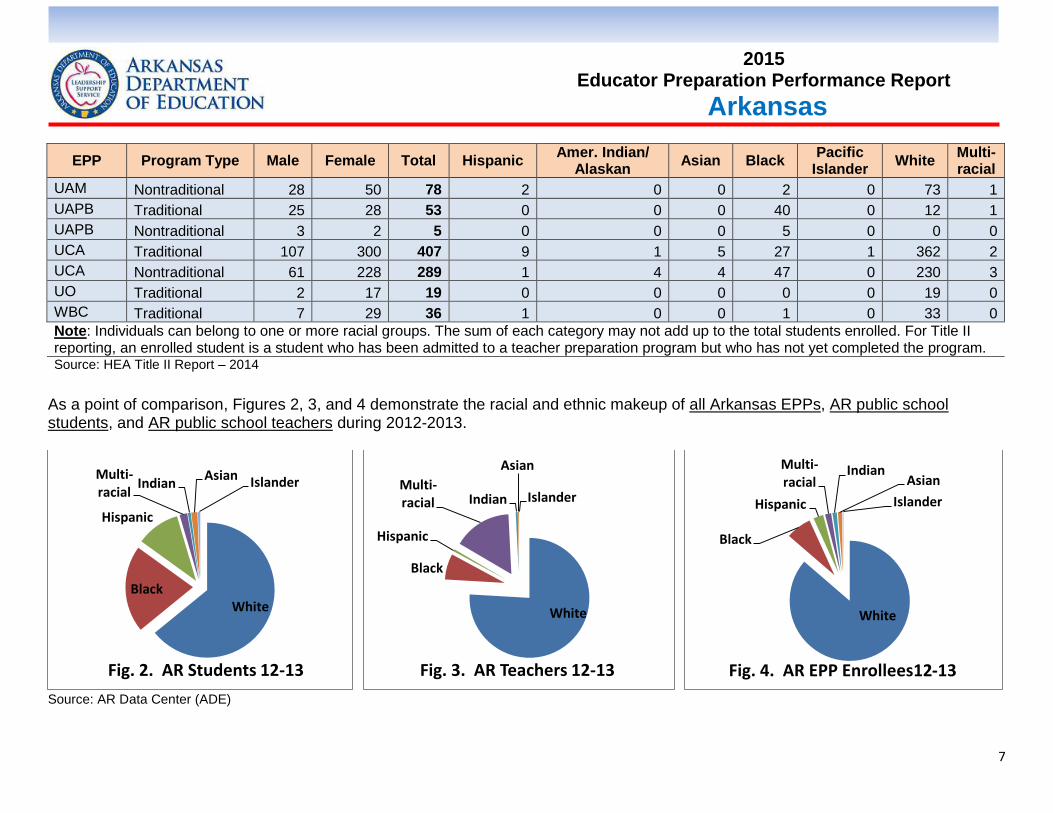
II. Enrollment and Demographic Data Each year EPPs report enrollment, race, ethnicity, and gender of students in their programs to HEA Title II. Data from the 2014 HEA Title II Report is presented in Table 3. These are the number of students in first-time licensure programs in 2012-2013. Table 3. EPP Enrollment and Demographic Data
EPP Program Type Male Female Total Hispanic Amer. Indian/
Alaskan Asian Black
Pacific Islander
White Multi-racial
APPEL Nontraditional 174 246 420 11 6 10 29 0 360 4
ASU Traditional 84 305 389 1 1 1 26 2 351 7
ASU Nontraditional 0 31 31 0 0 0 4 0 27 0
ATU Traditional 70 206 276 4 6 4 6 0 256 0
ATU Nontraditional 58 140 198 3 1 4 11 0 176 3
CBC Traditional 2 2 4 0 0 0 0 0 4 0
HU Traditional 49 224 273 4 1 3 5 0 253 6
HU Nontraditional 30 113 143 1 3 3 10 0 126 0
HSU Traditional 53 151 204 5 2 1 16 0 177 3
HSU Nontraditional 22 7 29 0 1 0 2 0 25 1
HC Traditional 1 3 4 0 0 0 1 0 3 0
JBU Traditional 27 163 190 11 1 3 0 0 169 6
LC Traditional 3 4 7 1 0 0 0 0 6 0
OBU Traditional 15 69 84 2 1 0 1 0 80 0
PSC Traditional 1 7 8 0 0 0 8 0 0 0
SAU Traditional 81 195 276 9 1 0 29 2 235 0
SAU Nontraditional 60 105 165 0 2 4 15 0 144 0
TFA Nontraditional 31 61 92 3 0 0 4 4 79 2
UAF Traditional 119 651 770 31 14 4 29 0 655 14
UAFS Traditional 284 844 1128 56 25 17 31 2 951 46
UALR Traditional 54 190 244 8 0 1 10 0 224 1
UALR Nontraditional 66 191 257 2 1 6 55 0 182 0
UAM Traditional 18 64 82 0 0 0 7 0 75 0
7
2015 Educator Preparation Performance Report
Arkansas
EPP Program Type Male Female Total Hispanic Amer. Indian/
Alaskan Asian Black
Pacific Islander
White Multi-racial
UAM Nontraditional 28 50 78 2 0 0 2 0 73 1
UAPB Traditional 25 28 53 0 0 0 40 0 12 1
UAPB Nontraditional 3 2 5 0 0 0 5 0 0 0
UCA Traditional 107 300 407 9 1 5 27 1 362 2
UCA Nontraditional 61 228 289 1 4 4 47 0 230 3
UO Traditional 2 17 19 0 0 0 0 0 19 0
WBC Traditional 7 29 36 1 0 0 1 0 33 0
Note: Individuals can belong to one or more racial groups. The sum of each category may not add up to the total students enrolled. For Title II reporting, an enrolled student is a student who has been admitted to a teacher preparation program but who has not yet completed the program. Source: HEA Title II Report – 2014
As a point of comparison, Figures 2, 3, and 4 demonstrate the racial and ethnic makeup of all Arkansas EPPs, AR public school students, and AR public school teachers during 2012-2013.
Source: AR Data Center (ADE)
White Black
Hispanic
Multi-racial
Indian Asian Islander
Fig. 2. AR Students 12-13
White
Black
Hispanic
Multi-racial Indian
Asian
Islander
Fig. 3. AR Teachers 12-13
White
Black
Hispanic
Multi-racial
Indian Asian
Islander
Fig. 4. AR EPP Enrollees12-13

8
2015 Educator Preparation Performance Report
Arkansas
The following figures represent the numbers of students enrolled in educator preparation programs in Arkansas institutions. Figure 5 reflects all EPPS. Figure 6 compares public and independent institutions, and Figure 7 compares traditional and nontraditional routes.
8255
6741 6925
7758
6161
0
2000
4000
6000
8000
10000
2010 2011 2012 2013 2014
All AR EPPs
Figure 5. EPP Enrollment - 5 years
7429 6072
6202 6974
5393
826 669 723 784 768
0
2000
4000
6000
8000
2010 2011 2012 2013 2014
Figure 6. Enrollment by IHE Type
Public EPPS Independent EPPs
7067
5230 5002 5668
4454
1188 1511 1923 2090
1707
0
2000
4000
6000
8000
2010 2011 2012 2013 2014
Figure 7. Enrollment by Program Type
Traditional EPPs Nontraditional EPPs
9
2015 Educator Preparation Performance Report
Arkansas
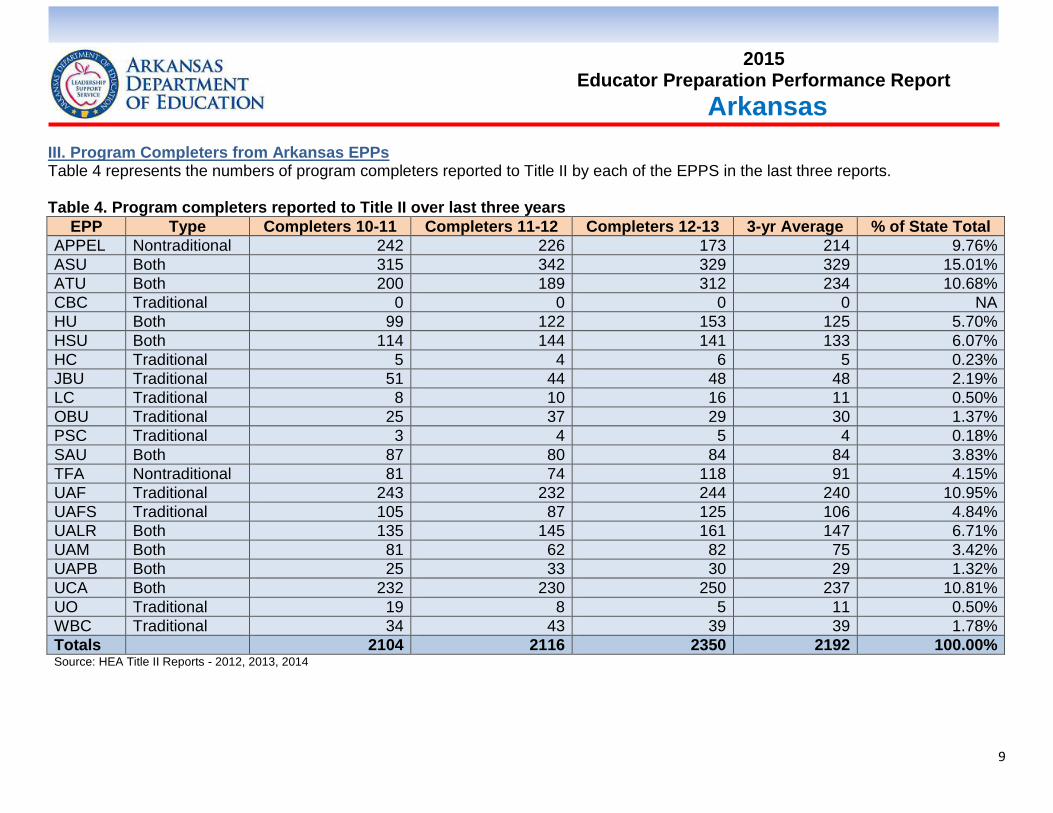
III. Program Completers from Arkansas EPPs Table 4 represents the numbers of program completers reported to Title II by each of the EPPS in the last three reports. Table 4. Program completers reported to Title II over last three years
EPP Type Completers 10-11 Completers 11-12 Completers 12-13 3-yr Average % of State Total
APPEL Nontraditional 242 226 173 214 9.76%
ASU Both 315 342 329 329 15.01%
ATU Both 200 189 312 234 10.68%
CBC Traditional 0 0 0 0 NA
HU Both 99 122 153 125 5.70%
HSU Both 114 144 141 133 6.07%
HC Traditional 5 4 6 5 0.23%
JBU Traditional 51 44 48 48 2.19%
LC Traditional 8 10 16 11 0.50%
OBU Traditional 25 37 29 30 1.37%
PSC Traditional 3 4 5 4 0.18%
SAU Both 87 80 84 84 3.83%
TFA Nontraditional 81 74 118 91 4.15%
UAF Traditional 243 232 244 240 10.95%
UAFS Traditional 105 87 125 106 4.84%
UALR Both 135 145 161 147 6.71%
UAM Both 81 62 82 75 3.42%
UAPB Both 25 33 30 29 1.32%
UCA Both 232 230 250 237 10.81%
UO Traditional 19 8 5 11 0.50%
WBC Traditional 34 43 39 39 1.78%
Totals 2104 2116 2350 2192 100.00% Source: HEA Title II Reports - 2012, 2013, 2014

10
2015 Educator Preparation Performance Report
Arkansas
Figure 8. Three-year average program completers as % of state total
Source: HEA Title II Reports - 2012, 2013, 2014
Figure 9. Three-year average program completers by program type
Source: HEA Title II Reports - 2012, 2013, 2014
15.0%
10.9% 10.8%
10.7% 9.8%
6.7% 6.1% 5.7%
4.8% 4.2% 3.8% 3.4%
2.2% 1.8% 1.4% 1.3%
0.5% 0.5% 0.2% 0.2%
0.0%
2.0%
4.0%
6.0%
8.0%
10.0%
12.0%
14.0%
16.0%
1610, 73%
582, 27% Traditional
Nontraditional

11
2015 Educator Preparation Performance Report
Arkansas
The following figures represent the numbers of EPP program completers from Arkansas institutions. Figure 10 reflects all EPPS, Figure 11 compares Public and Independent EPPs, and Figure 12 compares traditional and nontraditional routes.
Source: HEA Title II Reports - 2012, 2013, 2014
1942 2041 2104 2116
2350
0
500
1000
1500
2000
2500
3000
3500
2010 2011 2012 2013 2014
All EPPs
Fig. 10. EPP Program Completers - 5 years
1708 1822 1860 1844 2049
234 219 244 272 301
0
500
1000
1500
2000
2500
2010 2011 2012 2013 2014
Fig. 11. Completers by IHE Type
Public EPPs Independent EPPs
1470 1511 1544 1569 1715
472 530 560 547 635
0
500
1000
1500
2000
2010 2011 2012 2013 2014
Fig. 12. Completers by Program Type
Traditional EPPs Nontraditional EPPs

12
2015 Educator Preparation Performance Report
Arkansas
IV. Three-year Average Number of Teachers Prepared By Subject Area The tables below represent the average number of teachers prepared in each area as reported to Title II over three years.
Table 5. Three-year average number prepared via both traditional and nontraditional routes
EPP
Ag
ric
ult
ure
Art
Bu
sin
ess
Ch
ine
se
Dra
ma
/
Sp
ee
ch
Ea
rly
Ch
ild
ho
od
En
gli
sh
Fa
m.
&
Co
ns
. S
ci.
Fre
nc
h
Ge
rma
n
Lif
e
Sc
ien
ce
Ma
th
Mid
dle
Ch
ild
ho
od
Mu
sic
Ph
ys
ical
Ed
uc
ati
on
Ph
ys
ical
Sc
ien
ce
So
cia
l
Stu
die
s
Sp
an
ish
APPEL 2.3 11.7 10.0 3.3 4.7 44.7 23.7 3.7 0.7 0.3 19.7 22.7 45.0 3.3 14.3 16.0 14.3 7.7
ASU 3.3 4.7 3.0 0.0 0.0 130.3 11.0 0.3 0.0 0.0 2.3 5.7 64.0 1.7 12.7 1.0 16.0 1.7
ATU 1.0 8.3 4.0 0.0 2.7 80.0 14.3 0.0 0.0 0.3 2.7 5.7 10.7 10.3 23.3 0.0 10.3 0.7
CBC No teachers prepared over the three years.
HU 0.0 2.0 0.0 0.0 0.7 51.0 9.3 1.0 1.0 0.0 3.7 9.3 17.3 3.7 6.0 3.3 12.0 2.7
HSU 0.0 4.3 1.7 0.0 1.0 46.3 5.0 2.0 0.0 0.0 0.7 3.0 20.0 4.7 18.0 0.7 7.0 0.3
HC 0.0 0.0 0.0 0.0 0.0 2.0 0.7 0.0 0.0 0.0 0.3 0.3 0.0 0.0 1.0 0.3 0.7 0.3
JBU 0.0 0.0 0.0 0.0 0.0 18.3 2.7 0.0 0.0 0.0 0.0 1.3 2.0 0.7 0.0 0.0 2.3 0.0
LC 0.0 0.0 0.0 0.0 0.3 5.3 1.3 0.0 0.0 0.0 0.0 2.7 0.0 0.7 0.0 0.0 0.7 0.0
OBU 0.0 1.0 0.0 0.0 0.7 11.0 0.3 0.0 0.0 0.0 0.0 1.7 0.7 6.0 1.3 0.0 1.3 0.0
PSC 0.0 0.0 0.3 0.0 0.0 1.3 0.0 0.0 0.0 0.0 0.0 0.0 1.3 0.0 0.0 0.0 0.0 0.0
SAU 3.7 0.3 3.3 0.0 0.3 35.3 4.7 0.3 0.0 0.0 2.0 1.7 0.3 2.0 13.3 2.0 3.3 0.3
TFA 0.0 3.3 0.7 0.0 0.7 4.3 9.7 0.0 0.0 0.0 5.0 13.0 10.7 2.3 0.0 3.7 1.3 2.3
UAF 8.3 6.7 8.3 0.0 2.7 89.7 10.3 9.3 2.7 0.3 2.3 9.3 7.7 8.0 27.0 2.0 9.3 3.7
UAFS 0.0 0.0 0.0 0.0 0.0 56.3 9.3 0.0 0.0 0.0 2.0 1.7 15.7 2.0 0.0 0.0 7.0 0.3
UALR 0.0 5.0 2.0 0.0 3.7 40.0 14.7 0.0 0.7 0.0 3.7 3.7 14.7 0.3 3.0 2.3 7.0 0.7
UAM 0.0 1.7 2.0 0.0 0.3 23.3 3.7 0.0 0.0 0.0 3.7 4.3 13.0 1.3 5.0 0.7 2.3 0.0
UAPB 0.0 0.0 1.0 0.0 0.0 11.3 1.0 0.0 0.0 0.0 0.7 2.3 4.0 2.7 4.0 1.0 0.3 0.0
UCA 0.7 9.0 4.0 0.0 0.0 84.0 13.3 7.3 0.3 0.0 2.7 11.0 30.7 7.7 10.0 1.7 11.7 1.0
UO 0.0 1.0 0.0 0.0 0.0 5.3 0.7 0.0 0.0 0.0 0.7 1.0 0.3 0.0 1.7 0.0 0.3 0.0
WBC 0.0 0.7 0.0 0.0 0.0 14.0 3.3 0.0 0.0 0.0 1.0 1.0 4.7 0.7 7.0 0.0 3.3 0.0
Total 19.3 59.7 40.3 3.3 17.8 753.7 139.0 23.9 5.4 0.9 53.2 101.4 262.8 58.1 147.6 34.7 110.4 21.7
Source: HEA Title II Reports - 2012, 2013, 2014

13
2015 Educator Preparation Performance Report
Arkansas
Table 6. Three-year average number prepared via traditional routes only
EPP
Ag
ric
ult
ure
Art
Bu
sin
ess
Ch
ine
se
Dra
ma
/
Sp
ee
ch
Ea
rly
Ch
ild
ho
od
En
gli
sh
Fa
m.
&
Co
ns
. S
ci.
Fre
nc
h
Ge
rma
n
Lif
e
Sc
ien
ce
Ma
th
Mid
dle
Ch
ild
ho
od
Mu
sic
Ph
ys
ica
l
Ed
uc
ati
on
Ph
ys
ica
l
Sc
ien
ce
So
cia
l
Stu
die
s
Sp
an
ish
ASU 3.3 4.7 3.0 0.0 0.0 125.6 10.7 0.3 0.0 0.0 2.3 5.4 63.0 1.7 12.7 1.0 16.0 1.7
ATU 1.0 8.0 3.3 0.0 2.7 78.0 12.0 0.0 0.0 0.3 1.0 4.7 8.0 10.0 23.3 0.3 9.3 0.7
CBC No teachers prepared over three years
HU 0.0 1.3 0.0 0.0 0.4 47.0 7.3 1.0 1.0 0.0 2.7 7.3 14.0 3.4 4.3 2.6 9.0 2.7
HSU 0.0 3.3 1.4 0.0 0.7 46.0 3.0 2.0 0.0 0.0 0.4 2.7 16.3 4.7 17.0 0.0 5.7 0.3
HC 0.0 0.0 0.0 0.0 0.0 2.0 0.7 0.0 0.0 0.0 0.3 0.3 0.0 0.0 1.0 0.3 0.7 0.3
JBU 0.0 0.0 0.0 0.0 0.0 18.3 2.7 0.0 0.0 0.0 0.0 1.3 2.0 0.7 0.0 0.0 2.3 0.0
LC 0.0 0.0 0.0 0.0 0.3 5.3 1.3 0.0 0.0 0.0 0.0 2.7 0.0 0.7 0.0 0.0 0.7 0.0
OBU 0.0 1.0 0.0 0.0 0.7 11.0 0.3 0.0 0.0 0.0 0.0 1.7 0.7 6.0 1.3 0.0 1.3 0.0
PSC 0.0 0.0 0.3 0.0 0.0 1.3 0.0 0.0 0.0 0.0 0.0 0.0 1.3 0.0 0.0 0.0 0.0 0.0
SAU 3.7 0.0 1.0 0.0 0.0 35.3 2.7 0.0 0.0 0.0 0.0 1.4 0.3 1.7 13.3 0.0 0.3 0.0
UAF 8.3 6.7 8.3 0.0 2.7 89.7 10.3 9.3 2.7 0.3 2.3 9.3 7.7 8.0 27.0 2.0 9.3 3.7
UAFS 0.0 0.0 0.0 0.0 0.0 56.3 9.3 0.0 0.0 0.0 2.0 1.7 15.7 2.0 0.0 0.0 7.0 0.3
UALR 0.0 1.3 0.0 0.0 0.4 32.7 7.7 0.0 0.4 0.0 1.4 2.0 7.4 0.3 1.7 0.6 4.3 0.4
UAM 0.0 1.0 0.7 0.0 0.0 23.0 0.0 -0.3 0.0 0.0 2.0 0.0 4.7 1.0 3.3 0.0 2.0 0.0
UAPB 0.0 0.0 1.0 0.0 0.0 11.3 1.0 0.0 0.0 0.0 0.4 2.0 2.7 2.7 3.7 0.7 0.0 0.0
UCA 0.0 6.7 1.3 0.0 0.0 63.0 10.3 6.3 0.3 0.0 2.4 9.0 18.0 7.7 8.7 0.7 8.0 0.3
UO 0.0 1.0 0.0 0.0 0.0 5.3 0.7 0.0 0.0 0.0 0.7 1.0 0.3 0.0 1.7 0.0 0.3 0.0
WBC 0.0 0.7 0.0 0.0 0.0 14.0 3.3 0.0 0.0 0.0 1.0 1.0 4.7 0.7 7.0 0.0 3.3 0.0
Total 16.3 35.7 20.3 0.0 7.9 665.1 83.3 18.6 4.4 0.6 18.9 53.5 166.8 51.3 126.0 7.6 79.5 10.4
Source: HEA Title II Reports - 2012, 2013, 2014

14
2015 Educator Preparation Performance Report
Arkansas
Table 7. Three-year average number prepared via nontraditional routes only
EPP A
gri
cu
ltu
re
Art
Bu
sin
ess
Ch
ine
se
Dra
ma
/
Sp
ee
ch
Ea
rly
Ch
ild
ho
od
En
gli
sh
Fa
m.
&
Co
ns
. S
ci.
Fre
nc
h
Ge
rma
n
Lif
e
Sc
ien
ce
Ma
th
Mid
dle
Ch
ild
ho
od
Mu
sic
Ph
ys
ical
Ed
uc
ati
on
Ph
ys
ical
Sc
ien
ce
So
cia
l
Stu
die
s
Sp
an
ish
APPEL 2.3 11.7 10.0 3.3 4.7 44.7 23.7 3.7 0.7 0.3 19.7 22.7 45.0 3.3 14.3 16.0 14.3 7.7
ASU - MAT 0.0 0.0 0.0 0.0 0.0 4.7 0.3 0.0 0.0 0.0 0.0 0.3 1.0 0.0 0.0 0.0 0.0 0.0
ATU - MAT, MTLL 0.0 0.3 0.7 0.0 0.0 2.0 2.3 0.0 0.0 0.0 1.7 1.0 2.7 0.3 0.0 0.3 1.0 0.0
HU - MATL 0.0 0.7 0.0 0.0 0.3 4.0 2.0 0.0 0.0 0.0 1.0 2.0 3.3 0.3 1.7 0.7 3.0 0.0
HSU - MAT 0.0 1.0 0.3 0.0 0.3 0.3 2.0 0.0 0.0 0.0 0.3 0.3 3.7 0.0 1.0 0.7 1.3 0.0
SAU - MAT 0.0 0.3 2.3 0.0 0.3 0.0 2.0 0.3 0.0 0.0 2.0 0.3 0.0 0.3 0.0 2.0 3.0 0.3
TFA 0.0 3.3 0.7 0.0 0.7 4.3 9.7 0.0 0.0 0.0 5.0 13.0 10.7 2.3 0.0 3.7 1.3 2.3
UALR - M.Ed. 0.0 3.7 2.0 0.0 3.3 7.3 7.0 0.0 0.3 0.0 2.3 1.7 7.3 0.0 1.3 1.7 2.7 0.3
UAM - MAT 0.0 0.7 1.3 0.0 0.3 0.3 3.7 0.3 0.0 0.0 1.7 4.3 8.3 0.3 1.7 0.7 0.3 0.0
UAPB - MAT 0.0 0.0 0.0 0.0 0.0 0.0 0.0 0.0 0.0 0.0 0.3 0.3 1.3 0.0 0.3 0.3 0.3 0.0
UCA - MAT 0.7 2.3 2.7 0.0 0.0 21.0 3.0 1.0 0.0 0.0 0.3 2.0 12.7 0.0 1.3 1.0 3.7 0.7
Total 3.0 24.0 20.0 3.3 9.9 88.6 55.7 5.3 1.0 0.3 34.3 47.9 96.0 6.8 21.6 27.1 30.9 11.3
Source: HEA Title II Reports - 2012, 2013, 2014

15
2015 Educator Preparation Performance Report
Arkansas
V. Number of Program Completers Working in Arkansas Public Schools (first-year) Arkansas EPP program completers (both traditional and nontraditional) were reported by the IHEs to the ADE Office of Research and Technology. The number found as employed in Arkansas Public Schools (APS) the following year are shown in Table 8.
Table 8. Completers working in APS in their first year of teaching
EPP Completers 2011-2012
Employed in APS 12-13
% Completers 2013-2014
Employed in APS 14-15
% Change
APPEL 247 188 76% 183 134 73% -3%
ASU 342 194 57% 363 218 60% +3%
ATU 177 97 55% 230 149 65% +10%
CBC data unavailable 1 1 100% N/A
HU 124 31 25% 187 78 42% +17%
HSU 144 81 56% 142 98 69% +13%
HC 4 1 25% 14 1 7% -18%
JBU 37 14 38% 29 13 45% +7%
LC 10 7 70% 7 4 57% -13%
OBU 37 20 54% 40 15 38% -16%
PSC 4 2 50% 3 1 33% -17%
SAU 70 37 53% 77 58 75% +18%
TFA data unavailable 79 24 30% N/A
UAF 205 102 50% 222 111 50% 0%
UAFS 89 35 39% 113 56 50% +11%
UALR 167 106 63% 221 171 77% +14%
UAM 65 52 80% 79 60 76% -4%
UAPB 32 26 81% 15 13 87% +6%
UCA 230 135 59% 263 161 61% +2%
UO 9 4 44% 24 10 42% -2%
WBC 43 11 26% 32 18 56% +30%
State 2,036 1,143 56% 2,324 1,394 60% +4% Source: Program completers supplied by IHEs. Number of teachers found in APS supplied by ADE Research and Technology Data for the 12-13 completers employed in 13-14 was unavailable for this report. Indicates increase from previous years.
16
2015 Educator Preparation Performance Report
Arkansas
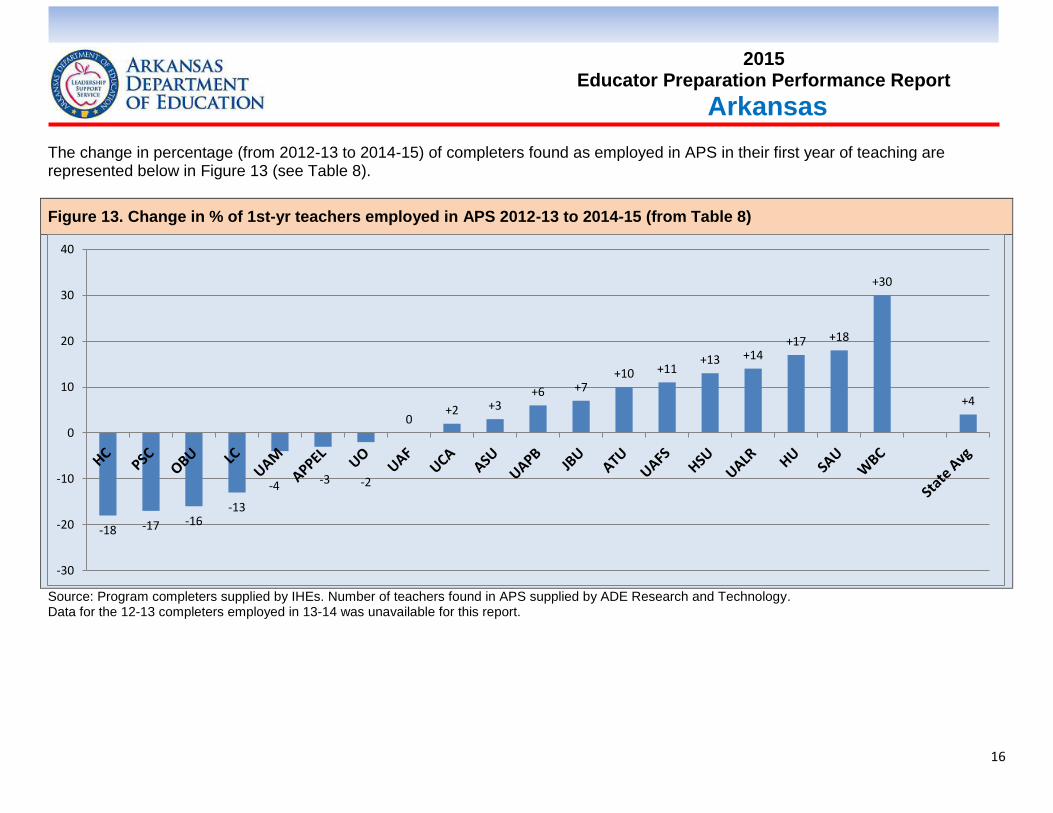
The change in percentage (from 2012-13 to 2014-15) of completers found as employed in APS in their first year of teaching are represented below in Figure 13 (see Table 8).
Figure 13. Change in % of 1st-yr teachers employed in APS 2012-13 to 2014-15 (from Table 8)
Source: Program completers supplied by IHEs. Number of teachers found in APS supplied by ADE Research and Technology. Data for the 12-13 completers employed in 13-14 was unavailable for this report.
-18 -17 -16 -13
-4 -3 -2
0 +2 +3
+6 +7 +10 +11
+13 +14 +17 +18
+30
+4
-30
-20
-10
0
10
20
30
40
17
2015 Educator Preparation Performance Report
Arkansas
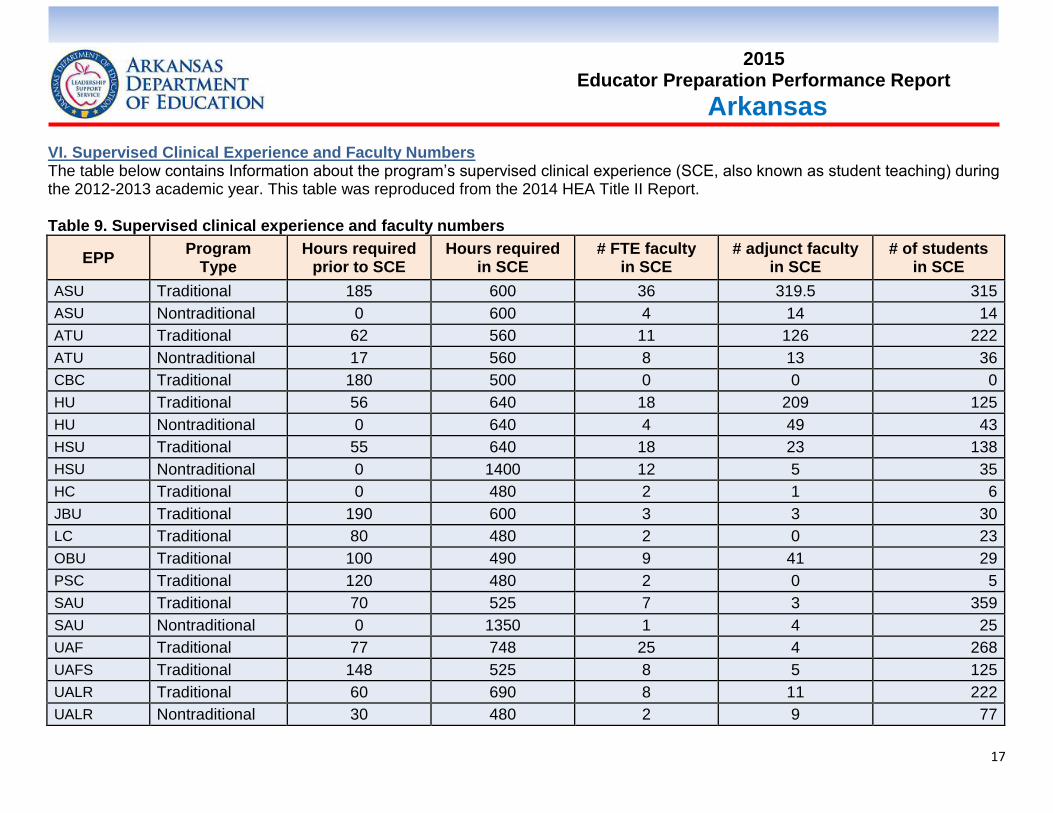
VI. Supervised Clinical Experience and Faculty Numbers The table below contains Information about the program’s supervised clinical experience (SCE, also known as student teaching) during the 2012-2013 academic year. This table was reproduced from the 2014 HEA Title II Report. Table 9. Supervised clinical experience and faculty numbers
EPP Program
Type Hours required
prior to SCE Hours required
in SCE # FTE faculty
in SCE # adjunct faculty
in SCE # of students
in SCE
ASU Traditional 185 600 36 319.5 315
ASU Nontraditional 0 600 4 14 14
ATU Traditional 62 560 11 126 222
ATU Nontraditional 17 560 8 13 36
CBC Traditional 180 500 0 0 0
HU Traditional 56 640 18 209 125
HU Nontraditional 0 640 4 49 43
HSU Traditional 55 640 18 23 138
HSU Nontraditional 0 1400 12 5 35
HC Traditional 0 480 2 1 6
JBU Traditional 190 600 3 3 30
LC Traditional 80 480 2 0 23
OBU Traditional 100 490 9 41 29
PSC Traditional 120 480 2 0 5
SAU Traditional 70 525 7 3 359
SAU Nontraditional 0 1350 1 4 25
UAF Traditional 77 748 25 4 268
UAFS Traditional 148 525 8 5 125
UALR Traditional 60 690 8 11 222
UALR Nontraditional 30 480 2 9 77

18
2015 Educator Preparation Performance Report
Arkansas
EPP Program
Type Hours required
prior to SCE Hours required
in SCE # FTE faculty
in SCE # adjunct faculty
in SCE # of students
in SCE
UAM Traditional 48 1080 9 5 44
UAM Nontraditional 0 1200 2 8 56
UAPB Traditional 110 585 18 0 27
UAPB Nontraditional 0 0 1 0 4
UCA Traditional 168 600 22 174 165
UCA Nontraditional 75 600 8 91 85
UO Traditional 60 560 1 0 6
WBC Traditional 0 640 4 2 39 Source: HEA Title II Report - 2014

19
2015 Educator Preparation Performance Report
Arkansas
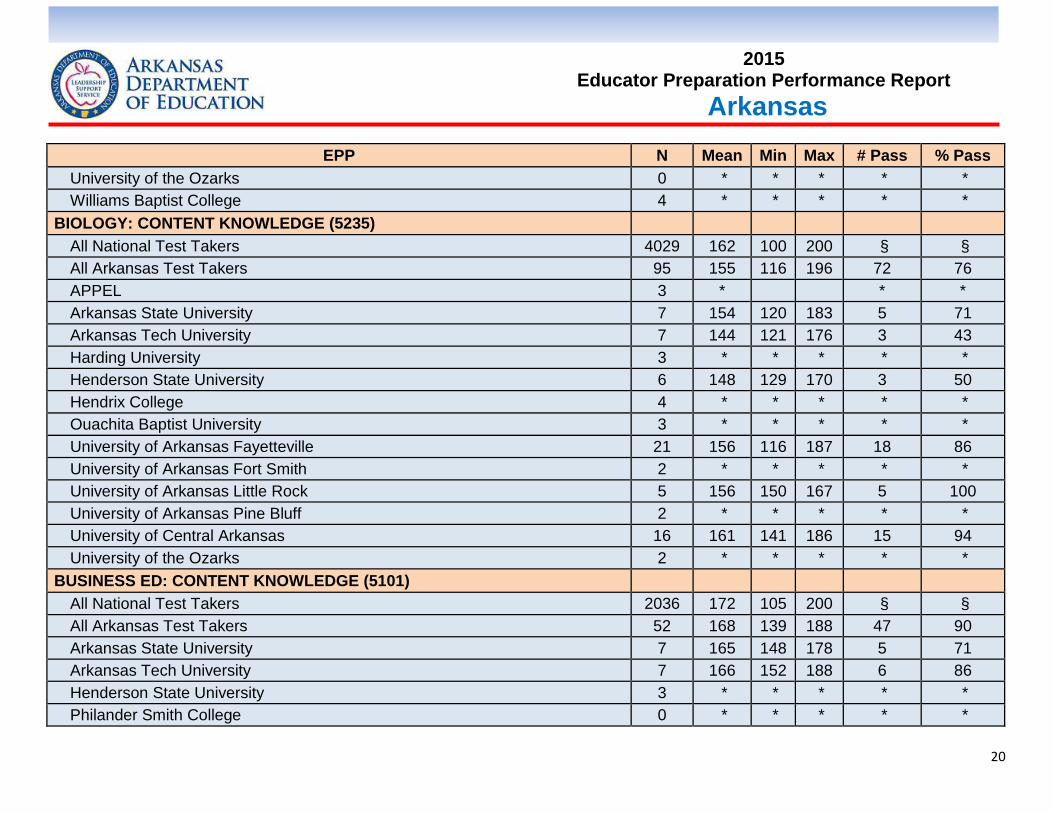
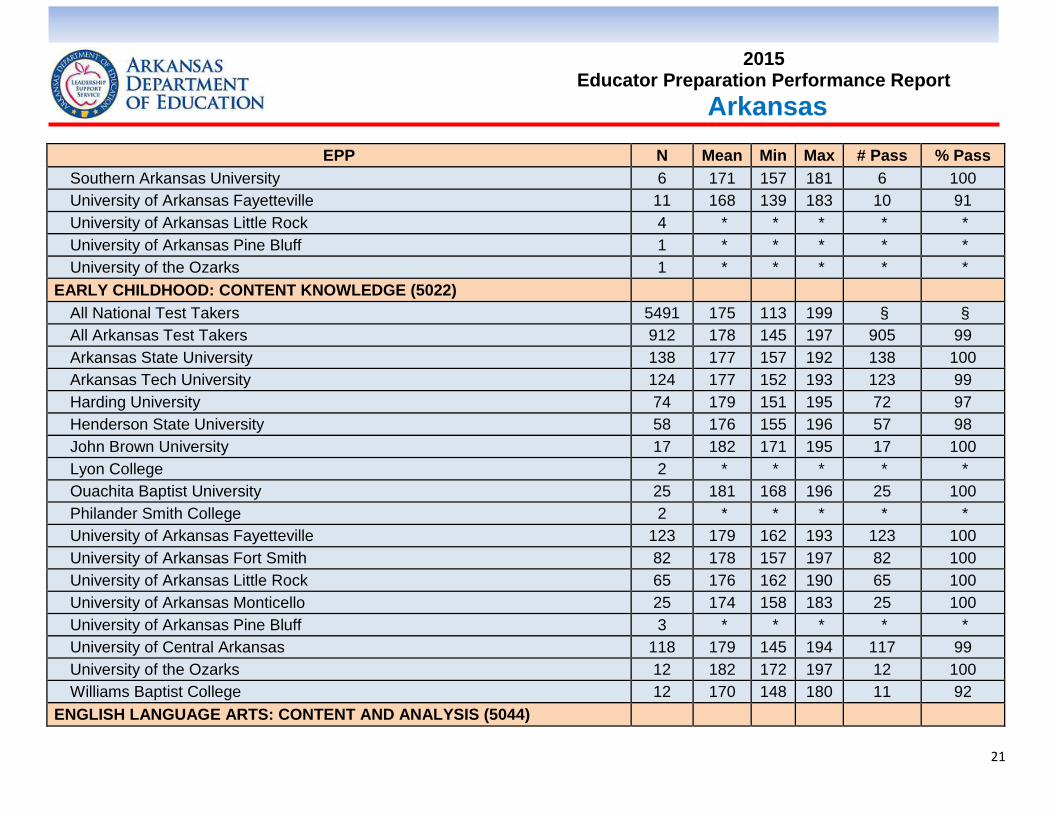
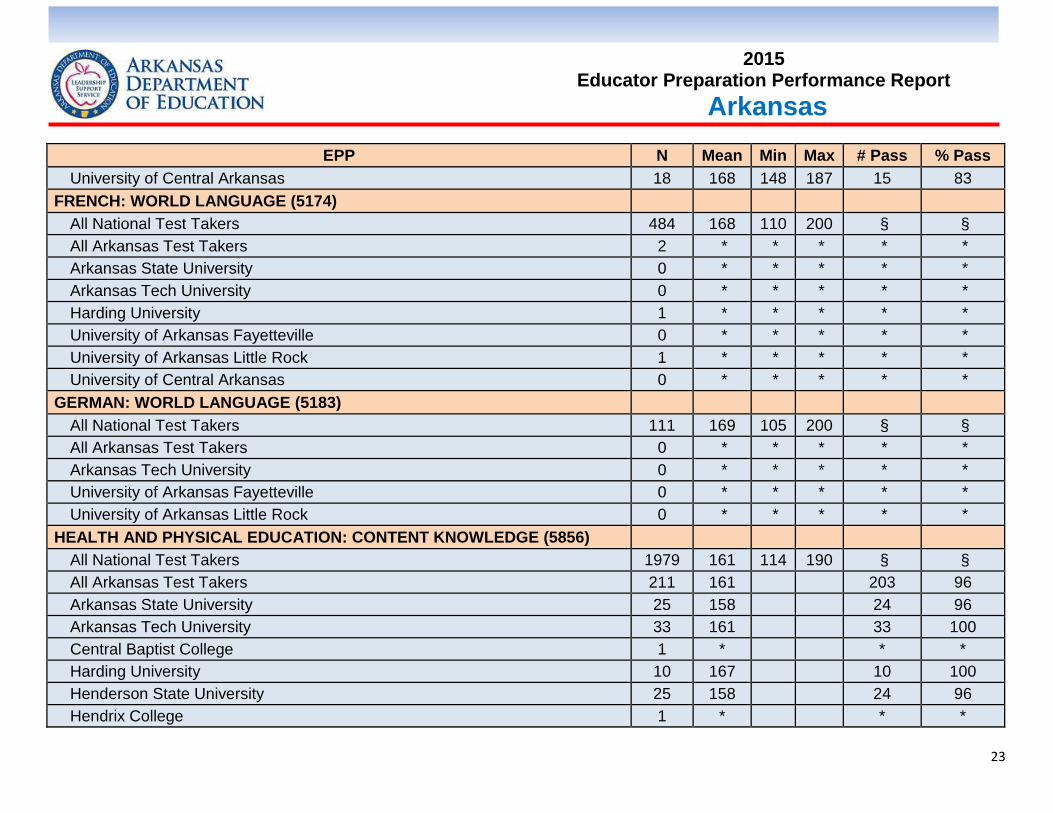
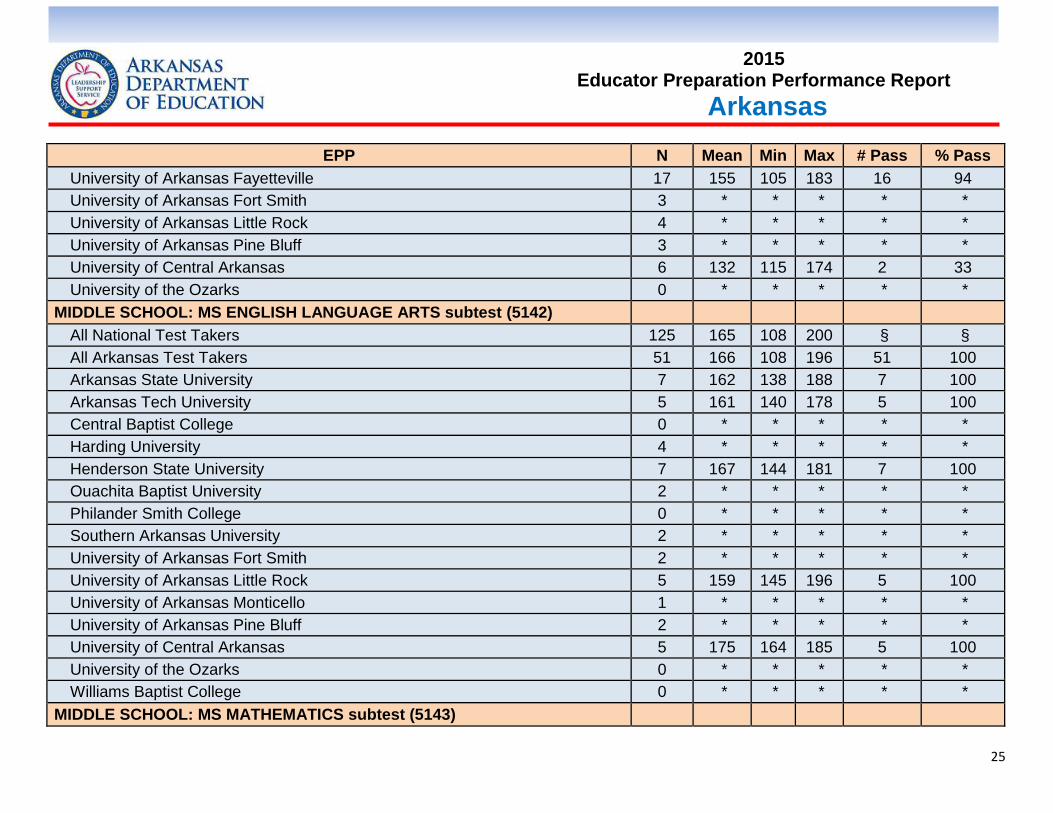
VII. Praxis® Licensure Test Pass Rates The Praxis®
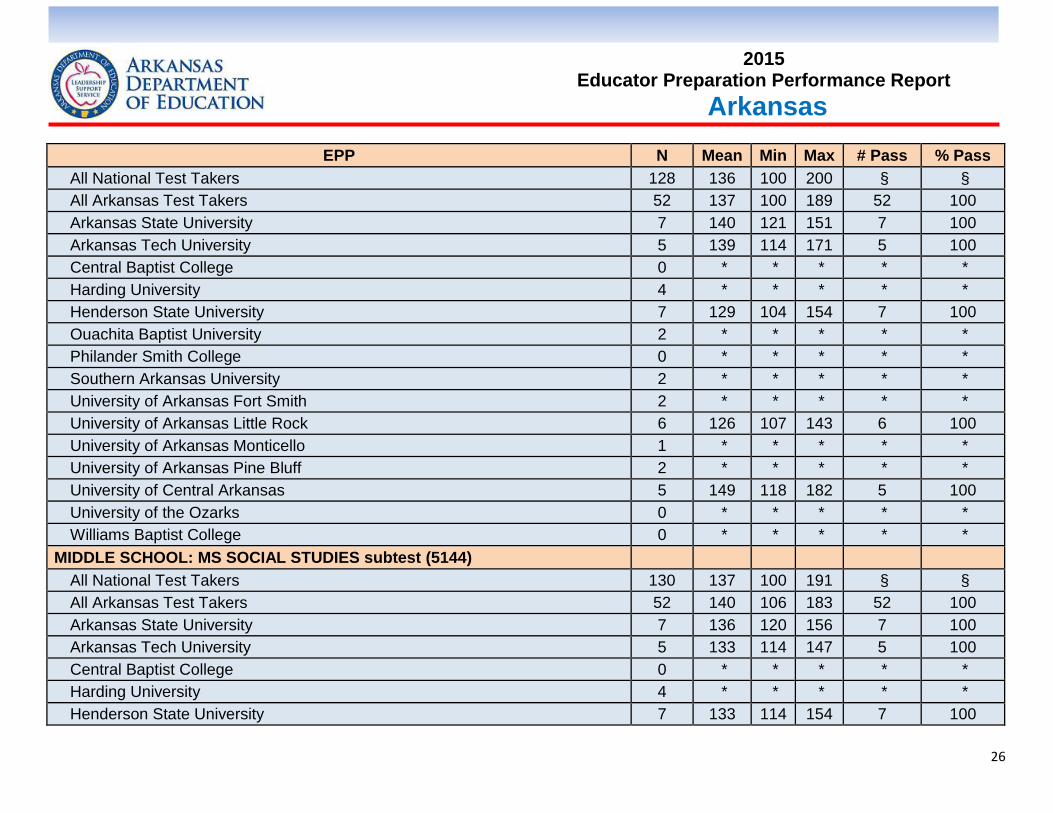
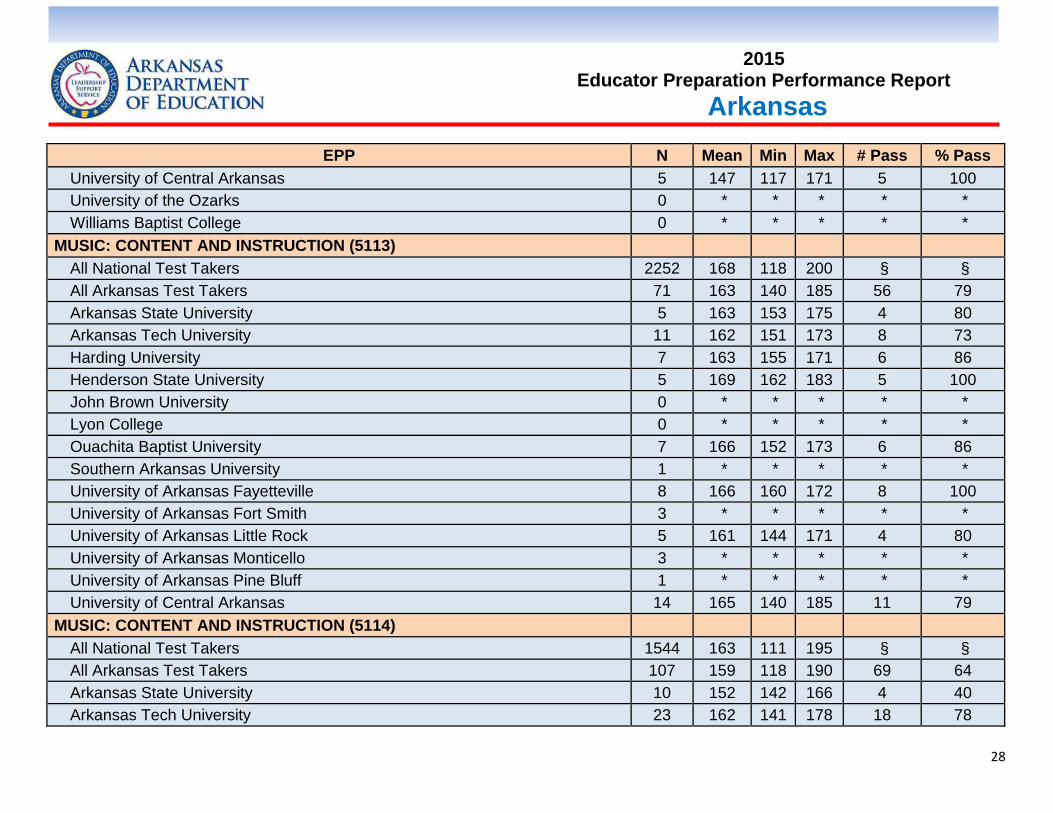
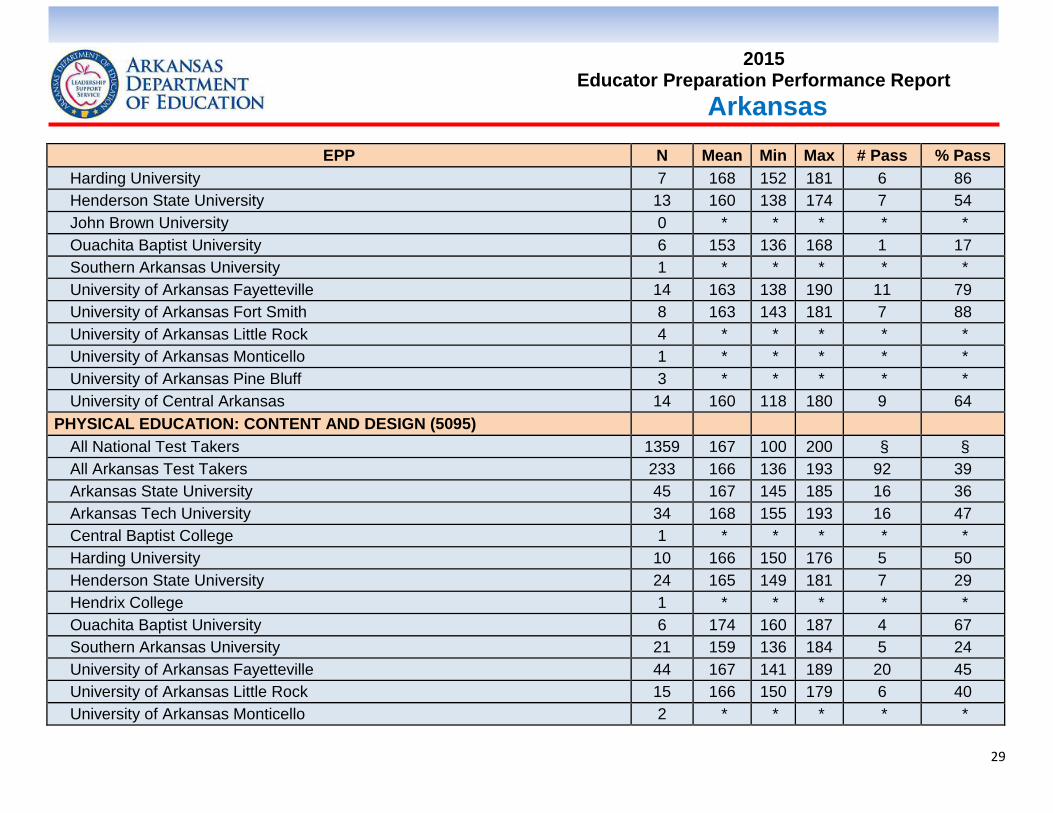
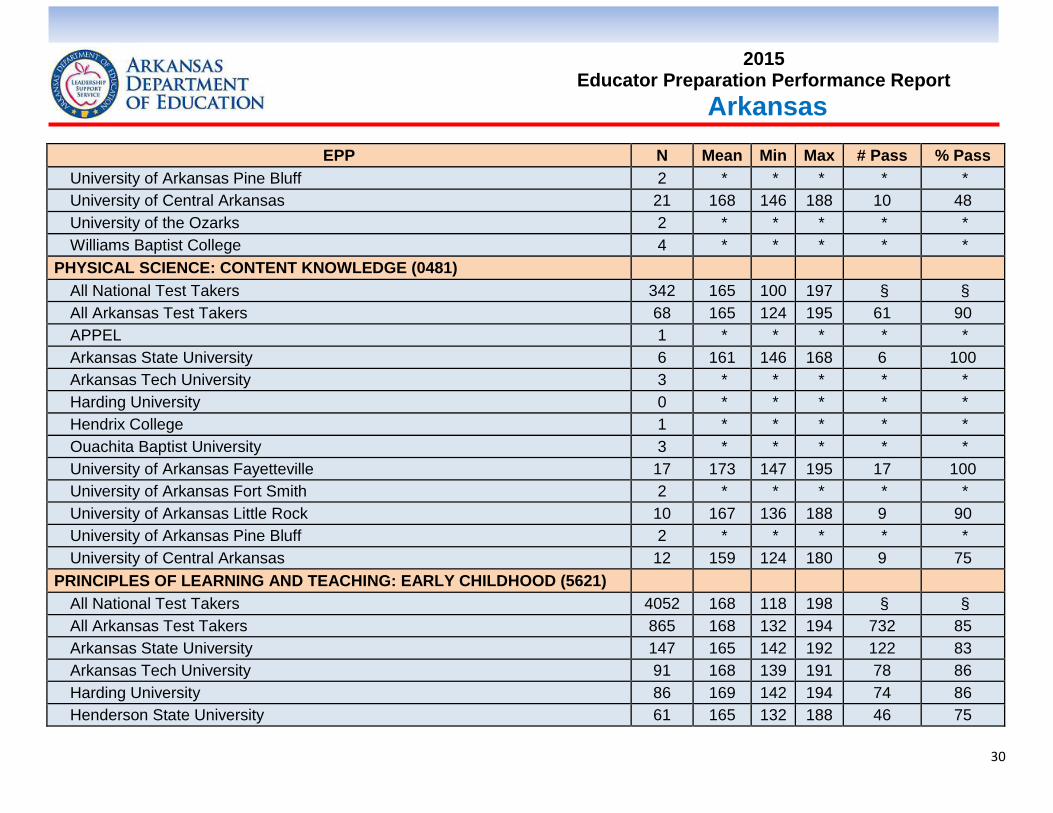
Tests reported herein are those assessments that are required for teacher licensure in Arkansas. EPPs with approved programs for that particular subject area are listed beneath each test. Pass rates reflect the number of students taking each test for the first time between 9/1/13 and 8/31/14, and the numbers passing each test. Highest and lowest scores on each test are also included. IHEs had the opportunity to verify their students took the tests listed for their institution. Data include both traditional and nontraditional routes.
Table 10. Praxis® Licensure Test Pass Rates
EPP N Mean Min Max # Pass % Pass
AGRICULTURE (0700)
All National Test Takers 370 556 260 760
All Arkansas Test Takers 23 564 420 700 17 74
Arkansas State University 4 * * *
Arkansas Tech University 4 * * *
Southern Arkansas University 3 * * *
University of Arkansas Fayetteville 11 544 420 640 7 64
University of Arkansas Pine Bluff 0 * * * * *
ART: CONTENT AND ANALYSIS (5135)
All National Test Takers 732 167 112 197 § §
All Arkansas Test Takers 57 164 131 189 37 65
Arkansas State University 5 166 159 176 3 60
Arkansas Tech University 5 172 164 183 5 100
Harding University 4 * * * * *
Henderson State University 5 158 144 176 1 20
Hendrix College 1 * * * * *
Ouachita Baptist University 2 * * * * *
University of Arkansas Fayetteville 11 173 161 189 11 100
University of Arkansas Little Rock 4 * * * * *
University of Central Arkansas 7 166 144 181 5 71
20
2015 Educator Preparation Performance Report
Arkansas
EPP N Mean Min Max # Pass % Pass
University of the Ozarks 0 * * * * *
Williams Baptist College 4 * * * * *
BIOLOGY: CONTENT KNOWLEDGE (5235)
All National Test Takers 4029 162 100 200 § §
All Arkansas Test Takers 95 155 116 196 72 76
APPEL 3 * * *
Arkansas State University 7 154 120 183 5 71
Arkansas Tech University 7 144 121 176 3 43
Harding University 3 * * * * *
Henderson State University 6 148 129 170 3 50
Hendrix College 4 * * * * *
Ouachita Baptist University 3 * * * * *
University of Arkansas Fayetteville 21 156 116 187 18 86
University of Arkansas Fort Smith 2 * * * * *
University of Arkansas Little Rock 5 156 150 167 5 100
University of Arkansas Pine Bluff 2 * * * * *
University of Central Arkansas 16 161 141 186 15 94
University of the Ozarks 2 * * * * *
BUSINESS ED: CONTENT KNOWLEDGE (5101)
All National Test Takers 2036 172 105 200 § §
All Arkansas Test Takers 52 168 139 188 47 90
Arkansas State University 7 165 148 178 5 71
Arkansas Tech University 7 166 152 188 6 86
Henderson State University 3 * * * * *
Philander Smith College 0 * * * * *
21
2015 Educator Preparation Performance Report
Arkansas
EPP N Mean Min Max # Pass % Pass
Southern Arkansas University 6 171 157 181 6 100
University of Arkansas Fayetteville 11 168 139 183 10 91
University of Arkansas Little Rock 4 * * * * *
University of Arkansas Pine Bluff 1 * * * * *
University of the Ozarks 1 * * * * *
EARLY CHILDHOOD: CONTENT KNOWLEDGE (5022)
All National Test Takers 5491 175 113 199 § §
All Arkansas Test Takers 912 178 145 197 905 99
Arkansas State University 138 177 157 192 138 100
Arkansas Tech University 124 177 152 193 123 99
Harding University 74 179 151 195 72 97
Henderson State University 58 176 155 196 57 98
John Brown University 17 182 171 195 17 100
Lyon College 2 * * * * *
Ouachita Baptist University 25 181 168 196 25 100
Philander Smith College 2 * * * * *
University of Arkansas Fayetteville 123 179 162 193 123 100
University of Arkansas Fort Smith 82 178 157 197 82 100
University of Arkansas Little Rock 65 176 162 190 65 100
University of Arkansas Monticello 25 174 158 183 25 100
University of Arkansas Pine Bluff 3 * * * * *
University of Central Arkansas 118 179 145 194 117 99
University of the Ozarks 12 182 172 197 12 100
Williams Baptist College 12 170 148 180 11 92
ENGLISH LANGUAGE ARTS: CONTENT AND ANALYSIS (5044)

22
2015 Educator Preparation Performance Report
Arkansas
EPP N Mean Min Max # Pass % Pass
All National Test Takers 1075 176 110 200 § §
All Arkansas Test Takers 164 176 129 200 129 79
Arkansas State University 20 166 129 196 12 60
Arkansas Tech University 17 175 135 196 13 76
Harding University 10 181 163 193 9 90
Henderson State University 10 175 163 195 8 80
Hendrix College 1 * * * * *
John Brown University 8 181 163 196 7 88
Lyon College 3 * * * * *
Ouachita Baptist University 4 * * * * *
Southern Arkansas University 7 170 151 191 5 71
University of Arkansas Fayetteville 18 184 158 200 16 89
University of Arkansas Fort Smith 16 172 153 190 11 69
University of Arkansas Little Rock 17 173 132 196 14 82
University of Arkansas Pine Bluff 1 * * * * *
University of Central Arkansas 23 177 146 200 19 83
University of the Ozarks 1 * * * * *
Williams Baptist College 8 175 156 196 6 75
FAMILY AND CONSUMER SCIENCES (5121)
All National Test Takers 1058 168 125 198 § §
All Arkansas Test Takers 49 166 139 188 41 84
Harding University 3 * * * * *
Henderson State University 4 * * * * *
University of Arkansas Fayetteville 18 166 148 188 16 89
University of Arkansas Pine Bluff 0 * * * * *
23
2015 Educator Preparation Performance Report
Arkansas
EPP N Mean Min Max # Pass % Pass
University of Central Arkansas 18 168 148 187 15 83
FRENCH: WORLD LANGUAGE (5174)
All National Test Takers 484 168 110 200 § §
All Arkansas Test Takers 2 * * * * *
Arkansas State University 0 * * * * *
Arkansas Tech University 0 * * * * *
Harding University 1 * * * * *
University of Arkansas Fayetteville 0 * * * * *
University of Arkansas Little Rock 1 * * * * *
University of Central Arkansas 0 * * * * *
GERMAN: WORLD LANGUAGE (5183)
All National Test Takers 111 169 105 200 § §
All Arkansas Test Takers 0 * * * * *
Arkansas Tech University 0 * * * * *
University of Arkansas Fayetteville 0 * * * * *
University of Arkansas Little Rock 0 * * * * *
HEALTH AND PHYSICAL EDUCATION: CONTENT KNOWLEDGE (5856)
All National Test Takers 1979 161 114 190 § §
All Arkansas Test Takers 211 161 203 96
Arkansas State University 25 158 24 96
Arkansas Tech University 33 161 33 100
Central Baptist College 1 * * *
Harding University 10 167 10 100
Henderson State University 25 158 24 96
Hendrix College 1 * * *

24
2015 Educator Preparation Performance Report
Arkansas
EPP N Mean Min Max # Pass % Pass
Ouachita Baptist University 4 * * *
Southern Arkansas University 15 158 14 93
University of Arkansas Fayetteville 53 162 53 100
University of Arkansas Little Rock 13 159 12 92
University of Arkansas Monticello 3 * * *
University of Arkansas Pine Bluff 2 * * *
University of Central Arkansas 20 164 19 95
University of the Ozarks 2 * * *
Williams Baptist College 4 * * *
MARKETING EDUCATION (5561)
All National Test Takers 242 169 121 198 § §
All Arkansas Test Takers 7 167 6 86
University of Central Arkansas 1 * * *
MATHEMATICS: CONTENT KNOWLEDGE (5061)
All National Test Takers 2919 144 100 200 § §
All Arkansas Test Takers 74 141 100 183 56 76
Arkansas State University 18 139 100 183 14 78
Arkansas Tech University 4 * * * * *
Harding University 4 * * * * *
Henderson State University 4 * * * * *
Hendrix College 0 * * * * *
John Brown University 1 * * * * *
Lyon College 0 * * * * *
Ouachita Baptist University 0 * * * * *
Southern Arkansas University 7 141 122 167 6 86
25
2015 Educator Preparation Performance Report
Arkansas
EPP N Mean Min Max # Pass % Pass
University of Arkansas Fayetteville 17 155 105 183 16 94
University of Arkansas Fort Smith 3 * * * * *
University of Arkansas Little Rock 4 * * * * *
University of Arkansas Pine Bluff 3 * * * * *
University of Central Arkansas 6 132 115 174 2 33
University of the Ozarks 0 * * * * *
MIDDLE SCHOOL: MS ENGLISH LANGUAGE ARTS subtest (5142)
All National Test Takers 125 165 108 200 § §
All Arkansas Test Takers 51 166 108 196 51 100
Arkansas State University 7 162 138 188 7 100
Arkansas Tech University 5 161 140 178 5 100
Central Baptist College 0 * * * * *
Harding University 4 * * * * *
Henderson State University 7 167 144 181 7 100
Ouachita Baptist University 2 * * * * *
Philander Smith College 0 * * * * *
Southern Arkansas University 2 * * * * *
University of Arkansas Fort Smith 2 * * * * *
University of Arkansas Little Rock 5 159 145 196 5 100
University of Arkansas Monticello 1 * * * * *
University of Arkansas Pine Bluff 2 * * * * *
University of Central Arkansas 5 175 164 185 5 100
University of the Ozarks 0 * * * * *
Williams Baptist College 0 * * * * *
MIDDLE SCHOOL: MS MATHEMATICS subtest (5143)
26
2015 Educator Preparation Performance Report
Arkansas
EPP N Mean Min Max # Pass % Pass
All National Test Takers 128 136 100 200 § §
All Arkansas Test Takers 52 137 100 189 52 100
Arkansas State University 7 140 121 151 7 100
Arkansas Tech University 5 139 114 171 5 100
Central Baptist College 0 * * * * *
Harding University 4 * * * * *
Henderson State University 7 129 104 154 7 100
Ouachita Baptist University 2 * * * * *
Philander Smith College 0 * * * * *
Southern Arkansas University 2 * * * * *
University of Arkansas Fort Smith 2 * * * * *
University of Arkansas Little Rock 6 126 107 143 6 100
University of Arkansas Monticello 1 * * * * *
University of Arkansas Pine Bluff 2 * * * * *
University of Central Arkansas 5 149 118 182 5 100
University of the Ozarks 0 * * * * *
Williams Baptist College 0 * * * * *
MIDDLE SCHOOL: MS SOCIAL STUDIES subtest (5144)
All National Test Takers 130 137 100 191 § §
All Arkansas Test Takers 52 140 106 183 52 100
Arkansas State University 7 136 120 156 7 100
Arkansas Tech University 5 133 114 147 5 100
Central Baptist College 0 * * * * *
Harding University 4 * * * * *
Henderson State University 7 133 114 154 7 100

27
2015 Educator Preparation Performance Report
Arkansas
EPP N Mean Min Max # Pass % Pass
Ouachita Baptist University 2 * * * * *
Philander Smith College 0 * * * * *
Southern Arkansas University 2 * * * * *
University of Arkansas Fort Smith 3 * * * * *
University of Arkansas Little Rock 5 141 130 163 5 100
University of Arkansas Monticello 1 * * * * *
University of Arkansas Pine Bluff 2 * * * * *
University of Central Arkansas 5 147 121 176 5 100
University of the Ozarks 0 * * * * *
Williams Baptist College 0 * * * * *
MIDDLE SCHOOL: MS SCIENCE subtest (5145)
All National Test Takers 127 138 102 190 § §
All Arkansas Test Takers 53 142 102 171 53 100
Arkansas State University 7 137 127 155 7 100
Arkansas Tech University 5 144 131 164 5 100
Central Baptist College 0 * * * * *
Harding University 4 * * * * *
Henderson State University 7 136 105 162 7 100
Ouachita Baptist University 2 * * * * *
Philander Smith College 0 * * * * *
Southern Arkansas University 2 * * * * *
University of Arkansas Fort Smith 2 * * * * *
University of Arkansas Little Rock 7 143 117 169 7 100
University of Arkansas Monticello 1 * * * * *
University of Arkansas Pine Bluff 2 * * * * *
28
2015 Educator Preparation Performance Report
Arkansas
EPP N Mean Min Max # Pass % Pass
University of Central Arkansas 5 147 117 171 5 100
University of the Ozarks 0 * * * * *
Williams Baptist College 0 * * * * *
MUSIC: CONTENT AND INSTRUCTION (5113)
All National Test Takers 2252 168 118 200 § §
All Arkansas Test Takers 71 163 140 185 56 79
Arkansas State University 5 163 153 175 4 80
Arkansas Tech University 11 162 151 173 8 73
Harding University 7 163 155 171 6 86
Henderson State University 5 169 162 183 5 100
John Brown University 0 * * * * *
Lyon College 0 * * * * *
Ouachita Baptist University 7 166 152 173 6 86
Southern Arkansas University 1 * * * * *
University of Arkansas Fayetteville 8 166 160 172 8 100
University of Arkansas Fort Smith 3 * * * * *
University of Arkansas Little Rock 5 161 144 171 4 80
University of Arkansas Monticello 3 * * * * *
University of Arkansas Pine Bluff 1 * * * * *
University of Central Arkansas 14 165 140 185 11 79
MUSIC: CONTENT AND INSTRUCTION (5114)
All National Test Takers 1544 163 111 195 § §
All Arkansas Test Takers 107 159 118 190 69 64
Arkansas State University 10 152 142 166 4 40
Arkansas Tech University 23 162 141 178 18 78
29
2015 Educator Preparation Performance Report
Arkansas
EPP N Mean Min Max # Pass % Pass
Harding University 7 168 152 181 6 86
Henderson State University 13 160 138 174 7 54
John Brown University 0 * * * * *
Ouachita Baptist University 6 153 136 168 1 17
Southern Arkansas University 1 * * * * *
University of Arkansas Fayetteville 14 163 138 190 11 79
University of Arkansas Fort Smith 8 163 143 181 7 88
University of Arkansas Little Rock 4 * * * * *
University of Arkansas Monticello 1 * * * * *
University of Arkansas Pine Bluff 3 * * * * *
University of Central Arkansas 14 160 118 180 9 64
PHYSICAL EDUCATION: CONTENT AND DESIGN (5095)
All National Test Takers 1359 167 100 200 § §
All Arkansas Test Takers 233 166 136 193 92 39
Arkansas State University 45 167 145 185 16 36
Arkansas Tech University 34 168 155 193 16 47
Central Baptist College 1 * * * * *
Harding University 10 166 150 176 5 50
Henderson State University 24 165 149 181 7 29
Hendrix College 1 * * * * *
Ouachita Baptist University 6 174 160 187 4 67
Southern Arkansas University 21 159 136 184 5 24
University of Arkansas Fayetteville 44 167 141 189 20 45
University of Arkansas Little Rock 15 166 150 179 6 40
University of Arkansas Monticello 2 * * * * *
30
2015 Educator Preparation Performance Report
Arkansas
EPP N Mean Min Max # Pass % Pass
University of Arkansas Pine Bluff 2 * * * * *
University of Central Arkansas 21 168 146 188 10 48
University of the Ozarks 2 * * * * *
Williams Baptist College 4 * * * * *
PHYSICAL SCIENCE: CONTENT KNOWLEDGE (0481)
All National Test Takers 342 165 100 197 § §
All Arkansas Test Takers 68 165 124 195 61 90
APPEL 1 * * * * *
Arkansas State University 6 161 146 168 6 100
Arkansas Tech University 3 * * * * *
Harding University 0 * * * * *
Hendrix College 1 * * * * *
Ouachita Baptist University 3 * * * * *
University of Arkansas Fayetteville 17 173 147 195 17 100
University of Arkansas Fort Smith 2 * * * * *
University of Arkansas Little Rock 10 167 136 188 9 90
University of Arkansas Pine Bluff 2 * * * * *
University of Central Arkansas 12 159 124 180 9 75
PRINCIPLES OF LEARNING AND TEACHING: EARLY CHILDHOOD (5621)
All National Test Takers 4052 168 118 198 § §
All Arkansas Test Takers 865 168 132 194 732 85
Arkansas State University 147 165 142 192 122 83
Arkansas Tech University 91 168 139 191 78 86
Harding University 86 169 142 194 74 86
Henderson State University 61 165 132 188 46 75

31
2015 Educator Preparation Performance Report
Arkansas
EPP N Mean Min Max # Pass % Pass
John Brown University 23 174 136 192 21 91
Lyon College 2 * * * * *
Ouachita Baptist University 26 172 149 185 23 88
Philander Smith College 3 * * * * *
Southern Arkansas University 29 162 147 176 20 69
University of Arkansas Fayetteville 90 173 148 192 86 96
University of Arkansas Fort Smith 81 168 150 185 68 84
University of Arkansas Little Rock 50 165 147 183 38 76
University of Arkansas Monticello 18 160 142 183 9 50
University of Arkansas Pine Bluff 1 * * * * *
University of Central Arkansas 117 170 140 187 104 89
University of the Ozarks 19 168 152 184 18 95
Williams Baptist College 16 171 156 187 15 94
PRINCIPLES OF LEARNING AND TEACHING: GRADES K-6 (5622)
All National Test Takers 16573 174 100 200 § §
All Arkansas Test Takers 52 168 109 187 41 79
Arkansas State University 1 * * * * *
Arkansas Tech University 1 * * * * *
Harding University 10 175 162 185 10 100
Henderson State University 1 * * * * *
John Brown University 0 * * * * *
Lyon College 1 * * * * *
Ouachita Baptist University 0 * * * * *
Philander Smith College 0 * * * * *
Southern Arkansas University 3 * * * * *

32
2015 Educator Preparation Performance Report
Arkansas
EPP N Mean Min Max # Pass % Pass
University of Arkansas Fayetteville 16 170 143 187 12 75
University of Arkansas Fort Smith 1 * * * * *
University of Arkansas Little Rock 5 157 109 176 4 80
University of Arkansas Monticello 2 * * * * *
University of Central Arkansas 5 173 163 181 5 100
PRINCIPLES OF LEARNING AND TEACHING: GRADES 5-9 (5623)
All National Test Takers 2725 174 125 200 § §
All Arkansas Test Takers 299 172 144 194 260 87
Arkansas State University 76 171 144 187 62 82
Arkansas Tech University 14 173 155 186 13 93
Harding University 31 176 144 194 28 90
Henderson State University 20 173 161 189 20 100
Ouachita Baptist University 1 * * * * *
Philander Smith College 1 * * * * *
Southern Arkansas University 4 * * * * *
University of Arkansas Fort Smith 45 175 150 190 41 91
University of Arkansas Little Rock 19 174 155 190 17 89
University of Arkansas Monticello 9 169 150 189 7 78
University of Arkansas Pine Bluff 5 160 149 170 3 60
University of Central Arkansas 42 172 150 185 37 88
University of the Ozarks 0 * * * * *
Williams Baptist College 6 165 145 175 5 83
PRINCIPLES OF LEARNING AND TEACHING: GRADES 7-12 (5624)
All National Test Takers 14077 174 100 200 § §
All Arkansas Test Takers 809 171 140 197 712 88

33
2015 Educator Preparation Performance Report
Arkansas
EPP N Mean Min Max # Pass % Pass
Arkansas State University 116 167 140 196 94 81
Arkansas Tech University 93 169 142 192 85 91
Central Baptist College 1 * * * * *
Harding University 53 176 148 194 50 94
Henderson State University 66 171 145 187 59 89
Hendrix College 4 * * * * *
John Brown University 9 183 175 193 9 100
Lyon College 5 177 172 189 5 100
Ouachita Baptist University 11 180 174 190 11 100
Southern Arkansas University 41 165 141 191 28 68
University of Arkansas Fayetteville 131 173 140 196 113 86
University of Arkansas Fort Smith 47 175 150 195 45 96
University of Arkansas Little Rock 83 172 144 193 75 90
University of Arkansas Monticello 33 167 142 191 26 79
University of Arkansas Pine Bluff 8 165 156 178 7 88
University of Central Arkansas 89 172 142 197 82 92
University of the Ozarks 8 179 163 192 8 100
Williams Baptist College 10 170 156 180 9 90
SCHOOL LEADERS LICENSURE ASSESSMENT (6011)
All National Test Takers 6993 175 127 198 § §
All Arkansas Test Takers 355 174 131 194 314 88
Arkansas State University 256 173 131 194 227 89
Arkansas Tech University 1 * * * * *
Harding University 41 175 151 191 35 85
Henderson State University 12 170 145 183 10 83

34
2015 Educator Preparation Performance Report
Arkansas
EPP N Mean Min Max # Pass % Pass
Southern Arkansas University 10 167 160 187 6 60
University of Arkansas Fayetteville 13 182 174 190 13 100
University of Arkansas Little Rock 7 180 170 189 7 100
University of Arkansas Monticello 1 * * * * *
University of Central Arkansas 12 178 169 194 12 100
SCHOOL SUPERINTENDENT ASSESSMENT (6021)
All National Test Takers 570 167 129 190 § §
All Arkansas Test Takers 46 167 142 190 36 78
Arkansas State University 25 168 155 178 22 88
Arkansas Tech University 1 * * * * *
Harding University 5 166 154 190 2 40
Henderson State University 4 * * * * *
Southern Arkansas University 1 * * * * *
University of Arkansas Fayetteville 5 171 164 180 5 100
University of Arkansas Little Rock 1 * * * * *
University of Central Arkansas 4 * * * * *
SOCIAL STUDIES: CONTENT AND INTERPRETATION (5086)
All National Test Takers 1573 159 105 200 § §
All Arkansas Test Takers 178 154 112 189 96 54
Arkansas State University 14 150 130 169 6 43
Arkansas Tech University 20 157 134 186 11 55
Central Baptist College 1 * * * * *
Harding University 10 163 133 183 8 80
Henderson State University 6 150 136 171 3 50
Hendrix College 4 * * * * *

35
2015 Educator Preparation Performance Report
Arkansas
EPP N Mean Min Max # Pass % Pass
John Brown University 5 152 140 169 2 40
Lyon College 3 * * * * *
Ouachita Baptist University 5 159 130 176 4 80
University of Arkansas Fayetteville 32 155 127 183 16 50
University of Arkansas Fort Smith 15 153 136 167 9 60
University of Arkansas Little Rock 9 160 139 182 7 78
University of Arkansas Pine Bluff 3 * * * * *
University of Central Arkansas 31 156 129 189 19 61
University of the Ozarks 0 * * * * *
Williams Baptist College 2 * * * * *
SPANISH: WORLD LANGUAGE (5195)
All National Test Takers 2358 170 103 200 § §
All Arkansas Test Takers 22 169 118 199 12 55
APPEL 0 * * * * *
Arkansas State University 2 * * * * *
Arkansas Tech University 1 * * * * *
Harding University 4 * * * * *
Henderson State University 3 * * * * *
Hendrix College 0 * * * * *
Lyon College 0 * * * * *
Ouachita Baptist University 2 * * * * *
Southern Arkansas University 1 * * * * *
University of Arkansas Fayetteville 3 * * * * *
University of Arkansas Fort Smith 3 * * * * *
University of Arkansas Little Rock 0 * * * * *

36
2015 Educator Preparation Performance Report
Arkansas
EPP N Mean Min Max # Pass % Pass
University of Central Arkansas 1 * * * * *
SPEECH COMMUNICATION: CONTENT KNOWLEDGE (5221)
All National Test Takers 395 160 123 190 § §
All Arkansas Test Takers 38 160 127 181 33 87
Arkansas Tech University 2 * * * * *
Harding University 1 * * * * *
Henderson State University 4 * * * * *
Ouachita Baptist University 2 * * * * *
University of Arkansas Fayetteville 12 168 152 181 12 100
University of Arkansas Little Rock 4 * * * * *
TECHNOLOGY EDUCATION (5051)
All National Test Takers 668 180 117 200 § §
All Arkansas Test Takers 6 184 6 100
University of Arkansas Fayetteville 5 183 5 100
THEATRE (5641)
All National Test Takers 300 167 107 197 § §
All Arkansas Test Takers 15 162 136 176 13 87
Arkansas Tech University 0 * * * * *
Harding University 1 * * * * *
Henderson State University 1 * * * * *
Hendrix College 1 * * * * *
University of Arkansas Fayetteville 7 170 159 176 7 100
University of Arkansas Little Rock 2 * * * * *
WORLD LANGUAGE PEDAGOGY (5841)
All National Test Takers 233 182 122 200 § §

37
2015 Educator Preparation Performance Report
Arkansas
EPP N Mean Min Max # Pass % Pass
All Arkansas Test Takers 28 183 163 195 28 100
Arkansas State University 2 * * * * *
Arkansas Tech University 1 * * * * *
Harding University 5 187 183 191 5 100
Henderson State University 2 * * * * *
Hendrix College 0 * * * * *
Lyon College 0 * * * * *
Ouachita Baptist University 3 * * * * *
Southern Arkansas University 1 * * * * *
University of Arkansas Fayetteville 7 179 167 188 7 100
University of Arkansas Fort Smith 2 * * * * *
University of Arkansas Little Rock 4 * * * * *
University of Central Arkansas 1 * * * * * Source: ETS Data Manager via ADE Program Advisor * indicates < 5 test takers
N = number of test takers Mean = mean score Min = lowest score recorded Max = highest score recorded # Pass = number of passing scores % Pass = Pass rate percentage § = No national cut score; no national pass rate

38
2015 Educator Preparation Performance Report
Arkansas
VIII. Praxis® Licensure Test Summary Pass Rates Tables 11 and 12 on Summary Pass Rates reflect the percentage of all program completers (PCs) who passed all tests they took for their area of specialization among those who took one or more tests in their specialization areas. Years with less than ten PCs per year were combined (over three years) for a pass rate.
Table 11. Summary pass rates for traditional routes
2010-11 2011-12 2012-13 Combined 3 years
EPP #
PCs #
Passed %
State Avg
# PCs
# Passed
% State Avg
# PCs
# Passed
% State Avg
# PCs
# Passed
%
ASU 315 278 88%
96%
322 274 85%
95%
315 264 84%
93%
ATU 73 69 95% 129 125 97% 65 58 89%
HU 96 95 99% 111 107 96% 118 106 90%
HSU 105 105 100% 125 125 100% 124 122 98%
HC 5 * * 4 * * 6 * * 15 15 100%
JBU 32 32 100% 39 39 100% 45 44 98%
LYON 8 * * 10 10 100% 16 13 81%
OBU 25 24 96% 37 37 100% 29 29 100%
PSC 3 * * 4 * * 5 * * 12 12 100%
SAU 77 68 88% 64 54 84% 64 50 78%
UAF 243 243 100% 231 231 100% 244 242 99%
UAFS 107 107 100% 87 87 100% 125 124 99%
UALR 58 58 100% 74 74 100% 73 72 99%
UAM 19 19 100% 45 44 98% 40 36 90%
UAPB 22 21 95% 30 30 100% 27 26 96%
UCA 153 152 99% 143 143 100% 165 164 99%
UO 19 19 100% 9 * * 5 * * 33 33 100%
WBC 35 32 91% 42 35 83% 39 29 74% Indicates pass rate higher than the state average.
Source: HEA Title II Reports - 2012, 2013, 2014 * indicates < 10 test takers

39
2015 Educator Preparation Performance Report
Arkansas
Table 12. Summary pass rates for nontraditional routes
2010-11 2011-12 2012-13 Combined 3 years
EPP #
PCs #
Passed %
State Avg
# PCs
# Passed
% State Avg
# PCs
# Passed
% State Avg
# PCs
# Passed
%
APPEL 241 239 99% 99% 206 206 100% 99% 154 148 96% 96%
ASU 20 20 100% 99% 14 14 100% 98%
ATU 2 * * 99% 1 * * 98% 3 * *
HU 4 * * 100% 12 12 100% 99% 35 35 100% 98%
HSU 9 * * 100% 18 17 94% 99% 18 16 89% 98%
SAU 7 * * 100% 7 * * 99% 20 20 100% 98% 34 33 97%
TFA 90 89 99% 99% 68 66 97% 99% 273 260 95% 96%
UALR 60 60 100% 100% 67 67 100% 99% 74 74 100% 98%
UAM 62 61 98% 100% 19 19 100% 99% 43 39 93% 98%
UAPB 3 * * 99% 2 * * 98% 5 * *
UCA 79 79 100% 100% 86 86 100% 99% 84 84 100% 98% Indicates pass rate higher than the state average.
Source: HEA Title II Reports - 2012, 2013, 2014 * indicates < 10 test takers

40
2015 Educator Preparation Performance Report
Arkansas
IX Surveys of Novice Teacher Perceptions of Preparation First year teachers complete the “Novice Teacher Survey” at the end of their first full year of teaching. The survey is designed to identify how well they feel their educator preparation provider prepared them for teaching. The questions and results from spring 2014 are indicated below. Table 13. Survey results for both traditional and nontraditional routes Instructions were: "Please choose the number that most accurately reflects your level of preparation for each of the statement topics.”
SCALE: 1. Not at all prepared 2. Inadequately prepared 3. Adequately prepared 4. Well prepared 5. Very well prepared
(n = number of respondents)
AP
PE
L
(n=
204)
AS
U
(n=
161)
AT
U
(n=
110)
HU
(n=
69)
HS
U
(n=
93)
HC
(n=
2)
JB
U
(n=
20)
LC
(n
=1)
OB
U
(n=
7)
PS
C
(n=
2)
SA
U
(n=
75)
UA
F
(n=
147)
UA
FS
(n=
54)
UA
LR
(n
=56)
UA
M
(n=
89)
UA
PB
(n=
7)
UC
A
(n=
125)
UO
(n=
5)
WB
C
(n=
18)
Item
Avg
. (n
=1,2
45)
Knowledge of learner development
3.89 4.07 4.29 4.13 4.16 4.00 4.20 4.00 4.86 5.00 4.11 4.23 4.31 4.27 4.13 4.29 4.16 4.40 4.28 4.14
Content knowledge preparation 3.84 4.11 4.41 4.16 4.35 4.50 3.95 2.00 4.57 5.00 4.09 4.31 4.26 4.25 4.18 4.43 4.26 4.20 4.61 4.18
Lesson planning skills 3.82 4.07 4.30 4.06 4.22 4.00 4.10 5.00 4.71 4.50 3.93 4.45 4.41 4.27 4.13 4.43 4.35 4.80 4.11 4.17
Instructional strategies and skills 4.02 3.99 4.18 4.25 4.20 4.00 3.90 5.00 4.43 5.00 4.07 4.34 4.26 4.16 4.21 4.29 4.26 4.60 4.22 4.16
Use of instructional technology 3.84 3.98 4.04 4.03 3.99 3.50 3.45 4.00 3.86 5.00 3.93 3.91 4.17 3.98 4.16 4.43 4.15 3.80 4.28 3.99
Consideration of diversity among your students
4.06 4.07 4.19 4.14 4.30 4.00 3.80 4.00 4.57 5.00 4.05 4.36 4.33 4.41 4.24 4.14 4.34 4.60 4.00 4.20
Establishing a culture for learning 4.08 4.13 4.24 4.33 4.34 4.50 4.00 4.00 4.43 5.00 4.15 4.36 4.43 4.14 4.22 4.57 4.38 4.40 4.22 4.24
Creating an effective learning environment (classroom management)
4.04 3.83 4.19 4.06 4.19 4.00 3.80 4.00 4.43 5.00 4.05 4.15 4.09 3.80 4.00 4.43 4.22 4.60 4.06 4.06
Managing student behavior 3.81 3.68 3.91 3.78 4.00 4.00 3.60 5.00 4.43 5.00 3.84 3.94 3.93 3.61 3.83 4.57 3.97 3.80 3.94 3.86
Assessment of student learning 3.86 3.91 4.12 4.04 3.95 4.00 3.80 3.00 4.43 4.50 3.95 4.25 4.13 4.11 4.10 4.29 4.14 4.00 4.11 4.04
Communicating with families 3.80 3.73 3.94 3.64 4.06 4.50 3.60 4.00 4.29 5.00 3.93 3.73 4.24 3.84 3.97 3.71 3.98 4.20 4.22 3.87
Leadership, collaboration and professional growth
4.01 3.98 4.17 4.13 4.18 4.50 3.95 4.00 4.71 5.00 4.07 4.20 4.44 4.11 4.07 4.14 4.17 4.60 4.28 4.12
Extent that your instructors modeled best teaching practices
3.85 3.96 3.95 4.28 3.84 4.00 3.90 4.00 3.86 5.00 4.07 4.10 4.24 4.05 3.98 4.29 4.26 3.80 4.33 4.03

41
2015 Educator Preparation Performance Report
Arkansas
and use of technology
Availability of resources to support instruction and research
3.81 4.00 4.09 4.36 4.18 3.50 3.85 4.00 4.29 5.00 3.99 4.28 4.31 4.04 3.96 4.43 4.32 4.20 4.17 4.09
Quality of student teaching experience
3.56 4.12 4.38 4.38 4.22 4.00 4.20 4.00 4.43 5.00 4.23 4.42 4.43 4.11 4.01 4.57 4.33 4.60 4.56 4.16
Avg. of all 15 items 3.89 3.98 4.16 4.12 4.15 4.07 3.87 4.00 4.42 4.93 4.03 4.20 4.27 4.08 4.08 4.33 4.22 4.31 4.23
Source: ADE Novice Teacher Surveys - 2014

42
2015 Educator Preparation Performance Report
Arkansas
First year teachers complete the “Novice Teacher Survey” at the end of their first full year of teaching. The survey is designed to identify how well they feel their educator preparation program prepared them for teaching. The questions and results from spring 2014 are indicated below. Table 14. Survey results for traditional routes only Instructions were: “Please choose the number that most accurately reflects your level of preparation for each of the statement topics.”
SCALE: 1. Not at all prepared 2. Inadequately prepared 3. Adequately prepared 4. Well prepared 5. Very well prepared
(n = number of respondents) A
SU
(n
=148)
AT
U
(n=
90)
HU
(n
=43)
HS
U
(n7
9)=
HC
(n=
2)
JB
U
(n=
20)
LC
(n=
1)
OB
U
(n=
7)
PS
C
(n=
2)
SA
U
N=
44)
UA
F
(n=
147)
UA
FS
(n=
54)
UA
LR
(n
=18)
UA
M
(n=
34)
UA
PB
(n
=6)
UC
A
(n=
74)
UO
(n=
5)
WB
C
(n=
18)
Ite
m
Avg
(n
=792)
Knowledge of learner development 4.09 4.37 4.16 4.18 4.00 4.20 4.00 4.86 5.00 4.00 4.23 4.31 4.22 3.97 4.17 4.09 4.40 4.28 4.19
Content knowledge preparation 4.15 4.51 4.28 4.39 4.50 3.95 2.00 4.57 5.00 4.00 4.31 4.26 4.39 3.97 4.33 4.43 4.20 4.61 4.29
Lesson planning skills 4.11 4.38 3.93 4.23 4.00 4.10 5.00 4.71 4.50 3.84 4.45 4.41 4.00 4.06 4.33 4.31 4.80 4.11 4.24
Instructional strategies and skills 4.03 4.20 4.21 4.22 4.00 3.90 5.00 4.43 5.00 4.05 4.34 4.26 4.11 4.18 4.33 4.18 4.60 4.22 4.19
Use of instructional technology 3.99 4.02 3.84 3.97 3.50 3.45 4.00 3.86 5.00 3.84 3.91 4.17 4.00 4.09 4.33 4.14 3.80 4.28 3.98
Consideration of diversity among your students
4.09 4.26 3.95 4.35 4.00 3.80 4.00 4.57 5.00 4.00 4.36 4.33 4.33 4.32 4.33 4.28 4.60 4.00 4.22
Establishing a culture for learning 4.14 4.30 4.26 4.33 4.50 4.00 4.00 4.43 5.00 4.16 4.36 4.43 4.33 4.21 4.67 4.34 4.40 4.22 4.28
Creating an effective learning environment (classroom management)
3.84 4.22 4.05 4.15 4.00 3.80 4.00 4.43 5.00 3.93 4.15 4.09 3.72 3.97 4.50 4.18 4.60 4.06 4.06
Managing student behavior 3.70 3.93 3.84 3.94 4.00 3.60 5.00 4.43 5.00 3.66 3.94 3.93 3.67 3.79 4.50 3.95 3.80 3.94 3.86
Assessment of student learning 3.93 4.17 3.98 3.89 4.00 3.80 3.00 4.43 4.50 3.86 4.25 4.13 4.11 3.94 4.33 4.05 4.00 4.11 4.05
Communicating with families 3.74 3.98 3.44 4.08 4.50 3.60 4.00 4.29 5.00 3.93 3.73 4.24 3.83 4.00 3.67 3.89 4.20 4.22 3.87
Leadership, collaboration and professional growth
3.99 4.21 4.00 4.19 4.50 3.95 4.00 4.71 5.00 4.09 4.20 4.44 4.17 4.12 4.17 4.20 4.60 4.28 4.16
Extent that instructors modeled best teaching practices and use of technology 3.98 4.00 4.19 3.84 4.00 3.90 4.00 3.86 5.00 4.02 4.10 4.24 4.06 3.97 4.33 4.27 3.80 4.33 4.06
Availability of resources to support instruction and research
4.00 4.14 4.40 4.18 3.50 3.85 4.00 4.29 5.00 3.95 4.28 4.31 3.94 3.88 4.50 4.31 4.20 4.17 4.16
Quality of student teaching experience
4.12 4.46 4.35 4.28 4.00 4.20 4.00 4.43 5.00 4.36 4.22 4.43 4.44 4.26 5.00 4.42 4.60 4.56 4.34
Avg. of all 15 items 3.99 4.21 4.06 4.15 4.07 3.87 4.00 4.42 4.93 3.98 4.20 4.27 4.09 4.05 4.37 4.20 4.31 4.23
Source: ADE Novice Teacher Surveys - 2014
43
2015 Educator Preparation Performance Report
Arkansas
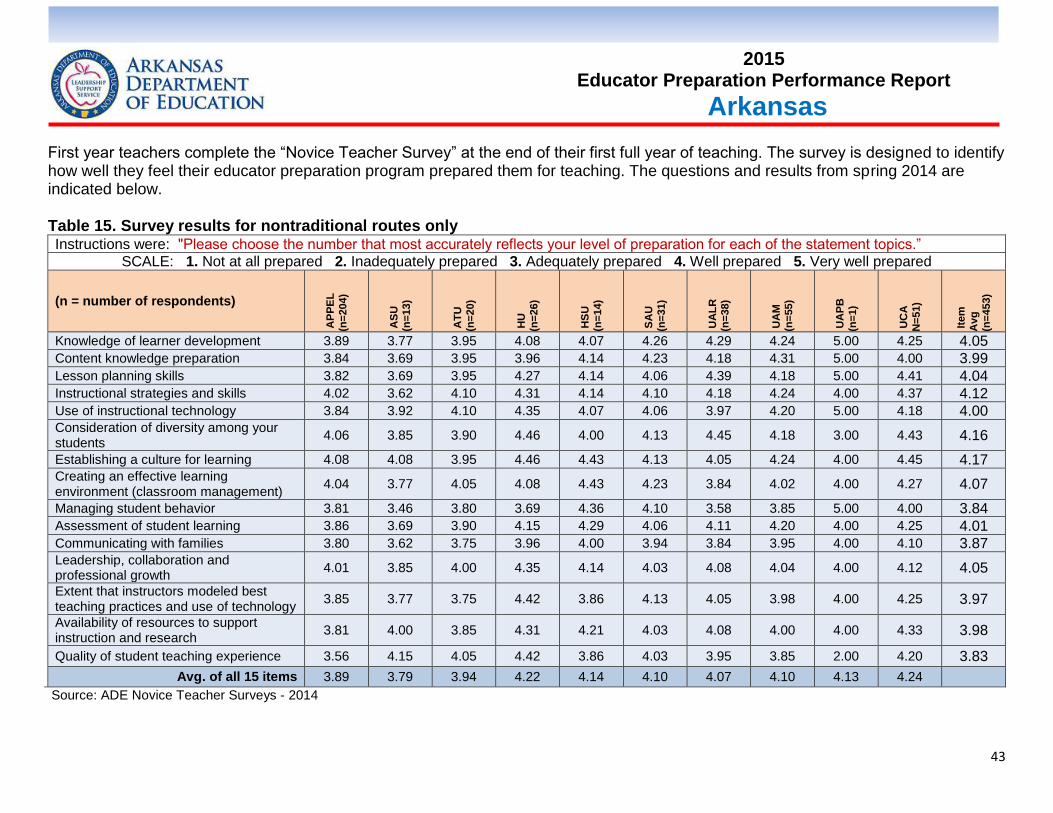
First year teachers complete the “Novice Teacher Survey” at the end of their first full year of teaching. The survey is designed to identify how well they feel their educator preparation program prepared them for teaching. The questions and results from spring 2014 are indicated below. Table 15. Survey results for nontraditional routes only Instructions were: "Please choose the number that most accurately reflects your level of preparation for each of the statement topics.”
SCALE: 1. Not at all prepared 2. Inadequately prepared 3. Adequately prepared 4. Well prepared 5. Very well prepared
(n = number of respondents)
AP
PE
L
(n=
204)
AS
U
(n=
13)
AT
U
(n=
20)
HU
(n=
26)
HS
U
(n=
14)
SA
U
(n=
31)
UA
LR
(n
=38)
UA
M
(n=
55)
UA
PB
(n=
1)
UC
A
N=
51)
Ite
m
Avg
(n=
453)
Knowledge of learner development 3.89 3.77 3.95 4.08 4.07 4.26 4.29 4.24 5.00 4.25 4.05
Content knowledge preparation 3.84 3.69 3.95 3.96 4.14 4.23 4.18 4.31 5.00 4.00 3.99
Lesson planning skills 3.82 3.69 3.95 4.27 4.14 4.06 4.39 4.18 5.00 4.41 4.04
Instructional strategies and skills 4.02 3.62 4.10 4.31 4.14 4.10 4.18 4.24 4.00 4.37 4.12
Use of instructional technology 3.84 3.92 4.10 4.35 4.07 4.06 3.97 4.20 5.00 4.18 4.00
Consideration of diversity among your students
4.06 3.85 3.90 4.46 4.00 4.13 4.45 4.18 3.00 4.43 4.16
Establishing a culture for learning 4.08 4.08 3.95 4.46 4.43 4.13 4.05 4.24 4.00 4.45 4.17
Creating an effective learning environment (classroom management)
4.04 3.77 4.05 4.08 4.43 4.23 3.84 4.02 4.00 4.27 4.07
Managing student behavior 3.81 3.46 3.80 3.69 4.36 4.10 3.58 3.85 5.00 4.00 3.84
Assessment of student learning 3.86 3.69 3.90 4.15 4.29 4.06 4.11 4.20 4.00 4.25 4.01
Communicating with families 3.80 3.62 3.75 3.96 4.00 3.94 3.84 3.95 4.00 4.10 3.87
Leadership, collaboration and professional growth
4.01 3.85 4.00 4.35 4.14 4.03 4.08 4.04 4.00 4.12 4.05
Extent that instructors modeled best teaching practices and use of technology
3.85 3.77 3.75 4.42 3.86 4.13 4.05 3.98 4.00 4.25 3.97
Availability of resources to support instruction and research
3.81 4.00 3.85 4.31 4.21 4.03 4.08 4.00 4.00 4.33 3.98
Quality of student teaching experience 3.56 4.15 4.05 4.42 3.86 4.03 3.95 3.85 2.00 4.20 3.83
Avg. of all 15 items 3.89 3.79 3.94 4.22 4.14 4.10 4.07 4.10 4.13 4.24
Source: ADE Novice Teacher Surveys - 2014
44
2015 Educator Preparation Performance Report
Arkansas
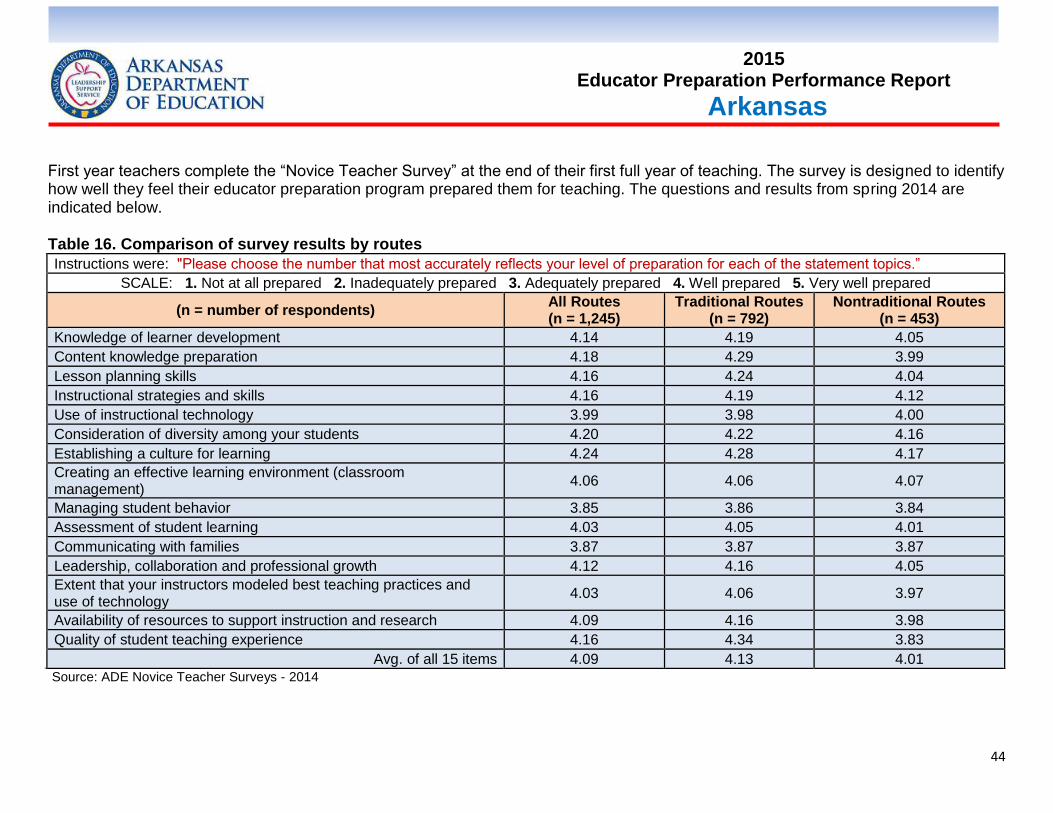
First year teachers complete the “Novice Teacher Survey” at the end of their first full year of teaching. The survey is designed to identify how well they feel their educator preparation program prepared them for teaching. The questions and results from spring 2014 are indicated below. Table 16. Comparison of survey results by routes
Instructions were: "Please choose the number that most accurately reflects your level of preparation for each of the statement topics.”
SCALE: 1. Not at all prepared 2. Inadequately prepared 3. Adequately prepared 4. Well prepared 5. Very well prepared
(n = number of respondents) All Routes (n = 1,245)
Traditional Routes (n = 792)
Nontraditional Routes (n = 453)
Knowledge of learner development 4.14 4.19 4.05
Content knowledge preparation 4.18 4.29 3.99
Lesson planning skills 4.16 4.24 4.04
Instructional strategies and skills 4.16 4.19 4.12
Use of instructional technology 3.99 3.98 4.00
Consideration of diversity among your students 4.20 4.22 4.16
Establishing a culture for learning 4.24 4.28 4.17
Creating an effective learning environment (classroom management)
4.06 4.06 4.07
Managing student behavior 3.85 3.86 3.84
Assessment of student learning 4.03 4.05 4.01
Communicating with families 3.87 3.87 3.87
Leadership, collaboration and professional growth 4.12 4.16 4.05
Extent that your instructors modeled best teaching practices and use of technology
4.03 4.06 3.97
Availability of resources to support instruction and research 4.09 4.16 3.98
Quality of student teaching experience 4.16 4.34 3.83
Avg. of all 15 items 4.09 4.13 4.01
Source: ADE Novice Teacher Surveys - 2014
45
2015 Educator Preparation Performance Report
Arkansas
X. Glossary Educator Preparation Provider (EPP) – Educator preparation providers are institutions and organizations that offer teacher
preparation programs. Educator preparation providers can be Institutions of Higher Education (IHEs) offering traditional programs (traditional route to licensure), IHEs offering alternative programs (nontraditional route to licensure), or organizations not based at IHEs offering alternative programs. Educator preparation ‘programs’ are those individual tracks offered under the auspices of each provider.
HEA Title II (Title II of the Higher Education Act of 1965) – In October 1998 Congress reauthorized the Higher Education Act. Title
II, Sections 207 and 208 reflect the efforts of States, Institutions of Higher Education (IHE), and their school district partners to improve the recruitment, preparation, and support of new teachers. The HEA Title II Report includes requirements, conditions, and specifications for institutions and states related to teacher preparation and licensure.
IHE – Institution of Higher Education; college or university.
Nontraditional route to licensure – A post-baccalaureate preparation program designed for individuals seeking licensure as a
teacher whose undergraduate, or post-baccalaureate degree is not in educator preparation. Under the Arkansas Department of Education rules for nontraditional licensure, this is a program that allows them to serve as teacher of record while enrolled in a program of study.
Pedagogy – The art or science of teaching; education; instructional methods.
Praxis® licensure tests – Examinations offered by ETS® taken by individuals entering the teaching profession (required by many
states, including Arkansas) as part of the licensure process. Passing scores are required on the appropriate basic skills, pedagogy, and content-area assessments as mandated by the State Board of Education.
Program completer – A person who has met all the requirements of a state-approved educator preparation program. Program
completers include all those who are documented as having met such requirements. Documentation may take the form of a degree, institutional certificate, program credential, transcript or other written proof of having met the program’s requirements.

46
2015 Educator Preparation Performance Report
Arkansas
Supervised clinical experience (SCE) – Pre-service teaching (student teaching) or internship in a school setting that provides
candidates with extensive opportunities to develop and demonstrate competence in the professional roles for which they are preparing. This is completed under the guidance and supervision of licensed practicing school personnel and college or university supervisory personnel.
Traditional route to licensure – An undergraduate program of study or graduate program of study at an institution of higher
education that prepares candidates for licensure as a teacher, special education teacher, school counselor, school administrator, or other school professional. These programs include a supervised clinical experience (student teaching) but the students do not serve as teacher of record while enrolled in the program of study.