educational service delivery - oppaga · educational service delivery ... is linked both to...
TRANSCRIPT

Educational Service Delivery While the Osceola County School Dis rict generally provides effective educational services and programs to its students, there are several areas for improvement. The district should ensure that all programs and services are evaluated and operating from a strategic plan with more specific outcomes, which focuses on mea urable s udent performance targets and cost-efficiency.
t
s t
Conclusion _____________________________________________________
The Osceola County School District (the district) generally offers students efficient and effective educational services and programs, and has had several notable accomplishments, as noted in Exhibit 5-1. OPPAGA has identified a number of improvements that, if implemented, will improve educational service delivery. OPPAGA examined the district’s educational programs based on best practice standards established in the following four broad areas:
• operations of K-12 instructional programs; • acquisition, replacement and disposal of instructional materials; • analysis of performance data and evaluation of educational programs; and • library media and support services.
Exhibit 5-1 The District Has Had a Number of Notable Accomplishments in Educational Service Delivery in the Last Three Years
• We commend the district for its efforts to provide mentoring activities for new teachers, particularly the CoMenTR program in partnership with the University of Central Florida.
• We commend the district for its timely evaluation of ESE students and for using OPS services during the summer to reduce the backlog of evaluations from one school year to the next.
• We commend the district for its efforts in serving Language Enriched Pupils and encourage the continuation of the Dual Language Program.
• We commend the district for its provision of adult and technical education services, particularly the SCORE program which serves students with special needs.
• We commend the district for its support of the new TECO Wireless Program and encourage staff to continue to investigate the possibility of opening this program to high school students.
• We commend the district for its careful attention to ensuring that their newly updated pupil progression plan is linked both to Florida’s accountability standards, to the Sunshine State Standards and is extremely user friendly. The Osceola County 2002 Pupil Progression Plan should serve as a model for the state.
• We commend the district for its careful attention to informing the public of its progress and fiscal responsibility.
• We commend the district for developing their “Grow Your Own” program to address the need for school psychologists.
Source: OPPAGA.
OPPAGA 5-1

Educational Service Delivery
Overview of Chapter Findings __________________________
OPPAGA reviewed the district’s educational service delivery using the Best Financial Management Practices adopted by the Commissioner of Education and associated indicators. The team employed several methodologies to develop chapter conclusions and action plans. For instance, OPPAGA staff conducted on-site interviews with district and school based administrators and visited 12 of 32 schools. OPPAGA staff conducted individual interviews and focus groups with teachers and administrators. In addition, we gathered and evaluated information on policies and procedures relating to educational service delivery activities. To receive additional input, OPPAGA surveyed a sample of 400 teachers and conducted telephone interviews with a sample of 50 SAC members.
An overview of chapter findings is presented below.
District and School Administrators Need to Better Use Data to Improve K-12 Education Programs. 1. District and school administrators need to better use data to improve K-12 education programs.
(Page 5-6) 2. District administrators facilitate sharing effective instructional practices to improve student
performance. (Page 5-13) 3. The district’s Exceptional Student Education (ESE) program, while excellent in some respects, can
improve student performance. (Page 5-15) 4. The district’s provision of effective and cost-efficient instruction as part of its English for Speakers of
Other Languages (ESOL) Program, while good in some respects, has areas of needed improvement. (Page 5-24)
5. The district provides effective adult/technical education programs. (Page 5-28) 6. The district’s curricular framework is linked to Florida’s accountability standards and to the Sunshine
State Standards. (Page 5-33) 7. The district has a plan for the progression of students from kindergarten through grade 12 that
emphasizes remediation and clearly defines retention criteria. (Page 5-34) 8. The district should work with schools to ensure that school advisory council membership represents
the community the school serves. In addition, the district should work with schools to focus their school improvement plans on measurable objectives relating to student performance and strategies to address these objectives. (Page 5-37)
While the district’s procedures for acquiring and disposing of textbooks are cost-efficient, the district’s procedures for collecting fees for lost and damaged textbooks needs to be improved. 9. The district’s process for selecting instructional materials ensures that instructional materials meet the
needs of teachers and students. (Page 5-41) 10. Each student has access to current and appropriate instructional materials in core courses that are
aligned with the Sunshine State Standards and the district’s pupil progression plan. (Page 5-42) 11. While the district’s procedures for acquiring and disposing of textbooks are cost-efficient, the
district’s procedures for collecting fees for lost and damaged textbooks needs to be improved. (Page 5-43)
5-2 OPPAGA

Educational Service Delivery
The district needs to improve performance accountability mechanisms for its education programs, however the superintendent reviews the administrative organizational chart yearly for efficient staff placement and adequate program coverage. 12. The district needs to improve performance accountability mechanisms for its education programs.
(Page 5-44) 13. The superintendent reviews the administrative organizational chart yearly for efficient staff placement
and adequate program coverage. (Page 5-48) 14. The district does a good job of reporting the effectiveness and costs of major educational programs.
(Page 5-50)
The district does a good job of providing library and media materials although current collections need to be updated. 15. The district does a good job of providing library and media materials although current collections
need to be updated. (Page 5-51) 16. The student services department meets the challenge of providing student support services in a
rapidly growing district. (Page 5-53)
Fiscal Impact of Recommendations ____________________
With the exception of one recommendation to automate FCAT data dissemination, there are no recommendations in the Education Service Delivery section containing fiscal impacts.
Exhibit 5-2 Recommendations With Fiscal Impacts Recommendation Five Year Fiscal Impact • The district should make it a priority to implement an
automated web application that will enable teachers and administrators to get real-time FCAT data.
• Expenditure: $6,390
Source: OPPAGA.
Background ___________________________________________________ In 2000-2001, the Osceola County School District enrolled 34,567 students with an ethnic breakdown of 49% White: Non-Hispanic, 37% Hispanic, 10% African American, and 4% other ethnic groups. The district has 32 schools, including alternative education and charter schools, distributed throughout the county’s 1,322 square miles. For Fiscal Year 2000-01, the per pupil expenditures were less than the state average and peer districts (see Exhibit 5-3).
Exhibit 5-3 Osceola County’s Per Pupil Expenditures Are Less Than Peer Districts
District Regular Exceptional At-Risk Vocational School
Operating CostsAlachua $4,511 $7,340 $6,302 $5,261 $5,307 Collier $4,708 $8,722 $5,018 $4,425 $5,475 Lee $4,329 $6,787 $5,794 $4,557 $4,994
OPPAGA 5-3

Educational Service Delivery
District Regular Exceptional At-Risk Vocational School
Operating CostsLeon $4,516 $7,446 $5,522 $4,536 $5,292 Manatee $4,324 $7,339 $4,436 $4,910 $5,016 Osceola $4,097 $7,765 $4,095 $4,464 $4,688 State $4,441 $7,726 $5,424 $4,982 $5,151
Source: Florida Schools Indicator Report 2000-2001, Florida Department of Education.
Curriculum and Instruction In Osceola County, an assistant superintendent for Curriculum and Instruction supervises the district departments that provide services to support schools in their role of educating students. These support services include curriculum development, instructional strategies, school improvement, and administrative/reporting activities. As shown in Exhibit 5-4, the assistant superintendent is responsible for 11 departments that provide these services. The assistant superintendent of Curriculum and Instruction is not directly responsible for how well students are performing. Osceola uses a site-based management philosophy that has school principals primarily responsible for student performance. School principals report directly to the superintendent of schools.
Exhibit 5-4 Eleven District Departments and Several Support Units Perform the District Level Educational Service Delivery Functions
Assistant Superintendent of Curriculum and Instructional Services
Director of Technical and
Adult Education
Research Specialist
Grant Management
Director of Secondary Education
Accounting Clerk
Grant Management
Director of Accountability and Strategic Planning
Clerk Typist
Director of Elementary, PreK, and Extended Day
Project Development
Specialist
Director, Foundation for Osceola Foundation
Instructional Research and Evaluation Specialist
Technician
Accounting Clerk II Elementary/Secondary
Edulog Mapping Specialist
Executive Secretary
Coordinator of Special Programs
Coordinator of East Coast Consortium
Coordinator of Choice and
Charter Schools
Coordinator of Multicultural Education
Coordinator of Planning and
Evaluation
Assistant Superintendent of Curriculum and Instructional Services
Director of Technical and
Adult Education
Research Specialist
Grant Management
Director of Secondary Education
Accounting Clerk
Grant Management
Director of Accountability and Strategic Planning
Clerk Typist
Director of Elementary, PreK, and Extended Day
Project Development
Specialist
Director, Foundation for Osceola Foundation
Instructional Research and Evaluation Specialist
Technician
Accounting Clerk II Elementary/Secondary
Edulog Mapping Specialist
Executive Secretary
Coordinator of Special Programs
Coordinator of East Coast Consortium
Coordinator of Choice and
Charter Schools
Coordinator of Multicultural Education
Coordinator of Planning and
EvaluationSource: Osceola County School District.
Osceola County Has a Diverse Student Population That Is Growing Rapidly Compared to their peer districts Osceola County has a diverse population. The district has more Hispanic students than any of their peer districts and is substantially above the state average. Osceola County has the second highest English for Speakers of Other Languages (ESOL) population in the state, behind
5-4 OPPAGA

Educational Service Delivery
Miami-Dade County. Twenty-two percent of Osceola County’s students are ESOL and 25% of Miami-Dade’s students are ESOL. Osceola County’s percentage of students eligible for free and reduced price lunch, a commonly used poverty indicator, is higher than the state average and is higher than all of it’s peer districts. In addition, Osceola County was the fastest growing school district during the 2000-2001 school year with a 31.33% increase in the number of students attending school.
Exhibit 5-5 Osceola School District’s Student Demographics
District Total Students
Percentage Increase, Fall 1997 - 2001
Percentage Increase State Ranking, Fall
1997 - 2001
Percentage Limited English
Proficient
Percentage Eligible for
Free or Reduce Price
Lunch Alachua 29,686 (1.54%) 47 2% 44% Collier 34,192 24.65% 2 16% 44% Lee 58,384 12.78% 10 12% 43% Leon 32,048 1.10% 41 1% 30% Manatee 36,568 13.48% 8 8% 37% Osceola 34,567 31.33% 1 22% 47% State 2,431,521 8.74% NA 11% 44%
The percentages listed for Limited English Proficient students in each of the peer districts reflects end of the 2001-2002 school year statistics. Source: Profiles of Florida School Districts 2000-01, Florida Department of Education.
The District’s Diversity Presents Challenges in Educating Students In 1997, OPPAGA found that schools serving a large percentage of children from low-income families had significantly lower student test scores than schools serving a small percentage of these students. 1 Although high-poverty schools received more resources per student, they faced greater challenges to improving student performance. These challenges included high student mobility, absenteeism, and disciplinary problems. Excessive student absences and students enrolling in and withdrawing from a school during the year make learning more difficult for students and teaching more difficult for teachers. High percentages of ESOL and new students present similar challenges. Students new to the country as well as Osceola County have not always been following the Sunshine State Standards therefore may not be performing at the same level as the students in Osceola County are required to do. We noted that a critical step to improving student academic performance in high-poverty schools was implementing high expectations for all students. In addition, school principals who exhibited strong leadership behaviors and consistently focused on improving student performance could make a difference in the performance of their schools.
1 Improving Student Performance in High-poverty Schools, OPPAGA Report No. 96-86, June 1997.
OPPAGA 5-5

Educational Service Delivery
Effective and Efficient Programs
1 District and School Administrators Need to Better Use Data to Improve K-12 Education Programs.
The School District of Osceola County has many mechanisms in place for using academic and nonacademic data to improve K-12 education programs. The Planning and Evaluation Department provides district and school administrators a variety of data as well as training in the interpretation of these data. Although district office staff and several schools generally do a good job of using data in their decision-making processes, the district and schools need to improve their use of data to evaluate programs and increase student performance.
Osceola County Lags Behind Its Peers and the State in Most Student Performance Measures Osceola County’s student performance on school grades, receipt of school recognition dollars, Florida’s Comprehensive Assessment Tests (FCAT), and graduation rate is, in most cases, below the state average and its peers. When comparing the academic performance of the Osceola County School District with the performance of other districts it is important – to the extent possible – to consider the characteristics of the student population served by each district. Osceola County School District has the challenge of educating a rapidly growing student population that has high percentages of students that are Limited English Proficient (LEP) and come from economically disadvantaged households. OPPAGA considered these factors and others in selecting the peer districts to compare with Osceola.
The district does not compare well to its peers on its School Accountability Reports. In July 1999, the Florida Department of Education (DOE) established criteria for identifying schools with similar performance characteristics using letter grades, based primarily on the FCAT reading, mathematics and writing scores.
Exhibit 5-6 illustrates Osceola’s most recent school grades compared to its peers. Osceola has the highest percentage of “C” and “D” schools and the lowest percentage of “A” and “B” schools. Only 38% of Osceola County’s schools received a grade of “A” or “B” on the state’s school performance grades, which is substantially lower than their peer districts.
Exhibit 5-6 The Osceola County School District Has Fewer High Performing Schools Than Its Peer Districts
District
Number Of Schools Receiving
Grades
Percentage Of “A” Schools
Percentage Of “B” Schools
Percentage Of “C” Schools
Percentage Of “D” Schools
Percentage Of “F” Schools
Alachua 36 44% 19% 25% 8% 3% Collier 33 42% 12% 21% 18% 6% Lee 55 40% 35% 22% 4% 0 Leon 37 57% 8% 30% 3% 3% Manatee 41 39% 29% 24% 2% 5% Osceola 29 21% 17% 48% 14% 0
Source: School Accountability Report 2001-2002, Florida Department of Education.
5-6 OPPAGA

Educational Service Delivery
Osceola County Received Fewer Schools Recognition Awards Than Peer Districts The School Recognition Program was designed to recognize the high quality of many of Florida's public schools. The program provides greater autonomy and financial awards to schools that demonstrate sustained or significantly improved student performance. Schools that receive an "A" or schools that improve at least one performance grade category are eligible for school recognition.
Based on their school performance grades, four schools in Osceola County received recognition and financial awards for the 2001 School Recognition Program. Each eligible school received $100 per student. Schools containing more than one level, for example grades K-12, received an award only for the level or levels meeting the eligibility criteria. The staff and school advisory council at each recognized school jointly decide how to use the financial award. The awards must be used for nonrecurring faculty and staff bonuses, for nonrecurring expenditures for educational equipment and materials, for temporary personnel to assist in maintaining or improving student performance, or for any combination of these.
Exhibit 5-7 Osceola County Received Fewer Schools Recognition Awards than Peer Districts District Percentage of Schools Receiving Awards Amount Of Award Alachua 33% $1,083,085 Collier 30% $1,006,488 Lee 37% $1,802,925 Leon 56% $1,614,927 Manatee 29% $1,153,293 Osceola 14% $329,206
Source: Florida Department of Education, 2001.
The District Scores Lower on the FCAT Than Its Peer Districts and the State The FCAT Sunshine State Standards Test reports two types of scores. The first is a scaled score that is based on the number of items the student answers correctly. The second is a student achievement level score that is based on the students’ scaled score. Florida has established scale score ranges for each of the five performance levels. Level one is the lowest and students performing at this level have little success with the challenging content of the Sunshine State Standards. Level five is the highest, and students performing at this level have success with the most challenging content and answer most of the test questions correctly. Osceola County School District students do not perform as well as their peer districts on these measures. As can be seen in Exhibit 5-8 the district’s students score lower than most of its peers and the state on the FCAT Sunshine State Standards Test in Reading and Mathematics.
OPPAGA 5-7

Educational Service Delivery
Exhibit 5-8 Osceola County’s FCAT Test Scores Are Lower Than the State and Its Peers, Spring 2002
Reading Mathematics School District Grade 4 Grade 8 Grade 10 Grade 4 Grade 8 Grade 10 Alachua 306/Level 3 300/Level 2 312/Level 2 297/Level 2 312/Level 3 324/Level 3 Collier 295/Level 2 294/Level 2 302/Level 2 295/Level 2 311/Level 3 322/Level 3 Lee 304/Level 3 299/Level 2 301/Level 2 293/Level 2 309/Level 2 318/Level 3 Leon 321/Level 3 313/Level 3 317/Level 2 317/Level 3 322/Level 3 330/Level 3 Manatee 299/Level 3 298/Level 2 304/Level 2 291/Level 2 311/Level 3 323/Level 3 Osceola 284/Level 2 280/Level 2 293/Level 2 283/Level 2 295/Level 2 311/Level 2 State 299/Level 3 295/Level 2 303/Level 2 294/Level 2 305/Level 2 319/Level 3
Source: Florida Department of Education.
The FCAT Writing portions of the test (Formerly known as Florida Writes!) scores are reported on a 1.0 through 6.0 scale. In addition, a student could receive a U (unscorable), which means that the writing is unrelated to the assigned topic or cannot be read. Exhibit 5-9 illustrates that Osceola County students score lower on the FCAT Writing test than the state and its peers in most cases.
Exhibit 5-9 Osceola County FCAT Writing Scores Are Lower Than the State and Its Peers, Spring 2001
Grade 4 Grade 8 Grade 10 School District Expository Narrative Combined Expository Persuasive Combined Expository Persuasive Combined Alachua 3.3 3.6 3.5 4.2 4.0 4.1 4.2 4.0 4.1 Collier 3.1 3.3 3.2 3.7 3.7 3.7 4.0 3.6 3.8 Lee 3.3 3.6 3.5 3.7 3.8 3.8 4.0 3.7 3.8 Leon 3.5 3.6 3.5 4.1 4.0 4.0 4.1 4.0 4.1 Manatee 3.2 3.4 3.3 3.7 3.8 3.7 4.1 3.7 3.9 Osceola 2.9 3.2 3.1 3.4 3.4 3.4 3.6 3.5 3.6 State 3.3 3.5 3.4 3.8 3.8 3.8 4.0 3.7 3.8
Source: Florida Department of Education.
Osceola County’s Student Performance Shows Very Little Improvement and in Some Cases Declines When compared over time, Osceola County shows little improvement in FCAT scores. As seen in Exhibit 5-10 Osceola County’s test scores have remained relatively flat for the past three years. There has been some fluctuation in scores but no substantial gains have been made.
In addition, when FCAT scores are broken out by the percentage of students scoring in each level, more than 50% of students every year in each grade level and subject (except 2002 tenth grade math which is 46%) scored at performance level 1 or level 2, the lowest range. This means that more than 50%, and in the case of 2002 grade 10 reading 72%, of the students in Osceola County Schools are not proficient in the Sunshine State Standards.
As demonstrated earlier in Exhibit 5-9, Osceola County’s current FCAT scores are primarily at level 2. According to State Board Rule, on January 1, 2004, the cut off scores for each performance level (levels 1-5) will be raised. If Osceola County’s FCAT scores do not improve and remain just as they were in 2002, the district average in half of the categories will be level 1. This could cause school grades to drop
5-8 OPPAGA

Educational Service Delivery
and make any students in a school that received an “F” within the previous four years eligible to transfer to a higher performing public school and eligible for school vouchers.
Exhibit 5-10 Osceola County’ Student Performance Over Time Has Mixed Results and More Than 50% of FCAT Scores Are in Level 1 or Level 2
Grade 4 Grade 8 Grade 10 Subject and Year
Level 1
Level 2
Scale Scores
Level 1
Level 2
Scale Scores
Level 1
Level 2
Scale Scores
1999 Reading 42% 18% 278 32% 31% 288 36% 42% 296 2000 Reading 40% 17% 280 36% 32% 282 40% 38% 293 2001 Reading 40% 19% 281 34% 30% 285 36% 34% 299 2002 Reading 38% 16% 284 37% 28% 280 37% 35% 293 1999 Math 41% 34% 291 38% 26% 288 30% 31% 302 2000 Math 33% 33% 302 34% 26% 293 28% 25% 306 2001 Math 38% 28% 293 28% 27% 297 22% 24% 316 2002 Math 39% 28% 296 31% 25% 295 23% 23% 311
In 1999 and 2000 the Math Portion of the FCAT was not given to fourth graders, it was given to fifth graders only. In order to be consistent we have used grade 5 scores in math for 2001 and 2002 as well. Source: Florida Department of Education.
The District Does a Good Job of Disaggregating Student Performance Data, However, May Not Always Be Using It Effectively The Osceola County School District has integrated the DART Model (Data Assess Review Target) into all aspects of planning and instruction. The DART Model is described by the Florida Department of Education as a way to improve school performance through data analysis. Each school is directed to fill out the DART charts by first acquiring FCAT reports for all curriculum students and standard curriculum students from the district office. The DART Model goes on to explain to the school implementing the model that they will need the following reports:
• overall school results on subtests vs. district and state results; • subtest results disaggregated by subgroups for each school; and • overall school results and subgroup results for writing and the percentage of students scoring in Level
1 and above Level 2 and above Level 3 for reading and mathematics.
Each school completes the DART Model on an annual basis and district level administrators complete the model for the district as a whole. Although not specified in the Department of Education manual, Osceola County takes this process one step further by comparing the data across school years. The planning and assessment department plays a critical role in this process by providing the schools and district with the disaggregated data and reports required to complete the DART Model, through aiding in data analysis, and by providing technical assistance to any staff that requests it.
Implementation of this model results in a district-wide method for determining student needs in the areas of curriculum, classroom instruction and assessment. Teachers are able to see exactly which specific areas on the FCAT their students fell short, cross-reference those areas to the sunshine state standards, and adjust their teaching methods. Principals are able to target resources in the areas with the greatest need. Implementation of this model also results in clearer goals for the School Advisory Councils to focus on when composing their school improvement plans.
OPPAGA 5-9

Educational Service Delivery
The DART Model Is Not Always Used To Its Fullest Potential Through focus groups with principals and teachers and interviews with district staff, we learned that the DART Model is not always used to its fullest potential. School staff analyze the data, with help from the Planning and Evaluation Department, as required by the district, but some do not use it as an integral part of their school improvement process. It is important to note that not all schools underutilize the DART Model. We found a number of schools that drive their school improvement processes based on student outcome data.
Automation Needed for Timely FCAT Information Because of the importance of FCAT scores in the evaluation of student progress, it is essential that teachers be provided with accurate and timely FCAT information for each student in each class. It is difficult for the district to provide this information in a timely manner since the information they receive from DOE has to be manually reorganized by class enrollment to make it usable for teachers.
The emphasis on FCAT is a statewide initiative that affects every school district. Districts scramble to provide teachers the tools they need to access the data in a timely manner. The Osceola school district would benefit, as would other districts, from a web application that would allow teachers, administrators and superintendents to access FCAT information in a format that would enable teachers to use the student data to target curriculum to better meet students needs. The most cost-effective solution for the district would be for DOE to provide such an application to all districts. The district should lobby for that solution. However, for now, the district should make it a priority to implement a web application that will enable teachers to get real-time FCAT data.
Interventions Are Made When a School Is in Danger of Failing Although the district curriculum staff cannot require a principal to implement a program or method, they do work very closely with schools that are not performing well. For example, one elementary school has been a “D” school in danger of becoming an “F” school for three years. Schools in this situation are a first priority for intervention by the district and state. This school received a grant and has implemented the Project Child Program.
The district Planning and Evaluation Department also provides additional support to schools in need of assistance. They assist the principal analyzing and interpreting data and the curriculum department helps by providing services such as professional development and curriculum development. Another intervention implemented to help “D” schools to improve student performance is there are three psychologist positions that are funded by the ESE Department assigned to “D” schools. The district has also sought assistance from the state Department of Education’s Bureau of School Improvement and Educational Accountability. According to their staff, they have worked with Osceola County but have been focusing on schools, state wide, at risk of becoming an “F”.
The District Analyzes Data Other Than Standardized Test Scores to Assist Schools The district analyzes more than just FCAT scores to assess student academic performance and improve academic programs. The district also does a school-by-school analysis of student grade point average. The analysis is broken down by race, gender and other sub groups to help district administrators get a clearer picture of the school.
The district also closely examines graduation and dropout rates. Exhibit 5-11 illustrates that Osceola’s graduation rate is the lowest of its peers and the state conversely; its dropout rate is also lower than the state and its peers. According to interviews with staff the low graduation is do in part to a problem with their data collection and report system. Upon finding this anomaly, the district reviewed the data used to calculate the graduation rate for 2001. They found that many schools counted students twice or included students who had moved as dropouts. Since that time the district has provided training and assistance to assure that all attendance clerks are using the same and correct methodology to report graduation rate.
5-10 OPPAGA

Educational Service Delivery
They have taken steps to correct this problem and their efforts should be reflected in the 2002 dropout rate.
Exhibit 5-11 Osceola County’ Graduation Rate Is Below Peer Districts and the State Average District Four-Year Graduation Rate Annual Dropout Rate Alachua 61.2% 6.1% Collier 64.5% 4.2% Lee 65.9% 5.6% Leon 64.2% 3.1% Manatee 65.2% 4.5% Osceola 58.4% 4.2% State Average 63.8% 3.8%
Source: Florida Department of Education, 2001.
The District Also Uses Non-Academic Data as a Measure of School Effectiveness In addition to academic data, the district also analyzes non-academic data such as number of in and out of school suspensions, non-promotions, and dropouts. Exhibit 5-12 illustrates that Osceola County recorded more out of school suspensions, non-promotions, and dropouts than its peer districts. The curriculum department tracks this data as well as parent, student, and community complaints. When a school reports anything out of the ordinary, for example a higher than normal suspension rate, then the district office staff meets with the principal and other relevant school staff to determine the cause for the increase and to help develop a plan to address the reasons for the increase. The district staff will continue to provide support until the situation is completely remedied.
Exhibit 5-12 Osceola County Compares Favorably in Some Non-Academic Areas and Could Improve in Others
District Total Number
of Students Out Of School Suspensions
In School Suspensions Expulsions
Referrals to Court/Juvenile
Authorities Alachua 29,686 11% 4% 0 <1% Collier 34,192 1% 16% <1% <1% Lee 58,384 8% 12% <1% <1% Leon 32,048 6% 7% <1% 0 Manatee 36,568 10% 9% <1% 0 Osceola 34,567 14% 4% <1% <1% State 2,431,521 9% 10% <1% <1%
Source: Profiles of Florida School Districts 2000-01, Florida Department of Education.
Recommendations ___________________________________________
• The district should develop and implement policies promoting the effective use of data at the school level. The district should improve its use of data by identifying strategies that are effective with the population the schools serve, sharing these best practices among the schools, and evaluating their implementation.
OPPAGA 5-11

Educational Service Delivery
The district should make it a priority to implement an automated web application that will enable teachers and administrators to get real-time FCAT data.
•
Action Plan 5-1 We recommend that the district further strengthen the evaluation and accountability component of school-based management. Strategy The district should further strengthen the evaluation and accountability component of
the school-based management. In addition to the review of FCAT results of each school year, the district should establish a mechanism to continually evaluate schools to determine whether progress is being made towards the accomplishment of the goals, especially student achievement goals.
Action Needed Step 1: In addition to the review of results of each school year, the district should establish a mechanism to continually evaluate schools to determine whether progress is being made towards the accomplishment of the goals, especially student achievement goals.
Step 2: If the school is not making adequate progress then district staff must intervene by developing an Academic Improvement Plan for the school. The plan must use data as a basis for any interventions.
Step 3: The school’s Academic Improvement Plan will be implemented with assistance from the district staff.
Step 4: Each school year the plan and the results will be evaluated to determine if interventions will be needed for the following school year.
Who is Responsible Assistant superintendent of Curriculum and Instruction, Curriculum and Instruction Staff, Planning and Evaluation Staff and school based staff.
Time Frame To begin the 2002-03 school year based on 2002 student test scores. Fiscal Impact None
Action Plan 5-2 The district should implement an automated web application that will enable teachers to get real-time FCAT data. Strategy The IT Services Department director should create a task force to develop a plan for
implementing a web application that will enable teachers and administrators to get real-time FCAT data.
Action Needed Step 1: The task force should work with the Florida Department of Education to develop a plan to provide FCAT data to teachers on-site.
Step 2: Propose the plan to the board for funding. Step 3: Develop and test the application. Step 4: Pilot the application to several schools. Step 5: Review the pilot projects and make any necessary adjustments. Step 6: Implement the application district-wide. Step 7: Evaluate the implementation of the application.
Who is Responsible Information and Technology Services Director Time Frame End of school year 2002-03 Fiscal Impact Expenditure: $6,390
Source: OPPAGA.
5-12 OPPAGA

Educational Service Delivery
2 District administrators facilitate sharing effective instructional practices to improve student performance.
The district has an extensive professional development program and uses a variety of strategies to identify and communicate exemplary educational practices and strategies to teachers The district uses a variety of mechanisms to identify and communicate exemplary education practices. These include
• Professional Development Plan tied to the School Improvement Plan; • resource personnel to train teachers; • recognition of teachers who pursue professional development; and • in-Service training, orientation, and mentoring.
Professional Development Plan. Osceola teachers develop, in coordination with their supervisors, a Professional Development Plan, which details goals and aspirations for the year and provides the basis for part of their evaluation. The goals in the Professional Development Plan are tied to each school’s School Improvement Plan, and include goals for student achievement. The plan identifies specific courses or training opportunities that will help the teacher attain their goals, such as attending a hands-on math workshop to help increase math comprehension among students.
Resource Personnel to Train Teachers. Personnel at both the district and school levels serve as resources to teachers. District resource specialists in the major content areas at the secondary school level and district learning resource specialists at the elementary level identify effective teaching methods and train school-based resource specialists. These school based resource specialists provide regular in-service training for teachers in their school. Resource specialists assess teachers’ training needs through discussions and informal requests. Examples of topics include cooperative learning strategies and evaluating writing for the FCAT. In addition, the district uses teacher trainers. District staff select teacher trainers from the teacher ranks based upon their effective use of instructional techniques. Teachers commented in focus groups that the training by both district and school personnel is timely, useful, practical, and easily applied to their classrooms.
Recognition. The district encourages teachers to participate in professional development by recognizing teachers who use best practices.
• Osceola participates in the Teacher of the Year program. • The district conducts an annual Academy Awards of Education in which outstanding educators,
volunteers, and support staff are publicly recognized at a formal gala event. • The district presents thank you letters and formal certificates to teachers acknowledging their
participation and the value it brings to the district.
The district does not normally provide monetary compensation to teachers for taking courses offered through the district training program. However, some training activities, such as Accelerated Reader, Creating Independence through Student-owned Strategies (CRISS), and Dual Language training do generate modest stipends or provide allowances for materials.
In-service training, orientation, and mentoring. Osceola County has an extensive professional development program for both instructional and support staff. As one teacher said, “Staff development opportunities abound.” Examples of professional training classes include Power Writing; COMPASS;
OPPAGA 5-13

Educational Service Delivery
literacy writing; FCAT math, reading, and science; and technology. In addition, the district offers personal development courses for teachers, including weight reduction, Spanish, time management, and stress management.
Classes and workshops are voluntary and usually held during the workday. Generally, teachers use their planning period or attend sessions after school, beyond their usual work day. Teachers also have the opportunity to pursue staff development on Wednesdays, which is an early release day for the students. In addition, some teachers participate in training workshops during the summer. Teachers in our focus groups report that their school administration encourages them to participate in staff development activities.
In addition to the formal district offerings, teachers in our focus groups have noted that their schools provide informal training whereby experienced teachers serve as mentors to new teachers. Teachers also report that they provide informal help and consulting to one another when needed. This informal networking allows for teachers to stay informed and is seen as a way to keep up with professional development.
The district recently introduced an intranet that has increased the efficiency of communicating professional development offerings. Both teachers and administrators find this new system extremely useful. Faculty are able to access the training catalog via the intranet and sign up for courses electronically. Principals and teachers are able to easily access teachers’ training records. Faculty are also informed of training opportunities via a newsletter that they receive monthly in their mailboxes. A sample listing of recently held workshops in the areas of instructional activities, curriculum, and understanding student behavior can be found in Exhibit 5-13.
Exhibit 5-13 A Sample of In-Service Offerings Area Covered Workshop Title
Cooperative Learning The Utilization of Audiovisual Materials in the Classroom
Instructional Activities
Awesome Activities for Mathematics: Targeting FCAT Benchmarks, 6-8 Accelerated Reader for Media Specialists Teaching Reading in Content Areas
Curriculum
Social Studies Behavior Intervention Strategies for Preschoolers Alcohol and Drug Abuse
Understanding Student Behavior
Behavior Management for Exceptional Students Source: Osceola County School District.
The district has a “Preparing New Educators” orientation program for new teachers. This orientation provides mentors as well as assistance in portfolio documentation of teacher competencies. This district-wide orientation for first year teachers includes a series of 12 workshops that cover such topics as classroom management, drug abuse, recognizing child abuse, and ethics. Additional components of the program are portfolio development and a series of classroom observations in which new teachers observe more experienced teachers’ effective instructional techniques.
In addition to the “Preparing New Educators” orientation program, the district has a new mentoring program for all teachers new to the district. This is a partnership program with the University of Central Florida referred to as CoMenTR, Collaborative Mentoring Teacher Renewal. School administrators select mentors for the CoMenTR program from the teaching ranks based upon effective classroom performance.
5-14 OPPAGA

Educational Service Delivery
Some schools supplement the countywide mentoring program with a mentoring program of their own, using school funds to do so. Teachers from these schools report a very successful experience during that first ‘make or break’ year of teaching. They report an environment of caring and support which assists them through the uncertain terrain of being a first year teacher.
Recommendations ___________________________________________
• We commend the district for its efforts in providing incentives and recognition for teachers to identify and effectively use effective instructional practices.
• We commend the district for its efforts to facilitate the sharing of effective instructional practices. The Professional Development Program, the recently developed intranet, and the network of teacher trainers demonstrate that the district is committed to using professional development as a tool to enhance instruction and improve student performance. We commend the district for its efforts to provide mentoring activities for new teachers, particularly the CoMenTR program in partnership with the University of Central Florida.
•
3 The district’s Exceptional Student Education (ESE) program, while excellent in some respects, can improve student performance.
Many aspects of the district’s ESE programs are positive Many aspects of the district’s ESE program are quite good, despite inconsistencies. Notable features of the current programs include
• procedures consistent with federal and state laws; • resource compliance specialists; • identifying ESE students; • timeliness of student placement; • student to teacher ratio; • medicaid reimbursement; and • participation in statewide assessments.
Procedures Consistent with Federal and State Laws. The district’s procedures for identifying and assessing students, developing individual education plans, and providing and coordinating services for ESE students are consistent with federal and state laws. Teachers, parents, or guidance counselors begin the ESE process by referring students for assessment. A Child Study Team, which reviews the case, then assesses students. A four-week period follows in which a variety of interventions and accommodations are made. This is followed by another four-week period evaluation process. If the Child Study Team finds that these attempts prove unsuccessful, the student is then referred for a psycho-educational evaluation with the school psychologist.
OPPAGA 5-15

Educational Service Delivery
Exhibit 5-14 The Child Study Referral Process
Initial Referral Child StudyTeam
InterventionsImplemented
ReferralEvaluation Evaluation PlacementInitial Referral Child Study
TeamInterventionsImplemented
ReferralEvaluation Evaluation Placement
Source: Osceola School District.
The district has incorporated the state’s student performance standards for exceptional students into the curriculum. Using these parameters, the curriculum specialist develops the curriculum that a child follows based on specific elements found in his or her IEP. The curriculum studied by an ESE student is dependent upon the child’s disability and the type of diploma they are seeking. The goal is always for the student to achieve the Sunshine State Standards. The Pupil Progression Plan also includes specific guidelines for performance standards for exceptional students.
Resource Compliance Specialists. To help ensure that policies and procedures are followed, the district has placed a Resource Compliance Specialist (RCS) in each school, whose responsibility it is to oversee and guide the process. The RCSs follow the state Special Programs and Procedures for Exceptional Students distributed by the state Department of Education, a manual which provides guidance in making placement decisions for students. In addition to the state manual, the district has developed an RCS handbook which provides general information, ESE definitions and eligibility criteria, computerized procedures for completing Individualized Education Plans (IEPs), details about staffing and forms, and technical assistance papers covering such topics as temporary placement, permanent placement, and re-evaluation. Teachers in focus groups report that beyond ensuring that all procedures meet federal and state guidelines, the RCS is especially helpful in providing assistance when a teacher is experiencing difficulty with an ESE student. In addition, three district compliance specialists oversee the school-based RCSs and provide additional assistance as needed.
Identifying ESE Students. Students with special needs are identified through the Department of Student Services. The Department of Student Services employs 22 full time psychologists for identifying and assessing students. All referrals – initial, temporary placements, and re-evaluations – are sent to the office of the supervisor of Psychological Services where they are checked for compliance, entered into a database, and assigned to the appropriate psychologist. Each psychologist is provided a list, updated monthly, of the students who have been assigned for them to evaluate. The supervisor meets with each Psychologist individually to review every assignment and to ensure that the evaluations are completed in a timely manner.
Timeliness of ESE Student Placement. The Department of Education is currently considering establishing a 60-day rule for completing psychological evaluations. Based on district records, the median referral time from assignment date to date of evaluation to date sent to ESE is about 58 student days, within the 60 day proposed guideline.
Despite this timely referral of students for ESE, teachers have told us in focus groups that they felt that it took several months for their students to be evaluated. This may be due to a lack of understanding on the part of the teaching staff of the ESE referral procedure. When a child is initially referred for a problem, a series of pre-referral interventions must first be attempted before the child is referred for ESE evaluation. When teachers informed us it took ‘several months’ for an evaluation and placement, they may have been counting the pre-referral activities in addition to the time between actual referral and evaluation. This may be an area in which the district needs to better educate teachers about the overall ESE referral process.
5-16 OPPAGA

Educational Service Delivery
The director of Support Services hires several psychologists during the summer on an OPS basis. This allows the district to continue evaluating students who have been referred for ESE services even though the school year has ended, thereby reducing the backlog of needed evaluations at the beginning of the new school year.
The percentage of ESE students identified and served in Osceola County is less than both its peers and the state averages. The federal Office of Special Education Programs closely monitors overidentification of students with special needs. That the Osceola County school district identifies and serves a lower percentage of disabled students than its peers is an indicator of appropriate identification and referral procedures. However, as Exhibit 5-15 shows, Osceola County identifies considerably fewer of its students as gifted. This may represent an underidentification of gifted students. The district has recognized this as an area for improvement and has established strategies to help increase the referral, evaluation, and identification of more gifted students in the district. For example, the district has hired a school psychologist whose only responsibility is to test for gifted students. In addition, the district has provided training and guidance to principals and school staff to assist them in recognizing students who may qualify for the gifted program.
Exhibit 5-15 The Total Percentage of ESE Students (Disabled and Gifted) Identified and Served in Osceola County Is Less Than Its Peers, 2002 District PK-12 Population Percent Disabled Percent Gifted Total ESE Leon 31,802 20% 7% 27% Alachua 29,599 18% 9% 27% Manatee 38,250 20% 4% 24% Lee 60,661 16% 7% 23% Collier 36,475 15% 3% 18% Osceola 37,744 15% <1% 16%
Source: LEA Profiles, 2002, Florida Department of Education.
While the percent of students with disabilities served in the district is on par with the state average, Osceola County may be underidentifying gifted students in certain ethnic categories. As Exhibit 5-16 shows, while 9% of the overall student population in the district is African American, only 6% of gifted students are in this category. In addition, only 17% of Hispanic students in Osceola have been identified as gifted, while this group represents 39% of the overall student population. The district has recognized this as an area for improvement and continues to strive to increase minority student participation in the gifted program. For example, the district has hired a full time psychologist whose responsibility is to test for giftedness in students.
Exhibit 5-16 Osceola County Schools ESE Student Membership by Racial/Ethnic Category
All Students Students with
Disabilities Gifted Students White 46% 51% 67% Black 9% 10% 6% Hispanic 39% 36% 17% Asian/Pacific Islander 3% <1% 7% Amer. Indian/Alaskan Native <1% <1% <1% Multiracial 3% 2% 3%
Source: LEA Profiles, 2002, Florida Department of Education.
OPPAGA 5-17

Educational Service Delivery
Student to Teacher Ratio. When compared with its peer districts, Osceola County’s Exceptional Student to ESE teacher ratio is well within the range of its peers and is on par with the state average. As Exhibit 5-17 shows, on average, there are 22 exceptional students per an exceptional education teacher.
Exhibit 5-17 Osceola County’s ESE Students to ESE Teacher Ratio Is Within Peer Average
District Exceptional
Education TeachersExceptional Student
Population Ratio Collier 294 6,111 1:21 Lee 639 13,208 1:21 Manatee 376 8,233 1:22 Osceola 245 5,321 1:22 Alachua 322 7,543 1:23 Leon 368 8,562 1:23 Average without Osceola County 400 8,731 1:22 Source: Profiles of Florida School Districts, 2000-2001, Florida Department of Education.
Student Placement. Osceola County places ESE students in the least restrictive environment. The district uses three approaches to educating students with special needs: inclusion, pullout, and self-contained, depending on the needs of the child and the provisions of the Individual Education Plan. Osceola has no special schools exclusively for ESE students. This is in keeping with federal guidelines to serve students with special needs in the least restrictive environment. However, some schools have self-contained classes for the most severely challenged students, such as those with autism. The majority of the ESE population is included in the regular classroom and pulled out for one or two periods, such as for reading and language arts. As Exhibit 5-18 shows, just under half (48%) of students with disabilities are placed in a regular classroom. This is on par with the state average.
Exhibit 5-18 The District’s Regular Class Placement of Students With Disabilities Is About Average for Ages 6-21 Among Its Peer Districts and the State, 2002 District 1999-00 2000-01 2001-02 Alachua 44% 42% 45% Collier 64% 62% 62% Lee 43% 45% 47% Leon 56% 57% 58% Manatee 57% 59% 60% Osceola 52% 52% 48% State 49% 48% 48%
Source: LEA Profiles, 2002, Florida Department of Education.
Medicaid Reimbursement. Osceola County Schools reduces its overall cost in serving ESE students by actively seeking Medicaid reimbursement. The district participates in the Medicaid School Matching Program, a program which provides for reimbursement of direct medical services provided by the school district to individual students, as well as for administrative services devoted to planning, preparing, and supporting the ESE student’s medical and emotional needs. The School District of Osceola County began involvement in this program in 1997 through a pilot program with six other school districts. Initially, claims were made exclusively for ‘fee for service,’ i.e., direct medical services provided by the district. The program was expanded in 1999 to include billing for administrative services. The district has spent considerable time and resources both in making computer systems
5-18 OPPAGA

Educational Service Delivery
compatible with billing requirements and in training therapists and counselors in proper procedures for filing claims.
The district has recently hired an employee dedicated solely to Medicaid billing. With the help of this position, the district has greatly increased the amount of reimbursement it receives for both administrative and direct services it provides to ESE students. Exhibit 5-19 shows the increase in Medicaid funding for both administrative and direct services during the period 1999-2001. For the period 1999-2001, the district has generated a total of over $2.5 million in Medicaid reimbursement funds.
Exhibit 5-19 The District’s Medicaid Reimbursement Has Increased Over the Period 1999-2001
1,053,363
103,583
844,609
403,600
90,79933,311
1999 2000 2001
Year
Am
ount
Rec
eive
d
Administrative Billing Direct Billing
Source Developed by OPPAGA based on data provided by AHCA/Medicaid (School Enrollment and Reimbursement Data 2001, 2000, 1999 Summaries) and Administrative Claiming, Jim Robinson, (Medicaid Program Analysis, 1999, 2000, 2001). Figures for 2001 are for first three quarters only.
The Student Services Department is currently billing for psychological services (including pre-referral activities, evaluations, and staffings), and administrative claiming time study (school nurses, the district guidance counselor, social workers, school relations specialists, and the drug counselor). The Student Services Department is proposing to pursue direct billing for social workers and counselors and continues to train cohorts of Health Assistants at each of the schools throughout the district, thereby increasing those services for which Medicaid can be billed. The district does not, however, currently bill Medicaid for transportation services that it provides to ESE students.
Participation in Statewide Assessments. The district’s participation rate of students with disabilities in statewide assessments in 2000-2001 was about average when compared with its peer districts. As can be seen in Exhibit 5-20, Osceola County School’s participation rate of ESE students in both FCAT reading and math is consistently within the range of its peer districts for grade eight. In addition, the district’s participation rate is higher than the state average in math for 1999-2000 and in math and reading for 2000-01. The participation rate of ESE students in statewide assessments is particularly important given the possibility that some districts may over-identify students with special needs, thereby having their scores dismissed from the school grade which is based largely on students’ performance on the statewide assessments. Since the participation rate of Osceola students is about average among its peers, there is no evidence that this is occurring in Osceola County.
OPPAGA 5-19

Educational Service Delivery
Exhibit 5-20 The District’s Participation Rate of Students With Disabilities in Statewide Assessments in 2000-01 is About Average
Grade 8 – FCAT Reading Grade 8 – FCAT Math District 1998-99 1999-00 2000-01 1998-99 1999-00 2000-01 Alachua 74% 79% 77% 73% 78% 77% Collier 76% 82% 81% 77% 83% 83% Lee 70% 66% 82% 73% 67% 81% Leon 75% 80% 77% 75% 78% 77% Manatee 74% 80% 76% 71% 81% 77% Osceola 67% 76% 81% 68% 78% 81% State 70% 76% 76% 70% 76% 76%
Source: LEA Profiles, 2002, Florida Department of Education.
While many aspects of the district’s Exceptional Student Education Program are positive, student achievement needs to be improved While aspects of the district’s ESE program are positive, such as timeliness of student placement, student to teacher ratio, Medicaid reimbursement, and school-based Resource Compliance Specialists, student achievement needs to be improved. For example, while ESE students taking the FCAT received the same or higher scores than the district’s peers in tenth grade reading and math, the district’s students scored lower than most of its peers in grades 4 and 8 in both subjects.
Exhibit 5-21 Average Scaled Scores of Students With Disabilities Taking the FCAT Are Lower Than Most Peers’ Scores at Most Grade Levels, 2000-2001
FCAT Reading FCAT Math District Grade 4 Grade 8 Grade 10 Grade 5 Grade 8 Grade 10Alachua Students with disabilities Gifted students
236 378
242 369
268 --
252 387
252 376
283 --
Collier Students with disabilities Gifted students
244 387
241 375
266 384
269 384
259 378
290 403
Lee Students with disabilities Gifted students
242 359
239 353
254 —
253 373
248 361
270 —
Leon Students with disabilities Gifted students
273 395
272 386
263 373
285 397
281 386
284 388
Manatee Students with disabilities Gifted students
263 375
244 366
241 367
268 388
258 374
259 375
Osceola Students with disabilities Gifted students
231 371
232 381
261 373
239 381
244 375
282 395
Source: LEA Profiles, 2002, Florida Department of Education.
5-20 OPPAGA

Educational Service Delivery
Another indicator of program success is the rate of in-school and out-of school suspensions and expulsions of students with exceptional needs. A district with lower suspension rates for its students indicates a greater commitment of a district to work with all students despite the sometimes difficult behavior that can lead to student suspension. While the district’s in-school suspension rates for students with disabilities is less than most of its peer districts and the state, as Exhibit 5-22 shows, its rate of out-of-school suspensions is higher than most of its peers and the state average. Moreover, the percentage of students with disabilities that receive out-of-school suspensions (19%) is almost twice that of their non-disabled peers (10%). While this is true for most of the peer districts, school and district administrators need to ensure that students with disabilities are not being suspended for behaviors related to their disability.
Exhibit 5-22 The District’s In-School Suspension Rates for Students with Disabilities Is Lower Than Most of Its Peers and the State; Out-of-School Suspensions Are Higher Than Most of Its Peers and the State; Alternative Placement Rates Are Very Low, 2001
In-School Suspensions Out-of-School Suspensions Expulsions Alternative Placement
District
Students with
Disabilities Nondisabled
Students
Students with
Disabilities Nondisabled
Students
Students with
Disabilities Nondisabled
Students
Students with
Disabilities Nondisabled
Students Alachua 7% 2% 20% 7% 0% 0% 0% 0% Collier 21% 11% 2% <1% <1% <1% <1% <1% Lee 15% 9% 13% 5% <1% <1% 4% 2% Leon 7% 6% 7% 5% <1% <1% 0% <1% Manatee 11% 7% 17% 8% 0% <1% <1% <1% Osceola 9% 2% 19% 10% 0% <1% <1% <1% State 13% 8% 15% 7% <1% <1% <1% <1%
Source: LEA Profiles, 2002, Florida Department of Education.
A final indicator of a program’s success in serving students with special needs is the graduation rate of students with disabilities, particularly those who graduate with a standard diploma. As Exhibit 5-23 shows, the district’s standard diploma graduation rate for special needs students in 2000-01 was lower than all its peer districts as well as the state, though it has increased from 1999-2000.
Exhibit 5-23 The District’s Standard Diploma Graduation Rate for Students With Disabilities in 2000-2001 Is Lower Than the State and All Its Peer Districts District 1998-99 1999-00 2000-01 Osceola 56% 36% 40% Lee 55% 45% 44% Manatee 62% 39% 45% Collier 54% 58% 47% State 66% 56% 51% Leon 0% 63% 58% Alachua 51% 48% 67%
Source: LEA Profiles, 2002, Florida Department of Education.
Osceola County schools face a unique challenge due to their proximity to a large service economy with readily available employment (even for those without a high school diploma). Nonetheless, the district should work diligently to help parents and students raise their expectations and aspirations for more secure future success. Given the mixed success of the district in serving students with special needs, the
OPPAGA 5-21

Educational Service Delivery
district needs to improve its evaluation of its ESE program, particularly looking at student outcomes. Currently, evaluations of the ESE program are completed at the school level. Although some reporting is sent to the district office, ESE students who take the FCAT, for example, are evaluated strictly at the school level. The district should establish mechanisms to systematically evaluate and improve processes through which ESE students are identified and placed, and systematically evaluate student data, particularly suspension and standard diploma graduation rates on a regular basis to ensure that ESE students are not disproportionately suspended and to improve its standard diploma graduation rate for ESE students.
Recommendations ___________________________________________
• We commend the district for placing a resource compliance specialist in each school to help ensure timely compliance with ESE procedures and to serve as a resource for teachers and students.
• We commend the district for its timely evaluation of ESE students and for using OPS services during the summer to reduce the backlog of evaluations from one school year to the next. We recommend that the district begin to track pending referrals at the beginning of each school year, and compare and evaluate these data from year to year.
• We commend the district for pursuing Medicaid billing despite the many challenges. We recommend that the district continue to work to increase its capacity to seek Medicaid reimbursement for both direct services (including transportation, social work, and counseling) and administrative services and ensure that all appropriate personnel receive the necessary certifications as required by AHCA. [For the Action Plan to pursue Medicaid billing for transportation services, please see Action Plan 12-4].
• We recommend that the district take additional steps to ensure teachers are familiar with referral processes and procedures to help ensure that there will be fewer inappropriate referrals and to ensure that teachers possess a greater understanding of the timelines involved in the overall referral process.
• We recommend that the district continue to focus its efforts to increase the number of Hispanic students identified as gifted.
• We recommend that the district regularly review student outcome data of ESE students, particularly non-academic achievement data such as suspension rates and implement strategies to ensure that disabled students are not being suspended from school for behaviors related to their disability. We recommend that the district evaluate its diploma data for ESE students and develop a plan to ensure that more ESE students pursue and obtain a standard diploma. This will involve establishing mechanisms to increase involvement of parents of ESE students.
•
Action Plan 5-3
Systematically evaluate ESE processes and develop procedures to improve effectiveness. Strategy Systematically evaluate ESE processes and procedures, including tracking pending
referrals. Establish mechanisms to increase the capacity for Medicaid reimbursement, educate teachers about the referral process, and improve the representation of minorities identified as gifted.
5-22 OPPAGA

Educational Service Delivery
Action Needed Step 1: Track pending referrals from one year to the next and establish mechanisms to reduce any backlog.
Step 2: Continue to maximize Medicaid reimbursement, seeking cost recovery for transportation, nursing, and social work. When the state approves reimbursement for case management, incorporate into district cost recovery program.
Step 3: Develop a plan to ensure that school personnel possess a greater understanding of the timelines involved in the referral process.
Step 4: Within state guidelines, establish mechanisms to improve the representation of minority students identified as gifted.
Who Is Responsible Pending referrals: associate superintendent for School Services, director of Student Services, supervisor of School Psychologists; Maximize Medicaid: associate superintendent for School Services, director of ESE, coordinator of ESE, director of Student Services, director of Transportation, principals; Understanding timelines: associate superintendent for School Services, director of Student Services, supervisor of School Psychologists, director of Professional Development, all school psychologists, district guidance counselor, Administrative Team at each school; Minorities identified as gifted: associate superintendent for School Services, ESE director, psychologist for evaluating for giftedness.
Time Frame August - December 2002; ongoing, thereafter. Fiscal Impact Can be attained with existing resources. For a discussion of transportation cost recovery,
see Action Plan 12-4. Action Plan 5-4 Systematically evaluate student data and establish mechanisms to improve student outcomes. Strategy Review academic and non-academic student data, including rates of suspension of ESE
students from middle and high schools and student diploma data Action Needed Step 1: Develop systems to reduce the out-of-school suspension rate for students with
disabilities and to ensure that students with disabilities are not being suspended for behaviors related to their disability.
Step 2: Develop a plan to increase the number of ESE students who pursue and obtain a standard diploma, including training of guidance staff, ensuring use of effective learning strategies by teachers, and increasing parent involvement.
Step 3: Review and modify strategies based on student data on a quarterly basis. This review should include analysis of data for trends (by school, grade level, other pertinent information).
Step 4: Summarize data and training in annual report to associate superintendent for School Services
Who is Responsible Suspension rates: director of ESE, all principals and school-based administrative teams at each school; Student diploma data: associate superintendent for School Services, ESE director, coordinator of ESE, All principals and school-based administrative teams.
Time Frame June 2002 – January 2003; ongoing thereafter. Fiscal Impact This can be attained with existing resources.
OPPAGA 5-23

Educational Service Delivery
4 The district’s provision of effective and cost-efficient instruction as part of its English for Speakers of Other Languages (ESOL) Program, while good in some respects, has areas of needed improvement.
The English for Speakers of Other Languages (ESOL) Program serves students whose first language is not English or who come from homes in which a language other than English has had a significant impact on their level of English Language Proficiency. The Osceola County School District has the second highest percentage (22%) of students who are Language Enriched Pupils (LEP) in the state. The program serves over 8,000 school-age students. As Exhibit 5-24 shows, the percentage of students receiving ESOL services is twice that of the state and considerably higher than any of the districts used for comparison in this study. Students in Osceola schools speak 83 different languages.
Exhibit 5-24 Osceola County Has the Highest Percentage of Students That Are Identified Language Enriched Pupils Among Its Peers, and Twice That of the State, 2000-2001
School District Student Enrollment
Number of Students with Limited English
Proficiency
Percent of Students with Limited English
Proficiency Leon 33,428 313 1 Alachua 32,422 728 2 Manatee 40,577 3,419 8 State 2,636,118 290,024 11 Lee 64,236 7,768 12 Collier 38,478 6,192 16 Osceola 39,542 8,543 22
Source: Florida Department of Education, Office of Multicultural Student Language Education.
The district’s policies and procedures are consistent with federal and state laws The district’s procedures for identifying students eligible for ESOL programs are consistent with federal and state laws and the Multicultural Education Training and Advocacy (META) agreement. Osceola’s Language Enriched Pupil (LEP) Plan, which has been approved by the Department of Education, addresses services, procedures, and policies regarding LEP students. Topics covered in this document include identification of LEP students, placement procedures, ESOL program and services, equal access procedures, reclassification procedures, parent leadership council, ESOL programming, home/school communication, and monitoring procedures of program compliance.
The school board of Osceola County has created and approved a school-based position in every school known as the ESOL Compliance Specialist (ECS). The ECS is responsible for identifying, assessing, and monitoring LEP students and ensuring that they receive services in a timely manner. In focus groups, teachers have noted that in addition to their monitoring function, ECSs have been very helpful in providing assistance and in reinforcing instructional strategies that are effective with ESOL students. In addition to ECSs, some schools also have ESOL assistants available in every room to assist teachers.
Professional development for teachers of ESOL students The district offers ESOL training to teachers that leads to ESOL endorsement, or certification to teach ESOL students, as required by the state. Depending on grade level and subject area taught, teachers must
5-24 OPPAGA

Educational Service Delivery
complete 18, 60, or 300 hours of ESOL training. Based on focus groups, teachers have found many of the strategies learned during these in-service activities very useful, not only for their ESOL students, but for all students.
The district’s ESOL curriculum provides students opportunities for specialized instruction combined with meaningful integration into all-English instructional environments. Subject area teachers instruct LEP students using the corresponding district curriculum that follows the Sunshine State Standards. The instructional personnel provide students appropriate and individualized instruction through the use of ESOL teaching strategies, appropriate instructional materials, curriculum modifications, and testing modifications.
Special features of the district’s ESOL program An especially notable feature of the Osceola County School District is its Dual Language Program. The district is host to three schools that offer this special program. In this bilingual program that is open to both English- and Spanish-speaking students, students have one English-speaking teacher and one bilingual teacher in addition to a bilingual assistant. Language arts instruction is provided in the native language. The remaining core classes are switched alternately between English and Spanish for science, social studies, and math, thus allowing the students to gain instruction alternately in both languages. In addition, there are special celebrations throughout the year, such as a Christmas celebration with traditional Spanish customs and foods.
Parents enroll their child in the program at kindergarten and sign a contract in which they make a six-year commitment. At the end of the first semester of first grade, no additional English-speaking students are admitted into the program, though Spanish-speaking students are allowed to enroll. Students are paired up to translate for each other. Teachers generally do not translate for the students in the Dual Language program.
The program is funded by a federal grant of $2.6 million over five years. Two schools in the district are participating through this grant. They are currently in their second year of the grant. The district is funding the fifth grade since only K-4 is covered under the terms of the grant. In addition to the grant-funded programs, one other school in the district offer a Dual Language Program, doing so without a grant by using money from the school’s own budget.
Placement of students in ESOL program The Osceola County School District uses a variety of approaches to help ESOL students succeed, including inclusion, self-contained instruction, and home language instruction. The school board-approved LEP plan provides for the implementation of the self-contained or inclusion models in K-5 to insure the meaningful integration into all English instructional environments and as a way to save costs on the salaries of pullout teachers.
The length of time a student spends in an ESOL program is one indicator of program effectiveness. Exhibit 5-25 compares the length of stay of ESOL students in the program at Osceola with its peer counties in Florida. As can be seen in the table, Osceola students are exiting the ESOL program more quickly than most of its peer districts for the period 1998-99 through 2000-01 and more quickly than both the peer average and the state average based on 2000-01 figures. Moreover, the time Osceola students spend in the program has been decreasing over the past three years.
OPPAGA 5-25

Educational Service Delivery
Exhibit 5-25 Osceola County’s LEP Students Are Served in ESOL Programs for a Shorter Length of Time Than Most of Its Peers and the State
Overall Average by Year School District 1998-99 1999-00 2000-01 Alachua 1.58 1.86 1.84 Osceola 2.33 2.17 2.12 Leon 2.38 2.16 2.17 Collier 2.11 2.29 2.49 State 2.78 2.97 3.09 Manatee 3.13 3.14 3.16 Lee 3.23 3.36 3.46
Source: Florida Department of Education, Office of Multicultural Student Language Education.
ESOL student performance is mixed when compared with peer districts Student performance on various academic assessments and non academic measures provide an indication of how well the district is accomplishing its goal of educating ESOL students. Academic assessments include the Florida Writing Assessment and the FCAT.
Academic Assessments. In a recent administration of the FCAT Writing test, ESOL students in Osceola County scored better than only one of its peers on the Persuasive section of the Grade 10 test (see Exhibit 5-26). For the Expository section of the Grade 10 test, Osceola students scored as well or better than four of its peers and higher than the state average. However, on both the Expository and the Narrative/Persuasive sections of the Grade 4 and Grade 8 tests, Osceola students in the ESOL program generally scored less well than their peers and the state average on both sections.
Exhibit 5-26 Performance of Osceola County’s LEP Students Enrolled in LEP Classes Is Mixed When Compared With Its Peers and the State on FCAT Writing 2000-2001
Average Score Expository Narrative/Persuasive
School District 4 8 10 4 8 10 Alachua 2.7 3.5 3.0 2.9 2.3 3.1 Collier 2.8 3.0 2.8 2.7 2.9 2.7 Lee 3.0 3.0 3.0 3.2 2.6 2.8 Leon 3.3 4.4 3.5 2.9 3.9 2.8 Manatee 3.4 2.7 2.6 3.0 2.5 2.6 Osceola 2.8 3.0 3.2 2.5 2.4 2.5 State 3.0 2.9 2.9 2.9 2.6 2.6
Source: Florida Department of Education, Office of Multicultural Student Language Education.
The gap between LEP and non-LEP students is apparent when analyzing FCAT reading and math data. As Exhibit 5-27 shows, Osceola County LEP students perform less well than non-LEP students and the state average of the FCAT reading and math. Eighty-five percent of LEP students in Osceola County scored below Level 3 on the reading portion of the Grade 4 FCAT compared with only 39% of non-LEP students. In addition, this percentage is higher than the state average for LEP students for that test. Similarly, in Grades 5, 8, and 10, the district’s LEP students overwhelmingly scored below 3, and in one
5-26 OPPAGA

Educational Service Delivery
case, eighth grade reading, 100% of LEP students failed to score 3 or better. The average percentage of LEP students statewide scoring less than 3 on the FCAT tends to be high (the range is 81% to 98%). Nonetheless, the gap between LEP and non-LEP students in Osceola County is a considerable one.
Exhibit 5-27 Osceola County LEP Students Perform Less Well Than Non-LEP Students and the State Average on FCAT Tests, 1999-00
Indicator
District Students in LEP
Program >2 Years
State Students in LEP
Program >2 Years
District Non-LEP Students
State Non-LEP Students
FCAT – Grade 4 Reading (%<3) 85% 82% 39% 45% FCAT – Grade 5 Math (%<3) 92% 81% 57% 47% FCAT – Grade 8 Reading (%<3) 100% 96% 57% 52% FCAT – Grade 8 Math (%<3) 94% 85% 48% 40% FCAT – Grade 10 Reading (%<3) 98% 98% 72% 66% FCAT – Grade 10 Math (%<3) 92% 84% 41% 47%
Source: Osceola County School District.
Nonacademic Data. Additional indicators of a program’s success in serving LEP students include nonacademic data such as the rate of graduation, dropout rate, and retention rate. As Exhibit 5-28 shows, fewer Osceola students who have been in the LEP program for more than two years graduate when compared with their non-LEP peers and more LEP students drop out of school than their non-LEP counterparts. Moreover, more LEP students are retained than non-LEP students.
Exhibit 5-28 Osceola County LEP Students Perform Less Well on Most Indicators Than Non-LEP Students and the State Averages, 1999-00
Indicator
District Students in LEP
Program >2 Years
State Students in LEP
Program >2 Years
District Non-LEP Students
State Non-LEP Students
Graduation Rate 25% 32% 60% 66% Drop Out Rate 7% 7% 6% 4% Retention Rate 8% 8% 6% 6%
Source: Osceola County School District.
Recommendations ___________________________________________
• We commend the district for its efforts in serving Language Enriched Pupils and encourage the continuation of the Dual Language Program.
OPPAGA 5-27

Educational Service Delivery
We recommend that the district continue to evaluate the effectiveness of its ESOL program, particularly focusing on student performance measures (FCAT and Writing Assessment) and other outcome measures such as graduation rate, retention rate, and dropout rate and establish mechanisms to improve ESOL student performance in these areas.
•
Action Plan 5-5
Conduct Systematic Evaluation of the ESOL Program Strategy Evaluate the effectiveness of the ESOL program at the school and feeder pattern levels
and establish mechanisms to improve ESOL students’ academic and nonacademic performance.
Action Needed Step 1: Analyze academic and nonacademic data for ESOL students, disaggregated by school to determine trends or patterns.
Step 2: Based on this analysis, establish mechanisms targeted specifically to improve ESOL student performance (both academic and nonacademic). Ensure that teachers are adequately trained in ESOL strategies and are using these effectively. Be sure that appropriate support mechanisms are in place for ESOL students and that all students and their families are actively encouraged to participate in these.
Step 3: Continue to monitor ESOL student performance and make program and policy decisions based on data trends and performance results.
Step 4: Report annually to assistant superintendent of Curriculum and Instruction. Who is Responsible Coordinator of Multicultural Education, ESOL Compliance Specialist, Multicultural
Education Committee. Time Frame July-November 2002; ongoing, thereafter. Fiscal Impact This can be attained with existing resources.
5 The district provides effective adult/technical education programs.
The district’s Adult Education and Technical Education Office provides a variety of education and career options for its secondary and post-secondary students
Technical programs for secondary and post-secondary students Technical training for both adults and high school students is provided at the Technical Education Center / Professional and Technical High School, known as TECO/PATHS. Established in 1994, TECO is a state-of-the-art facility with over two dozen programs for both high school and adult students. It provides initial workforce development for new careers, continuing workforce education training, continuing education in licensure programs, and workplace training for local businesses and industries. Technical career programs are offered in the areas of business technology, health sciences, industrial technology, and public service.
Initially a post-secondary technical center, TECO began serving high school students in 1999. Known as the Professional and Technical High School (PATHS), the student body is drawn from throughout the district. Following their freshman year, students enroll in both academic and technical courses. Each tenth through twelfth grader takes two academic and two technical classes. Students may take a fifth period, and provided all academics are completed by the end of the eleventh year, may enroll full time in a technical program (for example, the LPN program) during their senior year.
5-28 OPPAGA

Educational Service Delivery
Secondary programs In addition to these program offerings, the district provides numerous internship opportunities for high school students who wish to pursue technical careers. These include
• Works Academy, • Project Wings, and the • Project Intern Program.
These alternative programs provide a business internship experience for high school students who are at risk for dropping out. They are the result of a partnership between Osceola District Schools and several corporate sponsors. Works Academy provides students an internship experience with Hyatt hotels, and Project Wings partners with the Greater Orlando Aviation Authority and HMS Host. Project Intern targets graduating juniors who need one-half to one credit in order to graduate with their class. Project Intern partners include Publix Supermarkets, Wal Mart Supercenter, Kissimmee Utility Authority, Florida Hospital, Osceola Regional Hospital and HMS Host at Canoe Creek Plaza and Turkey Lake Plaza. Additionally, Osceola district schools offers the Executive Internship Program to college bound seniors. This provides dual enrollment credit with Valencia Community College and gives real work experience to help students make decisions about future educational and career plans.
In addition, the district has an unpaid internship for students in the Exceptional Student Education Program. Known as the SCORE program, these internships provide students with real work experience and an opportunity to develop work-related skills. Approximately 50-60 students from four high schools participate each year. Each school has a resource person who serves as a liaison, maintains paperwork, ensures that transportation is available for students, convenes bi-monthly meetings of the local transition development team, and helps facilitate the student’s transitioning to the community.
Students in these internship programs receive support and skills training, while the business and community benefit by having a trained, motivated workforce and ensuring the best possible return on their education tax dollars. The objective is to keep students in school until they graduate with marketable skills. Local businesses provide opportunities for students to develop employability skills through weekly on-site learning experiences. The district has found that participation in these programs reduces the dropout rate, increases school attendance, enhances student’s self-esteem, and improves student’s employability skills.
Post-secondary programs Adult students are largely served at Community High School. Programs for adults include Adult Basic Education classes, support for those pursuing the GED, and ESOL classes. Given the very large population in Osceola County for whom English is not the first language, ESOL is the largest component of the Adult Education Program and comprises five distinct levels. Those on the waiting list for ESOL classes have numbered as many as 800 persons. Community High School also serves as an official GED test site for Osceola County and provides basic skills remediation for students who do not meet requirements for entry into technical and other post-secondary programs. In addition, staff coordinates testing for the GED exit option program located on the Community High School campus. The Opportunity Center, a community-based center funded through a grant, serves adults with disabilities. The district also provides programs at the Osceola County Jail and at worksite locations throughout the county, and holds evening classes at elementary schools and community centers. Community education is largely provided through the city rather than by the district.
Middle schools outreach In addition to adult and secondary education programs, the district provides support and assistance to middle schools that implement the Exploratory Technical Program. This program provides enhancement
OPPAGA 5-29

Educational Service Delivery
money and curriculum materials to schools to help students at the middle school level explore possible careers in the broad fields of business technology, family and consumer sciences, and technology/ industrial arts.
The district actively involves partners from business and industry, postsecondary education institutions, and labor organizations in the planning, programming and evaluation of its programs
Partnerships with business and industry Osceola County schools actively encourage participation by the business community in planning and evaluating its programs. Staff from the Technical Education Center (TECO) meet regularly with industry advisory groups for all programs, such as nursing, criminal justice, construction trades, business technology, and wireless. These groups advise on all manner of program aspects and serve as a ready conduit of information. For example, minutes from a recent meeting held with the Health Advisory Board indicate that a particular health care institution in the area was still recruiting for health care workers to cover certain shifts.
Another example of active partnership between the district and the business community is the TECO Wireless Program. The result of a partnership with businesses such as Microsoft and Absolutely Wireless, this new, nine-month Wireless Communication Technology program uses a combination of industry-recognized certification courses combined with other instruction. These companies have provided considerable initial support as well as on-going feedback throughout the process of planning and implementation. The program includes 1,050 hours of instruction and offers internships to students. Business partners have been so impressed with the program that they have already expressed interest in hiring its graduates.
The district also has a thriving relationship with the apprenticeship community. For example, TECO contracts with FEAT (Florida Electrical Apprenticeship and Training) to provide the instruction, while TECO provides the space. TECO and FEAT share the training costs. Through the Academy of Construction Technology (ACT), Osceola County partners with Orange and Seminole counties and Seminole Community College whereby TECO houses the construction programs for all three counties. The program brings together contractors from throughout the three counties. In turn, students are connected to contractors all over the tri-county area, providing internship experiences for students. In the electrical wiring program, students complete one or two Occupational Completion Points and then enter an apprenticeship program that continues to grow in size.
Partnerships with postsecondary education institutions The district also partners with postsecondary education institutions. In addition to those already mentioned, there is a special program with Valencia Community College whereby students from the Licensed Practical Nurse (LPN) Program at TECO can bridge into the Registered Nurse (RN) Program at Valencia. Students who successfully complete the TECO program perform much better in the RN program than their peers who did not attend the LPN program. In addition, a student who successfully completes the LPN program at TECO can bypass the waiting list for the Valencia RN program thereby reducing the overall time it takes to complete their education.
The district explores new options In addition to the many partnerships that already exist, the district continues to explore additional opportunities for partnering. For example, the district is currently investigating the possible articulation of their auto mechanic program with Seminole Community College.
The district is sensitive to the needs of the community and makes program adjustments as necessary. For example, in response to the needs of the local community, Osceola District Schools applied for and
5-30 OPPAGA

Educational Service Delivery
received a Florida Department of Education Adult Education Geographic Allocation Grant for 2001-02. This award, in the amount of $114,671, is being applied to adult education in the district to encourage students to pursue ABE, GED, literacy, and English for Speakers of Other Languages instruction. The target population is 17-year-olds who have dropped out of high school, male and female Osceola County jail inmates, adults wishing to increase their basic skills to qualify for vocational, technical, and community college programs, adults 18-70+ who wish to earn a GED, and residents who speak languages other than English and need to learn or improve their English to succeed in today’s economy.
In another example, in response to the large number of applicants, TECO sought to expand its LPN program. As part of the process to add a third, night class to accommodate their students, the district was required to submit a request to the Board of Nursing. The process, which took about one year, also involved determining clinical availability in the region. Thus, before expanding a given program, the district determines not only need but also likelihood of available local employment for its graduates, as well.
The district assesses the effectiveness of its programs using a variety of measures The district uses the data maintained by the Florida Education and Training Placement Information Program (FETPIP) system as one way to assess the effectiveness of its programs. The FETPIP system is a state data collection system that obtains follow-up data on former students. This information includes employment, continuing post-secondary education, military service, public assistance participation, and incarceration data.
As Exhibit 5-29 shows, the district has a higher percentage of placements than both the state and all of its peer districts for postsecondary vocational students. However, as the exhibit also shows, Osceola has the lowest placement rate for its secondary vocational students. When asked about this placement rate, the district responded that because the state is encouraging all students to pursue post-secondary education, the secondary career programs have been de-emphasized in recent years. The district also noted that if the state were to offer an incentive similar to that of post-secondary education, districts would be in a better position to focus their resources in this area.
Exhibit 5-29 Osceola has a Higher Percentage of Placements Than the State and Most of Its Peers For Its Postsecondary Vocational Students, But Has the Lowest Placement Rate for its Secondary Vocational Students, 2000
Placement Rate School District Secondary Postsecondary Alachua 88% -- Leon 95% 63% Collier 82% 76% Manatee 85% 76% State 86% 76% Lee 84% 82% Osceola 82% 87%
Source: Florida Education and Training Placement Information Program, 1999-2000.
Workforce development education programs are funded by a formula based on both need and performance. Each district receives 85% of its previous year’s appropriation as a base allocation. The remaining amount, up to 15%, is based on performance outputs and performance outcomes. Performance outputs measure achievement in the level of student skills and program completion. Performance outcomes measure student placement in the workforce. Outputs and outcomes are each assigned
OPPAGA 5-31

Educational Service Delivery
performance points. In terms of appropriations, Osceola had the second greatest gain among its peer districts in 2001-02.
Exhibit 5-30 Osceola’s Workforce Development Education Appropriation Has the Second Greatest Gain of All its Peers, 2001-02
School District Vocational
Performance $
Adult General Education
Performance $ Gain/Loss $ Lee $1,025,222 $372,976 $5,786 Collier $500,183 $338,847 $29,325 Alachua $0 $291,084 $87,875 Leon $607,996 $315,856 $100,824 Osceola $461,782 $271,767 $138,945 Manatee $667,637 $657,315 $616,603
Source: 2001-2002 Workforce Development Education Fund, Final WDEF Allocation, April 28,2001.
In addition to FETPIP data, the district relies on advisory committee recommendations to assess program needs. As noted earlier, each trade group has an advisory committee that meets with school staff regularly to discuss program status and needs. The district focuses on high wage and high need areas of employment. When a program no longer meets these criteria, it may be eliminated. For example, the child care program was recently removed because it was not leading to high wage employment opportunities for graduates. Commercial art was likewise eliminated because placement rates were too low. Conversely, due to input from advisory committees, several programs have been added recently, including pipe trades, automotive, and wireless technology.
The district tracks the success rate of its students. For example, for the 2000-01 school year, 97.9% of the students who participated in COMPACT, the business internship program for students placed at risk, remained in school. A full 30% of COMPACT students were awarded perfect attendance in the program. Moreover, the average student GPA prior to entering the program was 2.16. The average student GPA after completing the COMPACT program was 2.46. For the period 1999-2001, 274 students completed the program. The program graduated 120 students, 38 of whom continued on to community college or public university and 13 of whom went on to a trade school or a technical institute.
Recommendations ___________________________________________
• We commend the district for its provision of adult and technical education services, particularly the SCORE program which serves students with special needs.
• We commend the district for its support of the new TECO Wireless Program and encourage staff to continue to investigate the possibility of opening this program to high school students.
• We commend the district for its high placement rate of postsecondary graduates. We recommend that the district continue to evaluate its technical programs for secondary students and develop mechanisms to improve placement rates for students in this group.
•
5-32 OPPAGA

Educational Service Delivery
Action Plan 5-6
Improve Placement Rate for Secondary Students in Technical Programs Strategy Evaluate the district’s technical programs for secondary students and develop
mechanisms to improve placement rates for students in this group. Action Needed Step 1: Analyze placement data for secondary students, disaggregated by program and
course of study. Step 2: Determine trends or patterns and develop a plan detailing effective strategies
to improve student placement based on analysis. Step 3: Implement strategies based on analysis. Ensure that teachers are properly
trained, materials are current and appropriate, delivery is relevant to student needs, and courses of study lead to readily available employment.
Step 4: Monitor the implementation of the new procedure, evaluates its effectiveness, and takes steps to improve its effectiveness based on this evaluation.
Step 5: Consider the use of mentoring to help students complete program and find employment in their field.
Step 6: Reemphasize the secondary program by committing resources to these programs.
Who is Responsible Director of Technical and Adult Education, technical resource specialist. Time Frame August 2002; ongoing, thereafter. Fiscal Impact This can be attained with existing resources.
6 The district’s curricular framework is linked to Florida’s accountability standards and to the Sunshine State Standards.
The district aligns curriculum guides, textbooks, and other instructional materials with the Sunshine State Standards and district-level benchmarks. The district reviews and updates curriculum guides on the same schedule as the state textbook adoption schedule. When a textbook has been selected for adoption, curriculum guides are created or updated to match the new textbook as well as any changes that may have been made to the standards since the last adoption.
The curriculum guides contain a description of the core curriculum at a glance with the Sunshine State Standards listed by subject area with benchmarks. This overview is followed with a listing of grade-level expectations, examples of cognitive questions for the benchmark, and learning strategies for ESOL and ESE students. Examples of vocabulary the students need to be familiar with to meet the benchmark are also included. In middle school math, for example, vocabulary words such as ‘absolute value,’ ‘decimal,’ and ‘fraction’ are listed. In some cases, vocabulary lists have been produced in Spanish, as well as in English. Each guide also provides detailed grade expectations, examples, and specific learning strategies for each benchmark in each subject area.
After the curriculum guide has been developed, the district distributes and conducts training on their guides to all teaching staff. In addition to regular curriculum offerings provided through the Professional Development Office throughout the year, resource teachers are available to visit schools as needed to provide additional training and support. In some cases, district Leadership Teams, composed of one representative from each school are established to train teachers at each school in the standards, benchmarks, and best practices of a particular level and subject area (for example, district Math Leadership Team for grades 3-5).
OPPAGA 5-33

Educational Service Delivery
The district makes an effort to inform teachers and families of students with special needs about the various diploma options for ESE students and how the curriculum leading to these articulate with the Sunshine State Standards. The Exceptional Student Education Department provides teachers and assistants with documents addressing the Sunshine State Standards for Standard Diplomas and Sunshine State Standards for Special Diploma. The documents include State Standards for Special Diploma, Florida Course Descriptions for Exceptional Student Education Grades 6-12, Diploma Decisions for Students with Disabilities, Accommodations-Assisting Students wit Disabilities: A guide for Educators, Sunshine State Standards K-12, ESE Instructional Manager (CD-ROM), and the Florida Course Description Database (CD-ROM).
To ensure that the district provides sufficient assistance to teachers for designing instruction to meet the Sunshine State Standards, the district distributes staff development calendars and flyers to every instructor and assistant, as well as to other related school personnel. In addition, the district presents an estimated 75 workshops each school year covering topics such as Modifications and Accommodations for ESE Students, Adaptations for Students, Precision Teaching, Inclusions, ESE Overview of Curricular Issues, and other program specific training.
Recommendations ___________________________________________
• We commend the district for its careful attention to ensuring that their curricular framework is linked both to Florida’s accountability standards and to the Sunshine State Standards. We commend the district for its attentiveness to the curricular needs of its students with special needs and students with limited English proficiency.
•
7 The district has a plan for the progression of students from kindergarten through grade 12 that emphasizes remediation and clearly defines retention criteria.
The district’s pupil progression plan meets state requirements and includes policies related to evaluating student performance and prohibiting social promotion We interviewed district staff and reviewed the current pupil progression plan and its recently revised version. The district has revised its current pupil progression plan and the school board is expected to approve it in July 2002. While the current plan has the required parts, the revised plan is better organized in a manner that is easy to use.
Florida requires school boards to establish a pupil progression plan that is based on an evaluation of how well the student masters the performance standards approved by the state board. In addition, the district’s plan must be based on local goals and objectives that are compatible with the state’s plan for education. Pertinent factors considered by the teachers before recommending that a pupil progress from one grade to another shall be prescribed by the district school board in its rules (s. 232.245, Florida Statutes).
The district’s revised plan is organized into three sections, Elementary, Middle, and High School. Each section describes in detail the provisions required for a student to progress through the school system. The district’s revised plan also includes statements articulating the goal and mission of the district as well as its commitment to maximizing students’ potential. The district’s pupil progression plan complies with state regulations including those pertaining to the subjects below.
5-34 OPPAGA

Educational Service Delivery
• Student performance standards (Sunshine State Standards) • Career awareness • Non-discrimination • Health education and substance abuse prevention • Accelerated grade placement • County Level Special Placement Committee and its communication with parents • Promotion and retention • Placement criteria • Referral procedures • Out-of-school youth • Minimum levels of performance on statewide assessments • Remediation activities • Alternative placements • Extended learning opportunities
Of particular importance, the revised plan includes the state’s prohibition against social promotion and requires that students who do not meet established expectations receive intensive remedial assistance, including being retained in an intensive program different from what they received the previous year. The district has articulated specific factors that are to be considered by teachers. For example, the elementary school section explains, the system for informing parents of their child’s progress, the process for determining if a student is promoted or retained, the interventions required if a student is behind and the assessments available to assist in determining if a student should be retained. The entire process is explained in the form of a matrix detailing every step and option based on several factors. Exhibit 5-31 is an example of an end of year decision-making matrix.
OPPAGA 5-35

Educational Service Delivery
Exhibit 5-31 Reading, Writing And Mathematics End-Of-Year Decision Making
romotion – Remediation – Retention P Grade Four
Factors to Consider When Decision Making Decisions for Next
Year Classroom Performance
Student Performance
Level
FCAT-SSS
Reading & Math
FCAT-NRT
Reading & Math
or SAT-9 or Gates Reading
FCAT Writing
or Osceola Writes
Did the student have an
AIP this
year?
Remediation Required
Next Year?
Promote or
Retain?Above Grade Level
Level 4 or 5
Stanine 7, 8, or 9
6.0, 5.0, 5.5
No No Promote to Grade 5
At Grade Level
Level 3 Stanine 4, 5, or 6
4.0, 4.5, 3.0, 3.5
No No Promote to Grade 5
Yes Requires a new AIP
Below Grade Level Minimally (up to 6 months)
Level 2 Stanine 3 2, 2.5
No Write an AIP or closely monitor
Write an AIP if remediation is indicated or promote and closely monitor
Yes Requires a new AIP
Below Grade Level Considerably (6 months to 1 year)
Level 1 Stanine 2 1, 1.5
No Must have an AIP
*Retain with AIP or Promote with AIP (Document good cause)
Yes Requires a new AIP
Teacher Judgment
STAR Results
Reading series daily performance and assessment results
Math series daily performance and assessment results
Gates-MacGinitie Results
LEP Students-English Language Development
ESE-IEP performance goals and assessments
Helping One Student To Succeed (HOSTS)
Soar to Success Program
Parent conference and consultation
Principal Recommendation
Below Grade Level Substantially (more than a year)
Level 1 Stanine 1 0
No Must have an AIP
*Retain with AIP or Promote with AIP (Document good cause)
*Mandatory Retention: Students who have been identified as having reading deficiencies in grades 1, 2, 3, or 4 AND who have received remediation, but score at Achievement Level 1 on the Grade 4 FCAT-SSS Reading AND who score at a national percentile rank below the 25th percentile on the SAT-9 or FCAT-NRT in Reading Comprehension must be retained, unless the School Board exempts the student from this mandatory retention for good cause. Source: Osceola County School District.
The district’s plan describes the academic credit requirements for students, including criteria related to achievement from standardized achievement test results, state assessments, progress on district
5-36 OPPAGA

Educational Service Delivery
benchmarks, and graduation standards. Academic improvement plans are generated for every student with FCAT scores below level 3 in reading and/or math.
Recommendations ___________________________________________
We commend the district for its careful attention to ensuring that its newly updated pupil progression plan is linked both to Florida’s accountability standards, to the Sunshine State Standards and is extremely user friendly. The Osceola County 2002 Pupil Progression Plan should serve as a model for the state.
•
8 The district should work with schools to ensure that school advisory council membership represents the community the school serves. In addition, the district should work with schools to focus their school improvement plans on measurable objectives relating to student performance and strategies to address these objectives.
School advisory councils would benefit from recruiting more diverse members School advisory councils assist schools in preparing and evaluating school improvement plans. State law requires all councils to include the principal, teachers, educational support employees, students, parents, and business and community members. The variety of groups specified for membership helps provide an appropriately balanced and broad-based approach to school improvement. State law also requires school advisory councils to reflect the ethnic, racial, and economic community served by the school. The district has adopted, and the Department of Education approved, a policy that does not require minority representation to be reflective of the school. For example, if the minority composition of the school is 20% African-American and 20% Hispanic, then 40% of the SAC must be minorities the minority group they represent does not matter.
In general, the school advisory councils in Osceola County were lacking business members and in some cases, did not reflect the diversity of the community that the school served. In a review of the membership lists included in 32 school improvement plans, 22 schools did not have members of the business community listed on their school advisory council membership roster. In addition, very few council rosters had instructional support staff listed as members.
School Improvement Plans Can Be Enhanced The purpose of the school improvement plan is to direct school activities to improve student academic and non-academic outcomes. The school improvement plan should have goals, measurable objectives, and strategies to meet these objectives.
We reviewed all of the school improvement plans and asked the questions below.
• Are the school goals supported by measurable objectives of student outcomes? • Is there evidence that the school improvement plan is based on the students’ needs? • Are the goals and objectives supported by clear implementation strategies (action steps)?
Most of the plans followed the district’s standardized format. This standardization assures that School Advisory Councils address each of the eight state education goals and all of the elements required by law.
OPPAGA 5-37

Educational Service Delivery
The format also mirrors the objectives in the district’s strategic plan. However, very few of the school improvement plans’ objectives were measurable. Further, in many cases, it was not clear that the objectives were based on students’ needs, and the implementation strategies were not as specific as they could be.
Objectives were most often not measurable, too broad, and vague. An example of this is “Improve student performance in reading, writing, and math.” This objective does not state the amount of improvement expected in each subject or how that improvement is to be measured. However, it is important to note, in many cases more specific measures were included as part of the action plan or strategies. Test scores were frequently mentioned in this section. Typically, gains in FCAT test scores were the means by which they were measured. If the amount of expected gains were listed, they appeared in this section as well.
Although 60% of SAC members who responded to our survey indicated that they used student test scores when developing the SIP, our review of the SIPs found it was unclear in many cases whether the objectives were based on students’ needs. In some cases, school advisory councils used the school’s completed DART Model as their starting point and was included as an appendix to the school improvement plan. In the plans that utilized the DART Model as a starting point, it was clear that the objectives were based on students’ needs. If other schools used the DART Model or another system of data analysis, it was not evident in their plans.
Implementation strategies were another area in need of improvement. Many of the plans simply had a list of programs. For example, if the objective was “Improve student performance in reading”, there was a list of reading programs. There was no way to tell if these were new or existing programs or how these programs were going to be implemented. Were all students going to have the same programs or were they going to target programs to individual students needs? In addition, there were very few instances where programs were linked to specific student need, a time line for implementation of the program and the person responsible for implementing the program. Many of the plans had mixed implementation plans with some that were clear and others that were not. However, it is important to note that 78% of teachers who responded to our teacher survey indicated that the school improvement plan for their school is consistent with the main strategies used in the school to improve student performance. Exhibit 5-32 shows a breakdown of our plan review by school type, elementary, middle, high, and schools with more than one type of school grade levels called combined.
5-38 OPPAGA

Educational Service Delivery
Exhibit 5-32 School Improvement Plans Can Be Improved
School Improvement Plans Can Be Improved
1
3
7
4
1 11
3
5
Plans With Measurable Objectives Plans With Objectives Based OnSchool Need
Implementation Strategies AreMixed
Num
ber
of S
choo
ls
Combined Elementatry High Middle
Source: OPPAGA analysis of Osceola County School District school improvement plans.
Although we found most school improvement plans to be lacking, there were some outstanding plans. Pleasant Hill Elementary School’s Plan contains school budget line item requests that correspond to the strategies described in the plan. In addition, the objectives listed are measurable. An example of one of these measurable objectives is: “In the 2000-2001 school year 60% of the 4th graders at Pleasant Hill Elementary (PHE) scored at level 3 or above on the FCAT reading test. In 2001-2002 there will be a 2% increase; in 2002-2003 there will be an additional 2% increase; and in 2003-2004 there will be a 2% increase in the students’ reading scores.”
While 90% of SAC members that responded to our survey indicated they were familiar with the School Improvement Plan, 77% indicated they did not have any training for their role on the school advisory council. This lack of training may explain some of the plans’ deficiencies.
The Link Between the District Strategic Plan and School Improvement Plans Should Be Improved Although each school improvement plan begins with a statement of the district’s goals and objectives, there are no clear ties between the plans and the district’s strategic plan. It is not clear if the strategic plan considers the needs of individual schools during its development. The SIPs do not appear to feed into the district strategic plan and visa versa.
Recommendations_________________________________________
• We recommend that the district increase efforts to recruit a more diverse membership for School Advisory Councils.
• We recommend the district provide training to SAC members with the purpose of producing more adequate and meaningful School Improvement Plans.
OPPAGA 5-39

Educational Service Delivery
We recommend the district further strengthen the evaluation and accountability component of the School Improvement Plans. In addition to the review of results of each school year, the district should establish a mechanism to continually evaluate SIPs to determine whether progress is being made towards the accomplishment of the goals.
•
Action Plan 5-7 The District Should Increase Efforts to Recruit More Diverse School Advisory Council Members Strategy The district should develop a recruitment plan to attract diverse members for school
advisory councils including business and community as well as minority membership. Action Needed Step 1: The district community relations department should work with the Planning
and Improvement Department and schools to develop a strategy to recruit SAC members.
Step 2: The strategy should be developed and implemented by the beginning of the school year.
Step 3: The recruitment strategy should be evaluated on a semester basis to determine effectiveness.
Who is Responsible The Community Relations Department, Strategic Planning and Accountability Department and school based staff
Time Frame Strategy to be developed and implemented by the beginning of the 2002-03 school year. Fiscal Impact None.
Action Plan 5-8 The District Should Provide Training to SAC Members With the Purpose Of Producing More Adequate and Meaningful School Improvement Plans Strategy The Strategic Planning and Accountability Department should provide targeted training
to each School Advisory Council on an ongoing basis. Action Needed Step 1: The district should develop a training schedule for each school advisory
council to receive general and school specific training. Step 2: The training should be in a large group of all SACs but MUST also include
training at each individual school to cover individual school issues and specific SAC issues within the school year.
Step 3: The training should include a roster and evaluation forms and the district should evaluate the training for effectiveness and usefulness and make changes to future training session based on the results of the evaluations.
Step 4: The training should include but not be limited to SAC role and responsibility, using data in SIPs, sunshine law, the SAC/School Improvement law, and Robert’s Rules of Order and school board policy.
Who is Responsible District Strategic Planning and Accountability Department Time Frame To be implemented, completed and evaluated the 2002-03 school year. Fiscal Impact None.
Action Plan 5-9 We recommend the district further strengthen the evaluation and accountability component of the School Improvement Plans. Strategy The district should further strengthen the evaluation and accountability component of
the School Improvement Plans. In addition to the review of results of each school year, the district should establish a mechanism to continually evaluate SIPs to determine whether progress is being made towards the accomplishment of the goals.
5-40 OPPAGA

Educational Service Delivery
Action Needed Step 1: The district should establish a mechanism to continually evaluate SIPs to determine whether progress is being made towards the accomplishment of the goals. This mechanism could be as simple as creating a database to track SIP goal attainment for each school.
Step 2: The district should also establish a mechanism to verify that the SIP goals were based on school-based data (i.e., the DART Model) and that the goals and strategies match the school’s needs.
Step 3: If a school’s SIP is found to be lacking these elements, then the district staff should intervene and assist the school in preparing a plan that is useful and targets the school’s needs.
Who is Responsible Director of Strategic Planning and Accountability, Planning and Evaluation Department, Assistant Superintendent of Curriculum and Instruction Services.
Time Frame Beginning the 2002-03 school year. Fiscal Impact None.
Cost-Effective Instructional Materials
9 The district’s process for selecting instructional materials ensures that instructional materials meet the needs of teachers and students.
The district purchases instructional materials in accordance with Florida law and has a plan for purchasing instructional materials that adheres to the state adoption schedule. The district’s process for reviewing and selecting instructional materials involves teachers and other appropriate stakeholders. The district clearly has identified the flexibility schools have to make decisions regarding instructional materials and budgets for the cost of replenishing instructional materials that contain consumables.
The district purchases instructional materials in accordance with Florida law and in a manner that is consistent with the state adoption schedule The district’s system for adopting instructional materials mirrors the system used at the state level. During the adoption year and following the state adoption schedule, a committee is formed with district staff and a representative from each school. The school representative must be elected to serve on the adoption committee. They are their school’s liaison linking the school to the adoption process by communicating feedback from the school to the committee.
The District’s Process for Reviewing and Selecting State and District Adopted Instructional Materials Includes Teachers The district convenes committees comprised of teachers, instructional leaders, curriculum specialists and district leaders to select textbooks and instructional materials for district use from the list of state approved materials. The committee then identifies three choices from which district schools can select materials. At the school level, teachers and administrators select state approved textbooks and instructional materials from the district approved list. In addition, teachers can purchase other materials (including non-state adopted texts and instructional materials). The district has done an excellent job of ensuring that teachers and administrators understand their authority in selecting instructional materials.
OPPAGA 5-41

Educational Service Delivery
The District Allows Schools Flexibility in Making Decisions Regarding Instructional Materials Due to the system of school based management that is in place, individual schools have quite a bit of leeway when purchasing instructional materials. Each school is given an allocation to be used for instructional materials, including consumables. Each school then makes their selection from the district-adopted list and submits a line item budget request to the assistant superintendent for curriculum and instruction’s office for processing. A single person in his office is responsible for ordering and maintaining inventory records for the district. To assure the principals understand the law and constraints involved with categorical funding streams, a memo is sent out at the time of textbook purchasing to remind principals that according to Florida law at least 50% of instructional materials must be spent on state-adopted materials.
10Each student has access to current and appropriate instructional materials in core courses that are aligned with the Sunshine State Standards and the district’s pupil progression plan.
Students in Osceola County have current state-adopted textbooks and other appropriate instructional materials in core courses. According to district records, the district complies with the state textbook adoption schedule. Instructional materials on the state adoption list are aligned with the Sunshine State Standards and these standards are incorporated in the districts pupil progression plan. In isolated cases, teachers in focus groups reported a shortage of textbooks in some subject areas. According to district staff, the shortage was due to past textbook purchasing policies when the district was operating under policies no longer in effect. When asked if student have current textbooks or other instructional materials in core courses to use in class, 47% of respondents to our survey of Osceola County’s teachers indicated that they did have instructional materials to use in class. However, when asked if all students have access to current textbooks or other appropriate instructional materials in core courses to take home results were mixed. Thirty-seven percent of teachers indicated that students do have instructional materials to take home, and 35% reported that they did not.
The teacher focus groups and survey indicated that schools vary with respect to how they provide each student a textbook. Under Osceola County’s strong school based management system, some schools purchase one book per student for each of the core subjects. The students are responsible for these books and may take them home. Other schools maintain class sets. These books remain in the school or classroom and are not available for the students to take home.
The District Obtains Feedback on Instructional Materials In order to obtain feedback from teachers on instructional materials the district staff takes several steps. Each school is asked to elect a representative to serve on the adoption committee. It is then the representative’s responsibility to bring the materials being considered for adoption to the school for the entire staff to review. The representative then distributes ballots and the teachers’ vote for which book they think should be adopted. According to district staff, this process has worked very well and teachers feel they have an opportunity to provide feedback. However, teachers who responded to our survey indicated mixed results when asked if the district solicits their feedback on the usefulness of instructional materials after they have been adopted. Twenty-nine percent agreed that the district did solicit their feedback on instructional materials that have already been adopted, 30% were neutral, and 28% disagreed.
5-42 OPPAGA

Educational Service Delivery
11While the district’s procedures for acquiring and disposing of textbooks are cost-efficient, the district’s procedures for collecting fees for lost and damaged textbooks needs to be improved.
The District is Doing a Good Job of Disposing of Obsolete Textbooks The district has a standard policy for disposing of textbooks. This policy required schools to dispose of obsolete instructional materials in one of four ways.
Material that can not be utilized in inter-district exchange programs may be given to
• other public education program within the district or state; • teachers to use in developing supplementary teaching materials; • students or others for personal use and not for profit; and • any charitable organization, governmental agency, private school, or state.
The system used by the district to dispose of obsolete textbook is the same system used to discard obsolete furniture and other supplies. The books are sent to a warehouse, and once a year the district holds a sale. At this time anyone from the community, including teachers and other staff, may purchase textbooks and other discarded district supplies. Last year the district made $212 on textbooks and $135 on surplus library books. The district estimates it sells 10% of their surplus books and gives 90% away to members of the community. They also have donated surplus materials to civic and church groups.
The District Needs to Improve Its Tracking Of Collecting Fees For Lost and Damaged Books The district has a policy governing the determination of and collection of fees for lost or damaged books. The policy determines the percentage of the cost of the book new based on the amount of damage and/or the number of years the book has been in use. However, elementary school principals and district staff members we spoke with indicated that they have difficulty in collecting these fees because, by law, they cannot withhold information such as the student report card because they have not paid for or turned in their books. Middle and high schools do not allow student to participate in school functions that are not mandatory until they have paid their fees. For example, according to district staff, one high school does not allow seniors to participate in the graduation ceremony until all of their fees are paid. A middle school does not allow students to attend the spring dance until all of their fees are paid. According to staff members, this method has been very effective.
The district does not maintain records of the number of lost and damaged instructional materials, their value, and whether fees were collected. The district does track the total amount of fees collected. Last year the district collected $28,373.18 in fees for lost and damaged textbooks, which goes back into the district’s instructional material fund. It is unclear what percentage of the total fees assessed this is; hence there is no way to determine the district’s overall effectiveness in collecting these fees.
Recommendations ___________________________________________
• The district should develop and implement strategies to track the collection of fees for damaged and lost books.
OPPAGA 5-43

Educational Service Delivery
Action Plan 5-10 The district should develop and implement strategies to track the collection of fees for damaged and lost books. Strategy The district staff along with school-based staff should develop and implement a strategy
to track the collection of fees for lost and damaged books. Action Needed Step 1: The district Curriculum and Instruction Department should convene a
committee of school based staff, parents; and teachers and develop a policy to facilitate the tracking of and the collection of more fees for lost and damaged books.
Step 2: The policy should include documentation of the number of books the school started with, ended with, were damaged, lost, paid for, the number not paid for, and the approximate value of the books that were not paid for.
Step 3: The policy should be advertised to the public, students, and parents. Who is Responsible Curriculum and Instruction Department and school-based staff Time Frame January 2003 Fiscal Impact This will result in more fees collected for lost and damaged books.
Accountability
12The district needs to improve performance accountability mechanisms for its education programs.
The district does not have clearly stated goals and measurable objectives that address the major aspects of each educational program (for example ESE and ESOL). However, it does use performance measures and benchmarks such as the FCAT, Stanford-9, and school performance grades for evaluating the overall effectiveness of educational programs but does not always use these to make management decisions. In addition, the district has implemented a schedule to formally evaluate major educational programs using regular assessments, legal requirements, and other reasonable criteria as factors. However, such evaluation is limited to the education program as a whole and does not apply to evaluation of individual programs.
The district does not emphasize student performance in strategic planning and does not set measurable targets for improving student performance The central focus of any school district is to educate the children and citizens of their community and the district’s strategic plan should reflect this focus. The Osceola district’s strategic plan falls short in this area. The majority of the plan discusses various forms of public relations and not student academic improvement. For example, Strategy 1, “Communicate the district’s mission, beliefs, and pledges to everyone regularly.” Has 33 action plans associated with it. Student performance isn’t mentioned until strategy four “Establish higher academic standards that will ensure student success.” And only has 10 action plans associated with it. There is only one strategy in this section that is measurable, “The district shall establish the goal of FCAT achievement in the upper quartile of school districts in Florida.” There are no other goals, objectives, or strategies, which are measurable and focus on improving student performance. The strategic plan is a school district’s guiding document. A plan that does not establish clear measurable guidance is not as useful as it could be. The district should develop a new strategic plan that emphasizes academic achievement. The goals of this new plan must be measurable and the strategies
5-44 OPPAGA
Educational Service Delivery
should be based on data analysis. It is also crucial that the new plan include an evaluation component to assure the district revisits the plan and evaluates student progress and program effectiveness.
District administrators monitor student performance and make program decisions with student performance in mind but data-driven school improvement efforts are mixed As a whole, the department of Curriculum and Instructional Services meets to review new directives from various sources (state, district, principal input, SAC committees, etc.) to begin planning budgetary and staff needs. This review or “State of the Department” includes scrutiny of programs currently in place for performance and cost. Some of the questions the department addresses in its scrutiny of programs are noted below.
• Who is the targeted audience? • What tool of measurement may be used to determine effectiveness of the initiative? • How many staff/student members will be reached? • What is the cost breakdown inclusive of materials, substitutes, travel expenses, or consultant fees? • Is it possible to provide the same service of opportunity utilizing existing staff?
This information is compiled on each initiative and then displayed on a “whiteboard” in the department conference room where it becomes a visual tool in the development of both the budget and instructional programs for the upcoming year. Additionally, whenever possible, test scores and data gathered from the Planning and Evaluation area are aligned with both the curriculum and staff development programs sponsored by the department. The expenditures in current projects are tracked by school and initiative, which provides an opportunity to determine if the program is working at a given school by reviewing test scores and student gains. Comparisons may also be made with the district’s cost analysis report. The finalized review and recommendations become a part of the budget process as well as provide the basis of the department’s yearly goals.
The Osceola County School District has also integrated the DART Model (Data Assess Review Target) into all aspects of planning and instruction. Implementation of this model results in a district-wide method for determining student needs in the areas of curriculum, classroom instruction, and assessment. Teachers are able to see exactly which specific areas on the FCAT their students fell short, cross-reference those areas to the sunshine state standards, and adjust their teaching methods. Principals are able to target resources in the areas with the greatest need. Implementation of this model also results in clearer goals for the School Advisory Councils to focus on when composing their school improvement plans. However, through focus groups with principals and teacher and interviews with district staff, we learned that the DART Model is not always used to its fullest potential. The school staff analyzes the data, with help from the Planning and Evaluation Department, as required by the district, but some do not use it as an integral part of their school improvement process.
By holding only school principals accountable, the school based management model hinders district school improvement efforts The district operates under a strong school based management model. Although the district analyzes data and provides input, very few decisions effecting schools are made at the district level. Interviews with district level staff members indicated that in some instances this method hinders their school improvement efforts. For example, if, after completing the DART Model, it is determined that a school is weak in reading. The district cannot mandate that the school implement a particular reading program even if all the research shows success with their particular student population. The district can merely suggest that the school implement the program. It is the principal’s decision. One of the few requirements the district does hold the school to is the accreditation standard required by the Southern Association of Colleges and
OPPAGA 5-45

Educational Service Delivery
Schools. This association accredits all of the schools in Osceola County. If a principal is not abiding by these standards district office staff can require them to follow these policies.
Although the district curriculum staff cannot require a principal to implement a program or method, they do work very closely with schools that are not performing well. For example, one elementary school has been a “D” school in danger of becoming an “F” school for three years. Schools in this situation are a first priority for intervention by the district and state. The district Planning and Evaluation Department also provides additional support to schools in need of assistance. They assist the principal analyzing and interpreting data and the curriculum department helps by providing services such as professional development and curriculum development. Another intervention implemented to help “D” schools to improve student performance is, assigning psychologists to “D” schools. These psychologists are funded by the ESE Department. The district also has sought assistance from the state Department of Education’s Bureau of School Improvement and Educational Accountability. According to their staff, they have worked with Osceola County, but have been focusing on schools state wide, at risk of becoming an “F”. For more information on district staff’s span of control, please see chapter 3 section 5 of this report.
District administrators need to move beyond monitoring student performance to diagnosing systematic problems and designing interventions based on evaluations of major education programs The district monitors overall student performance using the DART Model and by disaggregating standardized test scores. However, when low-test scores are found, the district does little to evaluate the cause. The Planning and Evaluation Department does disaggregate data for schools but does not disaggregate data for individual programs such as ESE, ESOL and Vocational programs. One reason for this could be the staff of the Planning and Evaluation Department simply does not have the time to do more in-depth analyses. There are three staff members in the Planning and Evaluation Department. They are responsible for collecting and disaggregating the district’s standardized test data, assisting school with any data needs, as well as for administering standardized tests. Administering the tests includes hiring proctors, distributing test booklets, and packing up the completed test booklets all following strict security protocols. In addition, the district’s Accountability and Strategic Planning office does not have the staff needed to assure the school improvements plans and the district strategic plan include an evaluation component or the staff needed to follow up to assure the schools are evaluating programs. The district should merge the functions of these two departments and create an Accountability, Planning, and Evaluation Department that is charged with just that, improving schools and evaluating programs. The new department should be the starting point for all planning and school improvement efforts in the district. This new department should work in concert with the curriculum and instruction departments in developing interventions based what data analysis determines an individual school’s strengths and weaknesses. By merging these two departments and giving the curriculum and instruction staff more authority over individual schools (see Action Plan 5-12), the district will make data-based decision making and student performance the focus of the entire district.
Recommendations ___________________________________________
• The district should develop a new strategic plan that emphasizes academic achievement. The goals of this new plan must be measurable, the strategies based on data analysis, and include an evaluation component to assure the district revisits the plan and evaluates student progress and program effectiveness. The district should combine the Accountability and Strategic Planning Department with the Planning and Evaluation Department to form the Accountability, Planning, and Evaluation
•
5-46 OPPAGA

Educational Service Delivery
Department. The purpose would be to build evaluation skills in the organization through training of program managers in evaluation techniques.
Action Plan 5-11 The district should develop a new strategic plan that emphasizes student academic achievement. Strategy The district should develop a new strategic plan that emphasizes academic achievement.
The goals of this new plan must be measurable, the strategies based on data analysis, and the plan must include an evaluation component for each program.
Action Needed Step 1: With the school board and key district staff a strategic planning committee should be formed and charged with the task of developing a strategic plan. The committee MUST include staff from the Planning and Evaluation department to assure decisions are based on data.
Step 2: The plan should be adopted by the school board and shared with all staff members and the community as a whole.
Step 3: All staff members should receive training and constant reminders on the elements of the strategic plan with emphases on student achievement as the purpose of the district school system. This will help promote an atmosphere of making teaching and learning the priority of the district.
Who is Responsible All district staff Time Frame To be completed before the end of the 2002-03 school year Fiscal Impact None.
Action Plan 5-12 The district Should Combine the Accountability and Strategic Planning Department with the Planning and Evaluation Department to Form an Accountability, Planning and Evaluation Department Strategy The district should combine the Accountability and Strategic Planning Department with
the Planning and Evaluation Department to form the Accountability, Planning, and Evaluation Department. This new department would be made up of staff from both departments and two new staff members who will facilitate evaluation activities. The focus of this department is to integrate the use of data in to all levels of decision making including in the development of school improvement plans; assist curriculum staff in identifying problem areas within schools and developing individual action plans as part of a system of continual school improvement; evaluate major programs (ESE, ESOL, Vocational Education) and smaller programs at individual schools.
Action Needed Step 1: Before combining the two departments, assess the skill sets of the current employees of each department to determine current strengths and weaknesses.
Step 2: When the current director of Accountability and Strategic Planning retires, his salary will become available to fund two new evaluation positions.
Step 3: To round out the department, hire two new staff members who have the skill sets the current staff members do not.
Step 4: Conduct a training/information session with the rest of the staff (district and school based) to inform them of the new department and the changed focus of the department.
Step 5: Send flyers and conduct trainings for School Advisory Council Members so they too are aware of the change.
Step 6: Charge the new department with developing an evaluation plan and a school improvement plan for the district.
Step 7: Train school based staff in evaluative techniques and set program evaluation expectations.
OPPAGA 5-47

Educational Service Delivery
Who is Responsible Superintendent and board to make change and hire new staff; accountability, planning and evaluation staff to implement change.
Time Frame Department to be established before the end of the 2002-03 school year Fiscal Impact None. Use the retired director’s salary to implement this action plan.
13 The superintendent reviews the administrative organizational chart yearly for efficient staff placement and adequate program coverage.
The district reviews the organizational chart and makes changes as needed Most recent changes in the administrative structure of Curriculum and Instructional Services include the addition of the Coordinator of Multicultural Education and Coordinator of Charter and Choice Schools. The Multicultural Department was experiencing a significant influx of students to its program, which required additional staff to manage testing, ESOL endorsement and resolution of issues arising with the children’s educational protocol. The Osceola County School Board approved the Coordinator of Charter and Choice Schools during the summer of 2000. Osceola County is currently approaching its cap of 12 charter schools. To date, the district has one-half of an administrative position vacant. This position, coordinator of Prekindergarten, has been held vacant pending operational changes in the Prekindergarten program.
When compared to peer districts Osceola’s staffing levels are comparable. The district has a greater percentage of support staff than the state average and smaller percentage of instructional staff. Exhibit 5-33 displays the comparison of staffing levels between the state and peer districts.
Exhibit 5-33 Peer District Comparison of Staffing Levels
District Total Number of
Staff
Percentage of Administrative
Staff
Percentage of Instructional
Staff Percentage of Support Staff
Alachua 3,954 4% 50% 47% Collier 4,168 4% 52% 44% Lee 6,313 4% 55% 42% Leon 4,197 4% 52% 45% Manatee 4,751 3% 50% 47% Osceola 3,881 3% 51% 46% State 275,089 3% 55% 42%
Source: Profiles of Florida’s School Districts 2000-2001, Florida Department of Education.
Minimal increases in instructional and professional support staff have occurred during the previous three years. The current staff, with careful planning, cross training, and an emphasis on prioritizing projects, has maintained a high level of service with very little growth. The most recent addition to the specialist’s category is the Research and Evaluation specialist position. This position responds to the principal’s requests for alignment between test data and curriculum and works very closely with other instructional resource staff members. Currently, two instructional positions remain open. They are social studies resource specialist and health/DFS resource specialist. It is the district’s intent to continue to allow these two positions, which are not currently included in the testing process, to remain vacant until the economic uncertainly passes.
5-48 OPPAGA

Educational Service Delivery
The professional support staff members have demonstrated the strength of their skills in providing all staff members with clerical and accounting support as well as a multitude of other responsibilities. Minimal change has occurred within this category.
The District Adjusts Their Staff Based on Student Growth and School Need It is the primary intent of the various departments of Curriculum and Instructional Services to provide services and support to the schools and departments in Osceola County. This is in response to the establishment of school-based management by the Osceola County School Board. The administrative staff of Curriculum and Instructional Services provides encouragement, information, and guidance in response to requests received by our school administration, faculty, and parents. To achieve this initiative, the departments have been designed and staffed in response to population growth and program expansion.
Osceola County’s Teacher Student Ratio Is Above the State Average and Peer Districts Osceola County’s teacher-student and guidance-counselor-student ratios are above most of their peer districts and the state average. One possible reason for this is the high rate of growth Osceola County is experiencing. Approximately 3,000 new students move to Osceola County each year. Although the teacher student ratio is higher than peers and the state average, Osceola’s teacher aide to teacher ratio is the lowest of their peers and the state average.
Exhibit 5-34 Peer District Comparison of Staff Ratios
District Classroom Teachers
To Students Teachers Aides To
Classroom Teachers Guidance Counselors
To Students Alachua 1: 17.71 1: 4.22 1: 404.12 Collier 1: 17.21 1: 2.92 1: 271.44 Lee 1: 18.04 1: 5.54 1: 481.52 Leon 1: 16.66 1: 3.01 1: 414.98 Manatee 1: 16.64 1: 2.99 1: 443.1 Osceola 1: 19.19 1: 2.78 1: 461.98 State Average 1: 17.68 1: 4.29 1: 438.18
Source: Profiles of Florida School Districts 2000-01, Florida Department of Education.
As the District Grows, Changes in the District’s Organizational Chart Should Be Made Currently the superintendent supervises the deputy superintendent for operations; the assistant superintendent of Curriculum and Instruction; the coordinator of community relations; and 31 school principals. This is a total of 34 organizational units reporting to the superintendent. The chairman of the Osceola district school board believes the district will soon grow from 31 to 50 schools.
With 50 principals reporting to the superintendent, the district will soon be at a point where it cannot afford to maintain such a span of control, for the superintendent. To provide a more reasonable span of control we proposed an alternative organizational structure for consideration. The new position of deputy superintendent for instruction would be created and would report to superintendent. The assistant superintendent of Curriculum and Instruction and all school principals would report to this new position of deputy superintendent for instruction for a total of 32 programs reporting to them. In addition, this structural change will allow curriculum and instructional staff to intervene directly when a school’s student performance does not meet district or state standards. District intervention would be triggered when a school failed to meet student achievement standards and could include requiring the school to set up remedial programs, conducting student level analysis of test scores, implementation of reading programs or teacher staff development.
OPPAGA 5-49

Educational Service Delivery
Further down the road, as the number of schools continues to grow, it may be necessary in the future to create two assistant superintendent positions just to administer the schools and these two new assistant superintendents would report to the deputy superintendent for instruction. The assistant superintendent for business and financial services and would no longer report to the deputy superintendent of operations but would report directly to the superintendent with a total of six programs reporting to them. The deputy superintendent for operations would remain and would report directly to the superintendent with five programs reporting to them. This would be total of four organizational units reporting to the superintendent and a more manageable span of control.
14The district does a good job of reporting the effectiveness and costs of major educational programs.
Documentation provided demonstrates that the district does inform the public on the performance and cost of its major educational and operational programs. This is done through two documents. The first is Window on the Classroom, the 2000-2001 Osceola School District Annual Report to the Community and is distributed as an insert to the News Gazette newspaper. The Windows on the Classroom shows what major programs the money went to by percentage and per student per day. The second is the Osceola County School Board and superintendent’s News and Views, published in the News Gazette newspaper. It shows the revenue sources that went to each school and how that money was spent per student. Per student costs are given for the categories of substitute teachers, maintenance to the school, and textbook cost. The News and Views lists percentages for suspension rates, absentee rates, minority rates, mobility rates, and new staff. Portions of the strategic plan’s action plans that have been completed are highlighted.
In addition to Windows on the Classroom, the district also publishes a myriad of other publications, newsletters mostly, that are used to communicate with parents and the public. While these publications do not include any cost or financial information, they do attempt to make the public aware of what is going on in their community’s schools. These publications include those below.
• FCAT Florida Comprehensive Assessment Test, Strategies for Success. This pamphlet contains information on the FCAT broken into three sections; What is the FCAT?, Why do we need to know about the FCAT?, How do we begin?, and contains basic information in response to these questions.
• Academics & Curriculum. A newsletter containing basic information on the FCAT, opportunities for accelerated graduation including dual enrollment, International Baccalaureate and the Double “A” Scholars Program. This newsletter also contains information about alternative and remedial education.
• Report Card. A list of each school and the school performance grade (school grade) awarded to them by the state.
Recommendations ___________________________________________
We commend the district for its careful attention to informing the public of its progress and fiscal responsibility.
•
5-50 OPPAGA

Educational Service Delivery
Library Media Services
15The district does a good job of providing library and media materials although current collections need to be updated.
The district’s school libraries or media centers generally do a good job of supporting students’ need. However, many of the collections are out of date. The district uses procedures to reduce library and media costs, such as coordinating orders to take advantage of a state discount. Osceola County also annually evaluates library and media services to ensure that resource materials are accessible to all students, represent current research, and are automated.
Few schools meet the standards for library collection age; most collections are older than they should be The district does an annual analysis of the age of the library collections in Osceola County. According to district staff, this analysis has pointed out that library media books collections are older than they would like them to be. Osceola County has adopted the following standards for determining the acceptable age of their library collections:
• at least 70% of books should be 10 years old or less; • no more than 20% of books should be 11 to 20 years old; and • no more than 10% of books should be more than 20 years old.
Using this standard, only five (Kissimmee Elementary, Horizon Middle, Celebration, Discovery Intermediate and the Narcoosee Community School) of the Osceola County school library collections comply with this standard. However, 59% of teachers who responded to our teacher survey indicated that their media center is current and up-to-date. Only 11% of teachers indicated their media center did not have up to date resources.
School spending on library books varies widely, only one school meets standard. Related to the age of collections is the amount each principal spends on library books. The district collects data on the number of books per pupil and the amount each school spends on library and/or media center materials. The indicators vary widely across the district. For the 2001-02, school year the amount spent on library books ranged from $0 to $10,939.81 (see Exhibit 5-35). Under school-based management, principals have discretion over the amount they spend on library materials; however, they must follow school board policy on purchasing materials. Before the district went to a school based management model principals were required to spend $7 per student on library books. In the 2000-01 school year, 12 principals did not purchase any library books, 7 of the remaining principals spent less than $1 per student on library books. Only one school, Horizon Middle School, met the standard for the 2001-02 school year by spending $9.95 per pupil on library books.
Exhibit 5-35 The Number of and Amount Spent on Library/Media Books Varies Widely From School to School Indicator Minimum Maximum Median Books Per Student 6.08 111.05 11.77 Amount Spent on Library Books $0 $10,939.81 $133.27
Source: Osceola County School District.
OPPAGA 5-51

Educational Service Delivery
Annually all media centers conduct a program evaluation that evaluates whether services and resources are accessible to students. The results of this survey are compiled and a letter grade is assigned to the school’s Library/Media Center. The 2001 report states most school staff members are pleased with their library and media services. However, it could be improved. As seen in Exhibit 5-36, the majority of schools rated their media centers as above average or a grade of “B”. In addition, 52% of teachers responding to our teacher survey indicated their media center has sufficient materials for all students.
Exhibit 5-36 Most Schools Rate Their Library/Media Centers as “Above Average”
Number Of “A” Media Centers
Number Of “B” Media Centers
Number Of “C” Media Centers
4 21 4 Source: Osceola County School District.
All library media centers in the Osceola District Schools are automated. The district has a contract with the Follett Software Company that not only provides the software used to automate district media centers but also provides software updates, service packs, data repair, email and fax assistance, CD-ROM replacement and toll-free telephone technical support. In addition, the media centers use an inter-library loan system.
Recommendations ___________________________________________
We recommend that the district work toward updating its library/media collections. •
Action Plan 5-13
The District Should Work Toward Updating Its Library/Media Center Collections Strategy The director of Media and Instructional Technology and her staff should develop and
implement a policy requiring school library/media collections to meet the standard. Action Needed Step 1: The director of Media and Instructional Technology and her staff should
develop a policy requiring schools to meet accepted library/media center policies at their schools.
Step 2: Once the policy is developed it should be approved by the school board to assure their support on this issue.
Step 3: Once the policy is approved by the board, the director of Media and Instructional Technology and her staff will work with schools not meeting the standards in developing a plan to meet the standards in a reasonable amount of time.
Step 4: The implementation of these plans must be monitored by the director of Media and Instructional Technology and trainings quarterly reports of progress reported to the school board and superintendent.
Who is Responsible Director of Media and Instructional Technology and her staff. Time Frame To be implemented, completed and evaluated before the end of the 2002-03 school year.Fiscal Impact None.
5-52 OPPAGA

Educational Service Delivery
16The Student Services Department Meets the Challenge of Providing Student Support Services in a Rapidly Growing District.
The Student Services Department provides quality services to meet the needs of Osceola County’s diverse and growing population. Included under the student services umbrella are psychological services including ESE testing, guidance counseling, social work, health services, attendance and truancy assistance, drug, alcohol and substance abuse counseling, and coordination with the Juvenile Justice Court System. Historically, the Student Services staff has been assigned to serve a specific number of schools. However, since Osceola County operates under a strong school based management model, principals assess the needs of their student body and hire student services staff to meet those needs.
The District Uses Innovative Methods to Meet Increasing Demands The department employs 62 professional and paraprofessional personnel who are responsible for the delivery of student support services. Exhibit 5-37 shows the funding; including personnel and operation, for the Student Services Department for school years 1998-2001. While the department’s funding has increased an average of 5% a year since 1998-99, the district’s student enrollment has increased an average of 16% each year and increased 31% during the 2000-01 school year. The rapid growth in students increases the demands on all student support services staff.
Exhibit 5-37 Osceola County’s Student Services Budget Has Increased by 15% Percent Since 1998-99 Year Budget Amount 1998—99 $2,173,860 1999—00 $2,194,407 2000—01 $2,385,955 2001—02 $2,494,272
*Budgets include paybacks to the district due to missed enrollment projections. Source: Osceola County School District.
Exhibit 5-38 shows the impact on this increased demand for psychological evaluations needed for determining Exceptional Student Education eligibility. The number of assessments has increased 49.8% over the past four years. The growth is affecting student support services ability to complete assessments during the year the assessments are assigned.
Exhibit 5-38 The Rapid Growth in Students Needing Psychological Assessments for ESE Eligibility Is Increasing the Percentage of Pending Referrals
Psychological Assessments for Exceptional Student Education Eligibility (Temporary placements, re-evaluations, and new referrals) School
Year Assigned Percentage completed during the school year 1996-97 1,902 84% 1997-98 2,029 79% 1998-99 2,232 78% 1999-00 2,451 80% 2000-01 2,849 73%
Source: Osceola County School District.
OPPAGA 5-53

Educational Service Delivery
The Largest Group of Professionals Within the Department Is Psychologists Osceola County employs 22 school psychologists and two psychologist interns. There are two types of psychologists. Itinerant school psychologists are assigned to several schools. Their primary task is evaluating students for ESE services. In addition, they have administrative activities such as reviewing records and provide a variety of services such as group and individual counseling services, conduct classroom observations and write a variety of reports. School-based school psychologists are assigned to a single school and have the same duties as the itinerant psychologist except they provide more individual and group counseling. Fifty-five percent of teachers responding to our survey agreed with the statement, “I receive needed support from school psychologists.”
The district uses several innovative methods to address the increased demand for psychological services Shared Costs. The district has instituted several innovative funding mechanisms. The Student Services Department shares the cost of several positions with other departments or other schools. In the case of individual schools, the district level student services budget pay one-third of the cost of a school psychologist and the school pays two-thirds. By sharing the cost, the school is able to continue to provide the direct services that students need and the district maintains a psychologist position.
Hiring OPS Psychologists During Summer Break. In addition to sharing the cost of position with schools, for the past three summers the Student Services Department has been able to hire school psychologists on a part time temporary basis (OPS). The department determines the amount of money available. After projecting the workload for the summer and the number of psychologists interested in working during the break, the department then figures out how many hours will work and how much the psychologists will be paid. The OPS psychologists are the same psychologists that work for the district during the school year so they are familiar with internal procedures. As mentioned in the ESE section of this chapter, this practice has minimized the backlog of pending referrals at the beginning of each school year.
“The Grow Your Own Program.” Another innovative practice is the district’s “Grow Your Own Program” in which the district employees two psychologists interns and they spend the year being trained as a school psychologist. Six years ago, the district formed a close relationship the University of Central Florida’s Psychology Department to train School Psychologists who then intern with Osceola County Public Schools. In most cases, the district, upon completion of their internship hires the interns. Through this program, new employees (former interns) begin their jobs with a working knowledge of the internal systems of Osceola County and require very little additional training in order to fulfill their job requirements. This program has helped the district keep up with the needs of their booming student population.
Guidance Counselor to Student Ratio Is Slightly Higher Than Most of Their Peer Districts The district’s ratio of guidance counselor to student is higher than the state average and the second highest of its peer districts. However, 72% of teachers responding to our survey agreed with the statement, “I receive needed support from guidance counselors.” Principals have the ability to increase guidance counselor staffing based on their schools individual priorities. Exhibit 5-39 indicates the ratio of counselor to students in peer districts. Some examples the duties of a guidance counselor are listed below.
• To advise students of program offerings and requirement • To maintain current records and interpret information for each student • To assist students in developing a positive and realistic self concept • To refer students to appropriate community agencies
5-54 OPPAGA
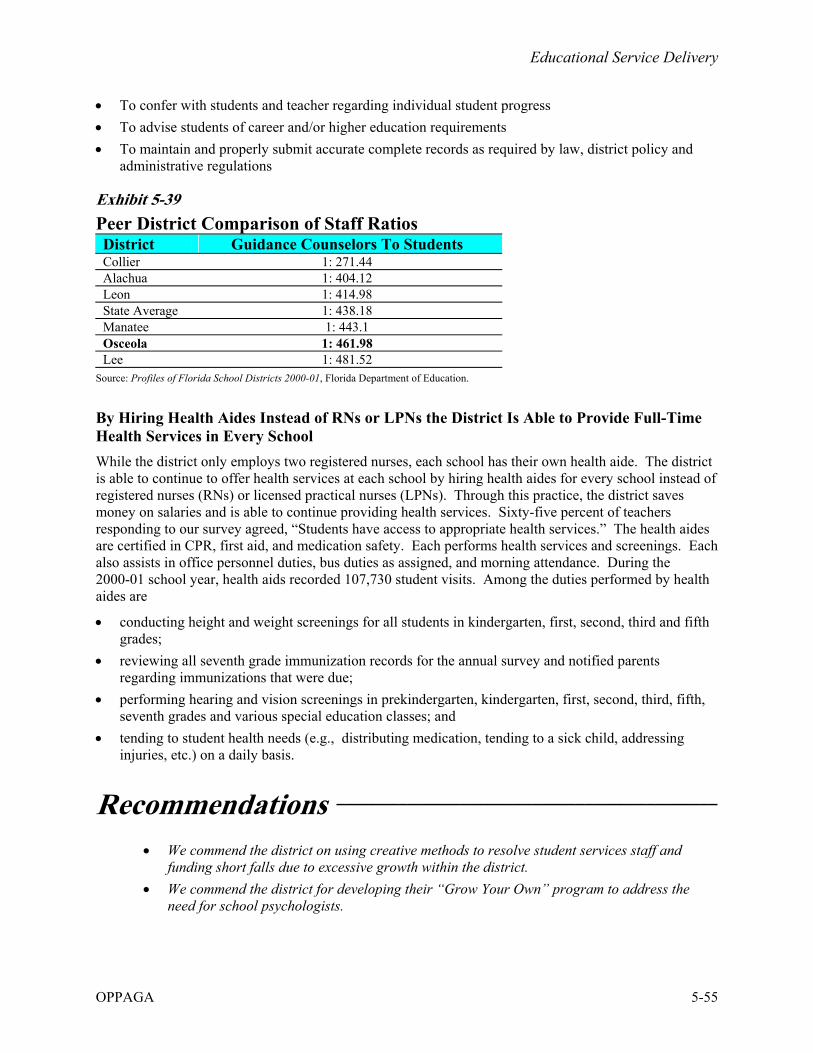
Educational Service Delivery
OPPAGA 5-55
• To confer with students and teacher regarding individual student progress • To advise students of career and/or higher education requirements • To maintain and properly submit accurate complete records as required by law, district policy and
administrative regulations
Exhibit 5-39 Peer District Comparison of Staff Ratios District Guidance Counselors To Students Collier 1: 271.44 Alachua 1: 404.12 Leon 1: 414.98 State Average 1: 438.18 Manatee 1: 443.1 Osceola 1: 461.98 Lee 1: 481.52
Source: Profiles of Florida School Districts 2000-01, Florida Department of Education.
By Hiring Health Aides Instead of RNs or LPNs the District Is Able to Provide Full-Time Health Services in Every School While the district only employs two registered nurses, each school has their own health aide. The district is able to continue to offer health services at each school by hiring health aides for every school instead of registered nurses (RNs) or licensed practical nurses (LPNs). Through this practice, the district saves money on salaries and is able to continue providing health services. Sixty-five percent of teachers responding to our survey agreed, “Students have access to appropriate health services.” The health aides are certified in CPR, first aid, and medication safety. Each performs health services and screenings. Each also assists in office personnel duties, bus duties as assigned, and morning attendance. During the 2000-01 school year, health aids recorded 107,730 student visits. Among the duties performed by health aides are
• conducting height and weight screenings for all students in kindergarten, first, second, third and fifth grades;
• reviewing all seventh grade immunization records for the annual survey and notified parents regarding immunizations that were due;
• performing hearing and vision screenings in prekindergarten, kindergarten, first, second, third, fifth, seventh grades and various special education classes; and
• tending to student health needs (e.g., distributing medication, tending to a sick child, addressing injuries, etc.) on a daily basis.
Recommendations ___________________________________________
• We commend the district on using creative methods to resolve student services staff and funding short falls due to excessive growth within the district.
• We commend the district for developing their “Grow Your Own” program to address the need for school psychologists.