edited by maria andréia formico rodrigues (unifor) célia … · fusion of infrared and visible...
TRANSCRIPT
Technical Posters Proceedings
XXI Brazilian Symposium on Computer Graphics and Image Processing
October 12-15, 2008, Campo Grande, MS, Brazil
Edited by
Maria Andréia Formico Rodrigues (UNIFOR) Célia Zorzo Barcelos (UFU)
Rafael Bruno Almeida (UFMS) Marcelo Ferreira Siqueira (UFMS)

Table of ContentsPreface iv
Program Committee v
Reviewers vi
Image Processing
DICOM Server Applied to Medical Image Processing 1Luis S. Barberis, Juan P. Graffigna, Fabian M. Lucena, Marıa Eugenia Gomez, and Raul Romo
Watershed Transform based Interactive Image Segmentation Tool 3Bruno Klava and Nina S. T. Hirata
Marvin: A Tool for Image Processing Algorithm Development 5Gabriel Ambrosio Archanjo, Fabio Andrijauskas, and Danilo Rossetto Munoz
Color Gradient Map-Oriented Anisotropic Diffusion Filtering 7Leandro Coser, Antonio C. Sobieranski, Adiel Mittmann, Aldo von Wangenheim, and Eros Comunello
OCR4JkanjiCards: Exploring Japanese Character Recognition 9Oswaldo Bassani Neto, Celso Setsuo Kurashima, and Marcelo Zanchetta do Nascimento
Fusion of Infrared and Visible Spectra Face Recognition Methods 11Giovani Chiachia and Aparecido Nilceu Marana
SAR Image Compression Using Bounded Variation Component Analysis 13Regis C. P. Marques, Daniel S. Ferreira, Fatima N. S. Medeiros, Janaina V. Cruz, and Maria H. V. Duarte
A Fourier Transform-based Method to Fusion IKONOS Data 15Juliana Gouveia Denipote and Maria Stela Veludo de Paiva
A new Content-Based Image Retrieval Methodology Based on Image Registration Algo-rithms Processed in Grid Computing 17
Marcelo Costa Oliveira, Walfredo Cirne, Jose Flavio M. V. Junior, and Paulo M. de Azevedo-Marques
Improving Content-based Image Retrieval by Combining Growing Hierarchical Self Or-ganizing Map Classifiers for Color, Shape and Texture Features 19
Saulo de Tarso O. Rodrigues, Tiago Oliveira de Albuquerque, and Herman M. Gomes
ii

Computer Graphics, Vision, and Modeling
Surface Equalization 21Francisco Jose Benavides Murillo, Douglas Navarro Guevara, Francisco Torres-Rojas, and AlexanderRamırez Gonzalez
Efficient Computation of Global Illumination for Image Synthesis 23Anamaria Gomide, Danillo Roberto Pereira, and Jorge Stolfi
Using Metaprogrammed Functors to Implement Double-Dispatch for Collision Handling 25Tiago H. C. Nobrega, Diego D. B. Carvalho, and Aldo von Wangenheim
A Geometric Bisection Algorithm for Automatic Page Layout 27Alexandre Seki, Mauricio Klein, Ricardo Piccoli, Isabel Manssour, and Joao B. Oliveira
Enabling Interactive Brain Fiber Tracking with the GPU 29Adiel Mittmann, Tiago H. C. Nobrega, Eros Comunello, Diego D. B. Carvalho, and Aldo von Wangenheim
Physically Based Simulation Using Particle Systems 31Yalmar Ponce Atencio and Claudio Esperanca
3D Texture Painting of Point Models 33Jose Ricardo Mello Viana, Ricardo Marroquim, and Claudio Esperanca
Level of Detail for Point Model Rendering 35Felipe Carvalho, Antonio Oliveira, and Ricardo Marroquim
Frature Pattern for Non-Photorealistic Image Rendering 37Anna Regina Corbo and Luiz Henrique de Figueiredo
iii

iv

v
Program Committee
Technical Posters Co-Chairs
Maria Andréia Formico Rodrigues (Universidade de Fortaleza – UNIFOR)
Célia Zorzo Barcelos (Universidade Federal de Uberlândia – UFU)
Program Committee
Adilson Gonzaga (Escola de Engenharia de São Carlos – EESC/USP) Agma Traina (Instituto de Ciências Matemáticas e de Computação – ICMC/USP)
Carla Maria D. S. Freitas (Universidade Federal do Rio Grande do Sul – UFRGS)
Denise Guliato (Universidade Federal de Uberlândia – UFU) Eraldo Ribeiro (Florida Institute of Technology)
Esteban Walter Gonzalez Clua (Universidade Federal Fluminense – UFF)
Isabel Harb Manssour (Pontifícia Universidade Católica do Rio Grande do Sul – PUCRS)
Léo Pini Magalhães (Univerdidade Estadual de Campinas - UNICAMP) Luiz Marcos G. Gonçalves (Universidade Federal do Rio Grande do Norte – UFRN)
Marcelo da Silva Hounsell (Universidade do Estado de Santa Catarina – UDESC)
Marcos Craizer (Pontifícia Universidade Católica do Rio de Janeiro – PUC-Rio ) Maria Cristina F. de Oliveira (Instituto de Ciências Matemáticas e de Computação – ICMC/USP)
Maurilio Boaventura (Universidade Estadual Paulista Júlio de Mesquita Filho – UNESP-Rio Preto)
Nina S. T. Hirata (Instituto de Matemática e Estatística – IME/USP) Olga Regina Bellon (Universidade Federal do Paraná – UFPR)
Thomas Lewiner (Pontifícia Universidade Católica do Rio de Janeiro – PUC-Rio)
Washington Mio (Florida State University)
v

DICOM Server applied to
Medical Image Processing
Barberis, Luís S; Graffigna, Juan P; Lucena, Fabián M;
Gómez, M Eugenia; Romo, Raúl
Abstract This work describes the design and implementation of
a DICOM server that manages medical image studies for
their further processing. It is based on connectivity
specifications of a massive clinic standard, and has the
capacity to manage studies and to run different
processing algorithms, according to a decision making
system by means of databases. The design provides great
flexibility in terms of configuration and operations
assignment, and permits compatibility with DICOM
images transmission systems. The goal of the
development is to apply automatic algorithms of clinical
image processing carried out by research groups. By
means of this system, it is possible to validate clinically
new algorithms and employ them for the diagnosis and
patient monitoring.
1. Introduction The present work is framed within the Medical Image
Management and Processing area and aims at managing
multi-modal studies for image processing.
Generally, algorithms developed by research groups
present inconvenients that make their validation and
clinical implementation difficult. On the one hand, a
highly trained medical and technical staff are required,
who usually work in very demanding environments that
make the use of the developed tools impossible. On the
other hand, clinic validation of the algorithms requires a
sufficient number of studies to achieve strong results.
This task is generally performed by selecting studies and
processing them manually. In the above mentioned circumstances, clinic
implementation of specific algorithms for different
pathologies or modalities becomes impracticable. In
order to overcome these difficulties, the design and
development of a system that tries to associate
processing algorithms research with their clinic
implementation are presented in this work, implementing
the DICOM standard [1] for the reception, treatment, and
sending of such images.
2. Design This system was designed for image processing
management allowing the user to send studies for their
processing and to receive the results.
The server, developed as a DICOM communication
module, is configured to analyze each received study in
order to determine if a set of predefined conditions are
fulfilled. If this occurs, the corresponding processing
algorithms of the corresponding studies are executed. The studies can be received directly from a modality
or a visualization workstation. The aim is to delegate to
the server all complex processing calculations. It allows
to speed up diagnosis and to provide new functions that
visualization softwares do not generally have. This
function solves problems associated with the minimum
requirements needed for certain operations. The system configuration and the state information are
stored in data tables. The following three tables are used
for the configuration: “Operation”, “Condition” and
“Application Entity”. Each line of “Operation” defines a
processing type that the server offers clients through
different ports. “Condition” contains the list of condition
for each operation. “Application Entity” stores the
information of the destination entity for the results of the
different operations.
The other function of the data system is the recording
of the new incoming studies and the storing of
information for their later monitoring. This information
is also used as a decision making tool due to, the data of
stored studies allows to define if the needed conditions
for the beginning of a process associated to an operation
have been fulfilled.
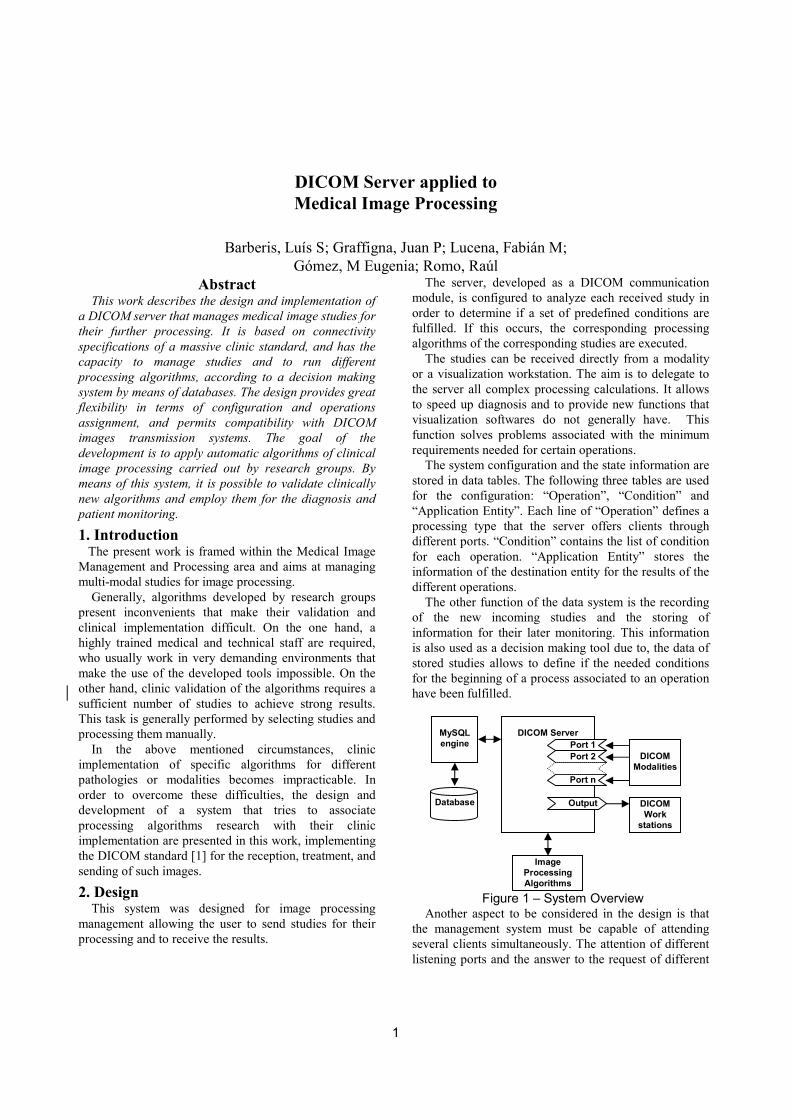
Figure 1 – System Overview Another aspect to be considered in the design is that
the management system must be capable of attending
several clients simultaneously. The attention of different
listening ports and the answer to the request of different
MySQL
engine
DICOM Server
Port 1
Port 2
Port n
Image
Processing
Algorithms
Output Database
DICOM
Modalities
DICOM
Work
stations
1
clients are independent processes. In informatics this is
implemented by using execution threads. Each reception
or sending task is implemented in an independent thread,
allowing the system to deal with a request and to
immediately wait for others. Figure 1 shows the general
structure of the system.
3. Materials and methodology The methodology employed comprises the following
stages: Planning and requirement specification, Analysis,
Design, Development, and Experimentation. Unified
Modeling Language (UML) diagrams, widely spread,
were used for the modeling process. For the development of the system, GPL software
tools were used exclusively. The Code::Blocks
application, version 8.02, was chosen as the primary tool
for the development of the server, associated with the
MinGW compiler version 3.4.5. The database engine
chosen is MySQL® version 5.0. The CTN library (Central Test Node) [2] in its version
3.0.4 was used for the management of DICOM data and
for the setting of associations.
The software was programed in C in order to have
compatibility with CTN libraries. The query system to
the database is carried out by using the API of MySQL
included in the software itself. The processing routines were provided by the people
in charge of the project titled “Multimodal Medical
Image Fusion and Analysis Applied to Diagnosis and
Radiotherapy”, carried out in conjunction with the
Medical Technology Cabinet (Gabinete de Tecnología
Médica – GATEME) from the School of Engineering of
the National University of San Juan, Argentina, and the
Foundation School of Nuclear Medicine (Fundación
Escuela de Medicina Nuclear – FUESMEN) in
Mendoza, Argentina. In that project, algorithms of high
computational cost have been developed to achieve a
good quality fusion among intra and inter modality
images. These algorithms operate over PROCIMA
libraries [3], developed by GATEME.
4. Results The system has been tested at laboratory level at
GATEME, and partially in the clinical environment at
FUESMEN. During tests carried out at GATEME to
verify the connectivity and the sending of studies, CTN
[4] test applications and the eFilm Workstation
visualization application, test version 2.1.4, were
previously configured for the connection.
Different “Case Studies" based on the characteristics
of the imaging processing algorithms developed were
performed for the experimentation, namely:
• Intermodality/intrapatient registration for radiotherapy.
• Intramodality/intrapatient registration for treatment
monitoring.
• Processing of single studies for diagnosis. • Others.
The results obtained in the tests were satisfactory in
general achieving the management of the study storing
and the correct performance of the different treatment
algorithms. At FUESMEN, tests for the reception and
sending of studies of different modalities have been
carried out, and the first algorithm for its clinic
validation is been implemented.
5. Conclusions This work has allowed the development of a
Processing Server in accordance with DICOM standard.
In this way, it is possible to integrate new processing
algorithms to clinical environments. The application
allows an automatic management of studies. The design
presented in this work offers a system capable of making
decisions based on a data set included in a DICOM
object. The decision made determines which operation
must be executed, which studies take part, and to whom
the results must be sent. The system can receive several studies, execute
algorithms, or send results simultaneously using different
processing threads. Operations, ports, conditions, etc.,
can be quickly modified by means of a SQL database.
For the design and the development of the server,
GPL software tools have exclusively been used. This
permits to improve and expand the research tasks
performed in the region. A weakness of the system is the necessity of
employing automatic algorithms that require no user
intervention. Even though there is a tendency to this kind
of techniques, there is no possibility to interact with the
user during processing tasks. Regarding the implementation of the system in a
clinical environment, it is necessary to execute it for a
prolonged time in order to evaluate the system and
algorithms.
6. References [1] ACR-NEMA: Digital Imaging and Communications in
Medicine (DICOM) Standard. Draft Versión 2007. [2] Mallinckrodt Institute of Radiology: CTN library. [3] F.Lucena, A.Valdez, M.Gómez, J.P.Graffigna, O.Nasisi:
Diseño de una Librería para Procesamiento de Imágenes
Médicas (PROCIMA) . 35 JAIIO. Simposio de Informática y
Salud 2006. [4] D.Beecher, L.Duan, S.Hoffman, S.Moore, P.Weng: CTN
Utility Programs - A Guide to Programs for Testing and
Demonstrating DICOM Functionality - Mallinckrodt Institute
of Radiology Electronic. 1999.
7. Acknowledgments This work was funded by the FONCYT Project, PICT
2003 No 430. ANPCYT.
2
Watershed Transform based Interactive Image Segmentation Tool
Bruno Klava and Nina S. T. HirataInstitute of Mathematics and Statistics - USP
Department of Computer ScienceRua do Matao, 1010, Sao Paulo, SP - 05508-090 Brazil
klava, [email protected]
Abstract
Watershed from markers and hierarchical watershed areapproaches suitable for interactive image segmentation: inthe former, the user can edit markers to control the seg-mentation result; in the latter, the user can select an imagepartition from a nested set of partitions. We propose aninteractive image segmentation tool that allows transitionfrom one approach to other and thus the combination of thestrengths of both.
1 Introduction
The watershed from markers and the hierarchical water-shed are approaches derived from the watershed transform[2]. In spite of being approaches suitable for interaction,they both have shortcomings: when using markers, a con-siderable interaction effort is demanded if there are a lot ofregions to be marked; when using the hierarchy, borders arenecessarily a subset of the borders of the primitive regionsand there are partitions that can not be obtained due to theway the hierarchy is built.
Previous works that use both approaches together [4, 6,8] consider the region adjacency graph (RAG) of an initialfine partition as the underlying structure. Markers drawn onthe image are mapped to the RAG vertices and operationsare performed on the RAG, determining a partition with re-gion level precision (i.e., all regions are unions of primitiveregions). In these works, the computation of markers corre-sponding to a given partition is not considered.
If one desires to place contours beyond those at the bor-der of the primitive regions, it is important that the water-shed from markers operates at a pixel level precision. More-over, computing the markers corresponding to a given parti-tion may be useful, for instance, to segment a sequence withsimilar frames in videos.
Therefore, a desirable characteristic in a segmentationtool is the ability to work with hierarchies (region level
precision) and with markers at a pixel level precision. Inthe next section we extend our previous work [5], brieflydiscussing how to map a partition of a hierarchy to a setof markers that recover the same partition and, conversely,how to map a partition corresponding to a set of markersto a hierarchy of partitions. Then, we describe the inter-action possibilities that have been implemented in an inter-active image segmentation tool. The tool, written in Java,implements the watershed algorithm by the image forestingtransform [3]. In Section 3 we present the conclusions.
2 Switching back and forth between the wa-tershed approaches
The transition from the hierarchical to the markers ap-proach is addressed through the minimal seed set problem,which consists in finding a minimal set of markers that canbe used to obtain a partition P by the watershed [1]. Ifthe markers are computed in the RAG and watershed frommarkers is applied on the pixels graph, the resulting parti-tion P ′ may differ from P . However, the set of markerscomputed in the RAG tend to be compact and located moreat the center of each region, whereas those computed on thepixels tend to be located at the borders of the regions. Wehave a proof that P is also an optimal partition, equivalentin cost to P ′. For user edition, markers computed in theRAG are more appropriate.
In the inverse transition, as the primitive regions areatomic units in the hierarchy, if a partition P contains bor-ders that crosses some of them, then P can not be repre-sented in the hierarchy. In this case, a possible approach isto set the same label for all the pixels within each region,for example, the most frequent label among them. Further-more, it is also necessary that each set of primitive regionswith same label (that actually make up a region) is a con-nected set considering the edges of the spanning tree of theRAG from which the hierarchy is constructed.
Details of these transitions will be included in an ex-tended version of this work. Next, we describe the imple-
3
mented interaction possibilities that explore the strengths ofboth approaches.
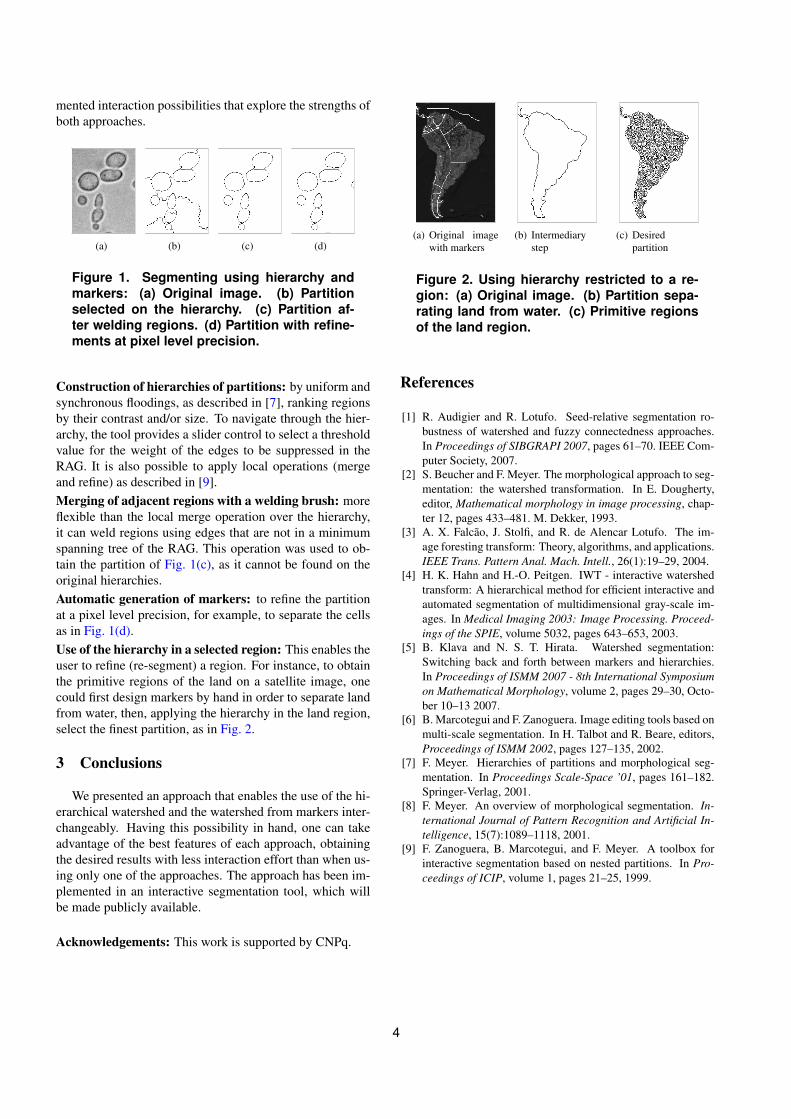
(a) (b) (c) (d)
Figure 1. Segmenting using hierarchy andmarkers: (a) Original image. (b) Partitionselected on the hierarchy. (c) Partition af-ter welding regions. (d) Partition with refine-ments at pixel level precision.
Construction of hierarchies of partitions: by uniform andsynchronous floodings, as described in [7], ranking regionsby their contrast and/or size. To navigate through the hier-archy, the tool provides a slider control to select a thresholdvalue for the weight of the edges to be suppressed in theRAG. It is also possible to apply local operations (mergeand refine) as described in [9].Merging of adjacent regions with a welding brush: moreflexible than the local merge operation over the hierarchy,it can weld regions using edges that are not in a minimumspanning tree of the RAG. This operation was used to ob-tain the partition of Fig. 1(c), as it cannot be found on theoriginal hierarchies.Automatic generation of markers: to refine the partitionat a pixel level precision, for example, to separate the cellsas in Fig. 1(d).Use of the hierarchy in a selected region: This enables theuser to refine (re-segment) a region. For instance, to obtainthe primitive regions of the land on a satellite image, onecould first design markers by hand in order to separate landfrom water, then, applying the hierarchy in the land region,select the finest partition, as in Fig. 2.
3 Conclusions
We presented an approach that enables the use of the hi-erarchical watershed and the watershed from markers inter-changeably. Having this possibility in hand, one can takeadvantage of the best features of each approach, obtainingthe desired results with less interaction effort than when us-ing only one of the approaches. The approach has been im-plemented in an interactive segmentation tool, which willbe made publicly available.
Acknowledgements: This work is supported by CNPq.
(a) Original imagewith markers
(b) Intermediarystep
(c) Desiredpartition
Figure 2. Using hierarchy restricted to a re-gion: (a) Original image. (b) Partition sepa-rating land from water. (c) Primitive regionsof the land region.
References
[1] R. Audigier and R. Lotufo. Seed-relative segmentation ro-bustness of watershed and fuzzy connectedness approaches.In Proceedings of SIBGRAPI 2007, pages 61–70. IEEE Com-puter Society, 2007.
[2] S. Beucher and F. Meyer. The morphological approach to seg-mentation: the watershed transformation. In E. Dougherty,editor, Mathematical morphology in image processing, chap-ter 12, pages 433–481. M. Dekker, 1993.
[3] A. X. Falcao, J. Stolfi, and R. de Alencar Lotufo. The im-age foresting transform: Theory, algorithms, and applications.IEEE Trans. Pattern Anal. Mach. Intell., 26(1):19–29, 2004.
[4] H. K. Hahn and H.-O. Peitgen. IWT - interactive watershedtransform: A hierarchical method for efficient interactive andautomated segmentation of multidimensional gray-scale im-ages. In Medical Imaging 2003: Image Processing. Proceed-ings of the SPIE, volume 5032, pages 643–653, 2003.
[5] B. Klava and N. S. T. Hirata. Watershed segmentation:Switching back and forth between markers and hierarchies.In Proceedings of ISMM 2007 - 8th International Symposiumon Mathematical Morphology, volume 2, pages 29–30, Octo-ber 10–13 2007.
[6] B. Marcotegui and F. Zanoguera. Image editing tools based onmulti-scale segmentation. In H. Talbot and R. Beare, editors,Proceedings of ISMM 2002, pages 127–135, 2002.
[7] F. Meyer. Hierarchies of partitions and morphological seg-mentation. In Proceedings Scale-Space ’01, pages 161–182.Springer-Verlag, 2001.
[8] F. Meyer. An overview of morphological segmentation. In-ternational Journal of Pattern Recognition and Artificial In-telligence, 15(7):1089–1118, 2001.
[9] F. Zanoguera, B. Marcotegui, and F. Meyer. A toolbox forinteractive segmentation based on nested partitions. In Pro-ceedings of ICIP, volume 1, pages 21–25, 1999.
4
Marvin – A Tool for Image Processing Algorithm Development
Gabriel Ambrósio Archanjo, Fabio Andrijauskas, Danilo Rossetto MuñozMarvin Project
leirbag.arc,biozit,[email protected]
Abstract
This work presents, Marvin, tool for image processing algorithm development. This tool is composed by a framework and an image manipulation program that supports extensibility through plug-ins. The framework, used to develop the plug-ins, provides features for image manipulation, algorithm analysis and integration with the base application. Marvin is suitable for image processing algorithm development and prototyping and for education purpose.
1. Introduction
Image processing is increasingly used for many purposes and usually involves the development of algorithms to filter and extract information from images. Nowadays, many tools for image manipulation are available and they allow users to manipulate images and develop their own algorithms for image processing, such as GIMP [4] and Photoshop [5].
Marvin, as an alternative tool for image manipulation and image processing algorithm development, has an important differential from the majority of these kinds of tools, focused on image manipulation. Marvin is also an image manipulation program, but it is focused on the development of image processing algorithms. For this purpose, Marvin provides an easy-to-use white-box framework, that requires the knowledge of the framework internal structure from the plug-in developers [1]. The framework provides features to facilitate the development of image processing algorithms, and it is open source and multi-platform, considering that it is developed in Java.
2. Plug-ins
Every Marvin feature to manipulate images is externally implemented through plug-ins. The framework defines the interfaces and provides features to manipulate the images. A Marvin plug-in must implement the interface MarvinPluginImage that specifies which methods must be implemented to manipulate an image. Once Marvin plug-ins were implemented in Java, after the plug-in compilation, the class file must be copied to the plug-ins folder that is inside the Marvin folder. Every plug-ins located in that folder will be automatically loaded into Marvin image manipulation program in the next execution.
In many cases, it is interesting to use a plug-in inside another and the Marvin framework allows plug-ins integration. The plug-in that implements an edge detection algorithm, for example, uses the gray scale plug-in in the beginning of the process.
3. Performance Meter
Many image processing algorithms can be divided in few processes. An algorithm, for example, may be divided in three processes to find and segment the interest points of an image: representing the image in gray scale, finding the interest points and segmenting the image[2]. Each process has a different computational cost and the performance meter allows developers to analyses the performance of the entire algorithm and their processes individually, considering the number of steps and the execution spent time. Thus, it is possible a better understanding of the algorithm performance and facilitates optimizations, since is visible what algorithm processes are costly and most interesting to be optimized. Another performance meter application is to determine the complexity of an algorithm, Big-O notation, analysing the number of steps executed for different image resolution.
5
4. Plug-in history
In some cases to achieve some result in an image, it is necessary to use a few processes. In the beginning of an image processing method, compensations can be done, such as noise and blur reduction[3]. Preparing an image for pattern recognition, for example, in some applications it is interesting to remove noise, increase contrast and emphasize edges. For these cases that multiple processes are used, Marvin History stores all plug-ins and their configurations applied to an image. The history can be exported as an image strip containing the configuration and resulting images of each used plug-in. This feature allows future analyses of used processes and facilitates a continuous development of image processing processes.
5. Integrated Graphical User Interface
The plug-ins can have user specified attributes that determines how it will work and the Marvin framework provides features to integrate a GUI (Graphical User Interface) with these attributes. Thus, the plug-in developer sets the relation between the plug-in attributes and the interface components, added to the plug-in window. When the component value is changed, the associated attribute value is changed automatically. The developer does not worry about handling component events.
The Figure 1 shows a plug-in interface using a integrated GUI with a plug-in window, a filters history and the performance meter displaying the result of Interest Point plug-in.
Figure 1. Marvin image manipulation program interface.
6. Current plug-ins
Currently, there are plug-ins developed for the Marvin application that provide the following features: image segmentation considering interest points, edge detection, image halftoning, Gaussian blur, image difference, image blending, steganography, color intensity histogram, brightness and contrast manipulation, sepia, mosaic, flipping, cropping, gray scale and negative colors conversion. Some of these plug-ins are contributions of third-party developers.
7. Conclusions and Future Work
Marvin is a tool composed by a framework and an image manipulation program. Features, such as image manipulation methods, integrated graphics user interface, filter history, plug-in integration and performance meter allow analysis, study, prototyping and development of image processing algorithms.
Marvin is developed in Java and it is open source. Every feature for image processing are developed externally through plug-ins, also in Java, by the open source community and are available at http://marvin.incubadora.fapesp.br/.
For the next version, new statistical charts support, new interface components and multi-image processing for motion analysis are expected.
8. References
[1] M.E. Fayad, D.C. Schmidt, “Object-Oriented Application Frameworks”, Communications of the ACM, USA, 1997.
[2] C. Harris, M. STEPHENS, “A combined corner and edge detector”, Proceedings of The Fourth Alvey Vision Conference, Manchester, pp 147-151. 1988.
[3] GONZALES Rafael, WOODS Richard, Digital image processing, Second Edition Pretenci Hall, 2001
[4] The GNU Image Manipulation Program – Official Website. http://www.gimp.org/. Accessed June 26, 2008.
[5] Photoshop CS3 Editions – Official Website. http://www.adobe.com/products/photoshop/. Accessed June 26, 2008.
6
Color Gradient Map-Oriented Anisotropic Diffusion Filtering
Leandro Coser1, Antonio C. Sobieranski1, Adiel Mittmann1,Aldo von Wangenheim1, Eros Comunello2
1LAPIX – Laboratory for Image Processing and Computer Graphics,UFSC – Federal University of Santa Catarina, Brazil
2Universidade do Vale do Itajaı, Brazilleandro.coser,asobieranski,adiel,awangenh,[email protected]
Abstract
Anisotropic diffusion filtering is a well-established tech-nique for image enhancement that smooths images withoutdestroying edge information. However, when many filteringiterations are applied, edges gradually fade away and areultimately smoothed by the process. We propose the adop-tion of a color gradient map to guide the smoothing so thatclearly-defined edges are preserved even after many iter-ations. Preliminary experiments show good results whencompared with the regular anisotropic diffusion filter.
1. Introduction
The anisotropic diffusion filter [2, 3] is a powerful imageprocessing technique for noise removal. The filter works byperforming smoothing on the image but at the same timepreserving the boundaries between different regions. Theprocess is controlled by a diffusion matrix that measuresthe color variation on the neighborhood of a hot spot.
When the filter is applied over many iterations, the dif-fusion matrix slowly becomes adapted to the new local col-ors. When the original image contains tenuous edges, thesmoothing process will gradually erase all edge informa-tion as iterations are sequentially applied. In this work,we propose an improvement to the anisotropic diffusion fil-ter that introduces a color gradient map, which behaves asstatic boundary evidence, enhancing the response of the fil-ter when applied several times to an image containing tenu-ous edges.
2. Orienting the Anisotropic Diffusion Filter
The anisotropic diffusion filter used in this paper hasbeen extensively discussed [2], and can be regarded as aconvolution technique with an adaptive matrix-valued ker-
nel that performs a special smoothing on images: It inhibitsthe smoothing on edge pixels and stimulates it on inter-nal regions. The basic diffusion equation [1] for an im-age I(x, y) with M channels and a signal initialized withu(x, y, 0) = I(x, y) is
∂tui = div
D M∑k=1
∇uk∇uTk
∇ui
, (1)
where D is a matrix-valued function, and i = 1, . . . ,M arethe individual channels.
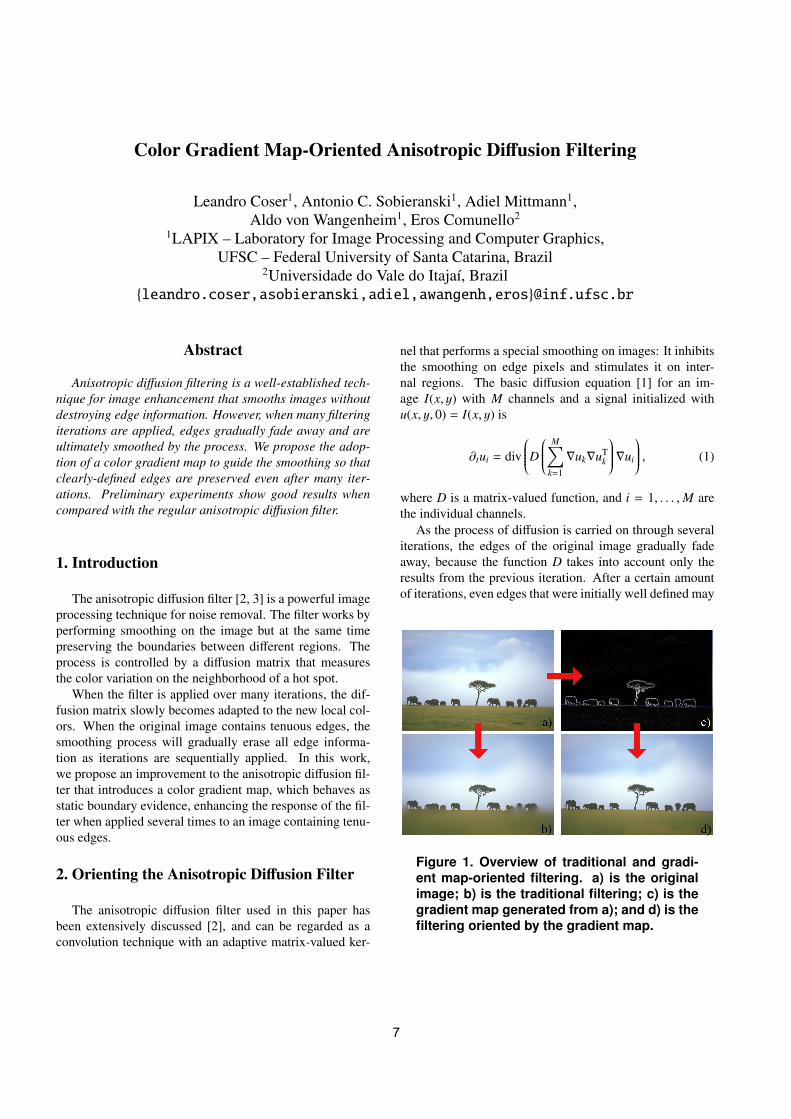
As the process of diffusion is carried on through severaliterations, the edges of the original image gradually fadeaway, because the function D takes into account only theresults from the previous iteration. After a certain amountof iterations, even edges that were initially well defined may
Figure 1. Overview of traditional and gradi-ent map-oriented filtering. a) is the originalimage; b) is the traditional filtering; c) is thegradient map generated from a); and d) is thefiltering oriented by the gradient map.
7
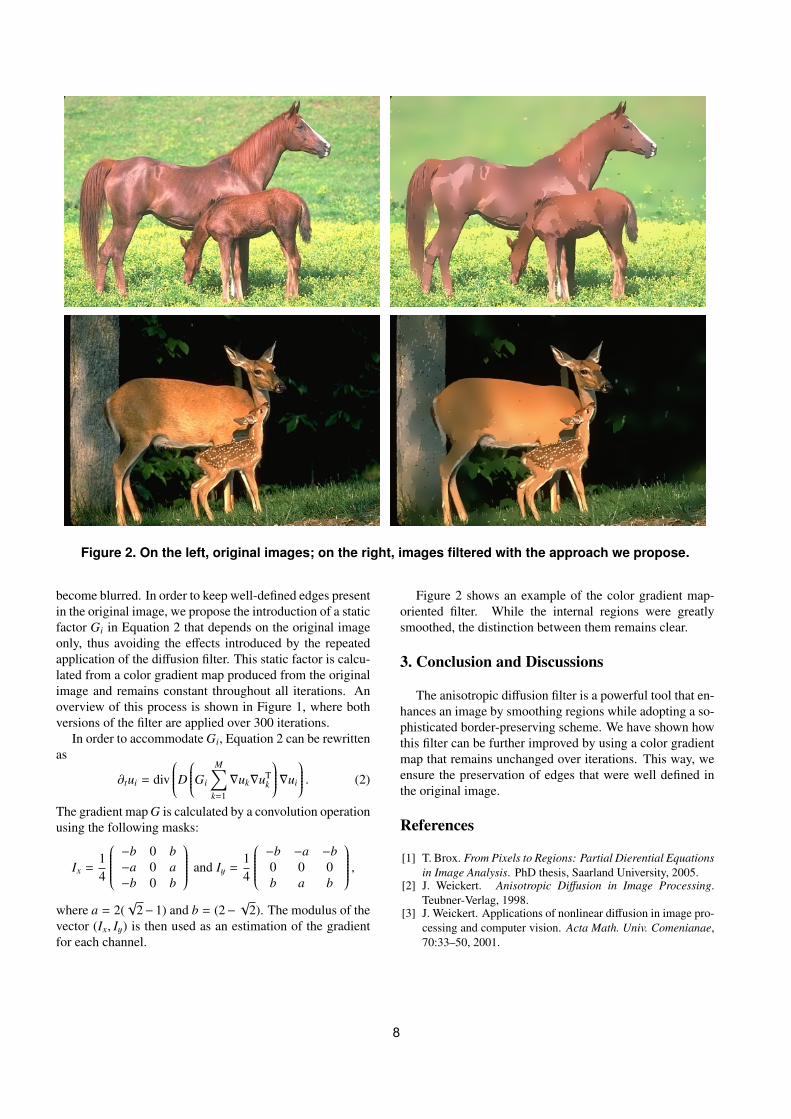
Figure 2. On the left, original images; on the right, images filtered with the approach we propose.
become blurred. In order to keep well-defined edges presentin the original image, we propose the introduction of a staticfactor Gi in Equation 2 that depends on the original imageonly, thus avoiding the effects introduced by the repeatedapplication of the diffusion filter. This static factor is calcu-lated from a color gradient map produced from the originalimage and remains constant throughout all iterations. Anoverview of this process is shown in Figure 1, where bothversions of the filter are applied over 300 iterations.
In order to accommodate Gi, Equation 2 can be rewrittenas
∂tui = div
D Gi
M∑k=1
∇uk∇uTk
∇ui
. (2)
The gradient map G is calculated by a convolution operationusing the following masks:
Ix =14
−b 0 b−a 0 a−b 0 b
and Iy =14
−b −a −b0 0 0b a b
,where a = 2(
√2− 1) and b = (2−
√2). The modulus of the
vector (Ix, Iy) is then used as an estimation of the gradientfor each channel.
Figure 2 shows an example of the color gradient map-oriented filter. While the internal regions were greatlysmoothed, the distinction between them remains clear.
3. Conclusion and Discussions
The anisotropic diffusion filter is a powerful tool that en-hances an image by smoothing regions while adopting a so-phisticated border-preserving scheme. We have shown howthis filter can be further improved by using a color gradientmap that remains unchanged over iterations. This way, weensure the preservation of edges that were well defined inthe original image.
References
[1] T. Brox. From Pixels to Regions: Partial Dierential Equationsin Image Analysis. PhD thesis, Saarland University, 2005.
[2] J. Weickert. Anisotropic Diffusion in Image Processing.Teubner-Verlag, 1998.
[3] J. Weickert. Applications of nonlinear diffusion in image pro-cessing and computer vision. Acta Math. Univ. Comenianae,70:33–50, 2001.
8
OCR4JkanjiCards: Exploring Japanese Character Recognition
Oswaldo Bassani Neto, Celso Setsuo Kurashima, Marcelo Zanchetta do NascimentoUniversidade Federal do ABC
oswaldo.bassani, celso.kurashima, [email protected]
Abstract
The OCR4JkanjiCards system is presented in this work, as a proposal for taking photos of Japanese characters using a smartphone and have them automatically recognized within a digital Japanese dictionary. Image processing techniques and neural network strategies are necessary, as well as the exploration of several programming tools.
1. IntroductionThe increase in processing power and memory
available on mobile devices like cell phones, smart-phones or handheld, allow user to have pocket dictionaries providing fast access to information.
The goal of this work is to explore a set of tools that allows joining several features in a unique system. Our OCR4JkanjiCards system is based on character recognition, and on the processing of photos taken from street plates, building facades and other texts in the real world.
2. System OverviewThe OCR4JkanjiCards system basically works with
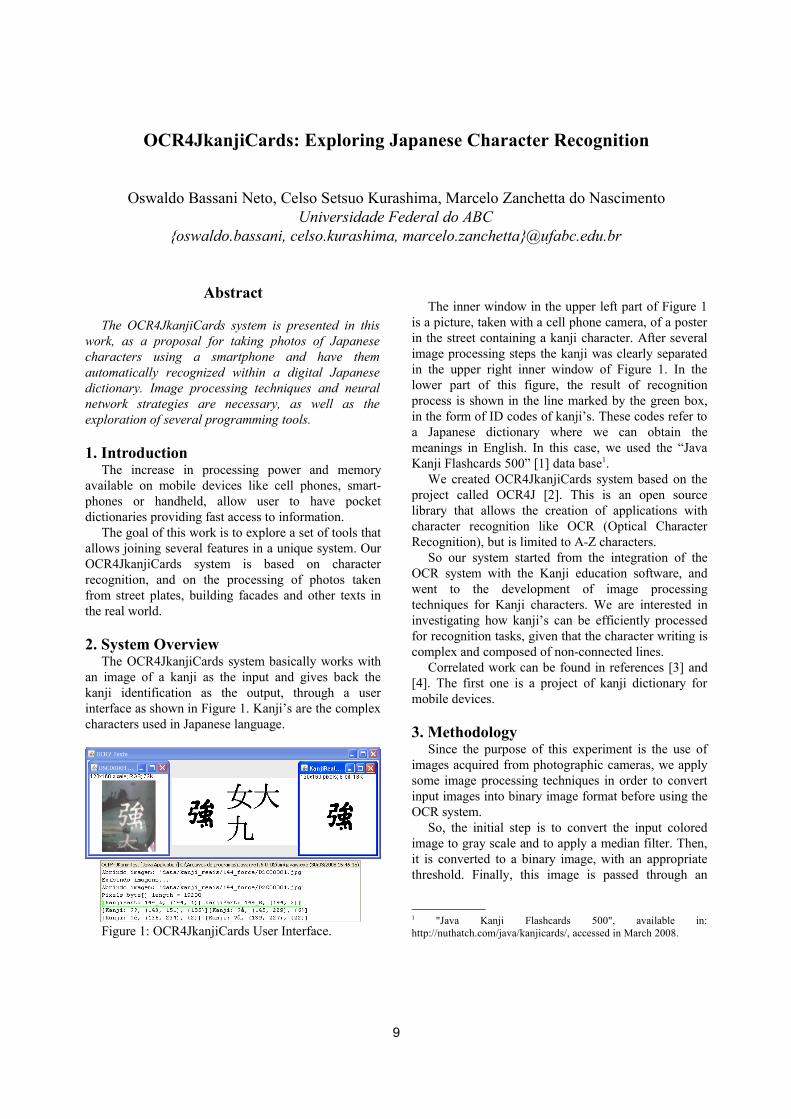
an image of a kanji as the input and gives back the kanji identification as the output, through a user interface as shown in Figure 1. Kanji’s are the complex characters used in Japanese language.
Figure 1: OCR4JkanjiCards User Interface.
The inner window in the upper left part of Figure 1 is a picture, taken with a cell phone camera, of a poster in the street containing a kanji character. After several image processing steps the kanji was clearly separated in the upper right inner window of Figure 1. In the lower part of this figure, the result of recognition process is shown in the line marked by the green box, in the form of ID codes of kanji’s. These codes refer to a Japanese dictionary where we can obtain the meanings in English. In this case, we used the “Java Kanji Flashcards 500” [1] data base1.
We created OCR4JkanjiCards system based on the project called OCR4J [2]. This is an open source library that allows the creation of applications with character recognition like OCR (Optical Character Recognition), but is limited to A-Z characters.
So our system started from the integration of the OCR system with the Kanji education software, and went to the development of image processing techniques for Kanji characters. We are interested in investigating how kanji’s can be efficiently processed for recognition tasks, given that the character writing is complex and composed of non-connected lines.
Correlated work can be found in references [3] and [4]. The first one is a project of kanji dictionary for mobile devices.
3. MethodologySince the purpose of this experiment is the use of
images acquired from photographic cameras, we apply some image processing techniques in order to convert input images into binary image format before using the OCR system.
So, the initial step is to convert the input colored image to gray scale and to apply a median filter. Then, it is converted to a binary image, with an appropriate threshold. Finally, this image is passed through an
1 "Java Kanji Flashcards 500", available in: http://nuthatch.com/java/kanjicards/, accessed in March 2008.
9
invert function to get it prepared for the kanji recognition process.
However, we have further removed excess of spurious granularity of the image that appeared in our experiments. This was done by applying a region growth to the image and manually removing unwanted regions.
The character recognition sub-system makes use of a neural network of multilayer perceptron type. This neural network can vary its architecture, for example we can change the number of input elements and the number of internal layers as well as the number of neurons on the layers. The only predetermined value is the number of output neurons, which must equal the number of characters we want to recognize.
Before training the neural network, however, we have realized that some kanji’s are not fully identified by the neural network because they are composed by two or more sets of connected pixels. In the example shown in Figure 1, the left part of that kanji is disconnected from the right part of it.
For these cases, we propose to break the kanji into two sub-parts. By doing so, these two sub-parts can be easily recognized individually.
4. ResultsOur experiments are still in the beginning and were
carried out on commodities desktop PC’s. We have trained a neural network with 17 kanji’s. For each kanji we used two images of training for each one. We also added one kanji with two parts for training the neural network, i.e., with four more training pictures.
In the OCR4JkanjiCards, we have used an image-processing tool called ImageJ [5][6], which was easy to use in the software environment during the process that convert images into binary format.
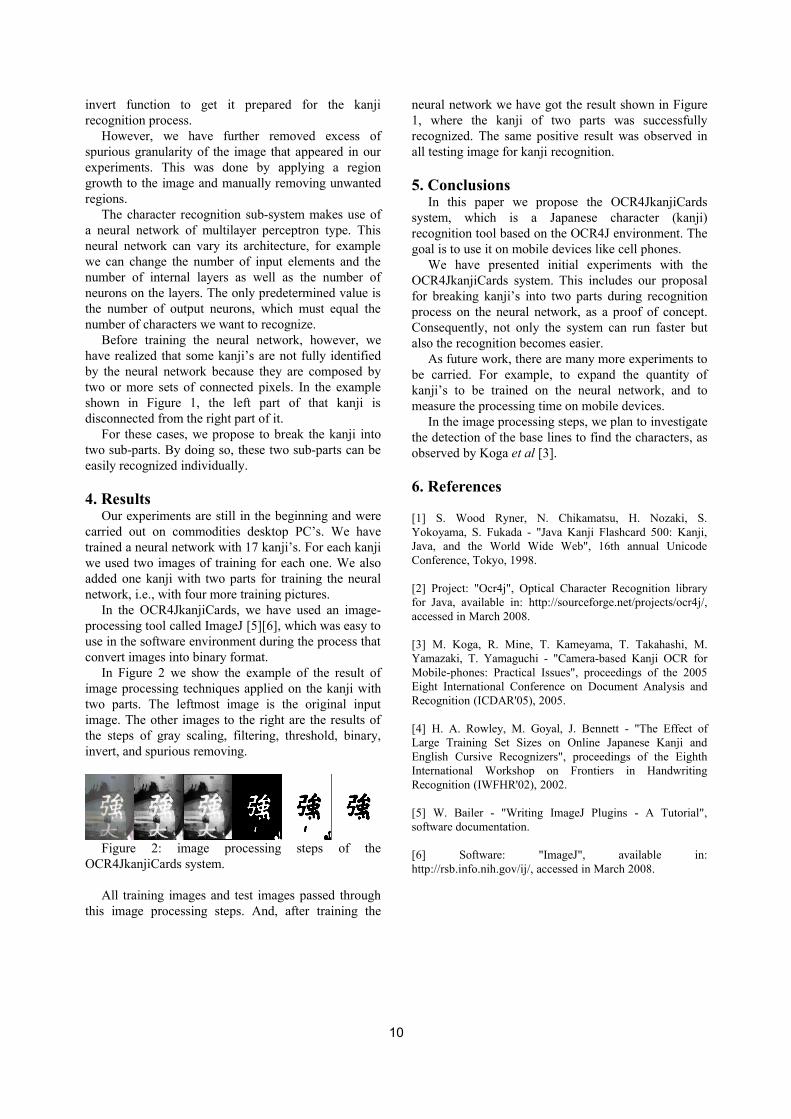
In Figure 2 we show the example of the result of image processing techniques applied on the kanji with two parts. The leftmost image is the original input image. The other images to the right are the results of the steps of gray scaling, filtering, threshold, binary, invert, and spurious removing.
Figure 2: image processing steps of the OCR4JkanjiCards system.
All training images and test images passed through this image processing steps. And, after training the
neural network we have got the result shown in Figure 1, where the kanji of two parts was successfully recognized. The same positive result was observed in all testing image for kanji recognition.
5. ConclusionsIn this paper we propose the OCR4JkanjiCards
system, which is a Japanese character (kanji) recognition tool based on the OCR4J environment. The goal is to use it on mobile devices like cell phones.
We have presented initial experiments with the OCR4JkanjiCards system. This includes our proposal for breaking kanji’s into two parts during recognition process on the neural network, as a proof of concept. Consequently, not only the system can run faster but also the recognition becomes easier.
As future work, there are many more experiments to be carried. For example, to expand the quantity of kanji’s to be trained on the neural network, and to measure the processing time on mobile devices.
In the image processing steps, we plan to investigate the detection of the base lines to find the characters, as observed by Koga et al [3].
6. References
[1] S. Wood Ryner, N. Chikamatsu, H. Nozaki, S. Yokoyama, S. Fukada - "Java Kanji Flashcard 500: Kanji, Java, and the World Wide Web", 16th annual Unicode Conference, Tokyo, 1998.
[2] Project: "Ocr4j", Optical Character Recognition library for Java, available in: http://sourceforge.net/projects/ocr4j/, accessed in March 2008.
[3] M. Koga, R. Mine, T. Kameyama, T. Takahashi, M. Yamazaki, T. Yamaguchi - "Camera-based Kanji OCR for Mobile-phones: Practical Issues", proceedings of the 2005 Eight International Conference on Document Analysis and Recognition (ICDAR'05), 2005.
[4] H. A. Rowley, M. Goyal, J. Bennett - "The Effect of Large Training Set Sizes on Online Japanese Kanji and English Cursive Recognizers", proceedings of the Eighth International Workshop on Frontiers in Handwriting Recognition (IWFHR'02), 2002.
[5] W. Bailer - "Writing ImageJ Plugins - A Tutorial", software documentation.
[6] Software: "ImageJ", available in: http://rsb.info.nih.gov/ij/, accessed in March 2008.
10
Fusion of Infrared and Visible Spectra Face Recognition Methods
Giovani Chiachia, Aparecido Nilceu Marana UNESP – Faculdade de Ciências – Departamento de Computação – Bauru – SP – Brazil
[email protected], [email protected]
Abstract
In general, face recognition systems are based on visible spectrum images and, in order to have good performance, they need to work in light-controlled environments. However, the performance of such systems decrease significantly when illumination changes. On other hand, Long-Wave Infrared (LWIR) face imagery is insensitive to illumination changes and gives the temperature pattern from the face to be recognized. The purpose of this work is to assess the performance of the fusion of well-known statistical visible and LWIR-based methods for face recognition. 1. Introduction
While humans can easily recognize faces in adverse situations and even after years, machine face recognition remains a big challenge in the fields of Computer Vision and Pattern Recognition [1].
To overcome this challenge, alternative sensor modalities (e.g. 3D range image) have been proposed. One of the new sensing modalities for face recognition is the infrared (IR), which can measure the temperature emitted by the face [1].
Besides being insensitive to light changes, the subsurface anatomical information captured by IR sensors is believed to be unique for each person [1].
Due to all these characteristics and regarding previous researches [2], it is expected that using IR spectrum images together with visible spectrum images can lead to more robust and efficient face recognition systems.
The main goal of this work is to assess the performance of the fusion of well-known statistical visible and LWIR-based methods for face recognition. 2. Database
In our experiments, it was used the University of Notre Dame (UND) time-gap face database [3], which has a large collection of images acquired by visible and
LWIR spectrum cameras. The images were acquired once a week, with most of the subjects participating several times, totalizing 2023 images in each spectrum, with neutral and smiling facial expressions. During a given acquisition session, 4 images per subject were taken, being 2 with neutral and 2 with smiling expressions.
In our experiments, 187 subjects from the UND face database were used in the training phase and other 54 subjects were selected for the gallery and the probe sets. Each of these 54 subjects attended at least 7 and at most 10 acquisition sessions. The first session of each subject was used in the gallery set and the remaining 6 to 9 sessions constitute the probe set. Hence, this work also has taken into account the recognition performance over time.
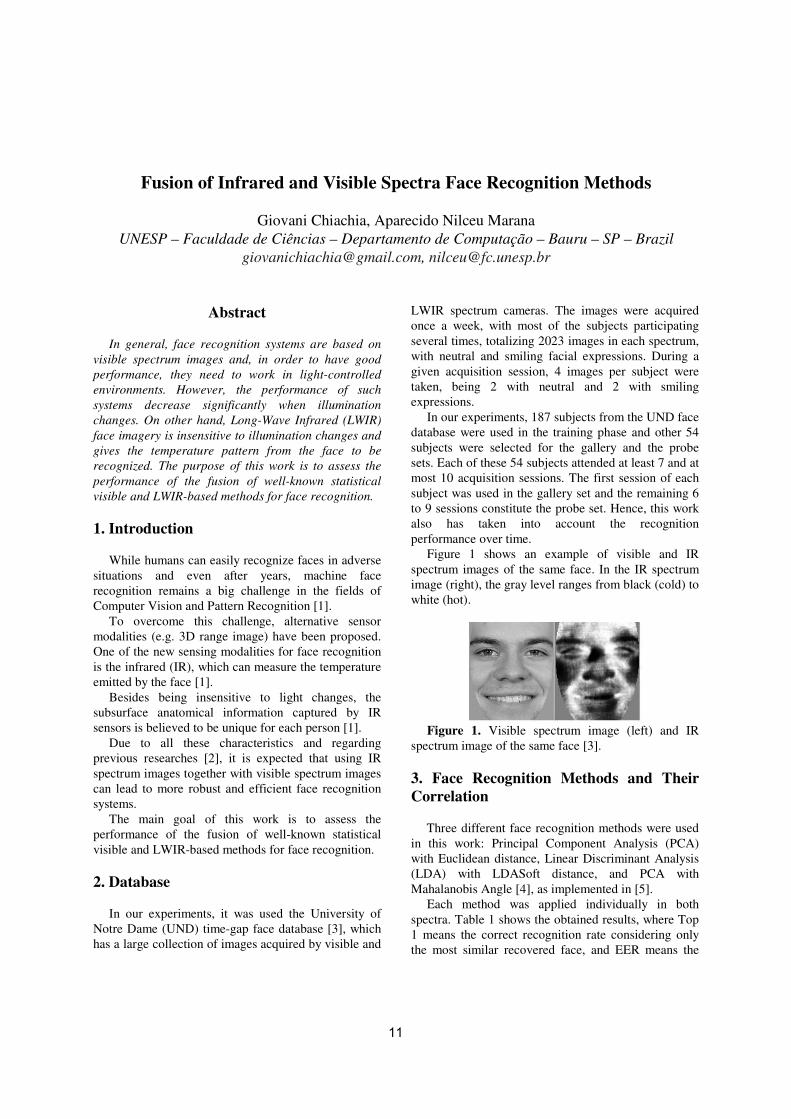
Figure 1 shows an example of visible and IR spectrum images of the same face. In the IR spectrum image (right), the gray level ranges from black (cold) to white (hot).
Figure 1. Visible spectrum image (left) and IR
spectrum image of the same face [3]. 3. Face Recognition Methods and Their Correlation
Three different face recognition methods were used in this work: Principal Component Analysis (PCA) with Euclidean distance, Linear Discriminant Analysis (LDA) with LDASoft distance, and PCA with Mahalanobis Angle [4], as implemented in [5].
Each method was applied individually in both spectra. Table 1 shows the obtained results, where Top 1 means the correct recognition rate considering only the most similar recovered face, and EER means the
11
equal error rate (the false acceptance and the false rejection rates are equal).
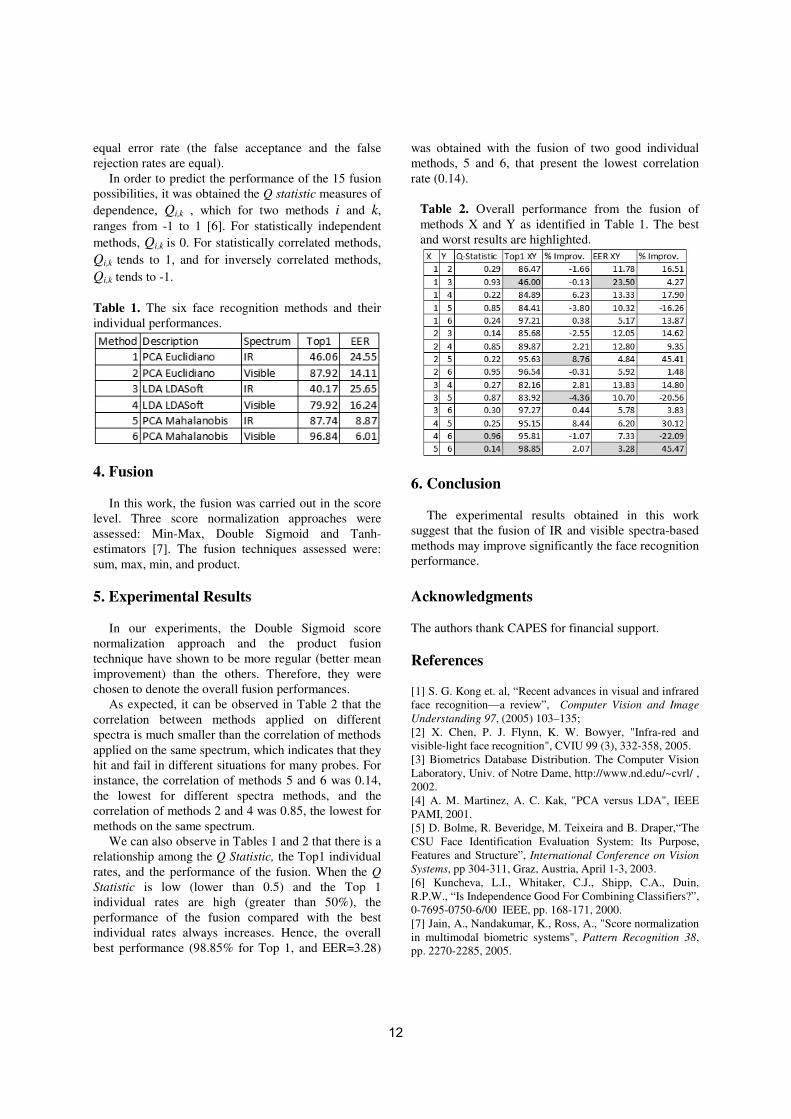
In order to predict the performance of the 15 fusion possibilities, it was obtained the Q statistic measures of dependence, Qi,k , which for two methods i and k, ranges from -1 to 1 [6]. For statistically independent methods, Qi,k is 0. For statistically correlated methods, Qi,k tends to 1, and for inversely correlated methods, Qi,k tends to -1.
Table 1. The six face recognition methods and their individual performances.
4. Fusion
In this work, the fusion was carried out in the score level. Three score normalization approaches were assessed: Min-Max, Double Sigmoid and Tanh-estimators [7]. The fusion techniques assessed were: sum, max, min, and product. 5. Experimental Results
In our experiments, the Double Sigmoid score
normalization approach and the product fusion technique have shown to be more regular (better mean improvement) than the others. Therefore, they were chosen to denote the overall fusion performances.
As expected, it can be observed in Table 2 that the correlation between methods applied on different spectra is much smaller than the correlation of methods applied on the same spectrum, which indicates that they hit and fail in different situations for many probes. For instance, the correlation of methods 5 and 6 was 0.14, the lowest for different spectra methods, and the correlation of methods 2 and 4 was 0.85, the lowest for methods on the same spectrum.
We can also observe in Tables 1 and 2 that there is a relationship among the Q Statistic, the Top1 individual rates, and the performance of the fusion. When the Q Statistic is low (lower than 0.5) and the Top 1 individual rates are high (greater than 50%), the performance of the fusion compared with the best individual rates always increases. Hence, the overall best performance (98.85% for Top 1, and EER=3.28)
was obtained with the fusion of two good individual methods, 5 and 6, that present the lowest correlation rate (0.14).
Table 2. Overall performance from the fusion of methods X and Y as identified in Table 1. The best and worst results are highlighted.
6. Conclusion
The experimental results obtained in this work
suggest that the fusion of IR and visible spectra-based methods may improve significantly the face recognition performance. Acknowledgments The authors thank CAPES for financial support. References [1] S. G. Kong et. al, “Recent advances in visual and infrared face recognition—a review”, Computer Vision and Image Understanding 97, (2005) 103–135; [2] X. Chen, P. J. Flynn, K. W. Bowyer, "Infra-red and visible-light face recognition", CVIU 99 (3), 332-358, 2005. [3] Biometrics Database Distribution. The Computer Vision Laboratory, Univ. of Notre Dame, http://www.nd.edu/~cvrl/ , 2002. [4] A. M. Martinez, A. C. Kak, "PCA versus LDA", IEEE PAMI, 2001. [5] D. Bolme, R. Beveridge, M. Teixeira and B. Draper,“The CSU Face Identification Evaluation System: Its Purpose, Features and Structure”, International Conference on Vision Systems, pp 304-311, Graz, Austria, April 1-3, 2003. [6] Kuncheva, L.I., Whitaker, C.J., Shipp, C.A., Duin, R.P.W., “Is Independence Good For Combining Classifiers?”, 0-7695-0750-6/00 IEEE, pp. 168-171, 2000. [7] Jain, A., Nandakumar, K., Ross, A., "Score normalization in multimodal biometric systems", Pattern Recognition 38, pp. 2270-2285, 2005.
12
SAR Image Compression Using Bounded Variation Component Analysis
Regis C. P. Marques∗
[email protected] S. Ferreira∗
[email protected] N. S. Medeiros†
Janaina V. Cruz∗
[email protected] H. V. Duarte∗
Abstract
This paper proposes a scheme to compress SAR (Syn-thetic Aperture Radar) images aiming for preserving finedetails such as bright targets. This scheme consists in de-composing a SAR image into bounded variation (BV) andoscillating components. The adaptive compression schemeis a modified version of the well known SPIHT methodnamed in this paper as MSPIHT. The experiments usingreal SAR images were compared with JPEG2000 and theconventional SPIHT. The assessment results indicated a su-perior performance of method in preserving fine details.
1 Introduction
Synthetic aperture radar (SAR) images are usefulsources of information for several applications in remotesensing of environment. In the last years, the amount ofSAR data has increased, and motivated researchers to de-velop algorithms for SAR image compression. Traditionalalgorithms fail to compress SAR images, particularly dueto speckle phenomena. The algorithm introduced in [1]requires pre-processing steps including speckle filtering,which degrades fine details and edges.
Using the discrete wavelet transform (DWT) efficientcompression procedures can be developed in a multireso-lution space. Several methods based on wavelets [5] areavailable in the SAR image compression literature. This ap-proach can be accomplished by decomposing SAR imagesin subbands and searching for the significant informationfor lossless compression. Regarding texture, wavelets coef-ficients present a subband frequency representation, wherethe significant texture information can be discriminated inmiddle frequency channels [5].∗Departamento de Telematica, Centro Federal de Educacao Tec-
nologica - Laboratorio de Processamento de Sinais, Fortaleza, CE, Brazil.†Departamento de Engenharia de Teleinformatica, Universidade Fed-
eral do Ceara - Grupo de Pesquisa em Processamento de Imagens, Fort-aleza, CE, Brazil.
In this paper we adopted the scheme presented in [4] todecompose the SAR image. Let f : Ω → < be the imagedecomposed into u ∈ BV component (BV - bounded vari-ation space) and v ∈ L2 component (L2 - oscillating space),such that f := u + v. The u component which is a cartoonrepresentation of f is a simplified piecewise smooth approx-imation. Our proposed framework tracks regions with tar-gets in the u component and employs a lossless compres-sion method to these regions, in order to preserve them.
This paper describes the proposed method in Section 2.We present experimental results and some concluding re-marks in Section 3.
2 Method
The BV and L2 decomposition spaces present distinctfeatures. Thus, u (low frequency information) and v (highfrequency information) components provide image analysisusing distinct bands in the same resolution. Similar to [4],the proposed scheme employs the Total Variation Minimiza-tion (TV) method to obtain the u component. The oscillatingcomponent v is computed as a TV residual information.
To perform target detection, the u component is subdi-vided into blocks using the quadtree decomposition pre-sented in [5] according to a defined criterion. If a blockmeets the proposed criterion, it is not subdivided, otherwiseit is decomposed into four blocks. The criterion is definedas σL <
√L(σL−1), where L is the quadtree decomposi-
tion level and σL is the standard deviation of the inspectedblock.
The proposed scheme is shown in Fig.1. Our aim is toallocate to fine details scales more bits in the compressionprocess. Thus, in the highest decomposition scale (16x16blocks) is used the arithmetic coder to provide a losslessdata compression. We compress the other scales (32x32,64x64,128x128) using the SPIHT algorithm [2] with de-creasing bit rates.
The displayed result in Fig. 2(a) is a scene of the coastalzone in RN-Brazil. The image size is 256x256 pixels with
13
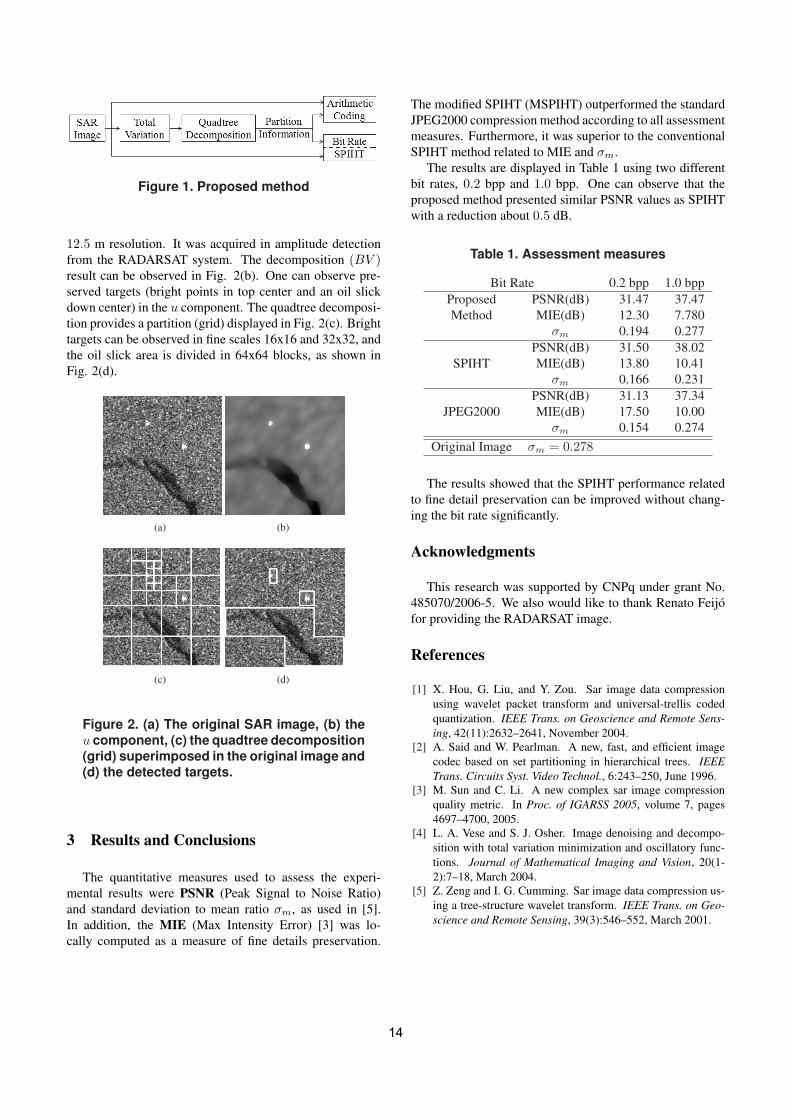
Figure 1. Proposed method
12.5 m resolution. It was acquired in amplitude detectionfrom the RADARSAT system. The decomposition (BV )result can be observed in Fig. 2(b). One can observe pre-served targets (bright points in top center and an oil slickdown center) in the u component. The quadtree decomposi-tion provides a partition (grid) displayed in Fig. 2(c). Brighttargets can be observed in fine scales 16x16 and 32x32, andthe oil slick area is divided in 64x64 blocks, as shown inFig. 2(d).
(a) (b)
(c) (d)
Figure 2. (a) The original SAR image, (b) theu component, (c) the quadtree decomposition(grid) superimposed in the original image and(d) the detected targets.
3 Results and Conclusions
The quantitative measures used to assess the experi-mental results were PSNR (Peak Signal to Noise Ratio)and standard deviation to mean ratio σm, as used in [5].In addition, the MIE (Max Intensity Error) [3] was lo-cally computed as a measure of fine details preservation.
The modified SPIHT (MSPIHT) outperformed the standardJPEG2000 compression method according to all assessmentmeasures. Furthermore, it was superior to the conventionalSPIHT method related to MIE and σm.
The results are displayed in Table 1 using two differentbit rates, 0.2 bpp and 1.0 bpp. One can observe that theproposed method presented similar PSNR values as SPIHTwith a reduction about 0.5 dB.
Table 1. Assessment measures
Bit Rate 0.2 bpp 1.0 bppProposed PSNR(dB) 31.47 37.47Method MIE(dB) 12.30 7.780
σm 0.194 0.277PSNR(dB) 31.50 38.02
SPIHT MIE(dB) 13.80 10.41σm 0.166 0.231
PSNR(dB) 31.13 37.34JPEG2000 MIE(dB) 17.50 10.00
σm 0.154 0.274Original Image σm = 0.278
The results showed that the SPIHT performance relatedto fine detail preservation can be improved without chang-ing the bit rate significantly.
Acknowledgments
This research was supported by CNPq under grant No.485070/2006-5. We also would like to thank Renato Feijofor providing the RADARSAT image.
References
[1] X. Hou, G. Liu, and Y. Zou. Sar image data compressionusing wavelet packet transform and universal-trellis codedquantization. IEEE Trans. on Geoscience and Remote Sens-ing, 42(11):2632–2641, November 2004.
[2] A. Said and W. Pearlman. A new, fast, and efficient imagecodec based on set partitioning in hierarchical trees. IEEETrans. Circuits Syst. Video Technol., 6:243–250, June 1996.
[3] M. Sun and C. Li. A new complex sar image compressionquality metric. In Proc. of IGARSS 2005, volume 7, pages4697–4700, 2005.
[4] L. A. Vese and S. J. Osher. Image denoising and decompo-sition with total variation minimization and oscillatory func-tions. Journal of Mathematical Imaging and Vision, 20(1-2):7–18, March 2004.
[5] Z. Zeng and I. G. Cumming. Sar image data compression us-ing a tree-structure wavelet transform. IEEE Trans. on Geo-science and Remote Sensing, 39(3):546–552, March 2001.
14

A Fourier Transform-based Method to Fusion IKONOS Data
Juliana Gouveia Denipote and Maria Stela Veludo de Paiva
Escola de Engenharia de São Carlos – EESC. Universidade de São Paulo – USP
judeni, [email protected]
Abstract The principal objective of image fusion in remote
sensing is to obtain high-resolution multispectral
images that can combine the spectral characteristic of
the low-resolution multispectral bands with the spatial
information of the high-resolution panchromatic band.
A method based on Fourier transform is proposed in
order to obtain good spatial and spectral resolutions
using all bands of IKONOS satellite. Quantitative
measurements were applied to compare the results of
the proposed method with IHS, IHS enhanced by
Fourier transform and wavelet-based methods.
1. Introduction
Modern satellites, like IKONOS, are capable to
producing high spatial resolution panchromatic (PAN)
band with one meter or less. Simultaneously, they
produce good multispectral (MS) bands. Spectral
information from MS bands is useful to differentiate
land cover classes, like vegetation, bare soil, water,
roads and buildings. On the other hand, the spatial
information from PAN is necessary for an accurate
description of image details, such as shape, contours
and features [1]. Image fusion is used to combine both
PAN and MS bands to obtain high-resolution
multispectral images.
The traditional image fusion methods, such as IHS,
can keep almost the same spatial resolution as PAN,
but they distort the spectral characteristics of the
original MS bands [2]. Image fusion methods using
frequency domain processing, like those based on
wavelet transform (WT) [3-5], preserve good spectral
information, but their spatial visual results are not
satisfactory.
IHS fusion methods enhanced by Fourier transform
have been very suitable in preserving both spectral and
spatial information [1, 6], but they are limited to red
(R), green (G) and blue (B) bands, excluding the near-
infrared (NIR) band.
2. Proposed FT-based Image Fusion
For IKONOS images, it is necessary to perform
some pre-processing, as the pixel sizes from PAN and
MS are different (1 meter resolution for PAN and 4
meters for MS). One pixel from MS must be resampled
for sixteen pixels.
In a remote sensing image, the details, like objects’
edges, are a result of a high contrast between features,
for example a light rooftop and dark ground. High
contrast in spatial domain is high frequencies in the
frequency domain. High frequencies are richer in PAN
than in MS. On the other hand, spectral information
appears as low frequencies in the frequency domain,
which are richer in MS than in PAN.
The proposed method consists in obtain the spectral
information from MS band by applying a low pass
circular filter in the frequency domain, and obtain the
spatial information from PAN by applying a high pass
circular filter. No IHS transform is used in order to
employ all the four IKONOS MS bands. The steps to
fusion resampled R and PAN bands are illustrated in
figure 1. The same steps must be applied to G, B and
NIR bands.
For the filters, the optimum cutoff frequency must
be measured accordingly to the spatial resolution,
which depends on the image sampling interval
following the Nyquist sampling criterion [1]: the
sampling interval is in inverse proportion to the
sampling frequency. Therefore the maximum frequency
of an image is in inverse proportion to its spatial
resolution. If the ratio of pixel resolution between PAN
and MS is 1:m, the MS maximum frequency is 1/m
PAN maximum frequency, that is, the cutoff frequency
is equal to the maximum frequency of MS. But the
maximum frequency of an image is 0.5 x∆-1
(where
x∆ is its pixel size in meters). IKONOS PAN has one
meter spatial resolution, so the maximum frequency is
0.5 cycles per meter. The maximum frequency of MS is
1/4 of that of the corresponding PAN, so the cutoff
frequency for an IKONOS image is 0.125 cycles per
meters.
15
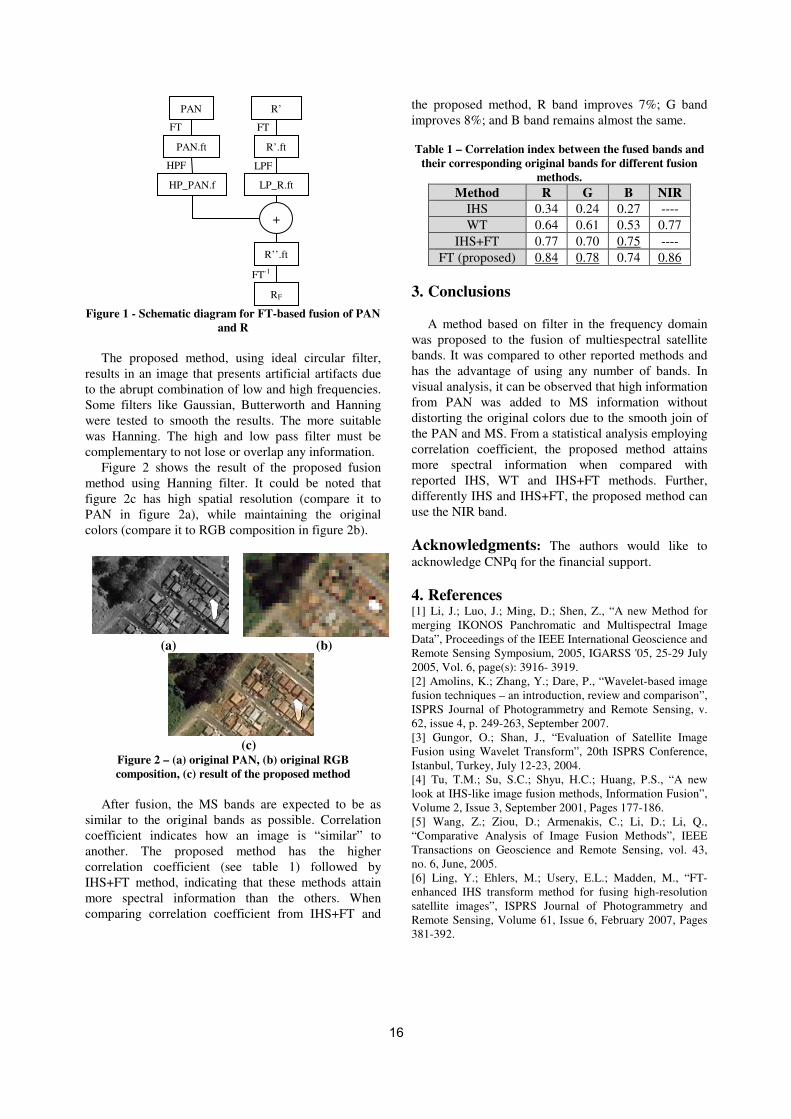
Figure 1 - Schematic diagram for FT-based fusion of PAN
and R
The proposed method, using ideal circular filter,
results in an image that presents artificial artifacts due
to the abrupt combination of low and high frequencies.
Some filters like Gaussian, Butterworth and Hanning
were tested to smooth the results. The more suitable
was Hanning. The high and low pass filter must be
complementary to not lose or overlap any information.
Figure 2 shows the result of the proposed fusion
method using Hanning filter. It could be noted that
figure 2c has high spatial resolution (compare it to
PAN in figure 2a), while maintaining the original
colors (compare it to RGB composition in figure 2b).
(a) (b)
(c)
Figure 2 – (a) original PAN, (b) original RGB
composition, (c) result of the proposed method
After fusion, the MS bands are expected to be as
similar to the original bands as possible. Correlation
coefficient indicates how an image is “similar” to
another. The proposed method has the higher
correlation coefficient (see table 1) followed by
IHS+FT method, indicating that these methods attain
more spectral information than the others. When
comparing correlation coefficient from IHS+FT and
the proposed method, R band improves 7%; G band
improves 8%; and B band remains almost the same.
Table 1 – Correlation index between the fused bands and
their corresponding original bands for different fusion
methods.
Method R G B NIR
IHS 0.34 0.24 0.27 ----
WT 0.64 0.61 0.53 0.77
IHS+FT 0.77 0.70 0.75 ----
FT (proposed) 0.84 0.78 0.74 0.86
3. Conclusions
A method based on filter in the frequency domain
was proposed to the fusion of multiespectral satellite
bands. It was compared to other reported methods and
has the advantage of using any number of bands. In
visual analysis, it can be observed that high information
from PAN was added to MS information without
distorting the original colors due to the smooth join of
the PAN and MS. From a statistical analysis employing
correlation coefficient, the proposed method attains
more spectral information when compared with
reported IHS, WT and IHS+FT methods. Further,
differently IHS and IHS+FT, the proposed method can
use the NIR band.
Acknowledgments: The authors would like to
acknowledge CNPq for the financial support.
4. References [1] Li, J.; Luo, J.; Ming, D.; Shen, Z., “A new Method for
merging IKONOS Panchromatic and Multispectral Image
Data”, Proceedings of the IEEE International Geoscience and
Remote Sensing Symposium, 2005, IGARSS '05, 25-29 July
2005, Vol. 6, page(s): 3916- 3919.
[2] Amolins, K.; Zhang, Y.; Dare, P., “Wavelet-based image
fusion techniques – an introduction, review and comparison”,
ISPRS Journal of Photogrammetry and Remote Sensing, v.
62, issue 4, p. 249-263, September 2007.
[3] Gungor, O.; Shan, J., “Evaluation of Satellite Image
Fusion using Wavelet Transform”, 20th ISPRS Conference,
Istanbul, Turkey, July 12-23, 2004.
[4] Tu, T.M.; Su, S.C.; Shyu, H.C.; Huang, P.S., “A new
look at IHS-like image fusion methods, Information Fusion”,
Volume 2, Issue 3, September 2001, Pages 177-186.
[5] Wang, Z.; Ziou, D.; Armenakis, C.; Li, D.; Li, Q.,
“Comparative Analysis of Image Fusion Methods”, IEEE
Transactions on Geoscience and Remote Sensing, vol. 43,
no. 6, June, 2005.
[6] Ling, Y.; Ehlers, M.; Usery, E.L.; Madden, M., “FT-
enhanced IHS transform method for fusing high-resolution
satellite images”, ISPRS Journal of Photogrammetry and
Remote Sensing, Volume 61, Issue 6, February 2007, Pages
381-392.
PAN
HP_PAN.f
R’
R’.ft
R’’.ft
RF
+
FT
FT-1
LP_R.ft
PAN.ft
LPF
FT
HPF
16
A new Content-Based Image Retrieval methodology based on Image Registration algorithms processed in Grid Computing
Marcelo Costa Oliveira1, Walfredo Cirne2, José Flávio M. V.Junior2, Paulo M. de Azevedo-Marques3
1Departamento de Ciência da Computação/Universidade Federal de Alagoas (UFAL) – Campus Arapiraca, Arapiraca-AL, Brasil
2Departamente de Sistemas e Computação/Universidade Federal de Campina Grande (UFCG), Campina Grande – PB, Brasil
3Departamento de Clínica Médica/Universidade de São Paulo (USP), Ribeirão Preto – SP, Brasil
Email: [email protected]
Abstract
The Content-Based Image Retrieval (CBIR) has
received great attention in the medical community because it is capable of retrieving similar images that have known pathologies. This work proposes a new methodology based on higher processing provided by the Grid Computing (GC) technology to achieve the CBIR using Registration algorithms. We evaluate the accuracy in retrieving images of the same plane, weighted and acquisition sequence related to a reference image. This works uses a heterogeneous image database and uses two anatomic regions (breast and head) as reference. The IR procedure uses Mean Square Metric (MSM) and Cross Correlation (CC). Both metrics showed a higher efficiency, MSM obtained 83% (breast) and 94% (head) precision average, the CC showed 81% (breast) and 98% (head). The higher computational cost related to the Image Registration were amortized by the GC, showing a potential low cost solution for secure data interchanging and integrating multiple hospitals and clinics. 1. Introduction
In the last 10 years, the CBIR has been one of the most studied computational vision technique. Through CBIR, it is possible to use a reference image to find similar diagnosed images [1]. Although part of the information about the diagnosis can be in the DICOM (Digital Imaging and Communication in Medicine) header, this textual tag frequently shows
high error rate. Literature has reported cases with 16% of error [1]. This way, the medical community has emphasized the adoption of alternative methods in relation to the traditional methods based on the data manual insertion into the DICOM files.
The Image Registration (IR) is made of methods capable of find spatial transformations necessary to map homologous points between two images. The transformations are done in an iterative way until the best match is obtained between the reference and target images. However, all this iterative process results in a high computational cost that makes intractable to use the IR to find the best match between a reference image and a big image server [2].
The Grid Computing (GC) technology represents the most recent and promising tool in distributed computing. GC is the integration of many computers distributed geographically, making it possible to create a virtual computing platform, giving to users and institutions a virtually unlimited capacity to solve problems related to the storage and access of data, and also to process applications with high computational costs [3].
The main goal of this work is to develop an algorithm capable of using the GC to make viable the retrieval of similar images through the adoption of the IR techniques based on the Mean Squares Metric (MSM) and Cross Correlation (CC) techniques.
2. Materials and Methods
The application was developed in the operation system GNU/Linux Debian using the Java
17
1.5 programming language. The database image was developed with PostgreSQL-8.1-3 and Hibernate 3.0 and it followed the DICOM compliances. For its assessment, a heterogeneous image database was used, with 3000 magnetic resonance images from different anatomic regions. The application has two CBIR modules. The first module uses the second-order Texture Analysis (TA), suggested by Halarick [4], to filter the 1000 most similar images into the second module. The second module uses the IR algorithms to find the similarity between an image defined by the user as a reference and the images filtered by the first module. The application starts after the specialist select a reference image. When the first module is finished, the images are classified according to the smallest value of Manhatann Distance between the TA of reference image and the database images. Then, the 1000 most similar images are filtered to be used by the second module. The second module starts when the specialists select one of the two IR techniques implemented in this work: MSM and CC. The second module is processed on the OurGrid computational grid. OurGrid assumes that the parallel applications that run on it are Bag-of-Tasks (BoT) [3]. The application sorts in a list the most similar images according to the MSM or CC and show to the user. 3. Results
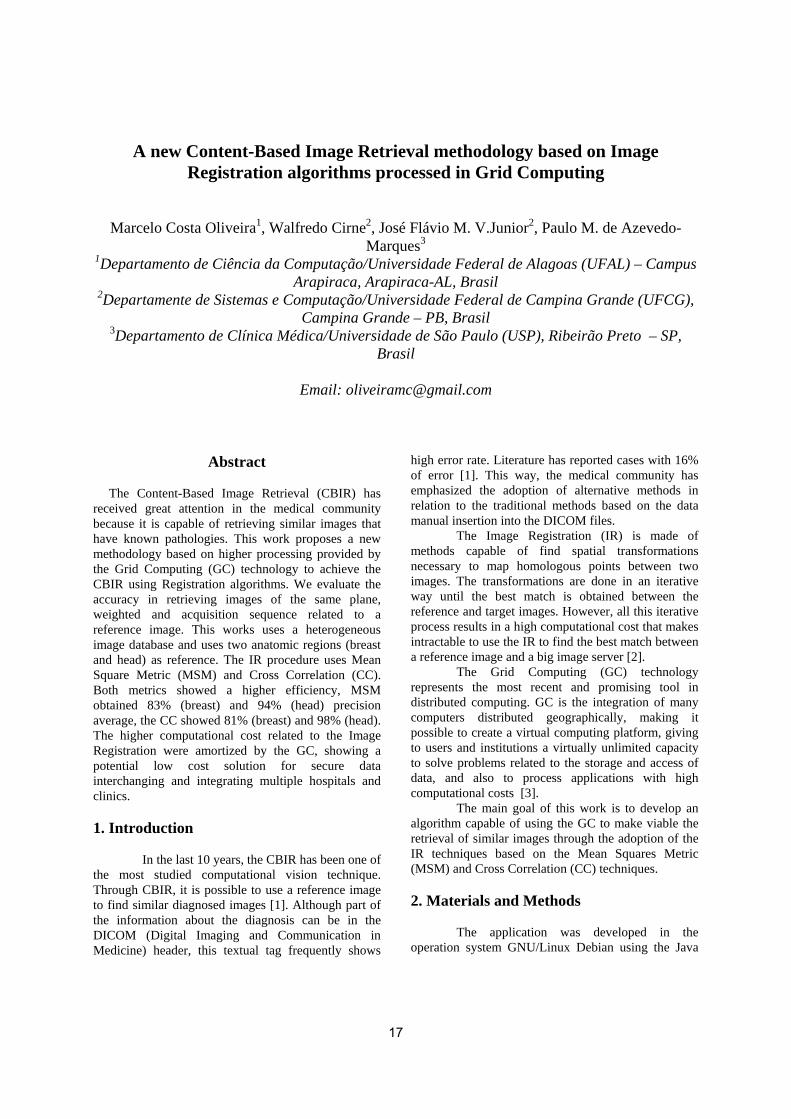
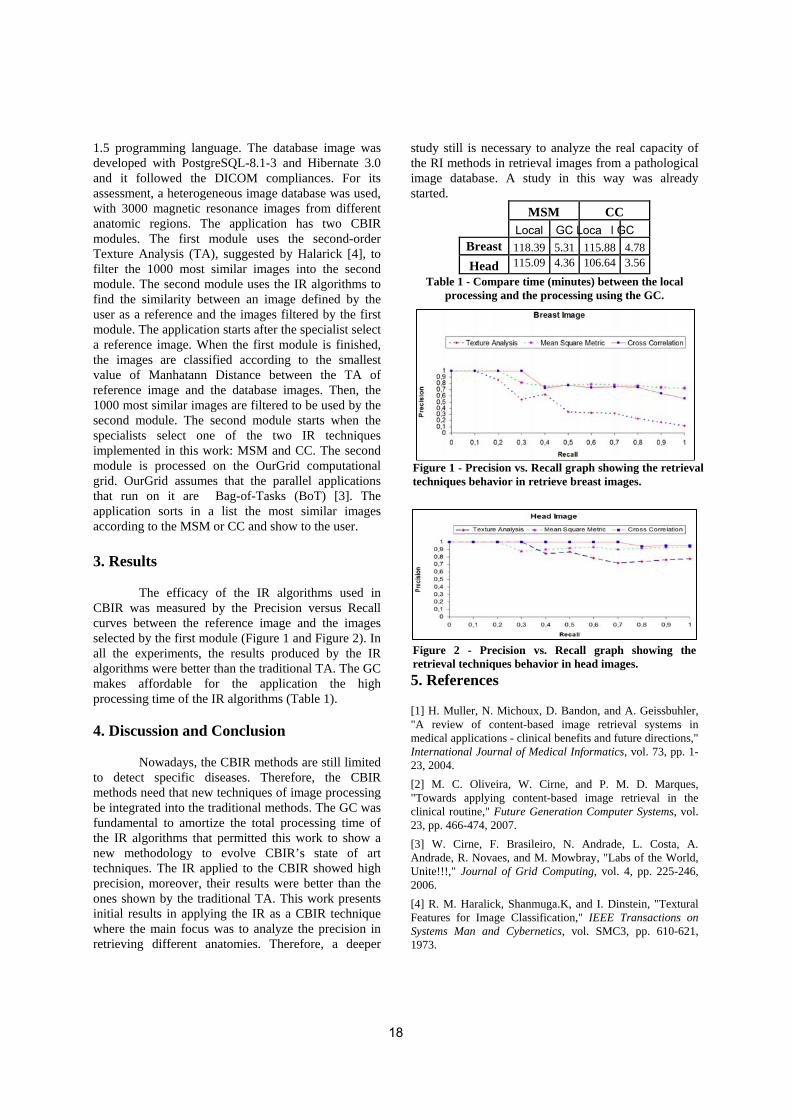
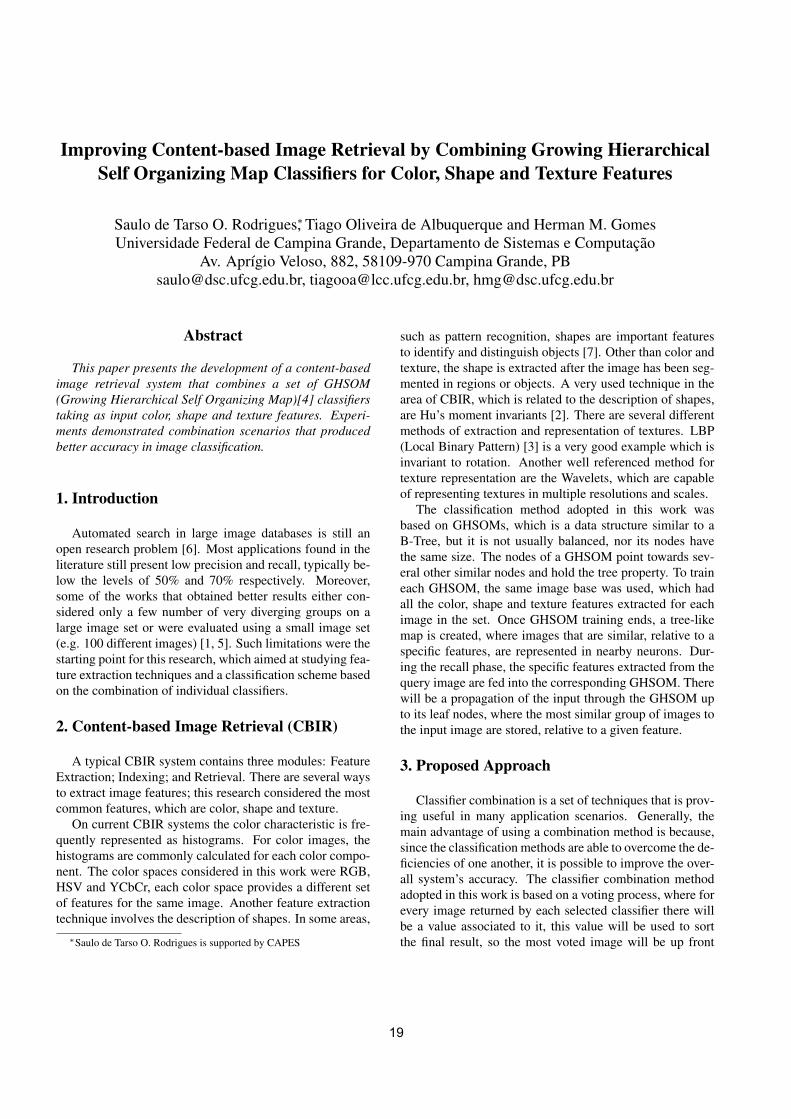
The efficacy of the IR algorithms used in CBIR was measured by the Precision versus Recall curves between the reference image and the images selected by the first module (Figure 1 and Figure 2). In all the experiments, the results produced by the IR algorithms were better than the traditional TA. The GC makes affordable for the application the high processing time of the IR algorithms (Table 1).
4. Discussion and Conclusion
Nowadays, the CBIR methods are still limited to detect specific diseases. Therefore, the CBIR methods need that new techniques of image processing be integrated into the traditional methods. The GC was fundamental to amortize the total processing time of the IR algorithms that permitted this work to show a new methodology to evolve CBIR’s state of art techniques. The IR applied to the CBIR showed high precision, moreover, their results were better than the ones shown by the traditional TA. This work presents initial results in applying the IR as a CBIR technique where the main focus was to analyze the precision in retrieving different anatomies. Therefore, a deeper
study still is necessary to analyze the real capacity of the RI methods in retrieval images from a pathological image database. A study in this way was already started.
MSM CC Local GC Loca l GC
Breast 118.39 5.31 115.88 4.78 Head 115.09 4.36 106.64 3.56
Table 1 - Compare time (minutes) between the local processing and the processing using the GC.
5. References [1] H. Muller, N. Michoux, D. Bandon, and A. Geissbuhler, "A review of content-based image retrieval systems in medical applications - clinical benefits and future directions," International Journal of Medical Informatics, vol. 73, pp. 1-23, 2004. [2] M. C. Oliveira, W. Cirne, and P. M. D. Marques, "Towards applying content-based image retrieval in the clinical routine," Future Generation Computer Systems, vol. 23, pp. 466-474, 2007. [3] W. Cirne, F. Brasileiro, N. Andrade, L. Costa, A. Andrade, R. Novaes, and M. Mowbray, "Labs of the World, Unite!!!," Journal of Grid Computing, vol. 4, pp. 225-246, 2006. [4] R. M. Haralick, Shanmuga.K, and I. Dinstein, "Textural Features for Image Classification," IEEE Transactions on Systems Man and Cybernetics, vol. SMC3, pp. 610-621, 1973.
Figure 2 - Precision vs. Recall graph showing the retrieval techniques behavior in head images.
Figure 1 - Precision vs. Recall graph showing the retrieval techniques behavior in retrieve breast images.
18
Improving Content-based Image Retrieval by Combining Growing HierarchicalSelf Organizing Map Classifiers for Color, Shape and Texture Features
Saulo de Tarso O. Rodrigues∗, Tiago Oliveira de Albuquerque and Herman M. GomesUniversidade Federal de Campina Grande, Departamento de Sistemas e Computacao
Av. Aprıgio Veloso, 882, 58109-970 Campina Grande, [email protected], [email protected], [email protected]
Abstract
This paper presents the development of a content-basedimage retrieval system that combines a set of GHSOM(Growing Hierarchical Self Organizing Map)[4] classifierstaking as input color, shape and texture features. Experi-ments demonstrated combination scenarios that producedbetter accuracy in image classification.
1. Introduction
Automated search in large image databases is still anopen research problem [6]. Most applications found in theliterature still present low precision and recall, typically be-low the levels of 50% and 70% respectively. Moreover,some of the works that obtained better results either con-sidered only a few number of very diverging groups on alarge image set or were evaluated using a small image set(e.g. 100 different images) [1, 5]. Such limitations were thestarting point for this research, which aimed at studying fea-ture extraction techniques and a classification scheme basedon the combination of individual classifiers.
2. Content-based Image Retrieval (CBIR)
A typical CBIR system contains three modules: FeatureExtraction; Indexing; and Retrieval. There are several waysto extract image features; this research considered the mostcommon features, which are color, shape and texture.
On current CBIR systems the color characteristic is fre-quently represented as histograms. For color images, thehistograms are commonly calculated for each color compo-nent. The color spaces considered in this work were RGB,HSV and YCbCr, each color space provides a different setof features for the same image. Another feature extractiontechnique involves the description of shapes. In some areas,
∗Saulo de Tarso O. Rodrigues is supported by CAPES
such as pattern recognition, shapes are important featuresto identify and distinguish objects [7]. Other than color andtexture, the shape is extracted after the image has been seg-mented in regions or objects. A very used technique in thearea of CBIR, which is related to the description of shapes,are Hu’s moment invariants [2]. There are several differentmethods of extraction and representation of textures. LBP(Local Binary Pattern) [3] is a very good example which isinvariant to rotation. Another well referenced method fortexture representation are the Wavelets, which are capableof representing textures in multiple resolutions and scales.
The classification method adopted in this work wasbased on GHSOMs, which is a data structure similar to aB-Tree, but it is not usually balanced, nor its nodes havethe same size. The nodes of a GHSOM point towards sev-eral other similar nodes and hold the tree property. To traineach GHSOM, the same image base was used, which hadall the color, shape and texture features extracted for eachimage in the set. Once GHSOM training ends, a tree-likemap is created, where images that are similar, relative to aspecific features, are represented in nearby neurons. Dur-ing the recall phase, the specific features extracted from thequery image are fed into the corresponding GHSOM. Therewill be a propagation of the input through the GHSOM upto its leaf nodes, where the most similar group of images tothe input image are stored, relative to a given feature.
3. Proposed Approach
Classifier combination is a set of techniques that is prov-ing useful in many application scenarios. Generally, themain advantage of using a combination method is because,since the classification methods are able to overcome the de-ficiencies of one another, it is possible to improve the over-all system’s accuracy. The classifier combination methodadopted in this work is based on a voting process, where forevery image returned by each selected classifier there willbe a value associated to it, this value will be used to sortthe final result, so the most voted image will be up front
19
in the result, and considered to be the most similar imageto the searched one. To calculate the vote for each image,the quantization error [4] produced by the GHSOM to theimage is considered. This value is between zero and one,the closest to zero the more similar the image is. The layerof the GHSOM where the image appears is also used in thecalculation. The following equation is used to calculate thevote for each returned image:
vi =
G∑g
(1 − QEg,i) · (LCg,i
LTg) (1)
where i is the image, G is the count of used GHSOM’s,QEg,i indicates the quantization error of the image for agiven GHSOM, LCg,i indicates the layer of the image fora given GHSOM and LTg is the total number of layers ofa given GHSOM, which results on a double precision valuerelated to every retrieved image.
4. Experimental Results and Analysis
In order to test the proposed approach and classifiercombination, part of Microsoft Research Cambridge ObjectRecognition Image database, version 1.0, has been used.This is a labeled database with 800 images, divided in 16sets of 50 images each. Six GHSOM networks that werechosen to evaluate classifier combination were the oneswhich presented the best individual results. The tests firstconsidered all possible combinations from C(6, 1) (isolatedresults) to C(6, 6), which gives a total of 63 tests. The crudecombination does not exclude any results, so the bad im-ages from all the combined GHSOMs will be returned asa valid result. To overcome this deficiency of the combi-nation, a result filtering strategy has been adopted, whichconsisted of gradually varying the number of images recov-ered using the classifier combination and recalculating theprecision for each number of returned images tested. Thisshowed that, as the allowed number of returned images isreduced, more bad images start being rejected and betterimages start being accepted.
In comparison to the simple classification methods, clas-sifier combination resulted on a considerable improvementfor precision (see Table 1). The simple classificationmethod that obtained the best precision was the one usingthe color feature on HSV space and 32 levels per compo-nent. Initially the simple classification has a better preci-sion, when considering more than 70 images, but with areduction on the resulting images, there is a natural reduc-tion in the images that are not considered to be similar andthe combination results are greatly superior to the ones ofthe simple classification. The best combination used HSV16, RGB 32, LBP and Wavelets, increasing the mean preci-sion in over 17% when the number of returned images is set
to five. Even with the simpler combinations, the results aresuperior when the amount of returned images is under 40.The classification combination showed superior results tothe simple classification, where only one feature of the im-age is used. Table 1 also shows that even the best individualresult is not superior to the worst combined result.
Table 1. Experimental Results
ClassifierPrecision
(%)WAV 12.50LBP 18.38Hu 10.78RGB 32 17.05HSV 16 20.33YCbCr 32 19,55RGB 32 - LBP 29.38HSV 16 - RGB 32 - LBP 33.13HSV 16 - RGB 32 - LBP - WAV 33.52HSV 16 - RGB 32 - YCbCr 32 - LBP - WAV 31.48HSV 16 - RGB 32 - YCbCr 32 - Hu - LBP - WAV 30.08
5. Conclusion
The main contribution of this research was the develop-ment of a combination technique for image classifiers basedon GHSOM neural networks, improving the overall preci-sion of a content based image retrieval system. The pre-sented experimental results confirm that using a classifierscombination technique yields a considerable improvementof precision and recall for image retrieval.
References
[1] P. B.G., G. S.K., and B. K.K. Color and shape index forregion-based image retrieval. International Workshop on Vi-sual Form, 2001.
[2] T. S. Huang and Y. Rui. Image retrieval: Past, present, andfuture. Symposium on Multimedia Information Processing,1997.
[3] T. Ojala, M. Pietikainen, and T. Maenpaa. Multiresolutiongray-scale and rotation invariant texture classification with lo-cal binary patterns. IEEE Transactions on Pattern Analysisand Machine Intelligence, 24(7):971–987, 2002.
[4] A. Rauber, D. Merkl, and M. Dittenbach. The growing hi-erarchical self-organizing map: exploratory analysis of high-dimensional data. Neural Networks, IEEE Transactions on,13(6):1331–1341, 2002.
[5] E. Stian. Cbir distance measures and genetic programming.Undergraduate Theses from Norwegian Classification of Im-ages using Color, 2006.
[6] R. Torres. Recuperao de imagens por contedo. Revista Com-putao Brasil - Sociedade Brasileira de Computao, 2006.
[7] D. Zhang and G. Lu. Review of shape representation and de-scription techniques. Pattern Recognition, 37(1):1–19, 2004.
20

Computer Graphics, Vision, and Modeling
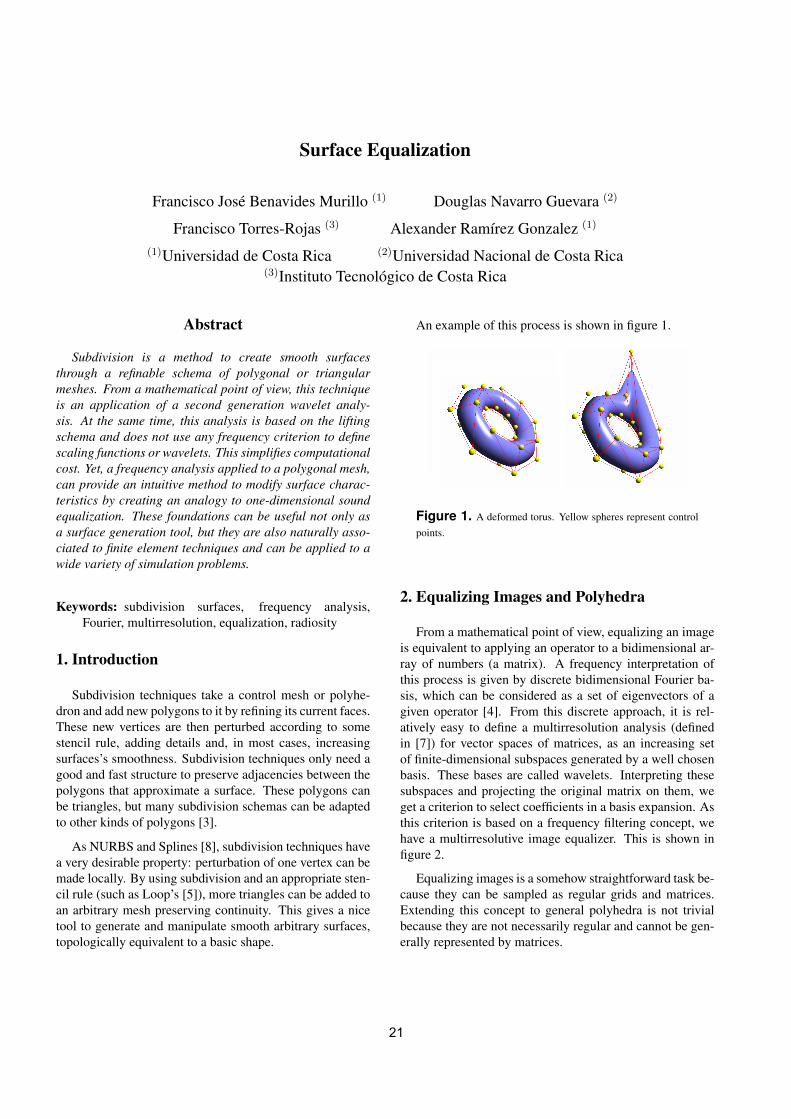
Surface Equalization
Francisco José Benavides Murillo (1) Douglas Navarro Guevara (2)
Francisco Torres-Rojas (3) Alexander Ramírez Gonzalez (1)
(1)Universidad de Costa Rica (2)Universidad Nacional de Costa Rica(3)Instituto Tecnológico de Costa Rica
Abstract
Subdivision is a method to create smooth surfacesthrough a refinable schema of polygonal or triangularmeshes. From a mathematical point of view, this techniqueis an application of a second generation wavelet analy-sis. At the same time, this analysis is based on the liftingschema and does not use any frequency criterion to definescaling functions or wavelets. This simplifies computationalcost. Yet, a frequency analysis applied to a polygonal mesh,can provide an intuitive method to modify surface charac-teristics by creating an analogy to one-dimensional soundequalization. These foundations can be useful not only asa surface generation tool, but they are also naturally asso-ciated to finite element techniques and can be applied to awide variety of simulation problems.
Keywords: subdivision surfaces, frequency analysis,Fourier, multirresolution, equalization, radiosity
1. Introduction
Subdivision techniques take a control mesh or polyhe-dron and add new polygons to it by refining its current faces.These new vertices are then perturbed according to somestencil rule, adding details and, in most cases, increasingsurfaces’s smoothness. Subdivision techniques only need agood and fast structure to preserve adjacencies between thepolygons that approximate a surface. These polygons canbe triangles, but many subdivision schemas can be adaptedto other kinds of polygons [3].
As NURBS and Splines [8], subdivision techniques havea very desirable property: perturbation of one vertex can bemade locally. By using subdivision and an appropriate sten-cil rule (such as Loop’s [5]), more triangles can be added toan arbitrary mesh preserving continuity. This gives a nicetool to generate and manipulate smooth arbitrary surfaces,topologically equivalent to a basic shape.
An example of this process is shown in figure 1.
Figure 1. A deformed torus. Yellow spheres represent controlpoints.
2. Equalizing Images and Polyhedra
From a mathematical point of view, equalizing an imageis equivalent to applying an operator to a bidimensional ar-ray of numbers (a matrix). A frequency interpretation ofthis process is given by discrete bidimensional Fourier ba-sis, which can be considered as a set of eigenvectors of agiven operator [4]. From this discrete approach, it is rel-atively easy to define a multirresolution analysis (definedin [7]) for vector spaces of matrices, as an increasing setof finite-dimensional subspaces generated by a well chosenbasis. These bases are called wavelets. Interpreting thesesubspaces and projecting the original matrix on them, weget a criterion to select coefficients in a basis expansion. Asthis criterion is based on a frequency filtering concept, wehave a multirresolutive image equalizer. This is shown infigure 2.
Equalizing images is a somehow straightforward task be-cause they can be sampled as regular grids and matrices.Extending this concept to general polyhedra is not trivialbecause they are not necessarily regular and cannot be gen-erally represented by matrices.
21
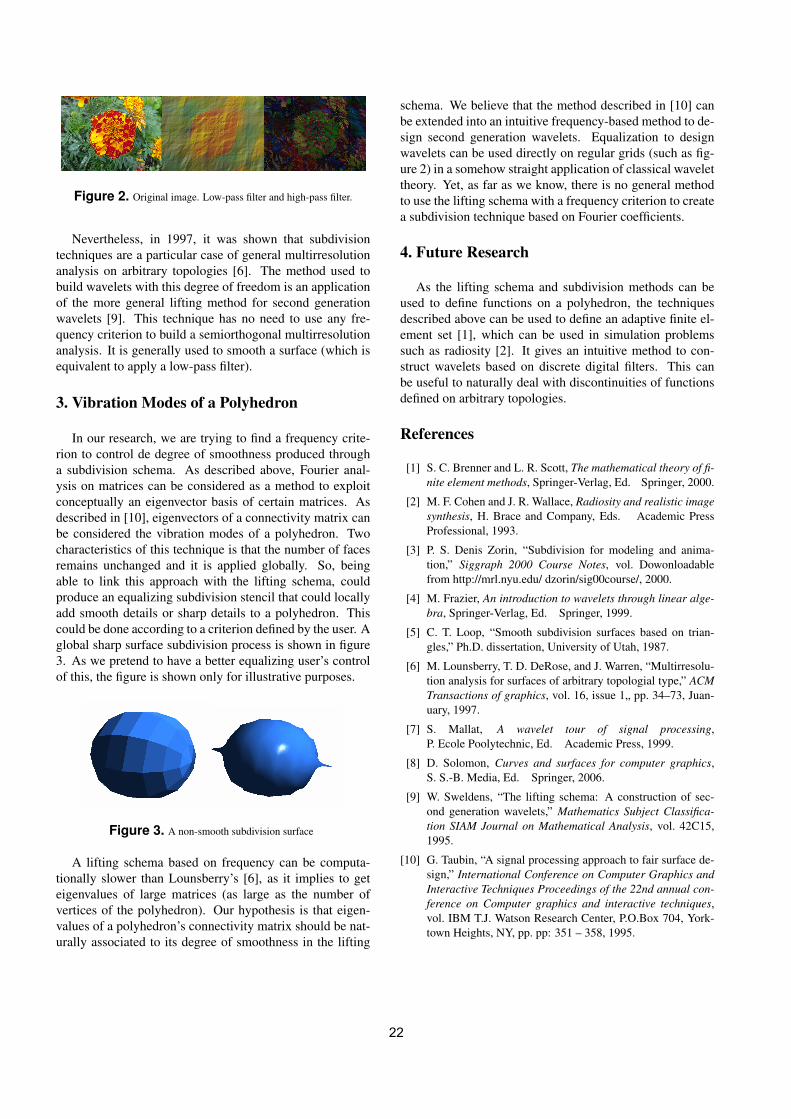
Figure 2. Original image. Low-pass filter and high-pass filter.
Nevertheless, in 1997, it was shown that subdivisiontechniques are a particular case of general multirresolutionanalysis on arbitrary topologies [6]. The method used tobuild wavelets with this degree of freedom is an applicationof the more general lifting method for second generationwavelets [9]. This technique has no need to use any fre-quency criterion to build a semiorthogonal multirresolutionanalysis. It is generally used to smooth a surface (which isequivalent to apply a low-pass filter).
3. Vibration Modes of a Polyhedron
In our research, we are trying to find a frequency crite-rion to control de degree of smoothness produced througha subdivision schema. As described above, Fourier anal-ysis on matrices can be considered as a method to exploitconceptually an eigenvector basis of certain matrices. Asdescribed in [10], eigenvectors of a connectivity matrix canbe considered the vibration modes of a polyhedron. Twocharacteristics of this technique is that the number of facesremains unchanged and it is applied globally. So, beingable to link this approach with the lifting schema, couldproduce an equalizing subdivision stencil that could locallyadd smooth details or sharp details to a polyhedron. Thiscould be done according to a criterion defined by the user. Aglobal sharp surface subdivision process is shown in figure3. As we pretend to have a better equalizing user’s controlof this, the figure is shown only for illustrative purposes.
Figure 3. A non-smooth subdivision surface
A lifting schema based on frequency can be computa-tionally slower than Lounsberry’s [6], as it implies to geteigenvalues of large matrices (as large as the number ofvertices of the polyhedron). Our hypothesis is that eigen-values of a polyhedron’s connectivity matrix should be nat-urally associated to its degree of smoothness in the lifting
schema. We believe that the method described in [10] canbe extended into an intuitive frequency-based method to de-sign second generation wavelets. Equalization to designwavelets can be used directly on regular grids (such as fig-ure 2) in a somehow straight application of classical wavelettheory. Yet, as far as we know, there is no general methodto use the lifting schema with a frequency criterion to createa subdivision technique based on Fourier coefficients.
4. Future Research
As the lifting schema and subdivision methods can beused to define functions on a polyhedron, the techniquesdescribed above can be used to define an adaptive finite el-ement set [1], which can be used in simulation problemssuch as radiosity [2]. It gives an intuitive method to con-struct wavelets based on discrete digital filters. This canbe useful to naturally deal with discontinuities of functionsdefined on arbitrary topologies.
References
[1] S. C. Brenner and L. R. Scott, The mathematical theory of fi-nite element methods, Springer-Verlag, Ed. Springer, 2000.
[2] M. F. Cohen and J. R. Wallace, Radiosity and realistic imagesynthesis, H. Brace and Company, Eds. Academic PressProfessional, 1993.
[3] P. S. Denis Zorin, “Subdivision for modeling and anima-tion,” Siggraph 2000 Course Notes, vol. Dowonloadablefrom http://mrl.nyu.edu/ dzorin/sig00course/, 2000.
[4] M. Frazier, An introduction to wavelets through linear alge-bra, Springer-Verlag, Ed. Springer, 1999.
[5] C. T. Loop, “Smooth subdivision surfaces based on trian-gles,” Ph.D. dissertation, University of Utah, 1987.
[6] M. Lounsberry, T. D. DeRose, and J. Warren, “Multirresolu-tion analysis for surfaces of arbitrary topologial type,” ACMTransactions of graphics, vol. 16, issue 1„ pp. 34–73, Juan-uary, 1997.
[7] S. Mallat, A wavelet tour of signal processing,P. Ecole Poolytechnic, Ed. Academic Press, 1999.
[8] D. Solomon, Curves and surfaces for computer graphics,S. S.-B. Media, Ed. Springer, 2006.
[9] W. Sweldens, “The lifting schema: A construction of sec-ond generation wavelets,” Mathematics Subject Classifica-tion SIAM Journal on Mathematical Analysis, vol. 42C15,1995.
[10] G. Taubin, “A signal processing approach to fair surface de-sign,” International Conference on Computer Graphics andInteractive Techniques Proceedings of the 22nd annual con-ference on Computer graphics and interactive techniques,vol. IBM T.J. Watson Research Center, P.O.Box 704, York-town Heights, NY, pp. pp: 351 – 358, 1995.
22
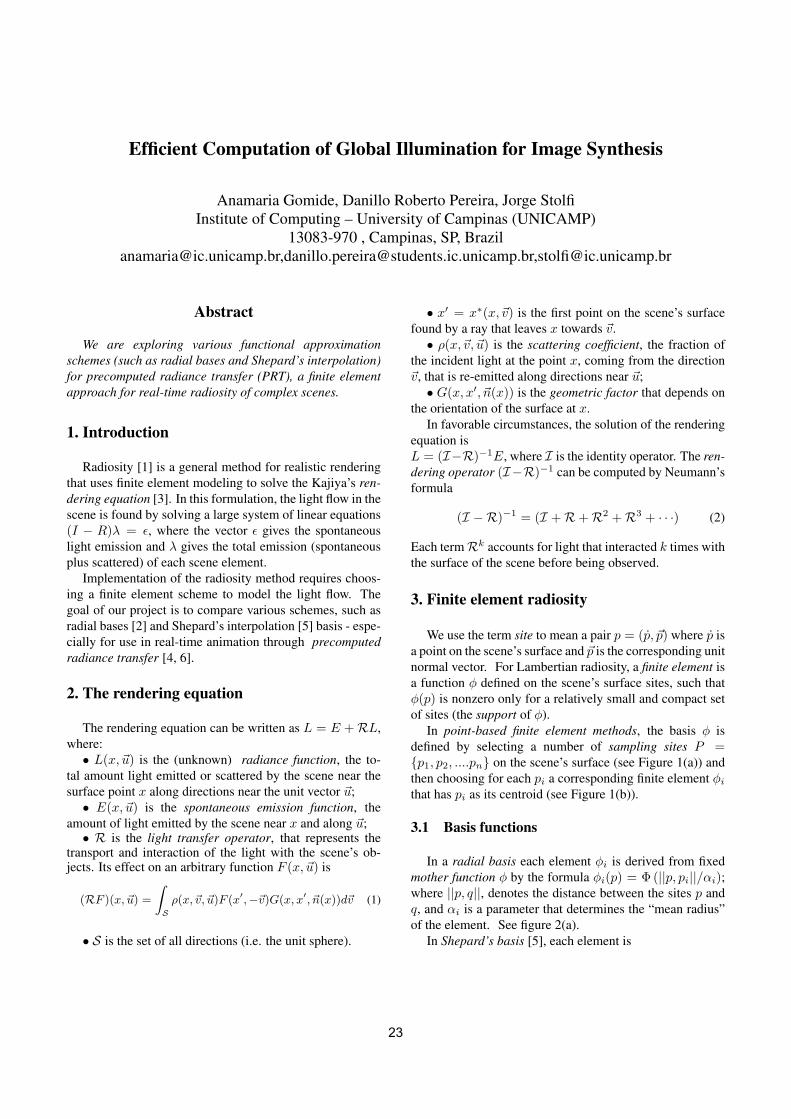
Efficient Computation of Global Illumination for Image Synthesis
Anamaria Gomide, Danillo Roberto Pereira, Jorge StolfiInstitute of Computing – University of Campinas (UNICAMP)
13083-970 , Campinas, SP, [email protected],[email protected],[email protected]
Abstract
We are exploring various functional approximationschemes (such as radial bases and Shepard’s interpolation)for precomputed radiance transfer (PRT), a finite elementapproach for real-time radiosity of complex scenes.
1. Introduction
Radiosity [1] is a general method for realistic renderingthat uses finite element modeling to solve the Kajiya’s ren-dering equation [3]. In this formulation, the light flow in thescene is found by solving a large system of linear equations(I − R)λ = ε, where the vector ε gives the spontaneouslight emission and λ gives the total emission (spontaneousplus scattered) of each scene element.
Implementation of the radiosity method requires choos-ing a finite element scheme to model the light flow. Thegoal of our project is to compare various schemes, such asradial bases [2] and Shepard’s interpolation [5] basis - espe-cially for use in real-time animation through precomputedradiance transfer [4, 6].
2. The rendering equation
The rendering equation can be written as L = E +RL,where:• L(x, ~u) is the (unknown) radiance function, the to-
tal amount light emitted or scattered by the scene near thesurface point x along directions near the unit vector ~u;• E(x, ~u) is the spontaneous emission function, the
amount of light emitted by the scene near x and along ~u;• R is the light transfer operator, that represents the
transport and interaction of the light with the scene’s ob-jects. Its effect on an arbitrary function F (x, ~u) is
(RF )(x, ~u) =
∫
Sρ(x,~v, ~u)F (x′,−~v)G(x, x′, ~n(x))d~v (1)
• S is the set of all directions (i.e. the unit sphere).
• x′ = x∗(x,~v) is the first point on the scene’s surfacefound by a ray that leaves x towards ~v.• ρ(x,~v, ~u) is the scattering coefficient, the fraction of
the incident light at the point x, coming from the direction~v, that is re-emitted along directions near ~u;• G(x, x′, ~n(x)) is the geometric factor that depends on
the orientation of the surface at x.In favorable circumstances, the solution of the rendering
equation isL = (I−R)−1E, where I is the identity operator. The ren-dering operator (I−R)−1 can be computed by Neumann’sformula
(I −R)−1 = (I +R+R2 +R3 + · · ·) (2)
Each termRk accounts for light that interacted k times withthe surface of the scene before being observed.
3. Finite element radiosity
We use the term site to mean a pair p = (p, ~p) where p isa point on the scene’s surface and ~p is the corresponding unitnormal vector. For Lambertian radiosity, a finite element isa function φ defined on the scene’s surface sites, such thatφ(p) is nonzero only for a relatively small and compact setof sites (the support of φ).
In point-based finite element methods, the basis φ isdefined by selecting a number of sampling sites P =p1, p2, ....pn on the scene’s surface (see Figure 1(a)) andthen choosing for each pi a corresponding finite element φi
that has pi as its centroid (see Figure 1(b)).
3.1 Basis functions
In a radial basis each element φi is derived from fixedmother function φ by the formula φi(p) = Φ (||p, pi||/αi);where ||p, q||, denotes the distance between the sites p andq, and αi is a parameter that determines the “mean radius”of the element. See figure 2(a).
In Shepard’s basis [5], each element is
23
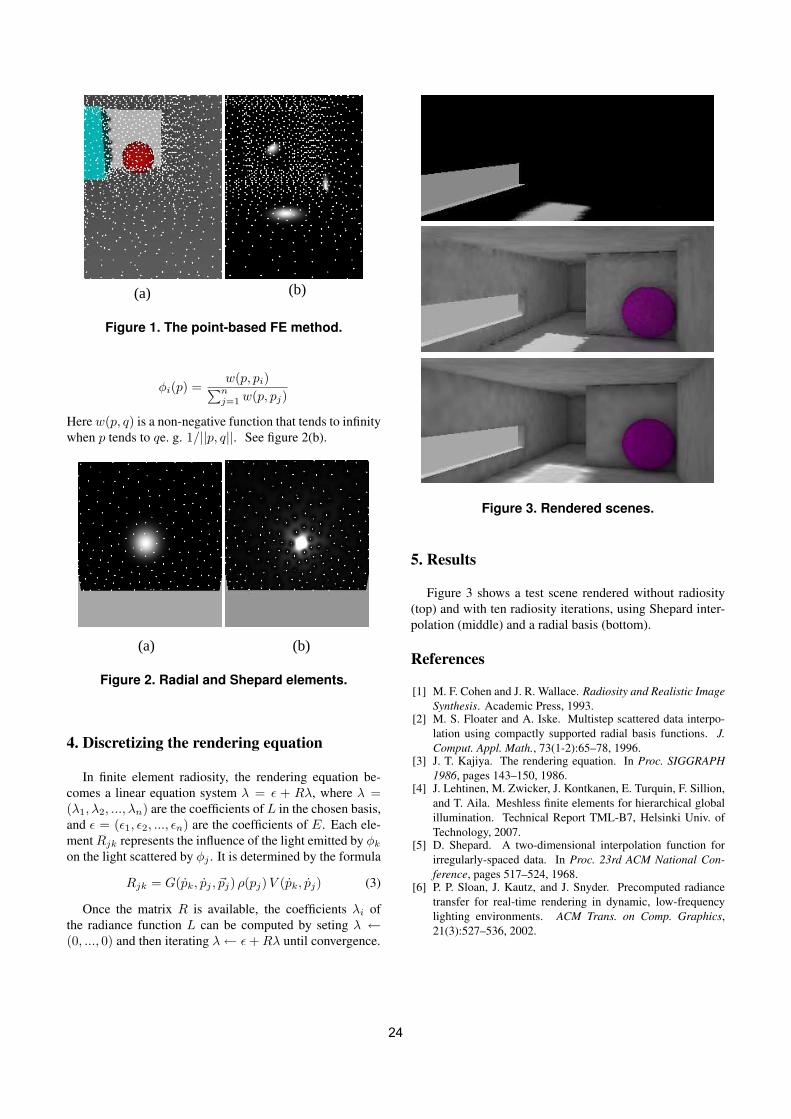
(a) (b)
Figure 1. The point-based FE method.
φi(p) =w(p, pi)∑n
j=1 w(p, pj)
Here w(p, q) is a non-negative function that tends to infinitywhen p tends to qe. g. 1/||p, q||. See figure 2(b).
(a) (b)
Figure 2. Radial and Shepard elements.
4. Discretizing the rendering equation
In finite element radiosity, the rendering equation be-comes a linear equation system λ = ε + Rλ, where λ =(λ1, λ2, ..., λn) are the coefficients of L in the chosen basis,and ε = (ε1, ε2, ..., εn) are the coefficients of E. Each ele-ment Rjk represents the influence of the light emitted by φk
on the light scattered by φj . It is determined by the formula
Rjk = G(pk, pj , ~pj) ρ(pj)V (pk, pj) (3)
Once the matrix R is available, the coefficients λi ofthe radiance function L can be computed by seting λ ←(0, ..., 0) and then iterating λ← ε + Rλ until convergence.
Figure 3. Rendered scenes.
5. Results
Figure 3 shows a test scene rendered without radiosity(top) and with ten radiosity iterations, using Shepard inter-polation (middle) and a radial basis (bottom).
References
[1] M. F. Cohen and J. R. Wallace. Radiosity and Realistic ImageSynthesis. Academic Press, 1993.
[2] M. S. Floater and A. Iske. Multistep scattered data interpo-lation using compactly supported radial basis functions. J.Comput. Appl. Math., 73(1-2):65–78, 1996.
[3] J. T. Kajiya. The rendering equation. In Proc. SIGGRAPH1986, pages 143–150, 1986.
[4] J. Lehtinen, M. Zwicker, J. Kontkanen, E. Turquin, F. Sillion,and T. Aila. Meshless finite elements for hierarchical globalillumination. Technical Report TML-B7, Helsinki Univ. ofTechnology, 2007.
[5] D. Shepard. A two-dimensional interpolation function forirregularly-spaced data. In Proc. 23rd ACM National Con-ference, pages 517–524, 1968.
[6] P. P. Sloan, J. Kautz, and J. Snyder. Precomputed radiancetransfer for real-time rendering in dynamic, low-frequencylighting environments. ACM Trans. on Comp. Graphics,21(3):527–536, 2002.
24
Using Metaprogrammed Functors to Implement Double-Dispatch for CollisionHandling
Tiago H. C. Nobrega, Diego D. B. Carvalho, Aldo von WangenheimLAPIX - Laboratory for Image Processing and Computer Graphics
UFSC - Federal University of Santa Catarina, Braziltigarmo,diegodbc,[email protected]
Abstract
We provide a strategy to the management of collisionsbetween multiple objects with different types employingmultiple-dispatch and both Object-Oriented and GenericProgramming concepts. The solution scales well to thenumber of object types, with a fixed, constant-time cost toarrive at the proper interference-detection routine. Addi-tionally, it helps the application programmer by allowingthem to implement only the functionality required by theirown program, removing the need for common solutions suchas Abstract Base Classes full of pure virtual methods.
1. Introduction
The design of a collision detection engine or frameworkis a difficult task riddled with decisions and trade-offs onimportant design goals such as efficiency, modularity, size,dependencies, and others. The C++ language is a maturelanguage with support for both Object-Oriented (which pro-vides runtime polimorphism and aims at easing the devel-opment and maintenance of large systems, such as 3D en-gines) and Generic (with templates, offering run-time speedbenefits) programming. In this work we explore the com-bination of these methodologies to implement the collisiondetection mechanism between different entities. We aim toexpose the benefits this combination provides to both thesystem designer and the application programmer.
2. Bounding Hierarchies with Double-Dispatchand Meta Programming
Bounding Hierarchies[2] are often employed by colli-sion detection algorithms to speed up interference detec-tion between models with complex geometry, and com-mon choices for bounding objects include Spheres, Ori-ented Bounding Boxes (OBBs) and Axis-Aligned Bounding
Table 1. A matrix of functions.AABBTree SphereTree OBBTree
AABBTree f1 – f2SphereTree – – –OBBTree f3 – f4
Boxes (AABBs). Classes are often designed so that mostfunctionality is placed in a base class, here named Bound-ingTree, and then object-specific details are delegated toother classes that inherit from it.
The problem arises when a scene is composed of manydistinct kinds of entities and a manager object has to decideif two entities are colliding. The manager only has knowl-edge of BoundingTrees. The problem is such: given two in-stances of BoundingTree subclasses, how can we efficientlydetermine if they are intersecting?
Since the choice of algorithm to determine the intersec-tion depends on the types of both entities, this problem canbe solved with Multimethods, which are “the mechanismthat dispatches a function call to different concrete func-tions depending on the dynamic types of multiple objectsinvolved in the call” (Alexandrescu[1]). To cope with thefact that the C++ language has no built-in support for Mul-timethods Alexandrescu proposes a few alternatives, one ofwhich is used here - a constant-time matrix of pointer tofunctions, with some adaptations.
The method consists of assigning a numerical value (anid) to each BoundingTree subclass, retrievable at runtimethrough a virtual function. Alexandrescu uses these ids topopulate a matrix of function pointers, at setup time, and todispatch a function based on the types of two objects.
There are several advantages to this approach: Becausethe matrices become the sole point of interaction, no classinvolved in the BoundingTree hierarchy needs to be awareof the others, reducing build times on changes and poten-tially diminishing coupling — this is a benefit over commonimplementations of double-dispatch like the Visitor designpattern[3]. Additionally, the cost to arrive at the correct
25
Figure 1. Employing different bounding hier-archies at runtime on the Stanford Armadilloand Bunny.
function is constant regardless of the number of subclassesand the matrix needs to be populated (and thus, functionsimplemented) only for the desired types, e.g., if the pro-grammer knows their application won’t need SphereTreesthey can disregard their intersection tests with the other hi-erarchy types entirely (table 1). Since many collision de-tection algorithms are commutative, the number of imple-mented functions can be further reduced.
We extend the matrix to hold Functors (function objects)instead of raw function pointers. The added cost of one vir-tual call is the downside to the greater flexibility, as func-tions are poor at affecting the external world and managingstate. The functors are small pieces of code written sep-arately from the tree hierarchies and dedicated exclusivelyto handling the intersection between two types of boundingobjects.
2.1. Functor Generation with Metaprogramming
It can be cumbersome to populate the matrices individ-ually, cell-by-cell, because a matrix of n types requires n2
functions, or(n2
)+ n if the algorithms are commutative.
The matrices and the functors are actually class templatesand the number of BoundingTree subclasses of interest isusually known at compilation time, so we developed a set ofutility functions that work on Typelists[1] to create appropri-ate Functor classes and populate matrices through metapro-gramming.
For instance, assume we’re interested in managingSphere, AABB and OBB trees. We have code to performthe intersection tests for all combinations between thesethree types of geometric objects, and we wrap all of them in-side an utility class called OverlapDetection. The signature
for all intersection functions is similar such that the generalfunctor to perform the tests could look like:template<c l a s s TreeA , c l a s s TreeB>s t r u c t O v e r l a p T e s t e r
bool operator ( ) ( c o n s t TreeA& a , c o n s t TreeB& b )
re turn O v e r l a p D e t e c t i o n : : o v e r l a p s (a . b o u n d i n g O b j e c t ( ) , b . b o u n d i n g O b j e c t ( ) ) ;
;
Next, we implement a function to receive the list of typesof trees we’re interested in and perform all pairwise combi-nations of types from that list, at compilation time. Eachpair fully defines an OverlapTester functor. If a particularpair doesn’t follow the OverlapDetection convention, theOverlapTester can be trivially specialized. As long as thisspecialization is visible to the compiler it’ll choose it whenforming the specialized pair from the typelist.
3. Conclusions and Future Work
By our initial evaluations the time spent finding the ap-propriate method to dispatch takes up to 10% of the overallintersection process in the worst case. The scene in figure1 reaches about 400 full intersection processings per sec-ond on an standard Athlon X2 3800+ with both models ataround 3 thousand triangles. A next step is to compare thisimplementation with a more traditional approach and locatethe source of the overhead.
We believe the idea of generic functor matrices can beexpanded beyond the double-dispatch case. Any time a newkind of operation has to be performed on a BoundingTreea matrix can be employed instead of further extending thebasic BoundingTree contract to support new dependencies.For example, employing bounding trees for Raytracing[4]would require line segment-bounding tree intersection tests.A matrix for such an application could have one row foreach BoundingTree subclass, and the LineSegment class forits single column.
References
[1] A. Alexandrescu. Modern C++ design: generic program-ming and design patterns applied. Addison-Wesley LongmanPublishing Co., Inc., Boston, MA, USA, 2001.
[2] C. Ericson. Real-Time Collision Detection (The MorganKaufmann Series in Interactive 3D Technology). MorganKaufmann, December 2004.
[3] E. Gamma, R. Helm, R. Johnson, and J. Vlissides. De-sign patterns: elements of reusable object-oriented software.Addison-Wesley Professional, 1995.
[4] I. Wald, S. Boulos, and P. Shirley. Ray tracing deformablescenes using dynamic bounding volume hierarchies. ACMTrans. Graph., 26(1):6, 2007.
26
A Geometric Bisection Algorithm for Automatic Page Layout
AlexandreSeki, Mauricio Klein, Ricardo Piccoli,Isabel Manssour, Joao B. Oliveira
FACIN - Faculdade de Informatica - PUCRSalexandre.seki, mauricio.klein, [email protected],
manssour, [email protected]
Abstract
Content distribution in a page designed for printing is adifficult task performed by human editors. There are appli-cations and tools to help the editor in this task, but it is still amanual, iteractive process that is made more difficult whencontent is distributed in columns, as is the case of news-papers. This work describes an algorithm to automaticallydistribute content in a printable page. Our implementationtries to use all the page, dividing it among the items to beplaced according to their area.
1. Introduction
One of the problems in the design of magazines andnewspapers is to distribute elements on a page. A designeris responsible for creating the page layout, distributing ele-ments to achieve some degree of aesthetic quality. To reacha high-quality final result, that professional usually edits thelayout several times, changing the news positions and for-mat. There are tools to help the designer to format the pagelayout, but these tools do not generates the layout automat-ically and only support human intervention.
A typical bisection algorithm is an algorithm that repeat-edly divides an interval in half and recursively processingboth halves. Here, such an algorithm is used to distributeelements into a page, a task that will help many areas ofdigital publishing. Besides document designers, commonusers may also produce printable pages with a RSS feedcontent or pictures.
Jacobset al. [3, 5] present an algorithm to generate lay-out automatically, using templates to guide the layout con-struction. Harringtonet al. [4] propose a genetic algorithmto distribute elements on a page, but the computational costof a genetic algorithm is very high for massive production.The distribution of photos on a page was researched byAtkins [1]. Another solution for this problem using geneticalgorithms was presented by Geigel and Loui [2].
The main goal of this work is to describe and presentresults of an algorithm to automatically distribute elementsinto a page. This algorithm was developed as part of theAPL (Automatic Page Layout) project. The current versionis able to produce documents akin to newspapers covers. Inour case, a user selects some news and pictures to be placedon the page and the algorithm distribute these elements. Theremaining of the poster is organized as follows: the algo-rithm and the obtained results are described in Section 2;future work and conclusions are presented in Section 3.
2. The APL project
The main goal of the APL Project is to develop ways ofdistributing content automatically on a page. In our algo-rithm, the elements of a page are news, pictures and groupsof such elements. News are composed by a title, the con-tent text and optional attributes, such as author or the pagenumber to the full news. Pictures are placeholders for animage or picture, and groups are used to aggregate them.For example, a group of two images and a piece of newswill have its elements placed together, either side by side orone above the other, thus keeping elements organized.
The algorithm is based on a divide and conquer strategy:it receives the page width and height and a list of elementsto be placed, and through consecutive bisections it dividesthe page area into regions, trying to allocate the requiredarea of a news into this region. In our case, bisection ismade by a horizontal or vertical line dividing a region intotwo new regions and, similarly, the list of elements are alsodivided. We can see an example of the defined regions forsome news in Fig. 1a and 1b. In these figures, we haveused the same news and only the number of columns waschanged.
The algorithm tries to keep the elements in reading or-der (as given by the input sequence), from the top left tothe bottom right. This strategy reduces the amount of pos-sibilities to be examined and also reduces the surprise ofthe user, as news are not placed randomly. The first tests
27
Figure 1. Specified regions in a page (a) with4 and (b) with 6 columns.
were executed, automatically generating newspaper covers,the content were pictures and news. We have high-qualityresults in a short processing time. Fig. 2a shows an exampleof a generated newspaper cover that has as input four newsand three pictures.
Our algorithm can be used to produce pages from RSSfeeds. In this case, most of news are short and have a link tothe full news or other related pages. Another peculiarity ofRSS feeds is that usually there are no pictures. An exampleof a cover generated from RSS feeds is shown in Fig. 2b.Finally, as in Fig. 3, our algorithm can also place pictures,images or photos on a page.
Figure 2. Examples of generated pages (a)from newspaper content and (b) from RSSfeed.
The project is being developed using Java as the mainprogramming language. The input file to the algorithm is anextension of XML obtained by converting RSS feeds and/orWiki formats into our XML extension. The program cangenerate different outputs, such as PDF, LATEX and dvi.
Figure 3. Generated page with pictures
3. Conclusions and Future Work
This poster presents a new algorithm to distribute con-tent automatically in a printable page divided into columns,preserving reading order and taking into account the areaof each news. Future works include finishing the prototypeto make it available for tests and evaluation; extending thepage layout from one to several pages and the developmentof a user interface for simpler use.
Acknowledgements
This work was (partially) developed in collaborationwith HP Brazil R&D.
References
[1] C. B. Atkins. Adaptive photo collection page layout. InICIP,pages 2897–2900, 2004.
[2] J. Geigel and A. C. P. Loui. Automatic page layout using ge-netic algorithms for electronic albuming. volume 4311, pages79–90. SPIE, 2000.
[3] C. Jacobs, W. Li, E. Schrier, D. Bargeron, and D. Salesin.Adaptive grid-based document layout. InSIGGRAPH ’03:ACM SIGGRAPH 2003 Papers, pages 838–847, New York,NY, USA, 2003. ACM.
[4] L. Purvis, S. Harrington, B. O’Sullivan, and E. C. Freuder.Creating personalized documents: an optimization approach.In DocEng ’03: Proceedings of the 2003 ACM symposium onDocument engineering, pages 68–77, New York, NY, USA,2003. ACM.
[5] E. Schrier, M. Dontcheva, C. Jacobs, G. Wade, and D. Salesin.Adaptive layout for dynamically aggregated documents. InIUI ’08: Proceedings of the 13th international conferenceon Intelligent user interfaces, pages 99–108, New York, NY,USA, 2008. ACM.
28
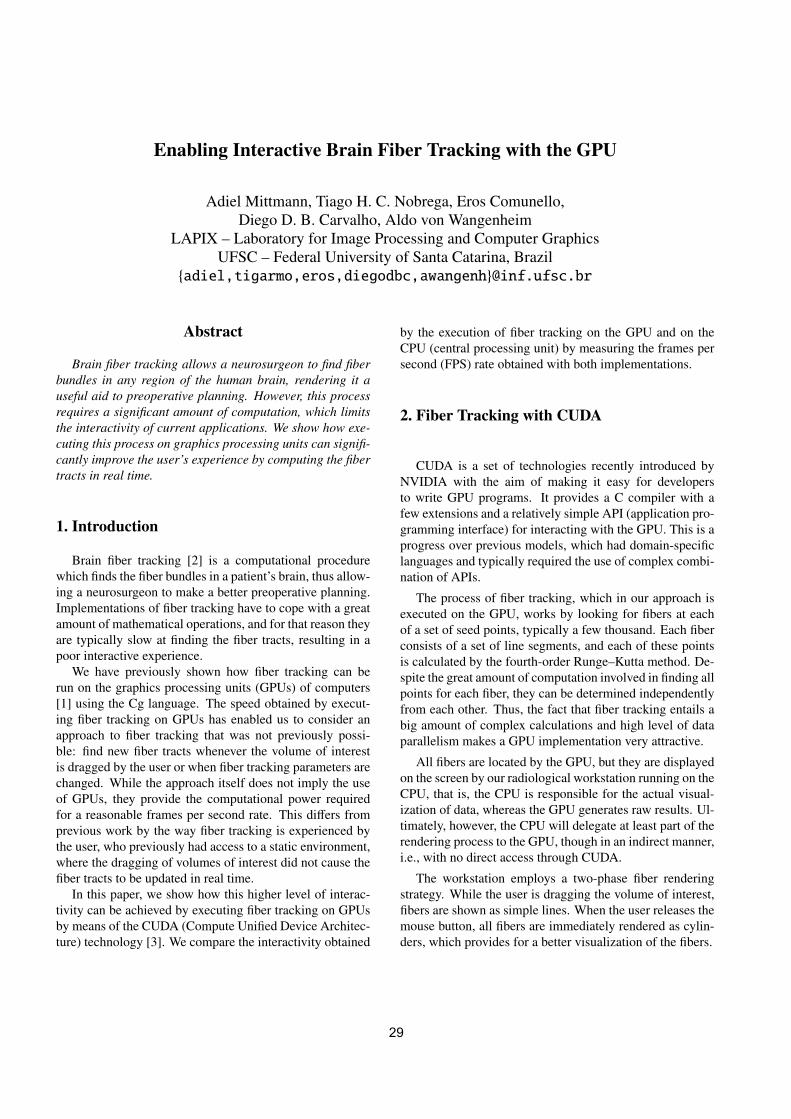
Enabling Interactive Brain Fiber Tracking with the GPU
Adiel Mittmann, Tiago H. C. Nobrega, Eros Comunello,Diego D. B. Carvalho, Aldo von Wangenheim
LAPIX – Laboratory for Image Processing and Computer GraphicsUFSC – Federal University of Santa Catarina, Brazil
adiel,tigarmo,eros,diegodbc,[email protected]
Abstract
Brain fiber tracking allows a neurosurgeon to find fiberbundles in any region of the human brain, rendering it auseful aid to preoperative planning. However, this processrequires a significant amount of computation, which limitsthe interactivity of current applications. We show how exe-cuting this process on graphics processing units can signifi-cantly improve the user’s experience by computing the fibertracts in real time.
1. Introduction
Brain fiber tracking [2] is a computational procedurewhich finds the fiber bundles in a patient’s brain, thus allow-ing a neurosurgeon to make a better preoperative planning.Implementations of fiber tracking have to cope with a greatamount of mathematical operations, and for that reason theyare typically slow at finding the fiber tracts, resulting in apoor interactive experience.
We have previously shown how fiber tracking can berun on the graphics processing units (GPUs) of computers[1] using the Cg language. The speed obtained by execut-ing fiber tracking on GPUs has enabled us to consider anapproach to fiber tracking that was not previously possi-ble: find new fiber tracts whenever the volume of interestis dragged by the user or when fiber tracking parameters arechanged. While the approach itself does not imply the useof GPUs, they provide the computational power requiredfor a reasonable frames per second rate. This differs fromprevious work by the way fiber tracking is experienced bythe user, who previously had access to a static environment,where the dragging of volumes of interest did not cause thefiber tracts to be updated in real time.
In this paper, we show how this higher level of interac-tivity can be achieved by executing fiber tracking on GPUsby means of the CUDA (Compute Unified Device Architec-ture) technology [3]. We compare the interactivity obtained
by the execution of fiber tracking on the GPU and on theCPU (central processing unit) by measuring the frames persecond (FPS) rate obtained with both implementations.
2. Fiber Tracking with CUDA
CUDA is a set of technologies recently introduced byNVIDIA with the aim of making it easy for developersto write GPU programs. It provides a C compiler with afew extensions and a relatively simple API (application pro-gramming interface) for interacting with the GPU. This is aprogress over previous models, which had domain-specificlanguages and typically required the use of complex combi-nation of APIs.
The process of fiber tracking, which in our approach isexecuted on the GPU, works by looking for fibers at eachof a set of seed points, typically a few thousand. Each fiberconsists of a set of line segments, and each of these pointsis calculated by the fourth-order Runge–Kutta method. De-spite the great amount of computation involved in finding allpoints for each fiber, they can be determined independentlyfrom each other. Thus, the fact that fiber tracking entails abig amount of complex calculations and high level of dataparallelism makes a GPU implementation very attractive.
All fibers are located by the GPU, but they are displayedon the screen by our radiological workstation running on theCPU, that is, the CPU is responsible for the actual visual-ization of data, whereas the GPU generates raw results. Ul-timately, however, the CPU will delegate at least part of therendering process to the GPU, though in an indirect manner,i.e., with no direct access through CUDA.
The workstation employs a two-phase fiber renderingstrategy. While the user is dragging the volume of interest,fibers are shown as simple lines. When the user releases themouse button, all fibers are immediately rendered as cylin-ders, which provides for a better visualization of the fibers.
29
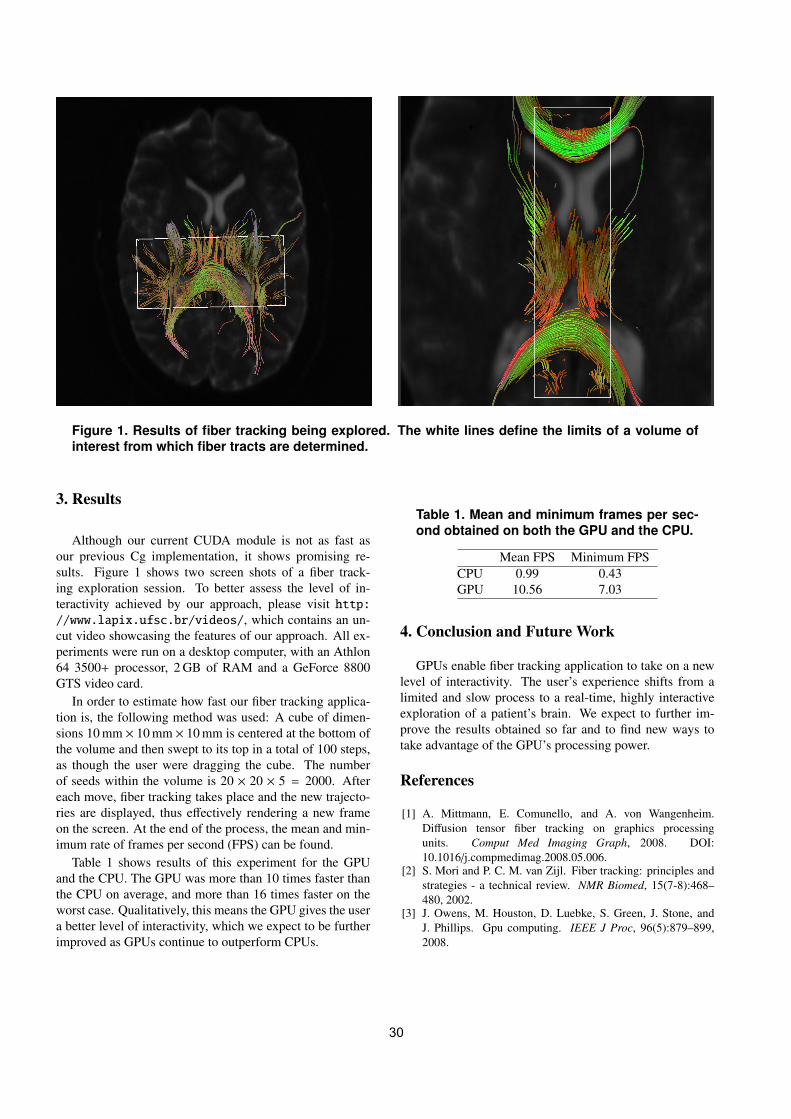
Figure 1. Results of fiber tracking being explored. The white lines define the limits of a volume ofinterest from which fiber tracts are determined.
3. Results
Although our current CUDA module is not as fast asour previous Cg implementation, it shows promising re-sults. Figure 1 shows two screen shots of a fiber track-ing exploration session. To better assess the level of in-teractivity achieved by our approach, please visit http://www.lapix.ufsc.br/videos/, which contains an un-cut video showcasing the features of our approach. All ex-periments were run on a desktop computer, with an Athlon64 3500+ processor, 2 GB of RAM and a GeForce 8800GTS video card.
In order to estimate how fast our fiber tracking applica-tion is, the following method was used: A cube of dimen-sions 10 mm × 10 mm × 10 mm is centered at the bottom ofthe volume and then swept to its top in a total of 100 steps,as though the user were dragging the cube. The numberof seeds within the volume is 20 × 20 × 5 = 2000. Aftereach move, fiber tracking takes place and the new trajecto-ries are displayed, thus effectively rendering a new frameon the screen. At the end of the process, the mean and min-imum rate of frames per second (FPS) can be found.
Table 1 shows results of this experiment for the GPUand the CPU. The GPU was more than 10 times faster thanthe CPU on average, and more than 16 times faster on theworst case. Qualitatively, this means the GPU gives the usera better level of interactivity, which we expect to be furtherimproved as GPUs continue to outperform CPUs.
Table 1. Mean and minimum frames per sec-ond obtained on both the GPU and the CPU.
Mean FPS Minimum FPSCPU 0.99 0.43GPU 10.56 7.03
4. Conclusion and Future Work
GPUs enable fiber tracking application to take on a newlevel of interactivity. The user’s experience shifts from alimited and slow process to a real-time, highly interactiveexploration of a patient’s brain. We expect to further im-prove the results obtained so far and to find new ways totake advantage of the GPU’s processing power.
References
[1] A. Mittmann, E. Comunello, and A. von Wangenheim.Diffusion tensor fiber tracking on graphics processingunits. Comput Med Imaging Graph, 2008. DOI:10.1016/j.compmedimag.2008.05.006.
[2] S. Mori and P. C. M. van Zijl. Fiber tracking: principles andstrategies - a technical review. NMR Biomed, 15(7-8):468–480, 2002.
[3] J. Owens, M. Houston, D. Luebke, S. Green, J. Stone, andJ. Phillips. Gpu computing. IEEE J Proc, 96(5):879–899,2008.
30
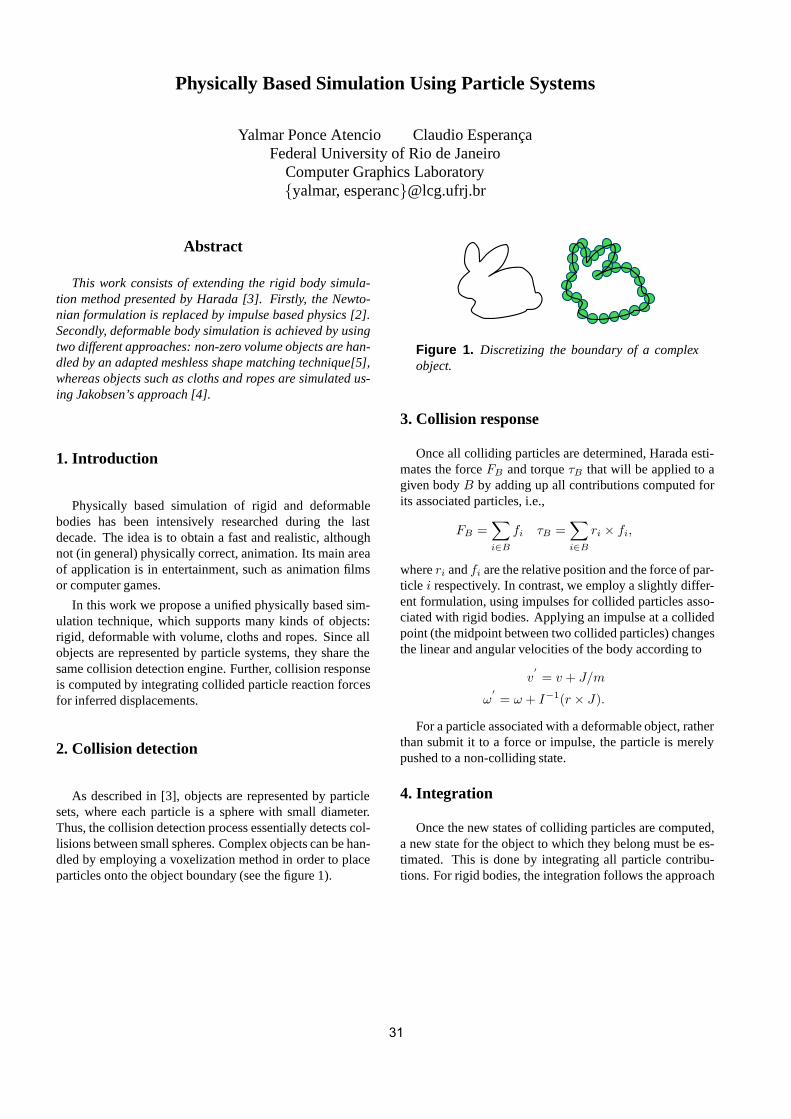
Physically Based Simulation Using Particle Systems
Yalmar Ponce Atencio Claudio EsperancaFederal University of Rio de Janeiro
Computer Graphics Laboratoryyalmar, [email protected]
Abstract
This work consists of extending the rigid body simula-tion method presented by Harada [3]. Firstly, the Newto-nian formulation is replaced by impulse based physics [2].Secondly, deformable body simulation is achieved by usingtwo different approaches: non-zero volume objects are han-dled by an adapted meshless shape matching technique[5],whereas objects such as cloths and ropes are simulated us-ing Jakobsen’s approach [4].
1. Introduction
Physically based simulation of rigid and deformablebodies has been intensively researched during the lastdecade. The idea is to obtain a fast and realistic, althoughnot (in general) physically correct, animation. Its main areaof application is in entertainment, such as animation filmsor computer games.
In this work we propose a unified physically based sim-ulation technique, which supports many kinds of objects:rigid, deformable with volume, cloths and ropes. Since allobjects are represented by particle systems, they share thesame collision detection engine. Further, collision responseis computed by integrating collided particle reaction forcesfor inferred displacements.
2. Collision detection
As described in [3], objects are represented by particlesets, where each particle is a sphere with small diameter.Thus, the collision detection process essentially detects col-lisions between small spheres. Complex objects can be han-dled by employing a voxelization method in order to placeparticles onto the object boundary (see the figure 1).
Figure 1. Discretizing the boundary of a complexobject.
3. Collision response
Once all colliding particles are determined, Harada esti-mates the forceFB and torqueτB that will be applied to agiven bodyB by adding up all contributions computed forits associated particles, i.e.,
FB =∑
i∈B
fi τB =∑
i∈B
ri × fi,
whereri andfi are the relative position and the force of par-ticle i respectively. In contrast, we employ a slightly differ-ent formulation, using impulses for collided particles asso-ciated with rigid bodies. Applying an impulse at a collidedpoint (the midpoint between two collided particles) changesthe linear and angular velocities of the body according to
v′
= v + J/m
ω′
= ω + I−1(r × J).
For a particle associated with a deformable object, ratherthan submit it to a force or impulse, the particle is merelypushed to a non-colliding state.
4. Integration
Once the new states of colliding particles are computed,a new state for the object to which they belong must be es-timated. This is done by integrating all particle contribu-tions. For rigid bodies, the integration follows the approach
31
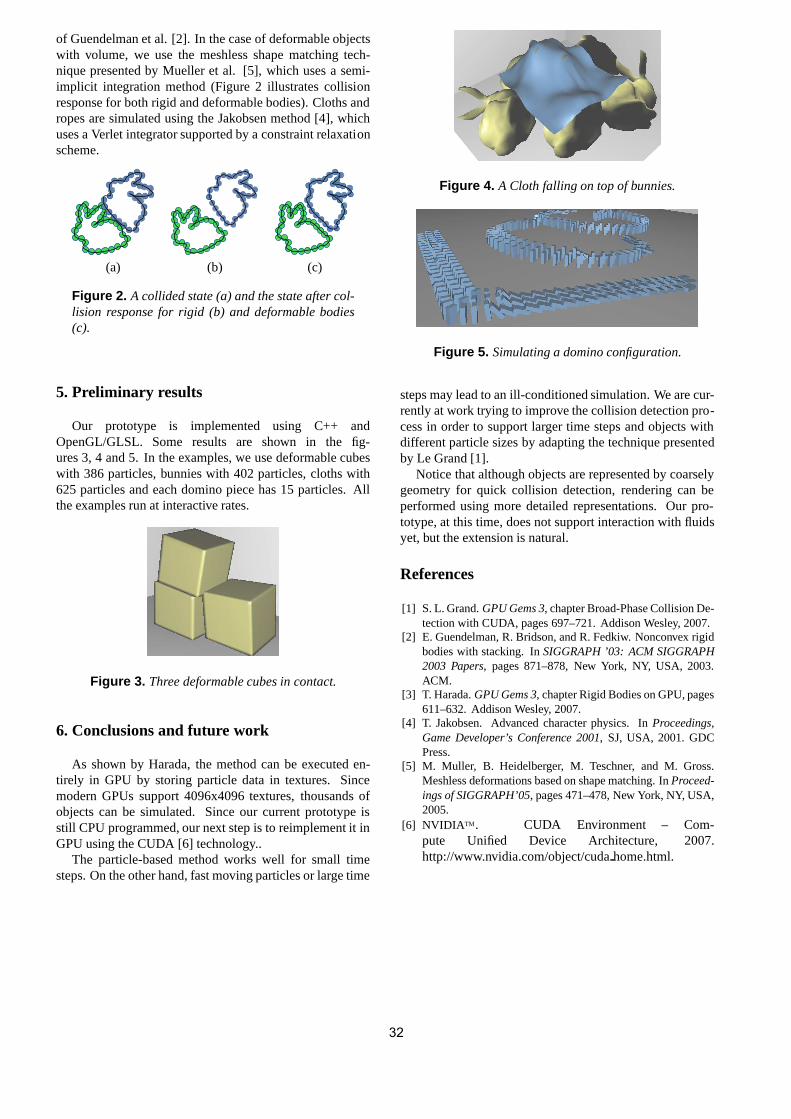
of Guendelman et al. [2]. In the case of deformable objectswith volume, we use the meshless shape matching tech-nique presented by Mueller et al. [5], which uses a semi-implicit integration method (Figure 2 illustrates collisionresponse for both rigid and deformable bodies). Cloths andropes are simulated using the Jakobsen method [4], whichuses a Verlet integrator supported by a constraint relaxationscheme.
(a) (b) (c)
Figure 2. A collided state (a) and the state after col-lision response for rigid (b) and deformable bodies(c).
5. Preliminary results
Our prototype is implemented using C++ andOpenGL/GLSL. Some results are shown in the fig-ures 3, 4 and 5. In the examples, we use deformable cubeswith 386 particles, bunnies with 402 particles, cloths with625 particles and each domino piece has 15 particles. Allthe examples run at interactive rates.
Figure 3. Three deformable cubes in contact.
6. Conclusions and future work
As shown by Harada, the method can be executed en-tirely in GPU by storing particle data in textures. Sincemodern GPUs support 4096x4096 textures, thousands ofobjects can be simulated. Since our current prototype isstill CPU programmed, our next step is to reimplement it inGPU using the CUDA [6] technology..
The particle-based method works well for small timesteps. On the other hand, fast moving particles or large time
Figure 4. A Cloth falling on top of bunnies.
Figure 5. Simulating a domino configuration.
steps may lead to an ill-conditioned simulation. We are cur-rently at work trying to improve the collision detection pro-cess in order to support larger time steps and objects withdifferent particle sizes by adapting the technique presentedby Le Grand [1].
Notice that although objects are represented by coarselygeometry for quick collision detection, rendering can beperformed using more detailed representations. Our pro-totype, at this time, does not support interaction with fluidsyet, but the extension is natural.
References
[1] S. L. Grand.GPU Gems 3, chapter Broad-Phase Collision De-tection with CUDA, pages 697–721. Addison Wesley, 2007.
[2] E. Guendelman, R. Bridson, and R. Fedkiw. Nonconvex rigidbodies with stacking. InSIGGRAPH ’03: ACM SIGGRAPH2003 Papers, pages 871–878, New York, NY, USA, 2003.ACM.
[3] T. Harada.GPU Gems 3, chapter Rigid Bodies on GPU, pages611–632. Addison Wesley, 2007.
[4] T. Jakobsen. Advanced character physics. InProceedings,Game Developer’s Conference 2001, SJ, USA, 2001. GDCPress.
[5] M. Muller, B. Heidelberger, M. Teschner, and M. Gross.Meshless deformations based on shape matching. InProceed-ings of SIGGRAPH’05, pages 471–478, New York, NY, USA,2005.
[6] NVIDIA TM. CUDA Environment – Com-pute Unified Device Architecture, 2007.http://www.nvidia.com/object/cudahome.html.
32
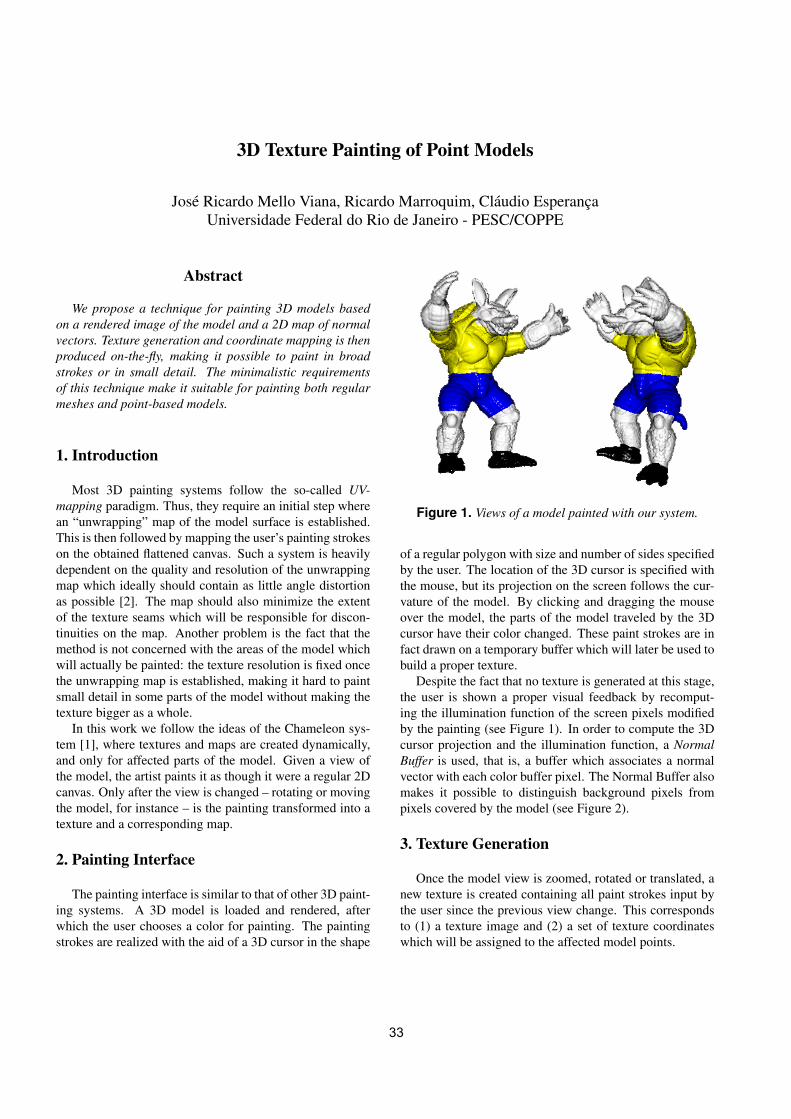
3D Texture Painting of Point Models
Jose Ricardo Mello Viana, Ricardo Marroquim, Claudio EsperancaUniversidade Federal do Rio de Janeiro - PESC/COPPE
Abstract
We propose a technique for painting 3D models basedon a rendered image of the model and a 2D map of normalvectors. Texture generation and coordinate mapping is thenproduced on-the-fly, making it possible to paint in broadstrokes or in small detail. The minimalistic requirementsof this technique make it suitable for painting both regularmeshes and point-based models.
1. Introduction
Most 3D painting systems follow the so-called UV-mapping paradigm. Thus, they require an initial step wherean “unwrapping” map of the model surface is established.This is then followed by mapping the user’s painting strokeson the obtained flattened canvas. Such a system is heavilydependent on the quality and resolution of the unwrappingmap which ideally should contain as little angle distortionas possible [2]. The map should also minimize the extentof the texture seams which will be responsible for discon-tinuities on the map. Another problem is the fact that themethod is not concerned with the areas of the model whichwill actually be painted: the texture resolution is fixed oncethe unwrapping map is established, making it hard to paintsmall detail in some parts of the model without making thetexture bigger as a whole.
In this work we follow the ideas of the Chameleon sys-tem [1], where textures and maps are created dynamically,and only for affected parts of the model. Given a view ofthe model, the artist paints it as though it were a regular 2Dcanvas. Only after the view is changed – rotating or movingthe model, for instance – is the painting transformed into atexture and a corresponding map.
2. Painting Interface
The painting interface is similar to that of other 3D paint-ing systems. A 3D model is loaded and rendered, afterwhich the user chooses a color for painting. The paintingstrokes are realized with the aid of a 3D cursor in the shape
Figure 1. Views of a model painted with our system.
of a regular polygon with size and number of sides specifiedby the user. The location of the 3D cursor is specified withthe mouse, but its projection on the screen follows the cur-vature of the model. By clicking and dragging the mouseover the model, the parts of the model traveled by the 3Dcursor have their color changed. These paint strokes are infact drawn on a temporary buffer which will later be used tobuild a proper texture.
Despite the fact that no texture is generated at this stage,the user is shown a proper visual feedback by recomput-ing the illumination function of the screen pixels modifiedby the painting (see Figure 1). In order to compute the 3Dcursor projection and the illumination function, a NormalBuffer is used, that is, a buffer which associates a normalvector with each color buffer pixel. The Normal Buffer alsomakes it possible to distinguish background pixels frompixels covered by the model (see Figure 2).
3. Texture Generation
Once the model view is zoomed, rotated or translated, anew texture is created containing all paint strokes input bythe user since the previous view change. This correspondsto (1) a texture image and (2) a set of texture coordinateswhich will be assigned to the affected model points.
33
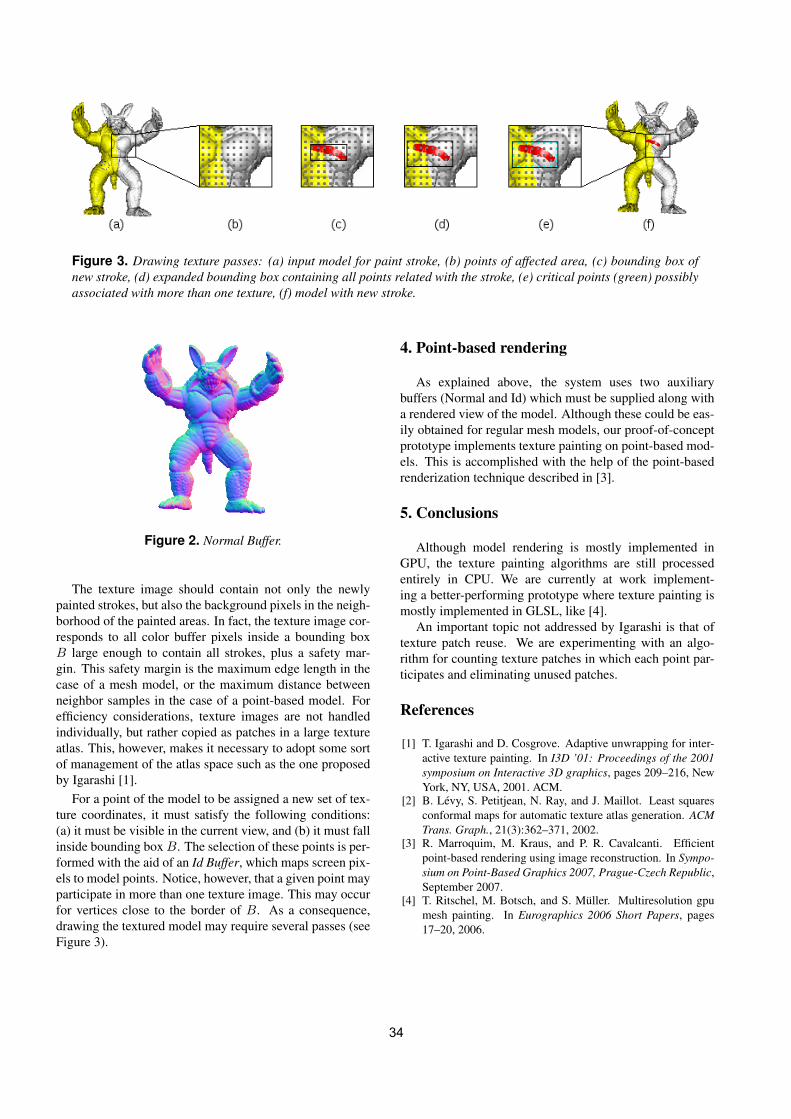
Figure 3. Drawing texture passes: (a) input model for paint stroke, (b) points of affected area, (c) bounding box ofnew stroke, (d) expanded bounding box containing all points related with the stroke, (e) critical points (green) possiblyassociated with more than one texture, (f) model with new stroke.
Figure 2. Normal Buffer.
The texture image should contain not only the newlypainted strokes, but also the background pixels in the neigh-borhood of the painted areas. In fact, the texture image cor-responds to all color buffer pixels inside a bounding boxB large enough to contain all strokes, plus a safety mar-gin. This safety margin is the maximum edge length in thecase of a mesh model, or the maximum distance betweenneighbor samples in the case of a point-based model. Forefficiency considerations, texture images are not handledindividually, but rather copied as patches in a large textureatlas. This, however, makes it necessary to adopt some sortof management of the atlas space such as the one proposedby Igarashi [1].
For a point of the model to be assigned a new set of tex-ture coordinates, it must satisfy the following conditions:(a) it must be visible in the current view, and (b) it must fallinside bounding box B. The selection of these points is per-formed with the aid of an Id Buffer, which maps screen pix-els to model points. Notice, however, that a given point mayparticipate in more than one texture image. This may occurfor vertices close to the border of B. As a consequence,drawing the textured model may require several passes (seeFigure 3).
4. Point-based rendering
As explained above, the system uses two auxiliarybuffers (Normal and Id) which must be supplied along witha rendered view of the model. Although these could be eas-ily obtained for regular mesh models, our proof-of-conceptprototype implements texture painting on point-based mod-els. This is accomplished with the help of the point-basedrenderization technique described in [3].
5. Conclusions
Although model rendering is mostly implemented inGPU, the texture painting algorithms are still processedentirely in CPU. We are currently at work implement-ing a better-performing prototype where texture painting ismostly implemented in GLSL, like [4].
An important topic not addressed by Igarashi is that oftexture patch reuse. We are experimenting with an algo-rithm for counting texture patches in which each point par-ticipates and eliminating unused patches.
References
[1] T. Igarashi and D. Cosgrove. Adaptive unwrapping for inter-active texture painting. In I3D ’01: Proceedings of the 2001symposium on Interactive 3D graphics, pages 209–216, NewYork, NY, USA, 2001. ACM.
[2] B. Levy, S. Petitjean, N. Ray, and J. Maillot. Least squaresconformal maps for automatic texture atlas generation. ACMTrans. Graph., 21(3):362–371, 2002.
[3] R. Marroquim, M. Kraus, and P. R. Cavalcanti. Efficientpoint-based rendering using image reconstruction. In Sympo-sium on Point-Based Graphics 2007, Prague-Czech Republic,September 2007.
[4] T. Ritschel, M. Botsch, and S. Muller. Multiresolution gpumesh painting. In Eurographics 2006 Short Papers, pages17–20, 2006.
34
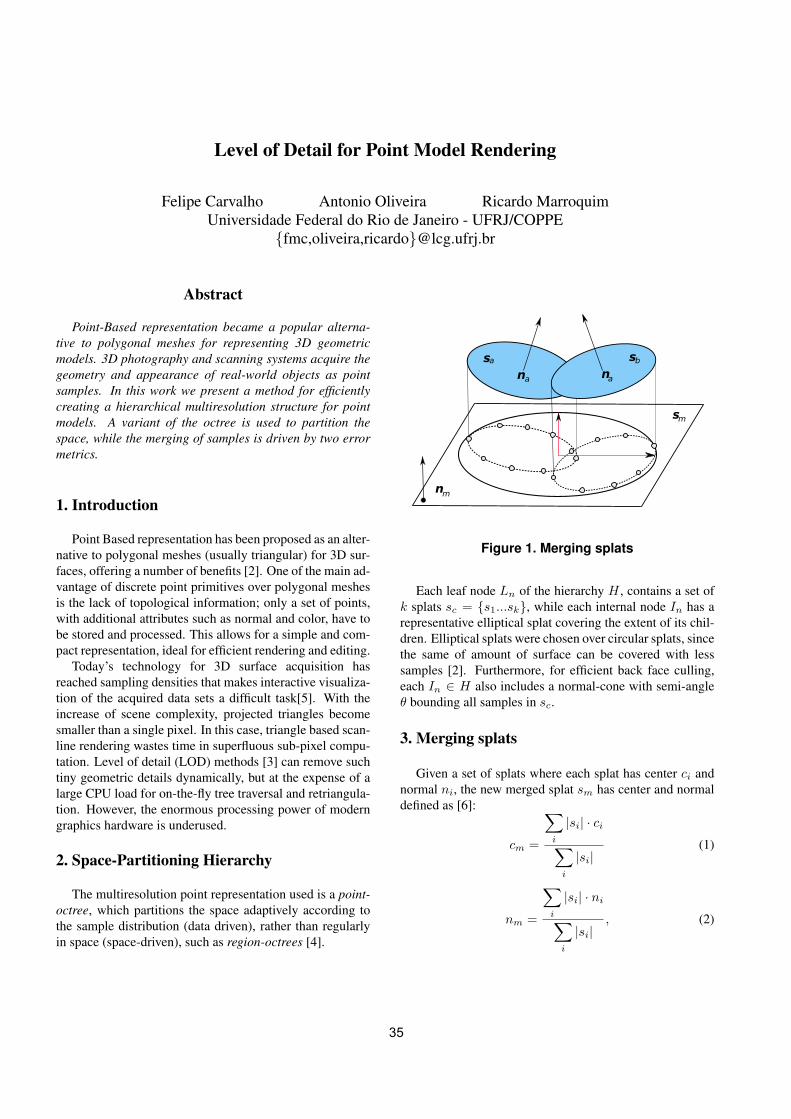
Level of Detail for Point Model Rendering
Felipe Carvalho Antonio Oliveira Ricardo MarroquimUniversidade Federal do Rio de Janeiro - UFRJ/COPPE
fmc,oliveira,[email protected]
Abstract
Point-Based representation became a popular alterna-tive to polygonal meshes for representing 3D geometricmodels. 3D photography and scanning systems acquire thegeometry and appearance of real-world objects as pointsamples. In this work we present a method for efficientlycreating a hierarchical multiresolution structure for pointmodels. A variant of the octree is used to partition thespace, while the merging of samples is driven by two errormetrics.
1. Introduction
Point Based representation has been proposed as an alter-native to polygonal meshes (usually triangular) for 3D sur-faces, offering a number of benefits [2]. One of the main ad-vantage of discrete point primitives over polygonal meshesis the lack of topological information; only a set of points,with additional attributes such as normal and color, have tobe stored and processed. This allows for a simple and com-pact representation, ideal for efficient rendering and editing.
Today’s technology for 3D surface acquisition hasreached sampling densities that makes interactive visualiza-tion of the acquired data sets a difficult task[5]. With theincrease of scene complexity, projected triangles becomesmaller than a single pixel. In this case, triangle based scan-line rendering wastes time in superfluous sub-pixel compu-tation. Level of detail (LOD) methods [3] can remove suchtiny geometric details dynamically, but at the expense of alarge CPU load for on-the-fly tree traversal and retriangula-tion. However, the enormous processing power of moderngraphics hardware is underused.
2. Space-Partitioning Hierarchy
The multiresolution point representation used is a point-octree, which partitions the space adaptively according tothe sample distribution (data driven), rather than regularlyin space (space-driven), such as region-octrees [4].
Figure 1. Merging splats
Each leaf node Ln of the hierarchy H , contains a set ofk splats sc = s1...sk, while each internal node In has arepresentative elliptical splat covering the extent of its chil-dren. Elliptical splats were chosen over circular splats, sincethe same of amount of surface can be covered with lesssamples [2]. Furthermore, for efficient back face culling,each In ∈ H also includes a normal-cone with semi-angleθ bounding all samples in sc.
3. Merging splats
Given a set of splats where each splat has center ci andnormal ni, the new merged splat sm has center and normaldefined as [6]:
cm =
∑i
|si| · ci∑i
|si|(1)
nm =
∑i
|si| · ni∑i
|si|, (2)
35
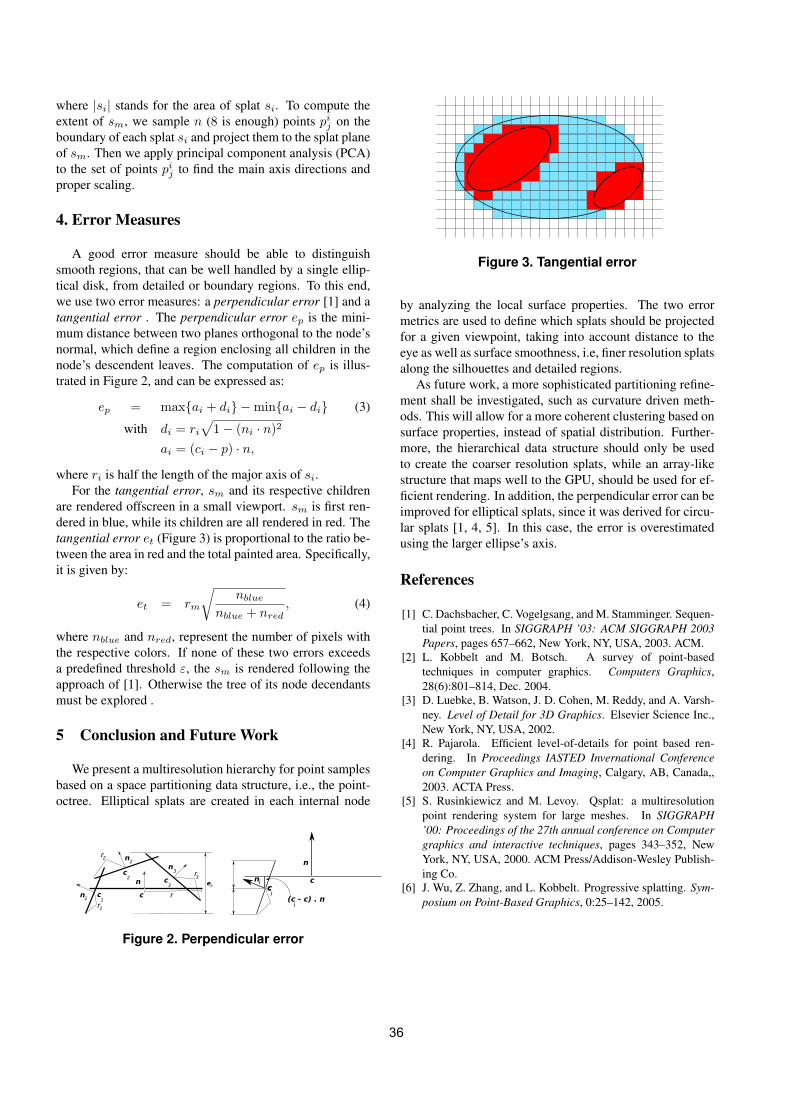
where |si| stands for the area of splat si. To compute theextent of sm, we sample n (8 is enough) points pi
j on theboundary of each splat si and project them to the splat planeof sm. Then we apply principal component analysis (PCA)to the set of points pi
j to find the main axis directions andproper scaling.
4. Error Measures
A good error measure should be able to distinguishsmooth regions, that can be well handled by a single ellip-tical disk, from detailed or boundary regions. To this end,we use two error measures: a perpendicular error [1] and atangential error . The perpendicular error ep is the mini-mum distance between two planes orthogonal to the node’snormal, which define a region enclosing all children in thenode’s descendent leaves. The computation of ep is illus-trated in Figure 2, and can be expressed as:
ep = maxai + di − minai − di (3)
with di = ri
√1 − (ni · n)2
ai = (ci − p) · n,
where ri is half the length of the major axis of si.For the tangential error, sm and its respective children
are rendered offscreen in a small viewport. sm is first ren-dered in blue, while its children are all rendered in red. Thetangential error et (Figure 3) is proportional to the ratio be-tween the area in red and the total painted area. Specifically,it is given by:
et = rm
√nblue
nblue + nred, (4)
where nblue and nred, represent the number of pixels withthe respective colors. If none of these two errors exceedsa predefined threshold ε, the sm is rendered following theapproach of [1]. Otherwise the tree of its node decendantsmust be explored .
5 Conclusion and Future Work
We present a multiresolution hierarchy for point samplesbased on a space partitioning data structure, i.e., the point-octree. Elliptical splats are created in each internal node
Figure 2. Perpendicular error
Figure 3. Tangential error
by analyzing the local surface properties. The two errormetrics are used to define which splats should be projectedfor a given viewpoint, taking into account distance to theeye as well as surface smoothness, i.e, finer resolution splatsalong the silhouettes and detailed regions.
As future work, a more sophisticated partitioning refine-ment shall be investigated, such as curvature driven meth-ods. This will allow for a more coherent clustering based onsurface properties, instead of spatial distribution. Further-more, the hierarchical data structure should only be usedto create the coarser resolution splats, while an array-likestructure that maps well to the GPU, should be used for ef-ficient rendering. In addition, the perpendicular error can beimproved for elliptical splats, since it was derived for circu-lar splats [1, 4, 5]. In this case, the error is overestimatedusing the larger ellipse’s axis.
References
[1] C. Dachsbacher, C. Vogelgsang, and M. Stamminger. Sequen-tial point trees. In SIGGRAPH ’03: ACM SIGGRAPH 2003Papers, pages 657–662, New York, NY, USA, 2003. ACM.
[2] L. Kobbelt and M. Botsch. A survey of point-basedtechniques in computer graphics. Computers Graphics,28(6):801–814, Dec. 2004.
[3] D. Luebke, B. Watson, J. D. Cohen, M. Reddy, and A. Varsh-ney. Level of Detail for 3D Graphics. Elsevier Science Inc.,New York, NY, USA, 2002.
[4] R. Pajarola. Efficient level-of-details for point based ren-dering. In Proceedings IASTED Invernational Conferenceon Computer Graphics and Imaging, Calgary, AB, Canada,,2003. ACTA Press.
[5] S. Rusinkiewicz and M. Levoy. Qsplat: a multiresolutionpoint rendering system for large meshes. In SIGGRAPH’00: Proceedings of the 27th annual conference on Computergraphics and interactive techniques, pages 343–352, NewYork, NY, USA, 2000. ACM Press/Addison-Wesley Publish-ing Co.
[6] J. Wu, Z. Zhang, and L. Kobbelt. Progressive splatting. Sym-posium on Point-Based Graphics, 0:25–142, 2005.
36
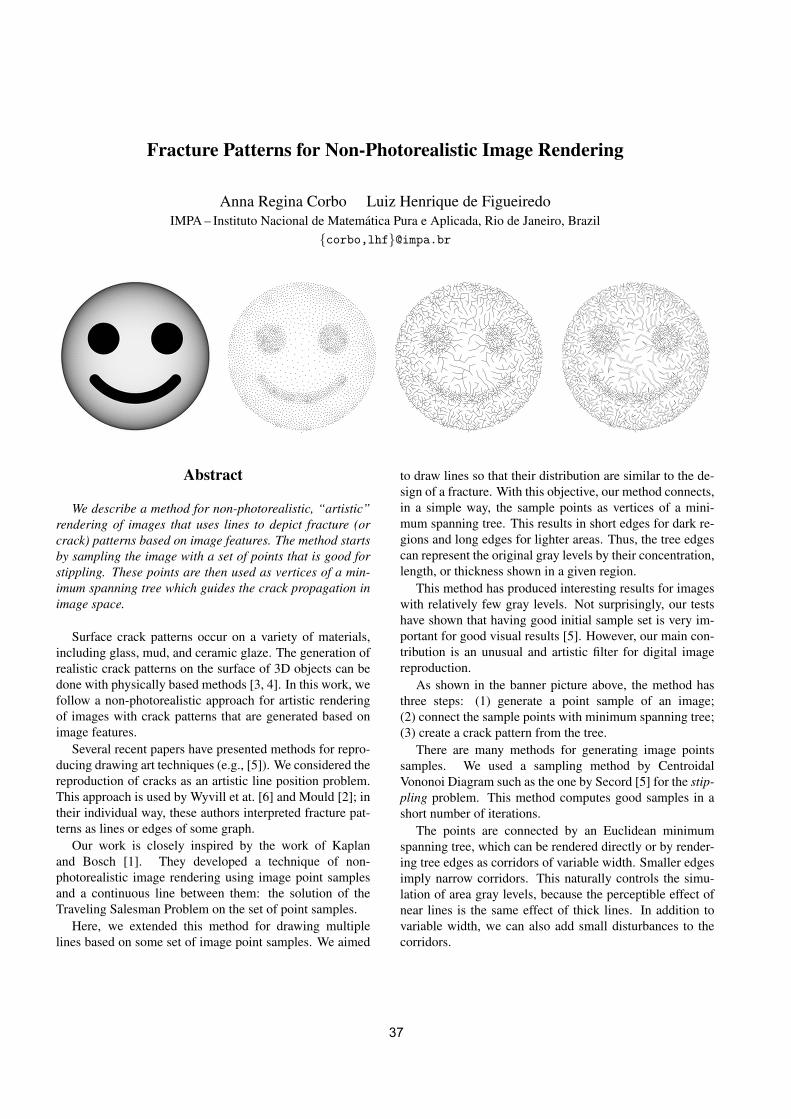
Fracture Patterns for Non-Photorealistic Image Rendering
Anna Regina Corbo Luiz Henrique de FigueiredoIMPA – Instituto Nacional de Matematica Pura e Aplicada, Rio de Janeiro, Brazil
corbo,[email protected]
Abstract
We describe a method for non-photorealistic, “artistic”rendering of images that uses lines to depict fracture (orcrack) patterns based on image features. The method startsby sampling the image with a set of points that is good forstippling. These points are then used as vertices of a min-imum spanning tree which guides the crack propagation inimage space.
Surface crack patterns occur on a variety of materials,including glass, mud, and ceramic glaze. The generation ofrealistic crack patterns on the surface of 3D objects can bedone with physically based methods [3, 4]. In this work, wefollow a non-photorealistic approach for artistic renderingof images with crack patterns that are generated based onimage features.
Several recent papers have presented methods for repro-ducing drawing art techniques (e.g., [5]). We considered thereproduction of cracks as an artistic line position problem.This approach is used by Wyvill et at. [6] and Mould [2]; intheir individual way, these authors interpreted fracture pat-terns as lines or edges of some graph.
Our work is closely inspired by the work of Kaplanand Bosch [1]. They developed a technique of non-photorealistic image rendering using image point samplesand a continuous line between them: the solution of theTraveling Salesman Problem on the set of point samples.
Here, we extended this method for drawing multiplelines based on some set of image point samples. We aimed
to draw lines so that their distribution are similar to the de-sign of a fracture. With this objective, our method connects,in a simple way, the sample points as vertices of a mini-mum spanning tree. This results in short edges for dark re-gions and long edges for lighter areas. Thus, the tree edgescan represent the original gray levels by their concentration,length, or thickness shown in a given region.
This method has produced interesting results for imageswith relatively few gray levels. Not surprisingly, our testshave shown that having good initial sample set is very im-portant for good visual results [5]. However, our main con-tribution is an unusual and artistic filter for digital imagereproduction.
As shown in the banner picture above, the method hasthree steps: (1) generate a point sample of an image;(2) connect the sample points with minimum spanning tree;(3) create a crack pattern from the tree.
There are many methods for generating image pointssamples. We used a sampling method by CentroidalVononoi Diagram such as the one by Secord [5] for the stip-pling problem. This method computes good samples in ashort number of iterations.
The points are connected by an Euclidean minimumspanning tree, which can be rendered directly or by render-ing tree edges as corridors of variable width. Smaller edgesimply narrow corridors. This naturally controls the simu-lation of area gray levels, because the perceptible effect ofnear lines is the same effect of thick lines. In addition tovariable width, we can also add small disturbances to thecorridors.
37
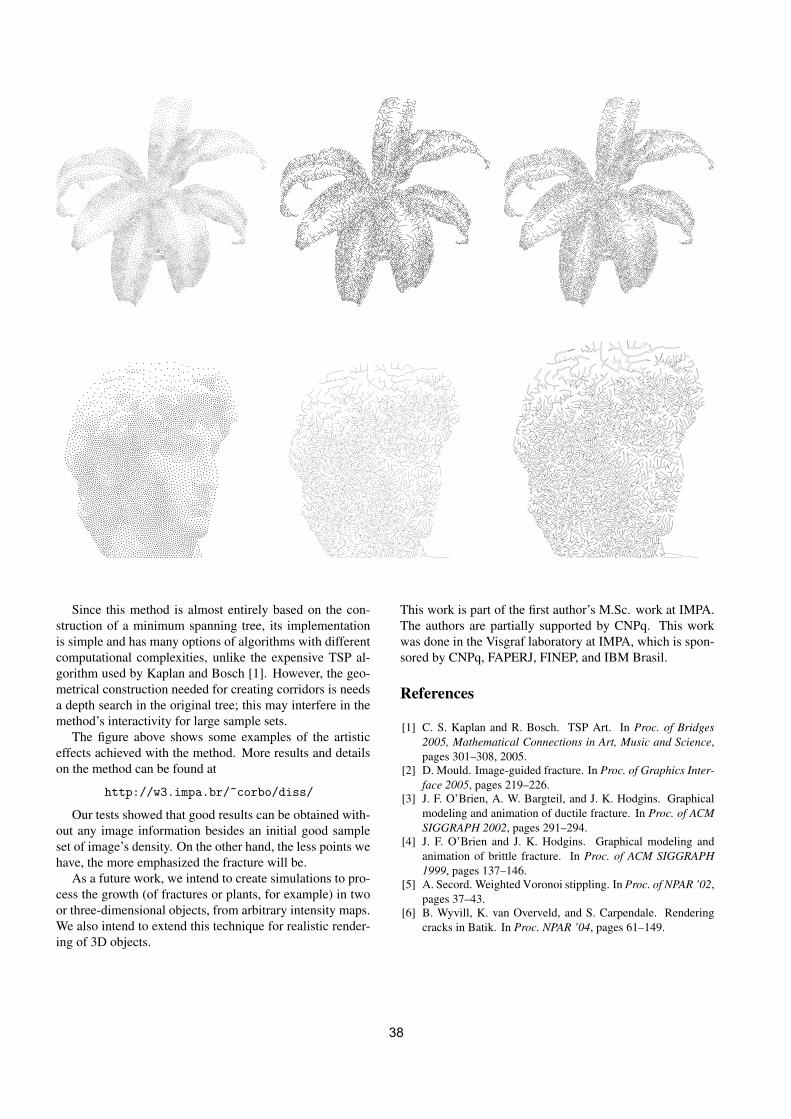
Since this method is almost entirely based on the con-struction of a minimum spanning tree, its implementationis simple and has many options of algorithms with differentcomputational complexities, unlike the expensive TSP al-gorithm used by Kaplan and Bosch [1]. However, the geo-metrical construction needed for creating corridors is needsa depth search in the original tree; this may interfere in themethod’s interactivity for large sample sets.
The figure above shows some examples of the artisticeffects achieved with the method. More results and detailson the method can be found at
http://w3.impa.br/~corbo/diss/
Our tests showed that good results can be obtained with-out any image information besides an initial good sampleset of image’s density. On the other hand, the less points wehave, the more emphasized the fracture will be.
As a future work, we intend to create simulations to pro-cess the growth (of fractures or plants, for example) in twoor three-dimensional objects, from arbitrary intensity maps.We also intend to extend this technique for realistic render-ing of 3D objects.
This work is part of the first author’s M.Sc. work at IMPA.The authors are partially supported by CNPq. This workwas done in the Visgraf laboratory at IMPA, which is spon-sored by CNPq, FAPERJ, FINEP, and IBM Brasil.
References
[1] C. S. Kaplan and R. Bosch. TSP Art. In Proc. of Bridges2005, Mathematical Connections in Art, Music and Science,pages 301–308, 2005.
[2] D. Mould. Image-guided fracture. In Proc. of Graphics Inter-face 2005, pages 219–226.
[3] J. F. O’Brien, A. W. Bargteil, and J. K. Hodgins. Graphicalmodeling and animation of ductile fracture. In Proc. of ACMSIGGRAPH 2002, pages 291–294.
[4] J. F. O’Brien and J. K. Hodgins. Graphical modeling andanimation of brittle fracture. In Proc. of ACM SIGGRAPH1999, pages 137–146.
[5] A. Secord. Weighted Voronoi stippling. In Proc. of NPAR ’02,pages 37–43.
[6] B. Wyvill, K. van Overveld, and S. Carpendale. Renderingcracks in Batik. In Proc. NPAR ’04, pages 61–149.
38