edinburgh lrt study - whatdotheyknow · pdf file8.2 wider economic benefits including urban...
TRANSCRIPT
The City of Edinburgh Council
Edinburgh LRT Masterplan Feasibility Study Final Report

The City of Edinburgh Council
Edinburgh LRT Masterplan Feasibility Study
Final Report
January 2003
Ove Arup & Partners International Ltd Admiral House, Rose Wharf, 78 East Street, Leeds LS9 8EE
Tel +44 (0)113 242 8498 Fax +44 (0)113 242 8573 REP/FI
Job number 68772

The City of Edinburgh Council Edinburgh LRT Masterplan Feasibility StudyFinal Report
C:\DOCUMENTS AND SETTINGS\CHRIS BAKER\LOCAL SETTINGS\TEMPORARY INTERNET FILES\OLK1D\0019REPORT-FINAL ISSUE.DOC REP/FI
Ove Arup & Partners International LtdFinal Issue 16 January 2003
CONTENTS Page
EXECUTIVE SUMMARY 1
1. INTRODUCTION 9 1.1 Scope of the Report 9 1.2 Study Background and Objectives 9 1.3 Transport Trends 10 1.4 Planning Context 10 1.5 The Integrated Transport Initiative 11 1.6 Study Approach 13 1.7 Light Rapid Transit Systems 13
2. PHASE 1 APPRAISAL 18 2.1 Introduction 18 2.2 Corridor Review 18 2.3 Development Proposals 21 2.4 The City of Edinburgh Conceptual Network 22 2.5 Priorities for Testing 23 2.6 North Edinburgh Loop 24 2.7 South Suburban Line 26 2.8 Appraisal of Long List of Corridor Schemes 29 2.9 Phase 1 Findings 47
3. APPROACH TO PHASE 2 50 3.1 Introduction 50 3.2 Technical Issues and Costs 50 3.3 Rolling Stock 54 3.4 Tram Services, Run Times and Operating Costs 55 3.5 Environmental Impact 55 3.6 Demand Forecasting 56 3.7 Appraisal 61
4. NORTH EDINBURGH LOOP 63 4.1 Alignment and Engineering Issues 63 4.2 Demand and Revenue 65 4.3 Environmental Issues 66 4.4 Integration 67 4.5 Tram Operations and Car Requirements 67 4.6 Costs 68 4.7 Appraisal 69
5. WEST EDINBURGH LINE 70 5.1 Context 70 5.2 The West Edinburgh Busway Scheme (WEBS) 72 5.3 The West Edinburgh Tram 73 5.4 Demand and Revenue 78 5.5 Environmental Issues 79 5.6 Integration 80 5.7 Tram Operations and Car Requirements 80 5.8 Costs 81 5.9 Appraisal 82

The City of Edinburgh Council Edinburgh LRT Masterplan Feasibility StudyFinal Report
C:\DOCUMENTS AND SETTINGS\CHRIS BAKER\LOCAL SETTINGS\TEMPORARY INTERNET FILES\OLK1D\0019REPORT-FINAL ISSUE.DOC REP/FI
Ove Arup & Partners International LtdFinal Issue 16 January 2003
6. SOUTH EAST EDINBURGH LINE 83 6.1 Context 83 6.2 Alignment 84 6.3 Demand and Revenue 87 6.4 Environmental Issues 88 6.5 Integration 89 6.6 Tram Operations and Car Requirements 90 6.7 Costs 90 6.8 Appraisal 91
7. REVIEW OF EXTENSIONS BEYOND THE CITY OF EDINBURGH 92 7.1 Introduction 92 7.2 Phase 1 Appraisal – Recommended Lines 92 7.3 Assumptions 94 7.4 Possible Extensions 94 7.5 Preliminary Assessment 98
8. ADDITIONAL ISSUES 100 8.1 Benchmarking Against Other UK LRT Systems 100 8.2 Wider Economic Benefits Including Urban Regeneration 101 8.3 Network Economies and Benefits 104
9. DRAFT FUNDING AND IMPLEMENTATION STRATEGY 105 9.1 Scheme Development 105 9.2 Funding Options 106 9.3 Implementation Strategy 107
10. RECOMMENDED STRATEGY 110 APPENDICES
APPENDIX A LRT Run Time Calculations
APPENDIX B Forecasting using CSTM3
APPENDIX C Indicative Structures for West and SE Edinburgh Routes
APPENDIX D Track Forms, OHLE & Stop Layouts
APPENDIX E Fares for LRT Revenue Forecasts
APPENDIX F Mapping of Social Deprivation and Housing Indices
APPENDIX G Environmental Constraints Mapping

The City of Edinburgh Council Edinburgh LRT Masterplan Feasibility StudyFinal Report
C:\DOCUMENTS AND SETTINGS\CHRIS BAKER\LOCAL SETTINGS\TEMPORARY INTERNET FILES\OLK1D\0019REPORT-FINAL ISSUE.DOC REP/FI
Page 1 Ove Arup & Partners International LtdFinal Issue 16 January 2003
EXECUTIVE SUMMARY
Study Objectives
• To identify a “viable network” of LRT routes which, in conjunction with other modes, will best meet Local Transport Strategy (LTS) and other project specific objectives;
• To produce outline capital, revenue and operating costs for the LRT lines;
• To provide sufficient data on LRT routes for use in the overall assessment and prioritisation of schemes with the Integrated Transport Initiative (ITI).
• To provide inputs to the development of the road use charging scheme business case and to support applications to the government for approval and funding of the ITI.
Background
There is substantial road traffic growth across the Edinburgh area combined with forecast population and employment increases which will lead to significant growth of road congestion. CEC is examining ways to provide a comprehensive, higher quality public transport network to support the local economy and help to create a sustainable environment. The Local Transport Strategy adopted by CEC in 2000 includes the development of a light rapid transit system.
To address the need for substantial investment in transport in and around Edinburgh, CEC has developed the Integrated Transport Initiative (ITI), which includes the possible introduction of road user charging; this would allow major schemes, such as a tram network, to be financed.
Study Process
A two phase approach was devised using the Central Scotland Transport Model (CSTM) held by the Scottish Executive as the main forecasting tool. The first phase comprised a comparison of corridors and their appraisal against preliminary criteria based on Scottish Transport Appraisal Guidance (STAG) 1 requirements. This comparison led to recommended schemes for more detailed assessment at Phase 2 which forms the basis of recommendations on priorities for LRT implementation.
Phase 1
The assessment of the prospects for light rail at corridor level was based on three main considerations:
• the scale of demand;
• the alignment opportunities;
• the likely scale of new development.
• Our initial review of the scale of demand using trip data in CSTM3 reveals the following main patterns:
• the main travel markets are east-west and northwest-southeast;
• all large travel markets are radial to the central area;
• the strongest markets are Silverknowes and South Leith to the Northern Central area and Corstorphine, South Leith, Portobello and Moredun/The Inch to the Southern Central area;
• the flows between South Gyle/Stenhouse and the Central Area are of medium scale (14,000-16,000 trips/day) but, in effect, represent a larger combined movement corridor;
The City of Edinburgh Council Edinburgh LRT Masterplan Feasibility StudyFinal Report
C:\DOCUMENTS AND SETTINGS\CHRIS BAKER\LOCAL SETTINGS\TEMPORARY INTERNET FILES\OLK1D\0019REPORT-FINAL ISSUE.DOC REP/FI
Page 2 Ove Arup & Partners International LtdFinal Issue 16 January 2003
• flows to the south and southwest of the city centre are generally lower and offer fewer prospects for high quality public transport investment, at least initially.
Our review included corridors identified by CEC. These included most of the high demand corridors and two with lower demand: the South Suburban Line corridor, where heavy rail options have been studied in detail; and a Southern Orbital Route, which connects residential communities in south Edinburgh with employment areas to the west and south east.
The scope for LRT depends on whether viable schemes can be devised that will deliver reliable operation. Taking account of the alignment flexibility of light rail and its operating economics, each of the corridors was reviewed with the following main conclusions.
Silverknowes has one main road corridor into central Edinburgh, the A90 Queensferry Road and the former railway alignment connecting Haymarket and Granton/Davidson’s Mains. There is very limited opportunity for segregated LRT alignments along the main road. However, it would be possible to install LRT on the former railway branch to Barnton as far as Davidson’s Mains.
Newhaven/North Leith. These areas are linked to central Edinburgh principally via Leith Walk, a wide road offering good scope for segregated LRT. The Newhaven area might be served via Bonnington though there is little scope for segregation of LRT in this area, but some scope for use of former railways.
South Leith. The only feasible direct radial route for light rail is via Leith Walk, which is generally wide enough to accommodate it.
All three of the above travel markets would be directly served by the North Edinburgh LRT scheme, a 16km loop connecting Waverley and Haymarket stations with major redevelopment areas at Granton and the docks at Leith. This is the scheme developed by Edinburgh Waterfront.
Corstorphine/Murrayfield would involve an LRT route north of the Edinburgh-Falkirk railway line. There is only one radial main road that could provide an LRT alignment, the A8 Corstorphine Road. This road is heavily used but there are sections of bus priority. LRT would reallocate road space to public transport. The use of the former Corstorphine rail branch formation could be of value, but does not form a complete solution.
South Gyle/Stenhouse. The West Edinburgh Busway (WEBS) is already defined parallel to, and south of, the Edinburgh-Falkirk railway line through Saughton. Therefore, this corridor offers segregated LRT alignments with minimum impact. There are also opportunities for extension towards the Airport.
Moredun/The Inch. This area is linked to central Edinburgh by the A7, Dalkeith Road and by the A701/A772, which run parallel in from Cameron Toll. There are opportunities for segregated LRT alignments along Gilmerton Road and Old Dalkeith Road. North of Cameron Toll the situation is complex with continuous frontage development on both main road routes. Segregated LRT could use the South Suburban railway route, but this is too circuitous to be attractive. Traffic engineering solutions seem possible to create space for LRT.
Portobello. A densely developed corridor along the A1 and the East Coast Main Line. The A1 Greenway carries significant bus flows and LRT would raise significant issues of competition and of disruption during construction. Given the difficulty in finding segregated alignments, this corridor cannot be regarded as the priority for LRT unless road space can be allocated. However, the large travel market presents a key opportunity.
Each of the corridors was considered for significant proposed and committed developments. These generally support tram corridors to north, west and southeast Edinburgh.

The City of Edinburgh Council Edinburgh LRT Masterplan Feasibility StudyFinal Report
C:\DOCUMENTS AND SETTINGS\CHRIS BAKER\LOCAL SETTINGS\TEMPORARY INTERNET FILES\OLK1D\0019REPORT-FINAL ISSUE.DOC REP/FI
Page 3 Ove Arup & Partners International LtdFinal Issue 16 January 2003
The CEC network included possible lines serving a wider catchment area, including Fife. However, none of these could be implemented without the urban lines. Therefore, only the urban corridors were considered at this stage.
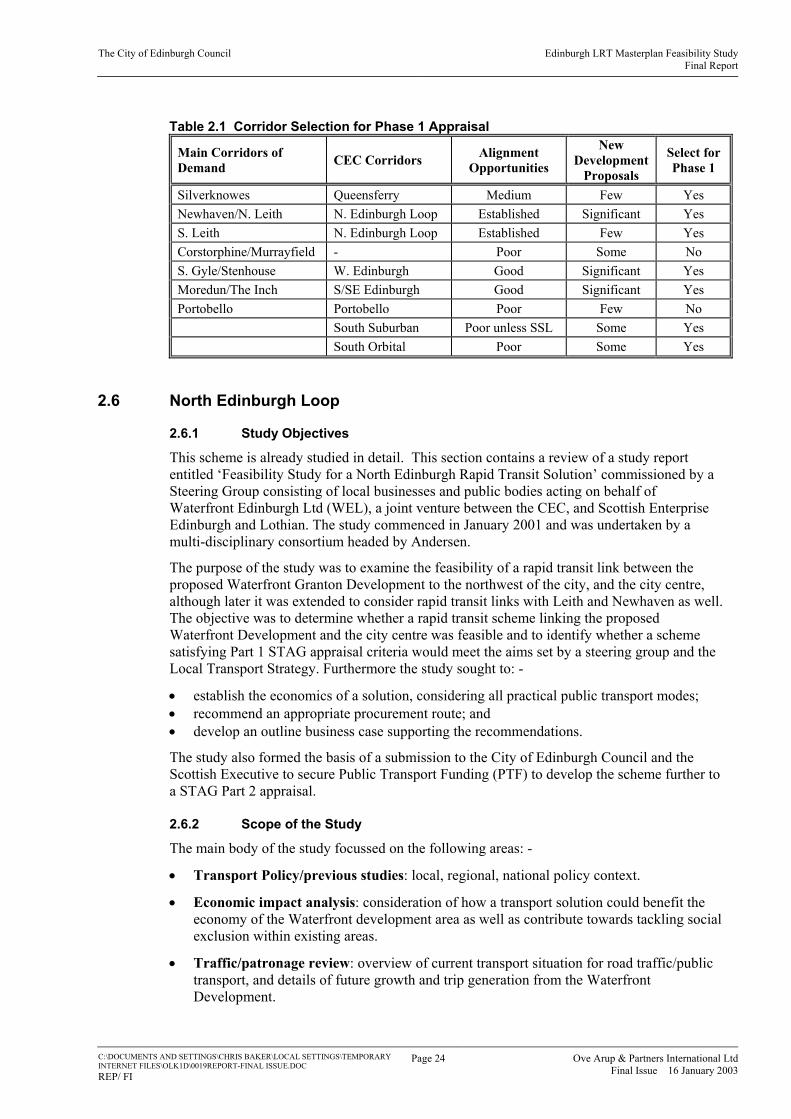
Table 1 shows the intermediate results in Phase 1 and the seven potential LRT corridors subject to STAG 1 appraisal. Only two corridors were not recommended for testing: Corstorphine/Murrayfield and Portobello. Both involve significant alignment problems that may be resolved by detailed study and, although both corridors can give access to major new development, there are alternatives in each case.
Table 1: Corridor Selection for Phase 1 Appraisal
Main Corridors of Demand CEC Corridors Alignment Opportunities
New Development
Proposals
Select for STAG 1
Silverknowes Queensferry Medium Few Yes Newhaven/N. Leith N. Edinburgh Loop Established Significant Yes S. Leith N. Edinburgh Loop Established Few Yes Corstorphine/Murrayfield - Poor Some No S. Gyle/Stenhouse W. Edinburgh Good Significant Yes Moredun/The Inch S/SE Edinburgh Good Significant Yes Portobello Portobello Poor Few No South Suburban Poor unless SSL Some Yes South Orbital Poor Some Yes
The STAG 1 appraisal required the assessment of indicative alignments against STAG objectives.
• Environment – indicative scale and scope of environmental impact;
• Safety – indicative scale of impact on safety and security;
• Economy – indicative impact on access to employment, opportunity for development and the broad capital expenditure, operating costs and revenue for each route;
• Integration – indication of opportunities for interchange and integrated public transport, and policy integration;
• Accessibility – the indicative size of residential population and employment markets served.
This was coupled with a qualitative assessment against specific local objectives from the LTS:
• to improve accessibility, particularly for people without access to a car, on low incomes or whose mobility is impaired;
• to reduce pollution and environmental damage caused by traffic; • to reduce traffic congestion; • to make the transport system safer and more secure for both users and non-users.
Draft Appraisal Summary Tables (AST) were prepared for the long list of routes scored using the seven point STAG scale. Revenue projections were based on initial CSTM model forecasts for all corridors except the North Edinburgh Loop, for which the results from previous work by the Andersen team were used. Operating costs were assessed using average rates from British LRT schemes. Capital costs for each line were assessed also using unit rates based on costs for other LRT systems in the UK.
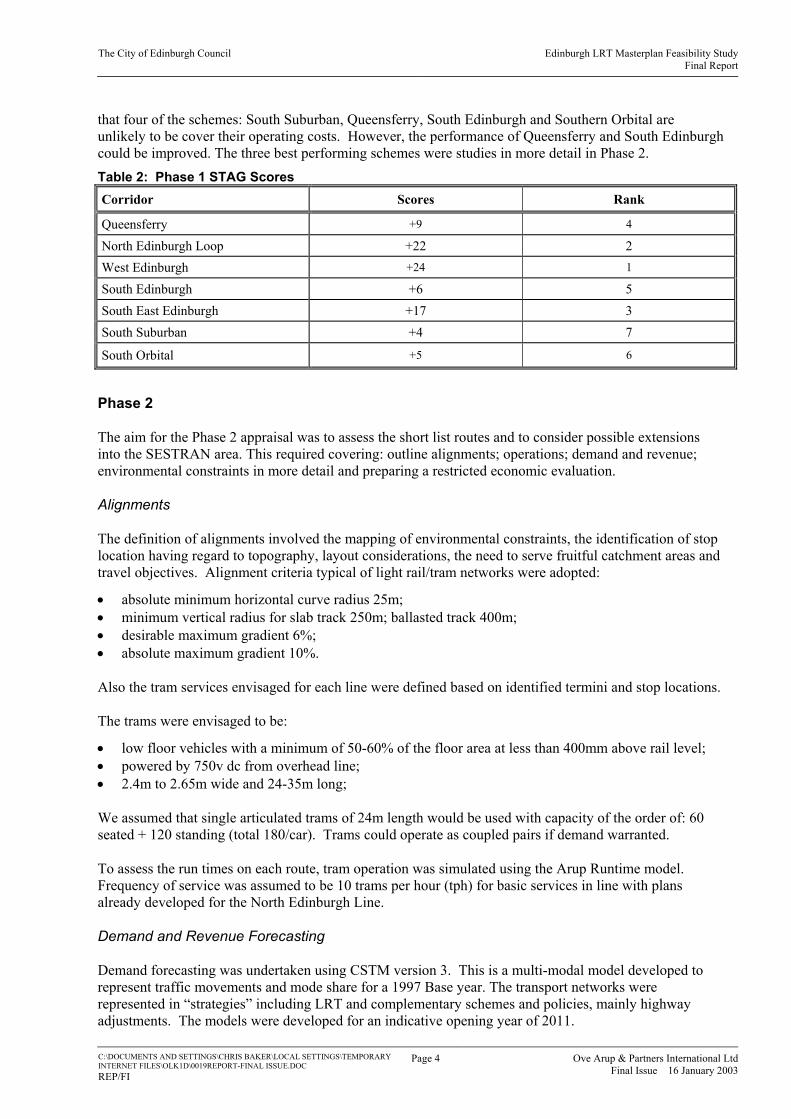
The unweighted AST scores are summarised in Table 2 for each LRT corridor. The best performing schemes are West Edinburgh, North Edinburgh and South East Edinburgh with Queensferry ranked fourth but with a significantly lower score. South Suburban is the weakest performer. The assessment indicates
The City of Edinburgh Council Edinburgh LRT Masterplan Feasibility StudyFinal Report
C:\DOCUMENTS AND SETTINGS\CHRIS BAKER\LOCAL SETTINGS\TEMPORARY INTERNET FILES\OLK1D\0019REPORT-FINAL ISSUE.DOC REP/FI
Page 4 Ove Arup & Partners International LtdFinal Issue 16 January 2003
that four of the schemes: South Suburban, Queensferry, South Edinburgh and Southern Orbital are unlikely to be cover their operating costs. However, the performance of Queensferry and South Edinburgh could be improved. The three best performing schemes were studies in more detail in Phase 2. Table 2: Phase 1 STAG Scores Corridor Scores Rank
Queensferry +9 4
North Edinburgh Loop +22 2 West Edinburgh +24 1
South Edinburgh +6 5 South East Edinburgh +17 3 South Suburban +4 7
South Orbital +5 6
Phase 2
The aim for the Phase 2 appraisal was to assess the short list routes and to consider possible extensions into the SESTRAN area. This required covering: outline alignments; operations; demand and revenue; environmental constraints in more detail and preparing a restricted economic evaluation.
Alignments
The definition of alignments involved the mapping of environmental constraints, the identification of stop location having regard to topography, layout considerations, the need to serve fruitful catchment areas and travel objectives. Alignment criteria typical of light rail/tram networks were adopted:
• absolute minimum horizontal curve radius 25m; • minimum vertical radius for slab track 250m; ballasted track 400m; • desirable maximum gradient 6%; • absolute maximum gradient 10%.
Also the tram services envisaged for each line were defined based on identified termini and stop locations.
The trams were envisaged to be:
• low floor vehicles with a minimum of 50-60% of the floor area at less than 400mm above rail level; • powered by 750v dc from overhead line; • 2.4m to 2.65m wide and 24-35m long;
We assumed that single articulated trams of 24m length would be used with capacity of the order of: 60 seated + 120 standing (total 180/car). Trams could operate as coupled pairs if demand warranted.
To assess the run times on each route, tram operation was simulated using the Arup Runtime model. Frequency of service was assumed to be 10 trams per hour (tph) for basic services in line with plans already developed for the North Edinburgh Line.
Demand and Revenue Forecasting
Demand forecasting was undertaken using CSTM version 3. This is a multi-modal model developed to represent traffic movements and mode share for a 1997 Base year. The transport networks were represented in “strategies” including LRT and complementary schemes and policies, mainly highway adjustments. The models were developed for an indicative opening year of 2011.

The City of Edinburgh Council Edinburgh LRT Masterplan Feasibility StudyFinal Report
C:\DOCUMENTS AND SETTINGS\CHRIS BAKER\LOCAL SETTINGS\TEMPORARY INTERNET FILES\OLK1D\0019REPORT-FINAL ISSUE.DOC REP/FI
Page 5 Ove Arup & Partners International LtdFinal Issue 16 January 2003
Each LRT route was coded to allow for interaction with other traffic. Segregated sections were modelled with a maximum operating speed of 70 kph. For street alignments this was 40 kph.
Revenue forecasts were based on sectional fares that apply on buses now. The best fit scale based on LB fares is 50p boarding charge plus 10p per kilometre. For business case preparation, it would be appropriate to include allowances for concessionary fares (an additional proportion of adult fares) and for discounts for travelcard users and child fares (a reduction on adult fares) but information on these proportions in the Edinburgh public transport market was not readily available. On the other hand, no premium was included over bus fares.
A number of major developments are planned close to each of the three tram corridors. These could have a significant impact on the demand and revenue forecasts for each line but are not included in the CSTM model. We followed the same general approach to assessing the travel demand to major new developments adopted for the North Edinburgh Loop.
• North Edinburgh Developments (identified and forecast in the Andersen report); • Edinburgh Park – expansion from existing (from WEPF); • Royal Bank of Scotland – new headquarters at Gogarburn (development trips from RBOS
consultants); • Edinburgh Airport – growth in airport activity (from WEPF/Surface Access Strategy); • Shawfair – significant residential and community development (Shawfair Local Plan related
documents); • New Royal Infirmary and associated uses – major hospital development and adjacent medi-park
development (local planning information).
A wider catchment could be attracted to tram through Park and Ride. However, the location of the Park & Ride sites will be particularly important in achieving significant mode shift. In calculating Park and Ride demand and revenue we assumed that no parking charge will apply. The demand and revenue arising from each Park and Ride site was based on a number of assumptions, derived from observation of park and ride sites elsewhere in the UK, and on the utilisation of the total spaces available. The mode shift forecasts from the CSTM model for the corridor were then used as a diversion factor applied to passing traffic.
Appraisal
The Phase 2 appraisal was also based on STAG with further detail under the key objectives:
• Environment – constraints mapping for natural features etc (inc SSSIs, historic monuments etc), issues requiring detailed investigation, areas of significant reduction in traffic-related pollution;
• Safety – impact on conflict points and problem locations, reduction in vehicle kilometres travelled affecting the general incidence of road traffic accidents;
• Economy – preliminary costs and revenues, impact on development opportunities, travel time savings, quality and reliability benefits including impact on de-congestion feeding into a preliminary cost-benefit appraisal to provide an indicative present value of costs and benefits over a typical 30 year appraisal period at a standard discount rate;
• Integration – summary of key interchange points, integration with existing public transport, park and ride, public transport mode share, land use integration, new opportunities for travel, policy integration;
• Accessibility – impact on areas of multiple deprivation, effect on social inclusion, public transport links/service provision, access to employment markets and increased opportunities.
As part of the assessment of the wider network benefits, the issues of integrated ticketing, regeneration and future network development were considered.
The City of Edinburgh Council Edinburgh LRT Masterplan Feasibility StudyFinal Report
C:\DOCUMENTS AND SETTINGS\CHRIS BAKER\LOCAL SETTINGS\TEMPORARY INTERNET FILES\OLK1D\0019REPORT-FINAL ISSUE.DOC REP/FI
Page 6 Ove Arup & Partners International LtdFinal Issue 16 January 2003
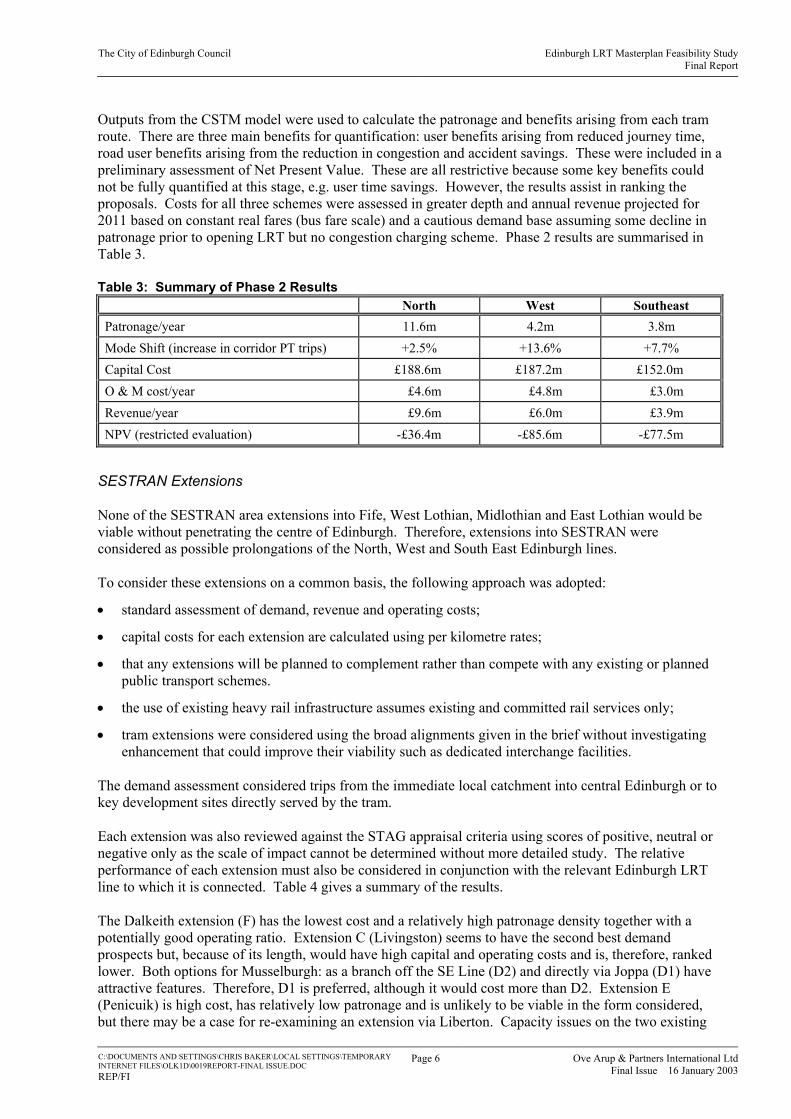
Outputs from the CSTM model were used to calculate the patronage and benefits arising from each tram route. There are three main benefits for quantification: user benefits arising from reduced journey time, road user benefits arising from the reduction in congestion and accident savings. These were included in a preliminary assessment of Net Present Value. These are all restrictive because some key benefits could not be fully quantified at this stage, e.g. user time savings. However, the results assist in ranking the proposals. Costs for all three schemes were assessed in greater depth and annual revenue projected for 2011 based on constant real fares (bus fare scale) and a cautious demand base assuming some decline in patronage prior to opening LRT but no congestion charging scheme. Phase 2 results are summarised in Table 3.
Table 3: Summary of Phase 2 Results North West Southeast Patronage/year 11.6m 4.2m 3.8m Mode Shift (increase in corridor PT trips) +2.5% +13.6% +7.7% Capital Cost £188.6m £187.2m £152.0m O & M cost/year £4.6m £4.8m £3.0m Revenue/year £9.6m £6.0m £3.9m NPV (restricted evaluation) -£36.4m -£85.6m -£77.5m
SESTRAN Extensions
None of the SESTRAN area extensions into Fife, West Lothian, Midlothian and East Lothian would be viable without penetrating the centre of Edinburgh. Therefore, extensions into SESTRAN were considered as possible prolongations of the North, West and South East Edinburgh lines.
To consider these extensions on a common basis, the following approach was adopted:
• standard assessment of demand, revenue and operating costs;
• capital costs for each extension are calculated using per kilometre rates;
• that any extensions will be planned to complement rather than compete with any existing or planned public transport schemes.
• the use of existing heavy rail infrastructure assumes existing and committed rail services only;
• tram extensions were considered using the broad alignments given in the brief without investigating enhancement that could improve their viability such as dedicated interchange facilities.
The demand assessment considered trips from the immediate local catchment into central Edinburgh or to key development sites directly served by the tram.
Each extension was also reviewed against the STAG appraisal criteria using scores of positive, neutral or negative only as the scale of impact cannot be determined without more detailed study. The relative performance of each extension must also be considered in conjunction with the relevant Edinburgh LRT line to which it is connected. Table 4 gives a summary of the results.
The Dalkeith extension (F) has the lowest cost and a relatively high patronage density together with a potentially good operating ratio. Extension C (Livingston) seems to have the second best demand prospects but, because of its length, would have high capital and operating costs and is, therefore, ranked lower. Both options for Musselburgh: as a branch off the SE Line (D2) and directly via Joppa (D1) have attractive features. Therefore, D1 is preferred, although it would cost more than D2. Extension E (Penicuik) is high cost, has relatively low patronage and is unlikely to be viable in the form considered, but there may be a case for re-examining an extension via Liberton. Capacity issues on the two existing

The City of Edinburgh Council Edinburgh LRT Masterplan Feasibility StudyFinal Report
C:\DOCUMENTS AND SETTINGS\CHRIS BAKER\LOCAL SETTINGS\TEMPORARY INTERNET FILES\OLK1D\0019REPORT-FINAL ISSUE.DOC REP/FI
Page 7 Ove Arup & Partners International LtdFinal Issue 16 January 2003
river crossings mean Extension A is considered only as far as Dalmeny/Queensferry. We conclude that the priority for more detailed study should be for three of the SESTRAN extensions (D1, F, C).
Table 4: Summary of Key Results and Possible STAG Impacts Key Results STAG Appraisal Criteria
Extension A
nnua
l D
eman
d (0
00s)
Ope
ratin
g R
atio
Cap
ital C
ost
(£m
)
Env
iron
men
t
Safe
ty
Eco
nom
y
Eco
nom
ic
Act
ivity
Acc
essi
bilit
y
Tra
nspo
rt
Inte
grat
ion
Polic
y In
tegr
atio
n
Fina
ncia
l Su
stai
nabi
lity
A. Queensferry/Kirkliston 589 0.85 85 O O + + + O O O
C. Broxburn/Livingston 1,817 1.51 176 O O + + O + + +
D1. Musselburgh/Joppa 2,172 0.85(1) 121 + O O + + + O O(1)
D2. Musselburgh /SE Line 1,206 0.60 79 O O O + + + O - E. Penicuik 577 0.40 144 O O + + + O O - F. Dalkeith 869 1.32 58 O O + + + + O +
Note: (1) Assuming headways same as ‘urban’ routes – this ratio improves to 1.4 if the same headways as other extensions are assumed. Key: Positive Impact + Negative Impact - Neutral Impact O
Benchmarking
To check the scale of the Edinburgh LRT forecasts we compared each line with other LRT schemes in the UK. The Docklands Light Railway and the Tyne Wear Metro were excluded from this comparison because they are of a heavier nature than conventional light rail.
The busiest systems in the UK at present in terms of total patronage and density (passenger kms per route km) are Croydon Tramlink and Manchester Metrolink. In general the benchmarking exercise indicated that the demand and revenue estimates for the three Edinburgh LRT lines are within the range indicated by other UK systems. This comparison indicates that the forecasts appear reasonable although density and revenue/tram km for North Edinburgh are high compared to other networks.
Table 5: Benchmarking Annual Demand
System/Line
Passenger journeys (millions)
Passenger km (millions)
Passenger km per
route km (Million)
Annual Revenue
(£M)
Revenue per tram km
Manchester Metrolink: Phase 1 - Bury/Altrincham 13.7 136.1 4.40 15.8 4.65 Phase 2 – Eccles 2.3 16.2 1.76 1.9 1.90 Croydon Tramlink 16.2 97.0 3.46 12.2 4.36 Sheffield Supertram 11.1 38.0 1.31 7.1 2.96 Midland Metro 5.4 55.8 2.74 3.1 1.63
North Edinburgh Loop 11.6 59.5 3.81 9.6 6.4 West Edinburgh Line 4.2 41.1 2.51 6.0 4.0 South East Edinburgh Line 3.8 19.6 1.94 3.9 4.3

The City of Edinburgh Council Edinburgh LRT Masterplan Feasibility StudyFinal Report
C:\DOCUMENTS AND SETTINGS\CHRIS BAKER\LOCAL SETTINGS\TEMPORARY INTERNET FILES\OLK1D\0019REPORT-FINAL ISSUE.DOC REP/FI
Page 8 Ove Arup & Partners International LtdFinal Issue 16 January 2003
Recommendations
We recommend that the North Edinburgh Loop be accorded highest priority among the corridors tested and that the Masterplan should include both West and South East lines as high priority schemes.
The order of implementation is not determined by technical issues or clear performance ranking. However, there is a strong case for considering the West Edinburgh Line next because of development pressure, the availability of alignments and traffic congestion. We suspect that the performance of this line in our tests was affected by CSTM3 model limitations and the demand forecasts will need careful review.
The three lines work well as a network, based on the core Haymarket-Princes Street alignment. This would achieve important economies, reducing the forecast capital cost from £528m to £466m, and improve the financial case for all lines.
There is potential for further development of all three lines: inner area branches of the North Edinburgh Loop, including to Davidson’s Mains, a branch off South East Edinburgh towards Liberton. However, a branch off the West Edinburgh line to Hermiston Gait is not recommended.
Extensions into the SESTRAN area are also possible but the case for these requires more detailed consideration. None of these is likely to be attractive as stand-alone schemes and all should be considered as extensions of Edinburgh core lines. Extension of the West Edinburgh line to West Lothian (Broxburn/Livingston) and of the Southeast line to Dalkeith appear, at this stage, to have the greatest potential, followed by Musselburgh via the Portobello/Joppa corridor, but this depends on the case for the latter which needs further investigation.
The development of the three priority lines will require detailed business cases which should involve new patronage and revenue forecasts using tools developed for the task. These should also enable the likely impact of road user charging and other aspects of the ITI to be taken fully into account. It will be particularly important to resolve alignment problems and to gain a clearer picture of forecast competition between public transport modes.
The City of Edinburgh Council Edinburgh LRT Masterplan Feasibility StudyFinal Report
C:\DOCUMENTS AND SETTINGS\CHRIS BAKER\LOCAL SETTINGS\TEMPORARY INTERNET FILES\OLK1D\0019REPORT-FINAL ISSUE.DOC REP/FI
Page 9 Ove Arup & Partners International LtdFinal Issue 16 January 2003
1. INTRODUCTION
1.1 Scope of the Report Arup was commissioned in December 2001 by City of Edinburgh Council (CEC) to undertake this feasibility study for a light rail network in Edinburgh. The study consisted of two distinct phases. Phase 1 related to an initial scoping of available alignments and a broad evaluation of LRT in each route corridor specified for the study to produce a shortlist of routes for further assessment. Phase 2 looked in more detail at the corridors for which LRT is considered most attractive and reported a wider evaluation including a preliminary environmental assessment.
This report describes the study, including the review of work undertaken by other consultants on the North Edinburgh and South Suburban routes. It explains the derivation of the core network assessed in Phase 2 and the Masterplan recommendations.
1.2 Study Background and Objectives CEC is examining ways to provide a comprehensive, higher quality public transport network to support and stimulate the local economy and to help sustain a healthy environment. In order to do this, a number of issues relating to transport and traffic need to be resolved, including the challenge of providing attractive and reliable public transport while managing the demand for private car travel and congestion. Any transport proposals must also take account of the city’s heritage and built environment.
The Local Transport Plan adopted by CEC in 2000 sets out the overall transport vision for the next 20 years and includes the development of light rapid transit to provide the core of a high quality, reliable public transport network throughout the city. This study reviews the opportunities for a tram system along a number of routes in Edinburgh and identifies priorities for developing the network. The Masterplan puts into context a considerable amount of work already undertaken by CEC and its consultants, including significant development work for the North Edinburgh LRT project, which CEC is pursuing as its top priority LRT scheme.
It should also be noted that proposals for a modern rapid transit system in Edinburgh have a long history, since the closure of the Edinburgh tramway network in 1956 there have been a number of attempts to reinstate a tramway system. In 1987, a two-line 'light metro' was proposed, with a significant part of the North-South Metro route underground, but was not progressed beyond the design stage because of the high cost.
In 1993, the Edinburgh Tram Company was formed by Forth Ports, which was keen to develop its redundant acres in Leith, Newhaven and Granton, by building a tramway from Haymarket to Newhaven via Princes Street. At the same time, the City of Edinburgh Rapid Transit (CERT) scheme was developed to provide a kerb-guided busway from near the Airport to the edge of the city centre. Although CERT has been abandoned, an award has been made by The Scottish Executive for the West of Edinburgh Guided Busways Scheme (WEBS), which would incorporate two stretches of guideway from Edinburgh Park to Stenhouse. The current proposal for LRT in North Edinburgh to link the Granton waterfront with the city centre, resulted from a study commissioned by Waterfront Edinburgh Ltd.
The objectives of the study are:
• to identify a “viable network” of LRT routes which, integrated with other improvements, will make a significant contribution to Edinburgh’s Local Transport Strategy, supporting development and sustainable access in a way that can be easily implemented and minimises construction cost and future financial support;
• to produce outline capital, revenue and operating costs for the LRT lines;

The City of Edinburgh Council Edinburgh LRT Masterplan Feasibility StudyFinal Report
C:\DOCUMENTS AND SETTINGS\CHRIS BAKER\LOCAL SETTINGS\TEMPORARY INTERNET FILES\OLK1D\0019REPORT-FINAL ISSUE.DOC REP/FI
Page 10 Ove Arup & Partners International LtdFinal Issue 16 January 2003
• to provide sufficient data on LRT routes for use in the overall assessment and prioritisation of schemes with the ITI;
• to provide inputs to the development of the road use charging scheme business case and to support applications the government for approval and funding of the ITI.
1.3 Transport Trends Whilst, at a detailed level, the causes of the growth in travel and changes in travel patterns are very complex, there are several clear trends:
• a rise in the number of private cars and light goods vehicles registered to Lothian residents, from 280,000 in 1996 to 308,000 in 2000 (a 10% increase in 4 years);
• more new vehicle registrations in Edinburgh than in any other Scottish local authority (2000);
• increased use of motor vehicles, with journeys on Lothian’s motorways and ‘A’ class roads rising from 2,977 million vehicle-kilometres in 1995 to 3,201 million in 1999 (a 7.5% increase);
• daily commuting into Edinburgh grew from 51,000 trips in 1981 to 72,000 in 1991 and an estimated 88,000 in 2001, growth of 72% in 20 years;
• traffic on the City Bypass has increased by about 5% per annum recently, with a daily average of more than 65,000 vehicles at Dreghorn;
• traffic on the M8 motorway grew by 18% and on the M9 by 19% between 1996 and 1999;
• 50% of shopping trips to the City Centre are made by public transport; down slightly from 53% in 1986. The figures for modern, purpose-built shopping centres are considerably lower.
Although passenger numbers have risen recently, the proportion of journeys made by public transport is relatively low for most types of trip, and much still needs to be done to ensure that it is perceived as an attractive alternative to the private car.
Traffic volumes have grown substantially, leading to more congestion, pollution, and other attendant consequences such as fragmentation of communities, disruption to business activity, and effects on health. A recent study concluded that 239 people die every year in Edinburgh as a result of traffic-related air pollution.
The Lothian Structure Plan authorities commissioned a study of existing accessibility levels, which also examined likely changes in accessibility resulting from different development and transport investment scenarios. The findings must be treated with caution as much of the data were drawn from an inter-urban transport model, but it provides a useful broad-brush assessment. The study showed that the different transport investment scenarios produced much greater differences in accessibility than the alternative development strategies. Significant improvements, particularly in non-car accessibility, were demonstrated from the high investment transport scenario with road user charging. This scenario included a tram system in Edinburgh and significant enhancement of the local rail and bus networks.
1.4 Planning Context Edinburgh and the Lothians is a dynamic Scottish region, experiencing growth across a range of socio-economic indicators. This growth, however, presents many challenges.

The City of Edinburgh Council Edinburgh LRT Masterplan Feasibility StudyFinal Report
C:\DOCUMENTS AND SETTINGS\CHRIS BAKER\LOCAL SETTINGS\TEMPORARY INTERNET FILES\OLK1D\0019REPORT-FINAL ISSUE.DOC REP/FI
Page 11 Ove Arup & Partners International LtdFinal Issue 16 January 2003
Between 2000 and 2015, the population of The City of Edinburgh is projected to increase by 19,000 (4.2%); that of East Lothian by 8,200 (9%), and Midlothian by 3,200 (4%). However, the population increase will be uneven across different age groups.
Edinburgh and the Lothians are experiencing sustained growth and prosperity. Whilst only 15% of Scotland’s population live in the area, the Lothians’ GDP accounted for almost one fifth of Scotland’s total in 1998, and 18% of Scottish jobs are in the area. This illustrates the region’s importance to the wider Scottish economy.
The local economy is very buoyant and well placed for future growth, reflecting the employment bias towards the service sector, particularly financial services. Forecasts show an overall increase between 2000-2015 of 34,500 jobs in Edinburgh (12%). Although the traditional sectors are projected to decline, the service sector is expected to increase by 53,500 jobs.
Indicators of the region’s economic success include:
• unemployment in the Lothians is 2.7% (cf. Scotland 4.3%, UK 3.2%, July 2001);
• average disposable income in Edinburgh is amongst the highest in the UK (Henley Centre);
• GDP per capita in Edinburgh is 147% (Lothians 117%) of the UK average;
• Edinburgh is the city with the fastest growing economy in the UK (Cambridge Econometrics June 2000, August 2001);
• Edinburgh’s world ranking as a conference venue rose from 22nd in 1996 to 12th in 2001 (ICCA);
• Edinburgh is the UK’s second most important financial centre;
• output from the Lothians financial services sector is predicted to expand by a quarter by 2008 (BSL 1999);
• amongst Scottish council areas, average gross weekly earnings in Edinburgh are the second highest (New Earnings Survey 2000);
• Edinburgh’s per capita spending on personal goods is 12% above the national average (CACI, Sept. 2000);
• passenger arrivals at Edinburgh Airport grew from 3.8 million in 1996 to 5.5 million in 2000 (47% of the total Scottish growth over that period) (Scottish Transport Stats.);
• Edinburgh is the UK’s second largest overseas tourist destination after London; UK visitor bednights in Edinburgh have grown by 16% since 1996 (ONS).
However, traditional employment sectors (primary, manufacturing and construction) all continue to decline, although Midlothian is expected to experience continued growth in biotechnology industries.
1.5 The Integrated Transport Initiative There is a concern that the competitiveness and, therefore, the dynamism, of the Edinburgh and Lothians economy will be reduced if the region’s strengths are not further developed, which would have a negative impact on Scotland as a whole. The key strengths include a highly rated ‘quality of life’, based on an attractive environment and the high standard of infrastructure/services, and the quality and educational attainments of the local workforce.
However, the impact of traffic on the city environment is clear. Congestion itself can impede effective business and, therefore, discourage the location of new or expanding enterprises in

The City of Edinburgh Council Edinburgh LRT Masterplan Feasibility StudyFinal Report
C:\DOCUMENTS AND SETTINGS\CHRIS BAKER\LOCAL SETTINGS\TEMPORARY INTERNET FILES\OLK1D\0019REPORT-FINAL ISSUE.DOC REP/FI
Page 12 Ove Arup & Partners International LtdFinal Issue 16 January 2003
or near the city. Improving public transport in and around Edinburgh clearly helps to meet one of the Scottish Executive’s core objectives as set out in the Transport Delivery Plan; that is, reducing urban congestion. It is also central to the Council’s own Local Transport Strategy.
Furthermore, many people do not share in the prosperity and quality of life that the region’s dynamism has generated. Social equity requires that steps are taken to allow everyone access to opportunities, an effective public transport network is essential to achieve this. Such a network can also relieve some of the land and housing pressures that exist in the region by alleviating the imbalances that arise from the perceived poorer quality of transport between Edinburgh and areas to the south east of the city and Midlothian.
To address the need for substantial investment in transport in and around Edinburgh, CEC has developed the Integrated Transport Initiative (ITI), which includes the introduction of road user charging; this would allow major schemes, such as a tram network, to be fundable. In the ITI, improvements to public transport would be introduced before any charging scheme is implemented, including:
• West Edinburgh Bus System;
• Edinburgh Park station;
• Ingliston, Newcraighall, Straiton park and ride sites;
• Straiton-Leith bus quality corridor;
• real time information and Selective Vehicle Detection;
• improved interchange;
• improved weekend and evening bus frequencies;
• major improvements to orbital bus services;
• camera enforcement of bus lanes;
• additional road maintenance;
• some environmental improvements in the city centre;
• ‘door to door’ travel demonstration area.
If road user charging is introduced, some or all of the following additional measures are planned, depending on the nature of the charging scheme:
• tram lines;
• complementary ten minute frequency for buses on main routes in Edinburgh;
• increased bus services linking non-central employment sites in Edinburgh to surrounding areas;
• more park and ride schemes;
• improved bus priority on the City Bypass and a five minute service from South Gyle to the new Royal Infirmary, connecting with other bus routes;
• bus priority on all traffic corridors including routes to surrounding areas;
• further improvements to public transport information and ticketing;
• safety and security improvements on public transport;
• environmental and safety improvements in the city centre;

The City of Edinburgh Council Edinburgh LRT Masterplan Feasibility StudyFinal Report
C:\DOCUMENTS AND SETTINGS\CHRIS BAKER\LOCAL SETTINGS\TEMPORARY INTERNET FILES\OLK1D\0019REPORT-FINAL ISSUE.DOC REP/FI
Page 13 Ove Arup & Partners International LtdFinal Issue 16 January 2003
• more and improved cycle facilities throughout Edinburgh;
• 20 mph zones in residential areas throughout Edinburgh;
• better facilities for people with mobility difficulties;
• improved maintenance of key traffic routes in Edinburgh;
• major investment in an orbital bus service providing a high quality link between edge-of-city employment locations, park and ride sites and interchanges with radial bus and rail services;
• passenger services on Edinburgh South Suburban Railway;
• reopening of the Borders rail line from Edinburgh to Galashiels;
• improved rail services linking Edinburgh, Fife, West Lothian, East Lothian and other areas.
In order to fulfil the commitment to delivering a tram network, which forms the centrepiece of this investment programme, initial development and planning has to start now. The experience of tram schemes elsewhere in the UK illustrates the length of time it takes from inception to implementation. This applies to extending existing systems (Manchester, Sheffield, Birmingham and Croydon) and introducing new systems (including Leeds, Nottingham, South Hampshire and Bristol).
1.6 Study Approach A two phase approach was devised using the CSTM3 transportation demand model held by the Scottish Executive as the main forecasting tool. The first phase comprised a comparison of all of the Inner Edinburgh LRT corridors nominated by CEC and their appraisal against preliminary criteria based on STAG 1 Appraisal requirements. This comparison led to recommendations for a “core network” of the strongest schemes for more detailed assessment at Phase 2. Phase 2 comprised further appraisal under STAG with additional detail on the environmental and economic aspects of the core alignments, including an outline cost benefit analysis. This forms the basis of recommendations on priorities for LRT implementation, recognising the commitments already accepted by CEC.
1.7 Light Rapid Transit Systems
1.7.1 Introduction
Although this study is intended to develop light rail network recommendations for Edinburgh, it is important to recognise that light rail involves substantial costs and provides a quality of service and capacity that will not be warranted in all corridors. There are other guided modes of public transport (often loosely referred to as “technologies”) that may be more relevant for areas where demand is lower or special circumstances apply. A description of these modes provides important background to the Masterplan work and is given in this section.
1.7.2 Light Rail
Light Rail Transit (LRT) developed from street tramways in post-War Continental Europe. It offers the alignment flexibility of the tram with high capacity cars operating, where possible, on their own right-of-way. The dividing line between trams and LRT is of academic interest but, for all practical purposes, they are a single family of electric rail transit modes capable of street and segregated operation. There is an increasing number of new light rail networks, while tram networks are in operation in many towns worldwide. The technology is well proven and there is continuing development of both vehicles and infrastructure.

The City of Edinburgh Council Edinburgh LRT Masterplan Feasibility StudyFinal Report
C:\DOCUMENTS AND SETTINGS\CHRIS BAKER\LOCAL SETTINGS\TEMPORARY INTERNET FILES\OLK1D\0019REPORT-FINAL ISSUE.DOC REP/FI
Page 14 Ove Arup & Partners International LtdFinal Issue 16 January 2003
Light Rail vehicles run on fixed track alignment using conventional railway technology of flanged steel wheels on steel rails. The key feature of LRT is its alignment flexibility. It can run on street and on its own right-of-way. Sharp curves, as sharp as 18m, and quite steep gradients can be used if necessary. The vehicles are almost always electrically powered. For street operations in Britain, the maximum permitted voltage is 750v dc.
The length and weight of an LRV is dependent on the number of sections that make up a car, which will be influenced by the capacity requirements of the system. However, a typical LRV is between 25m and 35m in length with an unladen weight of between 30 tonnes and 45 tonnes.
LRVs can be articulated, although rigid cars can also be operated singly or as coupled sets. Single-articulated vehicles have two sections usually carried on three bogies (six axles), while multiple section LRVs use several axles to carry the sections. Many innovative LRV low floor designs exist. Some of these involve single axles rather than bogies. Low floors can be provided on conventional designs also.
The car dimensions, the seating layout and standing room determine the capacity of an LRV. Typical approximate total capacities of three main types of LRV are:
• rigid car : up to 100 passengers;
• single articulated car : between 100 and 200 passengers;
• double articulated car : 200 passengers plus.
There is a statutory requirement that level transfer be provided from platform to floor of the vehicle through at least one door. This means that the light rail vehicle floor height determines the minimum height of all boarding platforms. The aim of most modern systems is to have vehicles with some low floor capability that will allow level access from street stops. In practice, this recommendation offers two choices:
• the use of a high-floored vehicle with level access provided via raised platforms, as employed by the Manchester Metrolink system;
• the use of a low-floored vehicle with “low” platform (defined as being less than 350mm high), as used on the Grenoble and Genéve LRT systems.
It is generally accepted that light rail is perceived by the public to have a high quality image better than that of bus services. The general characteristics of light rail which account for this include:
• a visibly distinct right-of-way;
• low interior and exterior noise levels;
• smooth ride;
• well-spaced comfortable seating;
• high quality passenger information systems;
• level, step-free access between station platforms and the vehicle;
• off-vehicle ticketing.
1.7.3 Guided Bus
There are three principal types of guided bus system:
• kerb guidance;
• rail guidance or GLT;

The City of Edinburgh Council Edinburgh LRT Masterplan Feasibility StudyFinal Report
C:\DOCUMENTS AND SETTINGS\CHRIS BAKER\LOCAL SETTINGS\TEMPORARY INTERNET FILES\OLK1D\0019REPORT-FINAL ISSUE.DOC REP/FI
Page 15 Ove Arup & Partners International LtdFinal Issue 16 January 2003
• electronic guidance.
It is important not to confuse guidance systems with methods of propulsion for the vehicle. The use of electric traction may indeed be facilitated in guided operation but it is as easy to operate on street in electric or diesel traction as it is on guideways.
The ability to operate conventionally and on guideways enables guided bus systems to combine the feeder and trunk-haul journey elements into one service, thereby reducing the need for passengers to interchange. This is seen as an important advantage over light rail systems that cannot serve low patronage branches cost effectively and, therefore, require more interchange.
Guided Bus – Kerb Guidance
This system, which is proposed for WEBS, was developed under the auspices of the West German BMFT in the late 1970s involving two vehicle manufacturers, Mercedes-Benz and MAN. Public service operation commenced in Essen in 1980 as part of a structured demonstration project. Three key corridors (all ex-light rail) are now kerb guided bus and include a variety of applications such as one and two-way alignment along the median of a dual carriageway, segregated roadside alignments and a section of underground operation shared with light rail. Diesel and electric operation are featured, using both rigid and articulated buses.
A commercial system was also opened in Adelaide, South Australia. The 12km express guideway was completed in 1989. 100km/hr is the normal running speed and patronage on the guided bus services has doubled compared with other routes in the city. Routes in Leeds were introduced in the 1990s and there is a successful installation in Ipswich for “Superoute 66”.
Guideways have parallel kerbs set 2.6 metres apart, which are used to guide the vehicle via guidewheels attached to the vehicle’s steering system. Kerb guided buses are fitted with two horizontal solid rubber tyred guide wheels located ahead of the front wheels and connected by solid arms directly to the steering mechanism of the bus. The guidance is, therefore, via the steering box resulting in low lateral forces on the guidance kerbs. The guide wheels are not retractable and project beyond the bus body by about 50mm when the road wheels are in the straight ahead position.
The track consists of precast concrete units. The concrete units are “L” shaped and incorporate both the kerb (185mm high) and the wheel track (700mm wide and 235mm thick) to provide a running surface for the bus wheels. A two-way kerb guided busway is approximately 6.2 wide. This is the main advantage over an unguided busway, which can be between 6.75m and 7.3m wide.
Kerb guidance is not practicable in mixed traffic due to the raised kerbs. At major junctions, the guideway has to be broken and the vehicle steered across the intersection into the next section of guideway. However, gaps of up to 6m in length can be negotiated at speed without steering. These gaps allow for pedestrian and single lane crossings.
A guided bus can negotiate a guideway curve of 200m radius without the need for guideway widening or rear guidewheels. Smaller radius curves can be negotiated with a single guide kerb on the outside of the curve or a reversion to manual steering.
Kerb guidance equipment has been fitted to a variety of different bus designs including double deck, single deck, articulated single deck, low floor single deck and midi buses. It is feasible, therefore, to tailor vehicle capacity (and service frequencies) to meet projected demand.
Level access between a bus stop “platform” and the vehicle can be achieved as the guidance system allows the bus to be brought close to a raised boarding platform without fouling it. Step-free access on to the vehicle can be achieved either with low-floor buses or with high

The City of Edinburgh Council Edinburgh LRT Masterplan Feasibility StudyFinal Report
C:\DOCUMENTS AND SETTINGS\CHRIS BAKER\LOCAL SETTINGS\TEMPORARY INTERNET FILES\OLK1D\0019REPORT-FINAL ISSUE.DOC REP/FI
Page 16 Ove Arup & Partners International LtdFinal Issue 16 January 2003
platforms and step-free bus doors. However, street operations probably preclude high platform provision.
Maximum speed on the guideway depends on gradients, curves, signalling arrangements, stop spacing and vehicle design. On the Adelaide guideway, the maximum permitted speed is 100km/hr (62mph), although on some curves there is a speed limit of 80km/hr (50mph) to avoid the rear wheels of articulated buses from scrubbing the kerbs.
Guided buses using kerb guidance can operate under diesel or electric power. Electric traction means trolleybus operation and involves erecting two wires over each guideway. Operation solely using electric traction would restrict operation to wired routes only. Where it is necessary to adopt electric traction, “duobuses”, capable of operating under diesel and electric power, may be used.
It would be reasonable to expect that the use of a segregated, fixed track system would help to improve the reliability of operation and the image of the system. Guided busways can also improve the vehicle ride quality, although this would only be over guideway sections. High quality vehicles, passenger information systems and bus stop infrastructure can be provided to complement the increased reliability and shorter journey times made possible by the segregated guided busways.
Guided Bus – Rail Guidance (Guided Light Transit)
Guided Light Transit (GLT) was developed by the Belgian light rail manufacturer, BN, (now part of the Bombardier-Eurorail group) as a flexible form of light rapid transit using a combination of light rail and bus technology. The design of the prototype “buses” is derived from the articulated light rail vehicles built by BN. Similar systems are now available from Lohr Industrial (TRANSLOHR) and Cogifer (TLP).
An initial short GLT demonstration line was opened in Brussels in mid-1980s and a full demonstration route was opened at Rochefort in the Ardennes in 1989. Following trials in the Paris area, a new system was opened in Nancy in 2001.
GLT features a central guide rail laid with its top level with the running surface. The vehicle has a patented guide roller mechanism fitted to each axle on the vehicle. The axle-mounted rollers, which are equipped with a flange on each side, are lowered to engage on the guide rail, which then transmits changes in direction to the steering mechanism at each axle of the articulated vehicle. The vehicle can also be steered by the driver.
The guiderail can be inset into the carriageway of unsegregated sections to provide a flush surface capable of being crossed by other vehicles. Alternatively, on a segregated guideway, used only by GLT vehicles, all that is needed is the central rail with narrow running surfaces on either side to support the vehicle wheels. The width of a double track GLT alignment is 6.16m, similar to that for a kerb guided system.
Entry to and exit from a guided section cannot exceed a speed of 10kph. The relatively slow entry and exit may be a considerable disadvantage if frequent breaks are needed between guideway sections, although the flush designs reduces the need to break the guiderail.
The vehicles may be “dual mode” using power obtained from a 600v DC overhead line via a pantograph or from a diesel-electric generator. To use electric power in unguided mode current return would have to be via a second overhead line (i.e. a trolleybus system), which may also be used on guided sections.
The double-articulated GLT vehicle has an unladen weight of 25 tonnes, 18.5 tonnes for the single-articulated version. It is powered by two 150kW electric motors. Power can be supplied to these motors by two methods:

The City of Edinburgh Council Edinburgh LRT Masterplan Feasibility StudyFinal Report
C:\DOCUMENTS AND SETTINGS\CHRIS BAKER\LOCAL SETTINGS\TEMPORARY INTERNET FILES\OLK1D\0019REPORT-FINAL ISSUE.DOC REP/FI
Page 17 Ove Arup & Partners International LtdFinal Issue 16 January 2003
• from an overhead electric power supply via a roof-mounted pantograph, with the current returning to earth via the guide rail or using trolleybus overhead line;
• from a diesel engine-powered generator.
Guided Bus – Electronic Guidance
Initial research and development of electronic buried cable guidance was carried out in the 1970s by the Transport and Road Research Laboratory (TRRL). A test track at the TRRL site at Crowthorne, Berkshire was used for experimental work in electronic guidance and driverless bus operation. During 1984 and 1985 an electronic guidance system was demonstrated in public service at Fürth in Germany. The technology has been greatly developed through industrial applications, such as Eurotunnel maintenance vehicles.
Although electronic guidance is feasible there are safety concerns relating to situations in which reduced adhesion can occur and when the bus “loses” the guidance signal. Given the likelihood of poor road conditions during the winter months and the lack of recent developments in this form of guidance, we believe that it is unlikely to be of interest.
1.7.4 Relative Cost and Capacity of Tram and Guided Bus
This cannot be defined precisely since there are so many considerations involved covering network configuration, car design and method of operation. However, an indication can be given as set out in Table 1.1.
Table 1.1: Comparison of Public Transport Modes
Vehicle Capacity (Passengers)
Capacity (pax/hr/dir)
Track Cost (£m/km) Cost/Vehicle
Tram 150 – 250 4,000 – 11,000 £9m - £12m £1.5m - £2.5m
Busway(1) 50 – 150 2,000 – 6,000 £3m - £4m £200k
Conventional Bus 50 – 80 2,000 – 3,000 Shared roads small £150k
(1) Assumes off vehicle ticketing and articulated buses
The City of Edinburgh Council Edinburgh LRT Masterplan Feasibility StudyFinal Report
C:\DOCUMENTS AND SETTINGS\CHRIS BAKER\LOCAL SETTINGS\TEMPORARY INTERNET FILES\OLK1D\0019REPORT-FINAL ISSUE.DOC REP/FI
Page 18 Ove Arup & Partners International LtdFinal Issue 16 January 2003
2. PHASE 1 APPRAISAL
2.1 Introduction The Phase 1 Appraisal comprised a sequence of steps culminating in preliminary forecasts for selected corridors. The study brief called for the identification of a viable network of light rapid transit routes to meet a range of objectives. It also stated that the study should commence with a review of the route corridors outlined in the brief and that other routes not in the brief, which may prove more viable, should be considered. However, much work has already been done on the North Edinburgh Scheme of which account has been taken.
Our approach to the study, therefore, began with a very general review of the demand prospects for light rail, at corridor level, and sifted these prospects to produce a long list for consideration. The next step was to assess the alignment opportunities and problems in the corridors to identify those that pose significant difficulties, which cannot be resolved without more detailed study. Finally each corridor was considered for new development opportunities that could have synergy with light rail. The less attractive corridors under these broad criteria were shelved, but not rejected, and the remainder went forward for Phase 1 cost and revenue forecasts. In addition, the North Edinburgh Loop and the South Suburban Corridor, both the subject of significant planning work, are reviewed below as a prelude to their inclusion in the appraisal.
2.2 Corridor Review
2.2.1 Existing Main Travel Markets
The review of travel corridors in the Edinburgh area was based on the CSTM3 model 1997 trip matrices. These were summarised for CSTM3 zones for all trip purposes and car owning and non-car owning travel to provide a matrix of total 24 hour trips. This picture of the total travel market in a 56 x 56 matrix was compressed to 19 sectors for the City of Edinburgh by amalgamating central Edinburgh zones into a North Central area and a South Central area to include all city centre employment and most further education institutions. This summary trip matrix enabled the scale of movement to be assessed on a common basis. Figure 2.1 shows the plot of all 24 hour travel flows of 10,000 trips or more. The threshold of 10,000 trips/day was chosen to indicate the scale of demand likely to be appropriate for LRT which has high capacity but also higher cost than bus. Assuming that 10% of 24 hour trips occur in the peak hour and that an LRT share of 50% of motorised trips can be achieved, a flow of 10,000/day implies 500/peak hour on LRT. Below this level, LRT is unlikely to be viable. This is a very coarse assumption, but provides a consistent basis for identifying the main travel corridors. The ‘desire lines’ plotted in figure 2.1 are shown in four widths between 10,000 trips/day and the maximum for the area of 18,000 trips/day. They reveal the following main pattern:
• the main travel markets are east-west and northwest-southeast;
• all large travel markets are radial to the central area, there are no significant comparable travel markets cross town or lateral;
• the strongest markets are Silverknowes and South Leith to the northern central area and Corstorphine, South Leith, Portobello and Moredun/The Inch to the Southern Central area;
• the flows between South Gyle/Stenhouse and the Central Area are of medium scale (14,000-16,000 trips/day) but, in effect, represent a larger combined movement corridor;
• flows to the south and southwest of the city centre are generally lower and offer fewer prospects for high quality public transport investment, at least initially.

The City of Edinburgh Council Edinburgh LRT Masterplan Feasibility Study Final Report
C:\DOCUMENTS AND SETTINGS\CHRIS BAKER\LOCAL SETTINGS\TEMPORARY INTERNET FILES\OLK1D\0019REPORT-FINAL ISSUE.DOC REP/ FI
Page 19 Ove Arup & Partners International Ltd Final Issue 16 January 2003
Figure 2.1: 24 Hour Travel Flows of 10,000 Trips or More
The City of Edinburgh Council Edinburgh LRT Masterplan Feasibility StudyFinal Report
C:\DOCUMENTS AND SETTINGS\CHRIS BAKER\LOCAL SETTINGS\TEMPORARY INTERNET FILES\OLK1D\0019REPORT-FINAL ISSUE.DOC REP/ FI
Page 20 Ove Arup & Partners International LtdFinal Issue 16 January 2003
The findings were compared with the outline corridors in the study brief and enable some initial conclusions to be drawn on the basis of travel demand. The possible corridors in the study brief are a distillation of proposals from various sources, existing schemes and the impact of proposed development.
The main corridors of movement, based on 1997 travel data, can be listed as follows; all to Central Edinburgh:
• Silverknowes;
• Newhaven/North Leith;
• South Leith;
• Corstorphine/Murrayfield;
• South Gyle/Stenhouse;
• Moredun/The Inch;
• Portobello.
In every case there is more demand associated with radial travel to Edinburgh from the SESTRAN area that could be important in making the case for LRT, but this is most unlikely to be the dominant market and should be seen as adding to the core urban market which forms the main prospect for LRT.
2.2.2 Opportunities for Light Rail Alignments
The scope for LRT depends on whether viable schemes can be devised that will deliver reliable operations. Taking account of the alignment flexibility of light rail and its operating economics, each of the corridors was reviewed with the following main conclusions.
Silverknowes has one main road corridor into central Edinburgh, the A90 Queensferry Road and the former railway alignment connecting Haymarket and Granton. There is very limited opportunity for segregated LRT alignments along the main road. However, it would be possible to install LRT on part of the former railway branch to Barnton as far as Davidson’s Mains.
Newhaven/North Leith. These areas are linked to central Edinburgh principally via Leith Walk, a wide road offering good scope for segregated LRT. The Newhaven area might be served via Bonnington but there is little scope for segregation of LRT on the roads in this area, although some opportunity for use of former railway routes. However, the latter provide a route into central Edinburgh only via the disused railway tunnel under the New Town, which formed part of the previous LRT plans for the city.
South Leith. The only feasible direct route for light rail is via Leith Walk, which is generally wide enough to accommodate it.
All three of the above travel markets would be directly served by the North Edinburgh Loop LRT scheme. This comprises a 16km loop connecting Waverley and Haymarket railway stations with a major redevelopment area at Granton and the docks at Leith. The alignment follows the formation of the former Granton branch railway for part of its route but has significant street running sections. This is the preferred scheme arising from a study of LRT options undertaken for the Edinburgh Waterfront development team.
Corstorphine/Murrayfield would involve an LRT route north of the Edinburgh-Falkirk railway line. There are only two radial main roads that could provide LRT alignments: the A90 Queensferry Road via Davidson’s Mains and Barnton and the A8 Corstorphine Road. Both roads are heavily used but there are sections of bus priority. If LRT were introduced on either road, it would be necessary to reallocate road space and reduce it for general traffic.

The City of Edinburgh Council Edinburgh LRT Masterplan Feasibility StudyFinal Report
C:\DOCUMENTS AND SETTINGS\CHRIS BAKER\LOCAL SETTINGS\TEMPORARY INTERNET FILES\OLK1D\0019REPORT-FINAL ISSUE.DOC REP/ FI
Page 21 Ove Arup & Partners International LtdFinal Issue 16 January 2003
This is unlikely to be easy, particularly on the inner area sections and through Corstorphine. There will be major issues associated with catering for displaced road traffic since additional western radial highway capacity is not favoured. The use of the former Corstorphine rail branch formation in the Saughtonhall area could be of value as could the re-use of the line to Davidson’s Mains, but neither forms a complete solution.
South Gyle/Stenhouse. The main road for this corridor is the A71, Calder Road, but the West Edinburgh Busway (WEBS) is already defined on an alignment parallel to, and south of, the Edinburgh-Falkirk railway line through Saughton. Therefore, this corridor has good prospects for defining segregated LRT alignments with minimum impact on existing development and road space. There are also clear opportunities for extension beyond South Gyle towards the Airport, etc.
Moredun/The Inch. This area is linked to central Edinburgh by the A7, Dalkeith Road and by the A701/A772, which run parallel in from Cameron Toll. South of the latter there are opportunities for segregated LRT alignments along the Gilmerton Road and Old Dalkeith Road. North of Cameron Toll the situation is complex with continuous frontage development on both main road routes. The main prospects for segregated LRT would be to use the South Suburban railway route, but this is too circuitous to serve central Edinburgh from the corridor, or to undertake extensive traffic engineering to create space for separate north and southbound tracks on parallel roads. Neither is ideal but further study is warranted.
Portobello. This is a densely developed corridor along the A1 and the East Coast Main Line. The A1 Greenway carries significant bus flows and the implementation of LRT on the same route raises significant issues of competition and of disruption during construction. Although there are alignment opportunities for segregated LRT in the inner area along London Road to its junction with Leith Walk, the scope for segregated light rail through “Jock’s Lodge” and Portobello Road is limited without major diversion or suppression of road traffic. At Portobello the tram could follow High Street with through traffic diverted via Sir Harry Lauder Road. Given the difficulty in finding segregated alignments, this corridor cannot be regarded as the priority for LRT unless existing road space can be allocated. However, the large travel market presents a key opportunity despite the absence of new development opportunities in the area.
2.3 Development Proposals We assessed each of the corridors considered against trends and significant committed developments. The following summarises the future developments of relevance:
• residential allocations in Fife and West Lothian increasing commuting into Edinburgh from the west and northwest;
• expansion of Edinburgh Park as an employment centre;
• development of the new Royal Bank of Scotland headquarters at Gogarburn;
• increased activity and development at Edinburgh Airport and the Royal Highland Showground;
• further possible development along the A8 corridor consistent with the West Edinburgh Planning Framework (WEPF);
• expansions of the New Royal Infirmary at Little France to its full capacity;
• a new medi-park facility adjacent to the new hospital;
• residential development at Craigmillar and Niddrie;
• a major residential and community development at Shawfair, south of Newcraighall;
The City of Edinburgh Council Edinburgh LRT Masterplan Feasibility StudyFinal Report
C:\DOCUMENTS AND SETTINGS\CHRIS BAKER\LOCAL SETTINGS\TEMPORARY INTERNET FILES\OLK1D\0019REPORT-FINAL ISSUE.DOC REP/ FI
Page 22 Ove Arup & Partners International LtdFinal Issue 16 January 2003
• redevelopment of the existing Royal Infirmary site at Lauriston Place;
• major retail, commercial and residential development along the Edinburgh Waterfront, including Ocean Terminal and Granton Harbour.
The first five of these changes will have a significant impact on corridors in west Edinburgh, especially via Corstorphine, Saughton or the existing railway corridor. The next four developments all potentially favour a corridor to the southeast. The redevelopment at Lauriston Place could be served by a corridor to the south, but it is close to the city centre and may not, therefore, have such a significant impact as other developments. The developments along the Waterfront would have a significant impact on corridors north of the city centre. Of particular note are employment sites outside the centre of Edinburgh as these could attract trips in the opposite direction to the normal peak movement, which could provide a useful balanced flow for tram. Taking all of these developments together places strong emphasis on tram corridors to north Edinburgh, west Edinburgh and southeast Edinburgh.
2.4 The City of Edinburgh Conceptual Network An initial conceptual network was developed by CEC prior to commissioning this study. The corridors chosen include several proposed as part of earlier work and provide a reasonable geographic coverage of the city. It includes possible extensions of the suburban network to a wider catchment area, including crossing the River Forth into Fife. However, none of the suburban/interurban extensions could be implemented without the urban lines. Therefore, only the urban corridors were considered at this stage. These are described below:
North Edinburgh Loop
The North Edinburgh Loop is described above and is highly relevant to several important movement corridors.
South Suburban
This corridor follows the existing rail freight route that formerly carried passenger trains south of central Edinburgh. The route serves a number of well populated suburban areas, including Morningside, Craigmillar and Niddrie. Other alignments may also exist via roads in the corridor and new alignments may be possible.
West Edinburgh
This radial route broadly follows the alignment of the Central Edinburgh Rapid Transit (CERT) scheme and subsequent West Edinburgh Busway scheme (WEBS). It parallels the main railway from just west of Haymarket to South Gyle before turning north through Edinburgh Park Industrial Estate and then west parallel to the A8 past Edinburgh Airport to Newbridge. This route could extend north to Queensferry or to the west.
Queensferry
This is a direct radial corridor from the city centre to Dalmeny and South Queensferry via Davidson’s Mains and Barnton. From Dalmeny to Barnton the route could follow the A90 and shares existing bus priorities. At Craigleith the corridor merges with the North Edinburgh Loop and continues into the city centre.
South East Edinburgh (A7)
This 10km corridor runs from Danderhall past the new Edinburgh Royal Infirmary through Newington to meet the North Edinburgh loop close to Waverley Station. The northern section of the corridor through Canongate area is heavily congested and solutions to provide LRT priority and space for other traffic will be required.

The City of Edinburgh Council Edinburgh LRT Masterplan Feasibility StudyFinal Report
C:\DOCUMENTS AND SETTINGS\CHRIS BAKER\LOCAL SETTINGS\TEMPORARY INTERNET FILES\OLK1D\0019REPORT-FINAL ISSUE.DOC REP/ FI
Page 23 Ove Arup & Partners International LtdFinal Issue 16 January 2003
South Edinburgh (A701)
This corridor broadly parallels the southeast Edinburgh corridor and could share the same alignment between St Leonards and the Waverley area. It diverges from the A7 near Cameron Toll and passes the University of Edinburgh, King’s Buildings before continuing through Liberton and Alnwickhill to the City of Edinburgh Bypass at Straiton.
South Edinburgh Orbital
The orbital corridor extends for 21km through predominantly residential areas immediately north of the bypass from Ferniehill to Sighthill/South Gyle, linking with the West Edinburgh and South East Edinburgh corridors. This corridor also extends east of Ferniehill towards Musselburgh.
2.5 Priorities for Testing The main corridors of demand and the main alignment opportunities for each were compared with the CEC concept corridor network. Six of the corridors broadly correspond while three corridors do not. Corstorphine is a major corridor of travel demand but does not feature in the CEC conceptual network, while the latter includes two corridors that have only modest demand: South Suburban and the South Orbital.
The initial assessment of alignment opportunities concentrated on identifying light rail alignments with maximum segregation to ensure reliable operations and to avoid sections of narrow highway with extensive frontages, which are likely to involve very significant problems of road space allocation. It is not possible to review all possible alignments in detail. However, a view on each corridor was reached taking account of main roads, scope for new alignments and for re-use of former railways, the level of road traffic and the opportunities for area-wide schemes to create space for segregated or partly-segregated light rail. The main points in our review are given earlier in this section.
We selected seven corridors for initial testing in Phase 1. This selection was based on three main considerations:
• the scale of demand;
• the alignment opportunities;
• the likely scale of new development.
The results of our preliminary review are summarised in Table 2.1. Only two corridors were not recommended for testing: Corstorphine/Murrayfield and Portobello. Both involve significant alignment problems for light rail. Although the Corstorphine/Murrayfield corridor can give access to West Edinburgh/Airport area development, a route via S. Gyle offers alignment advantages over Corstorphine.
Neither the South Suburban or South Orbital corridors are likely to have sufficient demand for light rail and, in both cases, we expect alignment difficulties. However, there is substantial interest in the corridors and, to ensure that their comparative performance with other corridors was clearly demonstrated, they were included in the Phase 1 appraisal process.
The City of Edinburgh Council Edinburgh LRT Masterplan Feasibility StudyFinal Report
C:\DOCUMENTS AND SETTINGS\CHRIS BAKER\LOCAL SETTINGS\TEMPORARY INTERNET FILES\OLK1D\0019REPORT-FINAL ISSUE.DOC REP/ FI
Page 24 Ove Arup & Partners International LtdFinal Issue 16 January 2003
Table 2.1 Corridor Selection for Phase 1 Appraisal
Main Corridors of Demand CEC Corridors Alignment
Opportunities
New Development
Proposals
Select for Phase 1
Silverknowes Queensferry Medium Few Yes Newhaven/N. Leith N. Edinburgh Loop Established Significant Yes S. Leith N. Edinburgh Loop Established Few Yes Corstorphine/Murrayfield - Poor Some No S. Gyle/Stenhouse W. Edinburgh Good Significant Yes Moredun/The Inch S/SE Edinburgh Good Significant Yes Portobello Portobello Poor Few No South Suburban Poor unless SSL Some Yes South Orbital Poor Some Yes
2.6 North Edinburgh Loop
2.6.1 Study Objectives
This scheme is already studied in detail. This section contains a review of a study report entitled ‘Feasibility Study for a North Edinburgh Rapid Transit Solution’ commissioned by a Steering Group consisting of local businesses and public bodies acting on behalf of Waterfront Edinburgh Ltd (WEL), a joint venture between the CEC, and Scottish Enterprise Edinburgh and Lothian. The study commenced in January 2001 and was undertaken by a multi-disciplinary consortium headed by Andersen.
The purpose of the study was to examine the feasibility of a rapid transit link between the proposed Waterfront Granton Development to the northwest of the city, and the city centre, although later it was extended to consider rapid transit links with Leith and Newhaven as well. The objective was to determine whether a rapid transit scheme linking the proposed Waterfront Development and the city centre was feasible and to identify whether a scheme satisfying Part 1 STAG appraisal criteria would meet the aims set by a steering group and the Local Transport Strategy. Furthermore the study sought to: -
• establish the economics of a solution, considering all practical public transport modes; • recommend an appropriate procurement route; and • develop an outline business case supporting the recommendations.
The study also formed the basis of a submission to the City of Edinburgh Council and the Scottish Executive to secure Public Transport Funding (PTF) to develop the scheme further to a STAG Part 2 appraisal.
2.6.2 Scope of the Study
The main body of the study focussed on the following areas: -
• Transport Policy/previous studies: local, regional, national policy context.
• Economic impact analysis: consideration of how a transport solution could benefit the economy of the Waterfront development area as well as contribute towards tackling social exclusion within existing areas.
• Traffic/patronage review: overview of current transport situation for road traffic/public transport, and details of future growth and trip generation from the Waterfront Development.
The City of Edinburgh Council Edinburgh LRT Masterplan Feasibility StudyFinal Report
C:\DOCUMENTS AND SETTINGS\CHRIS BAKER\LOCAL SETTINGS\TEMPORARY INTERNET FILES\OLK1D\0019REPORT-FINAL ISSUE.DOC REP/ FI
Page 25 Ove Arup & Partners International LtdFinal Issue 16 January 2003
• Engineering analysis: technical analysis of alternative route alignments, feasibility study for potential depots sites for light rail vehicles.
• Option analysis: consideration of the most appropriate route, the technology available and how best to integrate with other transport systems in the city.
• Consultation process: a series of consultation meetings were conducted with key stakeholders to discuss the various aspects of the study and the proposals that were put forward.
• Financial analysis/Procurement route/Risk analysis.
2.6.3 Policy Context
The report was developed in accordance with The Scottish Executive Guidance for PTF bids and the draft Scottish Transport Appraisal Guidance (STAG). The study also took account of the aims and objectives of both local and central Government transport policy, and other reports made available to the study team.
2.6.4 Options Considered
The study focused on three scheme scenarios that are broadly defined as follows:
• an alignment from Granton Square, through the Waterfront site and then via the disused railway line to Haymarket station;
• a continuation of the first option on-street to St Andrew Square;
• a North Edinburgh Loop from Granton Square to Haymarket and St Andrew Square, Leith via Leith Walk to Ocean Terminal and along the foreshore to Granton Square.
Within these three options a number of sub-options were considered on different alignments. However, following preliminary analysis, it soon became clear that some of the options put forward were not attractive due to technical problems and a lack of likely demand. For this reason only a small number of options was taken forward for financial assessment.
In terms of the light rapid technologies available for use in these scenarios, it was resolved through discussion at a workshop that two systems should be considered, light rail and a guided bus. The issues under discussion included:
• capital cost of alternative technologies;
• perception of the mode used;
• additional infrastructure required i.e. depot for light rail vehicles;
• degree of segregation.
2.6.5 Preferred Option
It was concluded that the best-fit route alignment for the first stage, from Granton to Haymarket, should utilise the former railway corridor running from Crewe Toll to Roseburn. This would offer segregated running for a significant element of the scheme and avoid many of the pinch points that exist in the North Edinburgh area. The route then continues along Princes Street to St Andrew Square, up to Leith, via Leith Walk and then on to Ocean Terminal, before returning along the foreshore to Granton.
The study concluded that a guided bus system was not perceived as being capable of generating the modal shift that could be achieved with light rail. In addition, a guided bus solution was seen as offering segregation for only part of the route length, therefore, offering no advantage over a conventional bus service operating in the city. A light rail option was
The City of Edinburgh Council Edinburgh LRT Masterplan Feasibility StudyFinal Report
C:\DOCUMENTS AND SETTINGS\CHRIS BAKER\LOCAL SETTINGS\TEMPORARY INTERNET FILES\OLK1D\0019REPORT-FINAL ISSUE.DOC REP/ FI
Page 26 Ove Arup & Partners International LtdFinal Issue 16 January 2003
shown to be viable for two of the three alignment scenarios, performing most strongly for the North Edinburgh Loop (scenario 3).
The STAG part 1 appraisal demonstrated that the Loop scheme fits well with the Government’s five appraisal criteria for transport and contributes well to the objectives of the Edinburgh Local Transport Strategy.
The financial and economic analysis showed that the scheme could cover operating costs from revenue as well as delivering economic benefits that outweigh the funding gap. The following costs and revenues were given:
Capital Costs (£) Operating Revenues/Costs (£) Description Operating Revenues Civil 54,851,000 Background (2006) 7,265,000Electrical 19,335,000 Development (2006) 2,994,635Stops 6,870,000 Total 10,260,074Depot 13,075,000 Operating Costs (2006) 5,430,000Track 43,942,000 Vehicles 28,800,000 Contingencies 25,030,957 Grand Total 191,904,000 Route Cost (£M/km) 12.22
The conclusion of the study was to put forward proposals for a light rail link to connect the Waterfront development to the city centre by means of a ‘North Edinburgh loop’. The members of the Steering Group supported a recommendation to CEC that funding should be sought from the Scottish Executive to develop the preferred option to the STAG Part 2 approval process. An Integrated Transport Fund award of £6.5m was made by the Scottish Executive to support the development of the project.
2.7 South Suburban Line
2.7.1 Background
The South Suburban Line runs in a loop connecting Haymarket and Waverley Stations and carries freight only, having been closed to passenger traffic in 1963. Since its closure there has been sporadic interest locally in re-opening the line and several studies have been commissioned by Lothian Regional Council and, later, CEC to consider the feasibility of reopening the line for heavy rail passenger services. In 1999 Halcrow Fox suggested introducing light rail on shared track having reviewed the costs of the heavy rail scheme. This option has been favoured in recent years with the emergence of more detailed proposals for light rail schemes elsewhere in Edinburgh.
The line carries significant freight traffic that reduces pressure on track capacity through Waverley. Therefore, the reintroduction of passengers would need to mesh with freight requirements, which would constrain the headway. A heavy rail service would also require capacity on the Haymarket-Waverley-Portobello section, which could trigger significant costs. In addition, the problem with the service is that it can only provide a circuitous route for the radial travel market from the inner areas it services, so that bus competition for trips to the city centre is likely to be very strong.
LRT would require common track operation, which is likely to be feasible but brings several problems:
• high cost of providing for safe, shared heavy rail and LRT operation;
• LRT would need its own alignment on the north side of the Loop;

The City of Edinburgh Council Edinburgh LRT Masterplan Feasibility StudyFinal Report
C:\DOCUMENTS AND SETTINGS\CHRIS BAKER\LOCAL SETTINGS\TEMPORARY INTERNET FILES\OLK1D\0019REPORT-FINAL ISSUE.DOC REP/ FI
Page 27 Ove Arup & Partners International LtdFinal Issue 16 January 2003
• radial bus competition would be very strong for the reason given above.
A study report entitled ‘South Suburban Solution’ was submitted to the Scottish Executive as a bid for financial support under the Public Transport Fund Preparation Pool. The purpose of the bid was to secure funding to develop the economic and technical case for proposals to re-open the Edinburgh South Suburban line to passenger services. It was prepared on behalf of the CEC by Turner and Townsend, Public Private Partnerships (TTPPP) in August 2001.
The South Suburban Line scheme featured in the Local Transport Strategy. Much of the impetus has come from proposals put forward by E-Rail, a private sector consortium who have demonstrated interest in the re-opening of the line. They propose to use the development gain that could be generated along the corridor to help fund the capital cost of the scheme. The scheme also gained provisional support from Railtrack, ScotRail and Lothian Buses.
The feasibility work undertaken so far for the reinstatement of the line as a heavy rail scheme is deemed appropriate for a STAG Stage 1 appraisal. The bid submitted to the Scottish Executive, therefore, was to fund the work necessary to take forward the proposals beyond STAG Stage 2 to a point where procurement could commence. Some funds were awarded to undertake limited further analysis of options.
2.7.2 The E-Rail Scheme
The preferred scheme for the South Suburban Line, put forward in the bid to the Scottish Executive, was to progress a heavy rail solution in the short term, with the possibility of introducing light rail with shared running later. The service would operate from Haymarket to Waverley serving nine new/re-opened stations. Preliminary estimates suggest the capital cost of such a scheme would be of the order of £33 million, excluding the costs of later conversion to light rail.
In general, the options considered as part of the scheme were restricted to the re-utilisation of existing assets in a constrained corridor. The alternatives for this transport corridor, however, are to pursue a Do-Minimum strategy with improved bus services, or do nothing. Neither of these options satisfies the objectives of the Local Transport Strategy.
It is thought that some parts of the existing track and much of the signalling along the line would need to be replaced, (especially if light rail emerges as the preferred option for the route) as the line no longer met the operational or accessibility standards that would be required by either a heavy or light passenger railway. Furthermore, recent legislation such as the Disability Discrimination Act 1995 will need to be taken into account for station access, and it is thought that certain sections of the line will need re-grading. The track was relaid in summer 2002.
Under the existing operating conditions there is insufficient capacity at Haymarket station to accommodate a 15-minute headway and no spare capacity at Waverley station.
Economic Appraisal
Both WS Atkins, on behalf of E-Rail, and Halcrow Fox, on behalf of the CEC, have undertaken demand assessment work. The latter is now largely out of date, due to the age of the data on which the majority of the assumptions are based. The more recent work by E-Rail, however, does appear to suggest that the operating costs of a heavy rail scheme could be covered by the revenue generated by the service. Ten scenarios were tested with differing routes and headways. Most of these were based on a 15-minute headway, which is somewhat optimistic given the existing capacity at Haymarket and Waverley stations. It was shown, however, that, given the lower operating costs, a 30-minute headway service would be viable.
The estimated capital costs for the implementation of the preferred heavy rail scheme are as follows (first quarter 2001 base): -

The City of Edinburgh Council Edinburgh LRT Masterplan Feasibility StudyFinal Report
C:\DOCUMENTS AND SETTINGS\CHRIS BAKER\LOCAL SETTINGS\TEMPORARY INTERNET FILES\OLK1D\0019REPORT-FINAL ISSUE.DOC REP/ FI
Page 28 Ove Arup & Partners International LtdFinal Issue 16 January 2003
• £33M for a 30 minute service
• £40M for a 15 minute service
• Additional Abbeyhill loop +£7M
No costs were provided for light rail proposals.
Social Aspects
It is widely accepted that there are pockets of socially deprived areas in Edinburgh that suffer from their lack of access to facilities and services, particularly where there is low car ownership. The Craigmillar estate is an example of such an area that would benefit from the improved access that a reinstated South Suburban Line would bring. It would open up access to employment opportunities further from this area, in particular by reconnecting the community with the national rail network.
Summary
The report prepared by TTPPP concluded that the re-opening of the South Suburban Line was potentially attractive, whether an interim heavy rail solution with later conversion to light rail, or a light rail solution from the outset.
However, this rather tentative conclusion was based on preliminary costings for works on the South Suburban itself, but excluding the costs of providing extra capacity between Haymarket Central Junction and through Haymarket and Waverley to Portobello Junction, which are likely to be considerable. Also, freight use of the SSL, already significant, could increase, raising additional expensive capacity and other issues.
2.7.3 The Corridor
The E-Rail scheme is the latest of several proposals to revive the SSL for passengers. It could serve the South Suburban Corridor but other opportunities also need to be considered that would avoid the unsolved problems with the E-Rail scheme.
Alignment alternatives to the railway for LRT are relatively easier to identify in the Niddrie and Craigmillar area, possibly following Niddrie Mains Road and Peffermill Road to Cameron Toll, then along Lady Road or the edge of The Inch Park to reach West Mains Road past the University. From here westwards, nearly all the alignment opportunities are on existing highways and, west of the A702 at Morningside Station, these become more difficult through Merchiston and towards Gorgie. South Suburban LRT need not be thought of as a circular service, it could link to other LRT corridors as appropriate but, if it is to serve the shopping and employment centres, would need to reach Princes Street. All direct radial road approaches are fairly congested and there are few opportunities for diverting road traffic.
To the east, a South Suburban LRT route could run to Musselburgh or turn north via Portobello. In either case there is no easily identified segregated alignment and LRT would need to take roadspace.
To assess the general travel market in the corridor, the CSTM3, 1997 trip matrices were reviewed. Daily trips between each of the zones in the corridor between Gorgie and Niddrie/Duddingston were identified. These show that demand along the corridor between Niddrie and Merchiston/Morningside is modest at less than 2,000 trips. It is stronger between Gorgie and Morningside (about 3,000 trips/day) and between Craiglochart and Gorgie (about 2,500 trips). None of these flows is likely to justify LRT investment.
2.7.4 Conclusions
The South Suburban Corridor presents several key difficulties in developing a case for rail investment. These may be summarised as follows:

The City of Edinburgh Council Edinburgh LRT Masterplan Feasibility StudyFinal Report
C:\DOCUMENTS AND SETTINGS\CHRIS BAKER\LOCAL SETTINGS\TEMPORARY INTERNET FILES\OLK1D\0019REPORT-FINAL ISSUE.DOC REP/ FI
Page 29 Ove Arup & Partners International LtdFinal Issue 16 January 2003
• radial demand (to the city centre) is strong but cannot be attractively served by a circuitous route;
• there is probably insufficient (lateral) demand along the corridor to justify LRT investment;
• if the railway is not used, there are major alignment problems for LRT, particularly towards the western end;
• the heavy rail solution reviving passenger services on the SSL depends on sufficient capacity through Waverley, which will add to costs significantly.
Therefore, it will be difficult to develop attractive heavy or light rail schemes for this corridor. However, for reasons discussed elsewhere, an outline light rail scheme was included in our Phase 1 tests.
2.8 Appraisal of Long List of Corridor Schemes
2.8.1 Appraisal Framework
The basis for initial appraisal of routes in Phase 1 of the study is to identify the key features of each route and their impact under the objectives in the Scottish Transport Appraisal Guidance (STAG). This is coupled with a qualitative description of each route in meeting the following specific local objectives derived from Edinburgh’s LTS with the STAG objectives they refer to:
• to improve accessibility, particularly for people without access to a car, on low incomes or whose mobility is impaired (Accessibility);
• to reduce pollution and environmental damage caused by traffic (Environment);
• to reduce traffic congestion (Economy);
• to make the transport system safer and more secure for both users and non-users (Safety).
STAG is the method of appraisal derived by the Scottish Executive for major transport investment. It includes qualitative and quantitative elements. This appraisal is predominantly qualitative and descriptive and is consistent with a preliminary STAG 1 screening process and Part 1 Appraisal Summary Table. Key indicators under each of the STAG objectives are as follows:
• Environment – indicative scale and scope of environmental impact noting specific locations or incidence groups affected by change to the local environment resulting from e.g., a reduction in road traffic;
• Safety – indicative scale of impact on safety and security;
• Economy – indicative impact on access to employment sites, opportunity for development and the broad effect of public transport journey times and choices on traffic volumes and reliability, capital expenditure and operating costs and revenue for each route to provide an indicative operating ratio as an initial estimate of value for money;
• Integration – indication of opportunities for interchange at key locations, provision of integrated public transport network and opportunities for Park and Ride;
• Accessibility – the indicative size of residential population and employment markets accessible by tram on each route; qualitative impact of providing public transport to areas of deprivation (with reference to GIS demographics).

The City of Edinburgh Council Edinburgh LRT Masterplan Feasibility StudyFinal Report
C:\DOCUMENTS AND SETTINGS\CHRIS BAKER\LOCAL SETTINGS\TEMPORARY INTERNET FILES\OLK1D\0019REPORT-FINAL ISSUE.DOC REP/ FI
Page 30 Ove Arup & Partners International LtdFinal Issue 16 January 2003
A draft AST was prepared for the long list of routes (each in isolation) with levels of impact indicated using the seven point scoring identified in STAG with supporting comments where appropriate. The AST includes a description of the key features and main areas of impact for each route with reference to the local objectives identified below.
Options that perform badly under the objectives, or would be better considered in some other form than as part of a tram network, were not considered in Phase 2 of the study.
The operating ratio under “economy” was based on initial CSTM3 model runs of all corridors to provide LRT revenue based on bus fares, and operating costs using typical unit rates from other British LRT schemes.
Possible extensions into SESTRANS areas were not considered in Phase 1 as they depend upon the prior existence of inner area routes.
2.8.2 Appraisal Summary Tables
The ASTs for each corridor considered in isolation are given below. The assessment is based on a preliminary specification of routes for each corridor that enable qualitative inputs to be scored. The scoring method is the one used in STAG, that is, a seven point scale from large negative impact (-3) to large positive impact (+3), with 0 representing neutral or insignificant impact. A definition of routes was also needed to identify capital costs, operating cost and revenue.
Seven corridors were included in the Phase 1 appraisal representing the main travel demand opportunities and the ideas already developed by CEC. Several corridors were not included because their alignment difficulties make them unlikely candidates for early implementation. Consequently, we did not assess Corstorphine/Murrayfield, although the latter area would be partly served by a S. Gyle/Stenhouse route via the WEBS alignment, nor did we include Portobello, although this is clearly relevant for any eastern SESTRANS extension, and cannot be rejected on demand grounds.
The routes assumed for AST preparation were as follows:
North Edinburgh Loop - as identified in study by Andersen.
South Suburban Corridor - following the railway line throughout, assuming a circular service.
S. Gyle/Stenhouse - Newbridge via S. Gyle and beside the railway to or near Haymarket, then on street following the alignment identified for the North Edinburgh Loop as far as St. Andrew Square.
Queensferry/Silverknowes - S. Queensferry, Dalmeny via the A90 to Barnton, then via former rail alignment at Davidson’s Mains to join the alignment established for the North Edinburgh Loop via Haymarket to Waverley.
South East Edinburgh - Danderhall via the A7 to Newington and then via E. Preston Street and Clerk Street to Princes Street via North Bridge.
South Edinburgh - from Straiton via the A701 through Liberton to Cameron Toll and then via the SE Edinburgh route.
South Edinburgh Orbital - From South Gyle (Meadow Place Road) via the B701 to Ferniehill (Ferniehill Drive).
2.8.3 Capital Costs
Capital costs for each line were assessed using unit rates. The costs were assessed following site visits and video surveys of the corridors to determine where segregation was possible.
The City of Edinburgh Council Edinburgh LRT Masterplan Feasibility StudyFinal Report
C:\DOCUMENTS AND SETTINGS\CHRIS BAKER\LOCAL SETTINGS\TEMPORARY INTERNET FILES\OLK1D\0019REPORT-FINAL ISSUE.DOC REP/ FI
Page 31 Ove Arup & Partners International LtdFinal Issue 16 January 2003
The unit rates used are consistent with outline business case project costs for other LRT systems in the UK and outturn costs. Allowances were made for structures, although individual items were not covered in detail. Costs for depots and light rail vehicles are included and an allowance made for Railtrack costs where appropriate. Assuming that routes would form a network would mean that depot costs would be shared. The Phase 1 appraisal assumed that half of the total depot cost is allocated to each line. The following cost rates were used:
Segregated alignment (per route km) £11M
On-street alignment (per route km) £9M
Depot cost (per item) £8M
Light Rail Vehicle £1.6M
The cost of the North Edinburgh Loop and South Suburban Line were calculated by others for earlier studies. We did not review these costs. The number of LRVs required was assessed using a factor of 0.8 LRV/km of route based on other schemes.
2.8.4 Operating Costs
Initial operating costs were assessed for each LRT route using typical rates for operating and maintenance charges based on business case estimates and outturn for other LRT systems in the UK. An average rate of £3.20 per tram km was used. The items that this notionally covers include:
• salary costs;
• power costs;
• overheads;
• insurance;
• vehicle maintenance and renewals;
• track and infrastructure maintenance;
• policing and security.
The costs are based on each line operating independently to a city centre terminus. The Queensferry, West Edinburgh, South Edinburgh and South East Edinburgh routes were assumed to terminate at Waverley. Each of the services assumed for Phase 1 was costed assuming a 19 hour operating day, with services running 365 days per year with 10 trams per hour in each direction.
2.8.5 Revenue
Phase 1 indicative revenue was based on a single run of the CSTM3 model containing all routes except the North Edinburgh Loop, for which the results from previous work by the Andersen team were used. The model test provides a comparison of patronage on the public transport network in the test case and in the Do-Minimum reference case.
Revenues are calculated from distance-based fares consistent with bus fares used in CSTM3. All routes were included with services assumed as follows:
• South Suburban Line circular; • Queensferry to Danderhall via Princes Street; • Newbridge to Straiton via Princes Street; • Newcraighall to Braepark (orbital).

The City of Edinburgh Council Edinburgh LRT Masterplan Feasibility StudyFinal Report
C:\DOCUMENTS AND SETTINGS\CHRIS BAKER\LOCAL SETTINGS\TEMPORARY INTERNET FILES\OLK1D\0019REPORT-FINAL ISSUE.DOC REP/ FI
Page 32 Ove Arup & Partners International LtdFinal Issue 16 January 2003
The limitations of CSTM3 prevent easy identification of patronage on individual public transport routes except heavy rail. For the purposes of the Phase 1 appraisal, it was necessary to obtain a rapid general output of LRT patronage. Therefore, revenue by line was assessed using an apportioning of total light rail patronage on the following basis.
1. Light rail patronage on the full seven corridor network was forecast for 2011 using CSTM3; it comprises the net change in public transport patronage (T) for the Greater Edinburgh area compared to the base, the only change being light rail.
2. Population in the catchment of each light rail corridor (PC) was derived as a proportion of total Greater Edinburgh population (PE ) and used to allocate total tram patronage.
3. A factor for tram route length was derived to weight the average trip length (K) by trips on light rail preferred paths. (R = tram route length, AR = Average tram route length)
4. Revenue was obtained by applying the bus farescale of 40p/boarding + 30p/km derived from CSTM3 to the patronage by route and passenger kilometres. Daily revenue was converted to annual using an annualisation factor of 302 (250 working days plus 52 weekends, each representing one working day).
T * PCI/PE = Di (patronage for tram route I;)
Daily Revenue = [(K * R/AR) *DI* £0.3] + (DI* £0.4)
Annual Revenue = Daily Revenue x 302
The summary table below illustrates the indicative operating ratios and capital costs for the routes under consideration.
Table 2.2 Summary of Phase 1 Financial Projections for LRT Corridors Route Capital
Cost Operating
Cost Operating Revenue
Operating Ratio
West Edinburgh – Newbridge to Haymarket1 £165m £4.8m £6.0m 1.2 Queensferry – Dalmeny to Craigleith1 £144m £4.0m £2.5m 0.6 Queensferry to Newbridge Link £53m £1.7m £1.2m 0.7 South Edinburgh Orbital – Gilmerton to South Gyle £253m £7.2m £4.0m 0.6 South East Edinburgh (A7) – North Bridge to Danderhall
£123m £3.3m £4.1m 1.2
South Edinburgh (A701) – North Bridge to Straiton £104m £2.7m £2.6m 1.0 North Edinburgh Loop2 £192m £5.4m £10.2m 1.9 South Suburban Route £69m £5.9m £2.5m 0.4
1 Shared alignment with North Edinburgh Loop from this point. 2 Figures are those presented in the Andersens report “Feasibility for a North Edinburgh Rapid Transit
Solution” July 2001.

The City of Edinburgh Council Edinburgh LRT Masterplan Feasibility StudyFinal Report
C:\DOCUMENTS AND SETTINGS\CHRIS BAKER\LOCAL SETTINGS\TEMPORARY INTERNET FILES\OLK1D\0019REPORT-FINAL ISSUE.DOC REP/ FI
Page 33 Ove Arup & Partners International LtdFinal Issue 16 January 2003
Table 2.3 Appraisal Summary Table – Performance Against STAG Objectives – Scheme Option: North Edinburgh Loop Scheme Description: A circular tram service with some segregated alignment creating links between the Granton regeneration area, Princes Street and Leith Docks. Objective Qualitative impacts Assessment
Summary Supporting information
Transport Impact What transport issues will be addressed, how successful is the scheme option at achieving this.
+2 Meet regeneration objectives and support development, mitigate against the effects of development generated traffic. Improve accessibility to jobs and facilities.
Environmental Impact:
How will the option contribute towards reducing harmful emissions and promoting better air quality, particularly in response to the impacts of transport on the environment.
Local Air Quality +1 Reduced vehicle emissions will result through the transfer of car trips to tram. The impact on the local environment in the regenerated docks area will be small in relation to the effects of the regeneration project. Tram use should lead to an overall reduction in greenhouse gas emission.
Built Environment Resources
-1 The alignment on the former Roseburn railway bed is protected and currently used as a cycle path and linear park. There will be a visual impact on Princes Street, which is a World Heritage Site. Overhead power supply will require careful design and management to mitigate the perceived impact.
Natural Environmental Resources
0 Impacts on natural resources are likely to be negligible.
Safety How will the option enhance safety for different types of road user, are there any impacts on personal safety/security.
Accidents +1 Some accident savings resulting from the general reduction in traffic. There may be a short-term impact from accidents involving trams during the early months of operation in the city centre. The groups benefiting most from the gains would be pedestrians and cyclists.
Security +1 In general, greater reliability will improve the feeling of security and will bring larger passenger flows which themselves increase the comfort of passengers. This will have a particular effect in the regeneration area.
Economy: What will be the effect on traffic volumes, journey times and reliability for different modes of transport, will there be a significant de-congestion effect.
Journey Times +1 Mode shift to tram will reduce traffic volumes and could lead to improved car journey times through de-congestion, although this will be offset by integrating trams on-street. Journey times for the tram will generally be shorter than for bus, with a frequent and reliable service.
Reliability +2 Trams will be given priority at junctions and will provide a reliable link between the docks and the city centre
Economic Activity:
How might the option contribute to attracting new employment opportunities and stimulating development, particularly if accessible to areas of high unemployment.
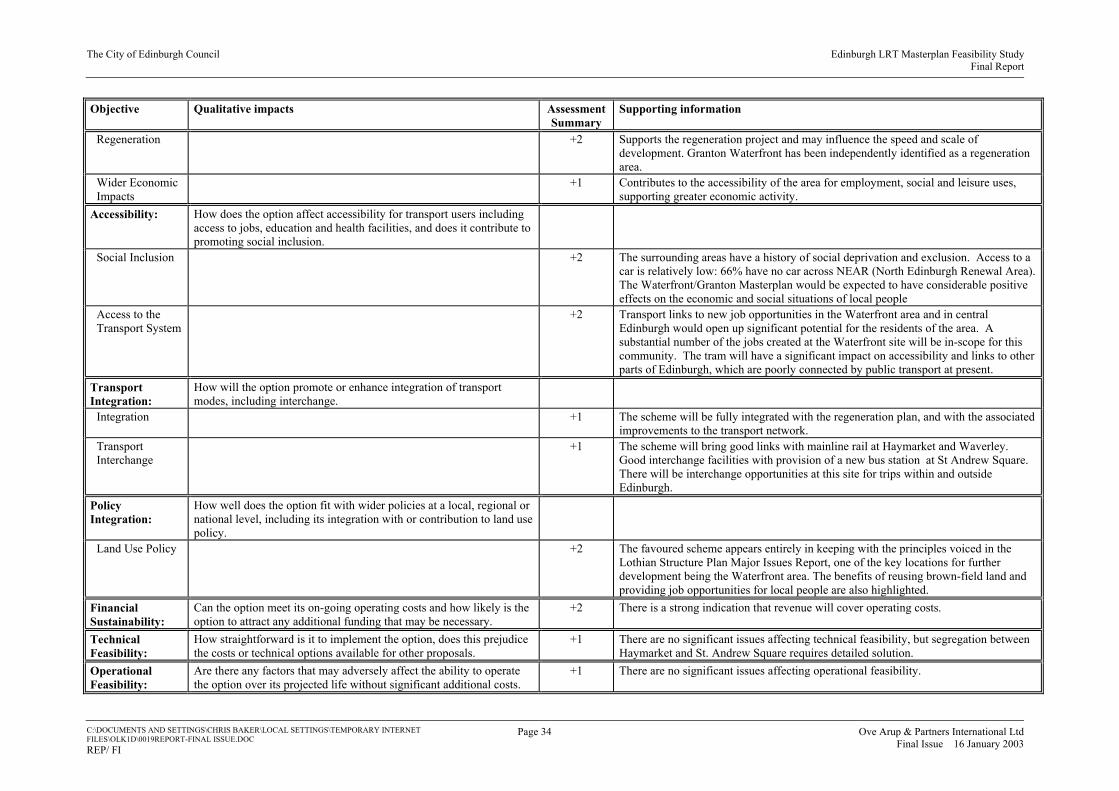
The City of Edinburgh Council Edinburgh LRT Masterplan Feasibility StudyFinal Report
C:\DOCUMENTS AND SETTINGS\CHRIS BAKER\LOCAL SETTINGS\TEMPORARY INTERNET FILES\OLK1D\0019REPORT-FINAL ISSUE.DOC REP/ FI
Page 34 Ove Arup & Partners International LtdFinal Issue 16 January 2003
Objective Qualitative impacts Assessment Summary
Supporting information
Regeneration +2 Supports the regeneration project and may influence the speed and scale of development. Granton Waterfront has been independently identified as a regeneration area.
Wider Economic Impacts
+1 Contributes to the accessibility of the area for employment, social and leisure uses, supporting greater economic activity.
Accessibility: How does the option affect accessibility for transport users including access to jobs, education and health facilities, and does it contribute to promoting social inclusion.
Social Inclusion +2 The surrounding areas have a history of social deprivation and exclusion. Access to a car is relatively low: 66% have no car across NEAR (North Edinburgh Renewal Area). The Waterfront/Granton Masterplan would be expected to have considerable positive effects on the economic and social situations of local people
Access to the Transport System
+2 Transport links to new job opportunities in the Waterfront area and in central Edinburgh would open up significant potential for the residents of the area. A substantial number of the jobs created at the Waterfront site will be in-scope for this community. The tram will have a significant impact on accessibility and links to other parts of Edinburgh, which are poorly connected by public transport at present.
Transport Integration:
How will the option promote or enhance integration of transport modes, including interchange.
Integration +1 The scheme will be fully integrated with the regeneration plan, and with the associated improvements to the transport network.
Transport Interchange
+1 The scheme will bring good links with mainline rail at Haymarket and Waverley. Good interchange facilities with provision of a new bus station at St Andrew Square. There will be interchange opportunities at this site for trips within and outside Edinburgh.
Policy Integration:
How well does the option fit with wider policies at a local, regional or national level, including its integration with or contribution to land use policy.
Land Use Policy +2 The favoured scheme appears entirely in keeping with the principles voiced in the Lothian Structure Plan Major Issues Report, one of the key locations for further development being the Waterfront area. The benefits of reusing brown-field land and providing job opportunities for local people are also highlighted.
Financial Sustainability:
Can the option meet its on-going operating costs and how likely is the option to attract any additional funding that may be necessary.
+2 There is a strong indication that revenue will cover operating costs.
Technical Feasibility:
How straightforward is it to implement the option, does this prejudice the costs or technical options available for other proposals.
+1 There are no significant issues affecting technical feasibility, but segregation between Haymarket and St. Andrew Square requires detailed solution.
Operational Feasibility:
Are there any factors that may adversely affect the ability to operate the option over its projected life without significant additional costs.
+1 There are no significant issues affecting operational feasibility.

The City of Edinburgh Council Edinburgh LRT Masterplan Feasibility StudyFinal Report
C:\DOCUMENTS AND SETTINGS\CHRIS BAKER\LOCAL SETTINGS\TEMPORARY INTERNET FILES\OLK1D\0019REPORT-FINAL ISSUE.DOC REP/ FI
Page 35 Ove Arup & Partners International LtdFinal Issue 16 January 2003
Table 2.4 Appraisal Summary Table – Performance Against STAG Objectives – Scheme Option: South Suburban Line Scheme Description: A circular tram service possibly sharing an existing railway alignment with freight, providing east-west links to Morningside, Craigmillar and Portobello. Objective Qualitative impacts Assessment
Summary Supporting information
Transport Impact What transport problems will be addressed, how successful is the scheme option at achieving this.
+1 Links a number of deprived communities using available infrastructure, supports and stimulates development opportunities. Improves accessibility to jobs and facilities.
Environmental Impact:
How will the option contribute towards reducing harmful emissions and promoting better air quality, particularly in response to the impacts of transport on the environment.
Local Air Quality +1 Low impact, as it will not significantly reduce traffic flow on radial routes. Local increase in public transport mode share for trips to developments along the route. No adverse impact on highway capacity.
Built Environment Resources
+1 Could make use of existing railway alignment, supporting some infrastructure improvements.
Natural Environmental Resources
0 No significant impact on the natural environment, water quality, drainage and flood defences.
Safety How will the option enhance safety for different types of road user, are there any impacts on personal safety/security.
Accidents +1 Small reduction in traffic accidents arising from a reduction in general traffic. (NB. little or no impact on radials.)
Security 0 Neutral impact on security, although the system will be designed with safety and security in mind, a fully segregated alignment will offset this.
Economy: What will be the effect on traffic volumes, journey times and reliability for different modes of transport, will there be a significant de-congestion effect.
Journey Times +1 May be a small positive impact on car journey times and de-congestion arising from mode shift to tram. Scheme provides some direct connections not currently served by bus, thereby improving journey times. It does not affect the main radial movements however.
Reliability -1 The high volume of freight trains using the railway will affect reliability. A street alignment would also have reliability problems.
Economic Activity:
How might the option contribute to attracting new employment opportunities and stimulating development, particularly if accessible to areas of high unemployment.
Regeneration +1 Significant development opportunities close to the line that could be facilitated by the new service.
Wider Economic Impacts
+1 Improves accessibility, especially for deprived areas such as Craigmillar, supporting greater economic activity and access to labour markets.

The City of Edinburgh Council Edinburgh LRT Masterplan Feasibility StudyFinal Report
C:\DOCUMENTS AND SETTINGS\CHRIS BAKER\LOCAL SETTINGS\TEMPORARY INTERNET FILES\OLK1D\0019REPORT-FINAL ISSUE.DOC REP/ FI
Page 36 Ove Arup & Partners International LtdFinal Issue 16 January 2003
Objective Qualitative impacts Assessment Summary
Supporting information
Accessibility: How does the option affect accessibility for transport users including access to jobs, education and health facilities, and does it contribute to promoting social inclusion.
Social Inclusion +1 The areas adjacent to the South Suburban railway line suffer from social deprivation and exclusion. The scheme provides opportunities associated with new and existing developments along the line but does not provide direct, fast access into the city centre or to the wider network.
Access to the Transport System
0 The tram will have a small impact on accessibility and provide links to other parts of Edinburgh south of the city centre that are not well linked by public transport.
Transport Integration:
How will the option promote or enhance integration of transport modes, including interchange.
Integration +1 If the scheme is on railway alignment, there would be little opportunity for integration with other modes other than with train services at Waverley and Haymarket. However, a light rail scheme on a different alignment would offer better integration with buses, although interchange with heavy rail at Waverley/Haymarket could be difficult.
Transport Interchange
+1 Interchange with main line train services will be provided, but this may not be seamless due to capacity and platform constraints at Waverley and Haymarket stations.
Policy Integration:
How well does the option fit with wider policies at a local, regional or national level, including its integration with or contribution to land use policy.
Land Use Policy +1 Supports development on brown field sites in accordance with local and national land use policy
Financial Sustainability:
Can the option meet its on-going operating costs and how likely is the option to attract any additional funding that may be necessary
-2 Private sector contributions to the implementation cost are an important element to funding. Unlikely to cover operating costs.
Technical Feasibility:
How straightforward is it to implement the option, does this prejudice the costs or technical options available for other proposals.
-2 Lack of capacity at Haymarket and Waverley railway stations make it difficult and expensive to implement. It would also be difficult to integrate with other tram lines. Costs for joint running with freight may also be a significant issue.
Operational Feasibility:
Are there any factors that may adversely affect the ability to operate the option over its projected life without significant additional costs.
-2 Provision of reliable paths for trams with existing and projected requirements for freight will be difficult and expensive.

The City of Edinburgh Council Edinburgh LRT Masterplan Feasibility StudyFinal Report
C:\DOCUMENTS AND SETTINGS\CHRIS BAKER\LOCAL SETTINGS\TEMPORARY INTERNET FILES\OLK1D\0019REPORT-FINAL ISSUE.DOC REP/ FI
Page 37 Ove Arup & Partners International LtdFinal Issue 16 January 2003
Table 2.5 Appraisal Summary Table – Performance Against STAG Objectives – Scheme Option: Queensferry Scheme Description: A radial tram route from the city centre parallel to the A90, linking Drylaw, Davidson’s Mains and Barnton with a segregated route to Dalmeny including opportunities for Park and Ride. Objective Qualitative impacts Assessment
Summary Supporting information
Transport Impact What transport problems will be addressed, how successful is the scheme option at achieving this.
+1 Would provide a reliable public transport service linking suburban communities along a congested radial corridor. Reduces the negative impacts of increased traffic flows and congestion.
Environmental Impact:
How will the option contribute towards reducing harmful emissions and promoting better air quality, particularly in response to the impacts of transport on the environment.
Local Air Quality +1 Improved air quality along the inner section of the corridor through mode switch from car. Localised queuing as a result of tram taking highway capacity may have a small negative impact.
Built Environment Resources
-1 Route along former railway alignment through Drylaw will require the relocation of the existing cycle track. City centre issues common with North Edinburgh would also apply.
Natural Environmental Resources
0 Alignment may affect area of mature woodland at Davidson’s Mains.
Safety How will the option enhance safety for different types of road user, are there any impacts on personal safety/security.
Accidents +1 General reduction in traffic should result in some accident savings, although additional queuing at major junctions may have a negative impact.
Security 0 In general, greater reliability will improve security for public transport users. Economy: What will be the effect on traffic volumes, journey times and
reliability for different modes of transport, will there be a significant de-congestion effect.
Journey Times +1 The high frequency service will give shorter public transport journey times allowing for waiting and interchange, although for some journeys this will not be a significant improvement over rail or bus. The impact on car journey times may be slightly negative due to greater delays at junctions.
Reliability +1 Tram priority will provide reliable journey times through on-street sections, allowing for the effects of congestion.
Economic Activity:
How might the option contribute to attracting new employment opportunities and stimulating development, particularly if accessible to areas of high unemployment.
Regeneration +1 May contribute to the re-development of Drylaw in association with the Waterfront development. No other major areas of regeneration affected.
Wider Economic Impacts
+1 Possible support to development opportunities along the A90 corridor.

The City of Edinburgh Council Edinburgh LRT Masterplan Feasibility StudyFinal Report
C:\DOCUMENTS AND SETTINGS\CHRIS BAKER\LOCAL SETTINGS\TEMPORARY INTERNET FILES\OLK1D\0019REPORT-FINAL ISSUE.DOC REP/ FI
Page 38 Ove Arup & Partners International LtdFinal Issue 16 January 2003
Objective Qualitative impacts Assessment Summary
Supporting information
Accessibility: How does the option affect accessibility for transport users including access to jobs, education and health facilities, and does it contribute to promoting social inclusion.
Social Inclusion +1 Impact on areas of North Edinburgh with low car ownership, increasing access to jobs and facilities, especially from Drylaw.
Access to the Transport System
+1 Small improvement in accessibility for communities along the corridor.
Transport Integration:
How will the option promote or enhance integration of transport modes, including interchange.
Integration +1 Fully integrated with the local rail network. Transport Interchange
+1 Integration with heavy rail services at Waverley, Haymarket and Dalmeny, opportunities for Park and Ride near Cramond Bridge.
Policy Integration:
How well does the option fit with wider policies at a local, regional or national level, including its integration with or contribution to land use policy.
Land Use Policy +1 Improves public transport services for communities to the north and west of Edinburgh, supporting projected increases in population and commuting to Edinburgh.
Financial Sustainability:
Can the option meet its on-going operating costs and how likely is the option to attract any additional funding that may be necessary
-2 Initial forecasts indicate that revenue support would be necessary to cover operating costs. Little development opportunity to encourage private sector funding.
Technical Feasibility:
How straightforward is it to implement the option, does this prejudice the costs or technical options available for other proposals.
-1 Technically very difficult to achieve an alignment through the Barnton area without a significant impact on major junctions or sensitive parts of the natural or built environment.
Operational Feasibility:
Are there any factors that may adversely affect the ability to operate the option over its projected life without significant additional costs.
+1 There are no issues affecting operational feasibility.

The City of Edinburgh Council Edinburgh LRT Masterplan Feasibility StudyFinal Report
C:\DOCUMENTS AND SETTINGS\CHRIS BAKER\LOCAL SETTINGS\TEMPORARY INTERNET FILES\OLK1D\0019REPORT-FINAL ISSUE.DOC REP/ FI
Page 39 Ove Arup & Partners International LtdFinal Issue 16 January 2003
Table 2.6 Appraisal Summary Table – Performance Against STAG Objectives – Scheme Option: West Edinburgh Scheme Description: A radial tram route from the city centre, initially parallel to the main railway line to Edinburgh Park then adjacent to the A8 from Gogar to Edinburgh Airport and Newbridge, with opportunities for Park and Ride and accessibility to development at Edinburgh Park and along the A8 corridor. Objective Qualitative impacts Assessment
Summary Supporting information
Transport Impact What transport problems will be addressed, how successful is the scheme option at achieving this.
+2 Relieving congestion that may be a barrier to development on a major radial corridor, providing access to key employment sites and supporting growth at Edinburgh Airport.
Environmental Impact:
How will the option contribute towards reducing harmful emissions and promoting better air quality, particularly in response to the impacts of transport on the environment.
Local Air Quality +2 Mode switch from car to tram could significantly reduce the environmental impacts of traffic in the corridor and at key locations. Improved public transport mode share for trips to Edinburgh Park, Gyle and Edinburgh Airport will also have localised impacts.
Built Environment Resources
-1 Route parallels the existing railway from Haymarket to Edinburgh Park with no impact on existing train operations. City centre issues common with North Edinburgh would apply.
Natural Environmental Resources
0 No significant impact on the natural environment, water quality, drainage and flood defences.
Safety How will the option enhance safety for different types of road user, are there any impacts on personal safety/security.
Accidents +1 Mode shift from car and reduction in vehicle kilometres will reduce traffic related accidents.
Security +1 Improved security for public transport from major developments such as Edinburgh Park and the RBOS site at Gogarburn.
Economy: What will be the effect on traffic volumes, journey times and reliability for different modes of transport, will there be a significant de-congestion effect.
Journey Times +2 Significant journey time benefits to and from important locations such as Edinburgh Airport, Edinburgh Park and The Gyle
Reliability +2 Segregated alignment should provide much better reliability. De-congestion will benefit all road users including bus passengers.
Economic Activity:
How might the option contribute to attracting new employment opportunities and stimulating development, particularly if accessible to areas of high unemployment.
Regeneration +2 Supports the West Edinburgh Planning Framework (WEPF) for development along the A8 and to secure expansion of existing sites while mitigating against the impacts of extra traffic. Supports Edinburgh Airport expansion and Surface Access Strategy.
Wider Economic Impacts
+2 Promotes employment opportunities outside of Edinburgh city centre where land values are higher and infrastructure constraints apply.

The City of Edinburgh Council Edinburgh LRT Masterplan Feasibility StudyFinal Report
C:\DOCUMENTS AND SETTINGS\CHRIS BAKER\LOCAL SETTINGS\TEMPORARY INTERNET FILES\OLK1D\0019REPORT-FINAL ISSUE.DOC REP/ FI
Page 40 Ove Arup & Partners International LtdFinal Issue 16 January 2003
Objective Qualitative impacts Assessment Summary
Supporting information
Accessibility: How does the option affect accessibility for transport users including access to jobs, education and health facilities, and does it contribute to promoting social inclusion.
Social Inclusion +2 Increased access to jobs and facilities outside Edinburgh city centre and improved public transport provision for communities in West Edinburgh, such as Bramhall.
Access to the Transport System
+1 Increased reliability along this important corridor will improve access to other parts of the transport system.
Transport Integration:
How will the option promote or enhance integration of transport modes, including interchange.
Integration +1 Fully integrated with land use planning and transport provision in the A8 corridor and consistent with the WEPF.
Transport Interchange
+2 Interchange opportunities with rail at Edinburgh Park, Haymarket and Waverley, with bus at suburban and central interchange points and serves Edinburgh Airport. Opportunities for Park and Ride close to the regional motorway network.
Policy Integration:
How well does the option fit with wider policies at a local, regional or national level, including its integration with or contribution to land use policy.
Land Use Policy +1 Supportive of WEPF and the projected increase in population in West Lothian and Fife that would commute to Edinburgh. Park and Ride would be in green belt.
Financial Sustainability:
Can the option meet its on-going operating costs and how likely is the option to attract any additional funding that may be necessary
+2 Opportunity for developer contributions to capital costs. Cost of alignment can be partly offset through use of WEBS. Cost of spur to Hermiston prohibitive due to crossing of Edinburgh Bypass, Union Canal and A71. Revenues are likely to cover operating costs.
Technical Feasibility:
How straightforward is it to implement the option, does this prejudice the costs or technical options available for other proposals.
+1 CAA stipulations will impact on available alignments but this only affects route choice.
Operational Feasibility:
Are there any factors that may adversely affect the ability to operate the option over its projected life without significant additional costs.
+1 No operational impacts identified.

The City of Edinburgh Council Edinburgh LRT Masterplan Feasibility StudyFinal Report
C:\DOCUMENTS AND SETTINGS\CHRIS BAKER\LOCAL SETTINGS\TEMPORARY INTERNET FILES\OLK1D\0019REPORT-FINAL ISSUE.DOC REP/ FI
Page 41 Ove Arup & Partners International LtdFinal Issue 16 January 2003
Table 2.7 Appraisal Summary Table – Performance Against STAG Objectives – Scheme Option: South East Edinburgh Scheme Description: A radial route from the city centre passing the Old Town and Canongate areas and following the A7 via Cameron Toll to the new Royal Infirmary and providing access to the Shawfair development site and offering Park and Ride opportunities. Objective Qualitative impacts Assessment
Summary Supporting information
Transport Impact What transport problems will be addressed, how successful is the scheme option at achieving this.
+2 Would provide accessible transport to major developments including the New Royal Infirmary, improved traffic conditions on a key radial roads and mitigate against the effects of development traffic.
Environmental Impact:
How will the option contribute towards reducing harmful emissions and promoting better air quality, particularly in response to the impacts of transport on the environment.
Local Air Quality +1 Reduced impact from road traffic through mode shift, particularly through the sensitive Old Town area.
Built Environment Resources
-1 Visual impact of overhead line equipment in Old Town and Princes Street areas.
Natural Environmental Resources
0 Impacts on natural resources are likely to be negligible
Safety How will the option enhance safety for different types of road user, are there any impacts on personal safety/security.
Accidents +1 Mode shift from car and reduction in vehicle kilometres will reduce traffic related accidents.
Security +1 Reliable service will increase level of security, particularly in the evenings and for shift workers at the hospital.
Economy: What will be the effect on traffic volumes, journey times and reliability for different modes of transport, will there be a significant de-congestion effect.
Journey Times +1 Faster public transport journey times to the city centre, improving access from other parts of the city through interchange.
Reliability +1 Reliable access from the city centre to the hospital and other developments. Economic Activity:
How might the option contribute to attracting new employment opportunities and stimulating development, particularly if accessible to areas of high unemployment.
Regeneration +2 Fits with the Royal Infirmary development plan and supports other developments including the Shawfair community and other sites along the A7.
Wider Economic Impacts
+1 Possible links to other transport proposals supporting the wider community and economy in Midlothian and East Lothian.
Accessibility: How does the option affect accessibility for transport users including access to jobs, education and health facilities, and does it contribute to promoting social inclusion.
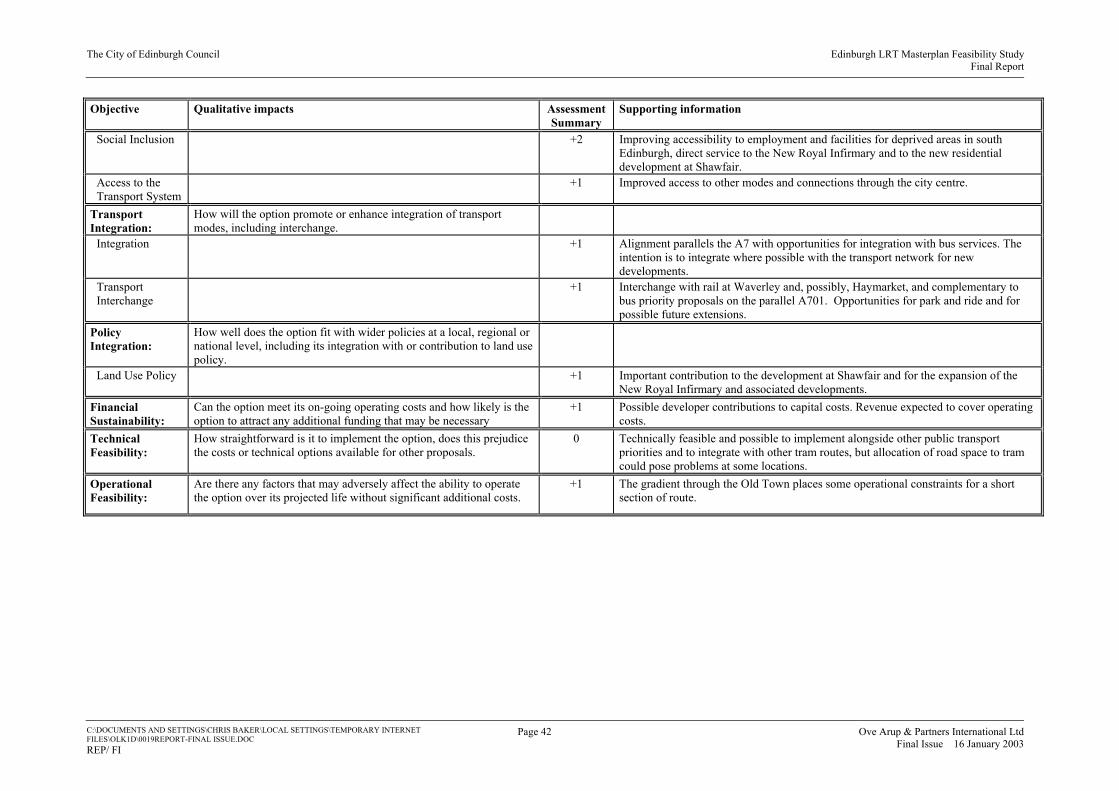
The City of Edinburgh Council Edinburgh LRT Masterplan Feasibility StudyFinal Report
C:\DOCUMENTS AND SETTINGS\CHRIS BAKER\LOCAL SETTINGS\TEMPORARY INTERNET FILES\OLK1D\0019REPORT-FINAL ISSUE.DOC REP/ FI
Page 42 Ove Arup & Partners International LtdFinal Issue 16 January 2003
Objective Qualitative impacts Assessment Summary
Supporting information
Social Inclusion +2 Improving accessibility to employment and facilities for deprived areas in south Edinburgh, direct service to the New Royal Infirmary and to the new residential development at Shawfair.
Access to the Transport System
+1 Improved access to other modes and connections through the city centre.
Transport Integration:
How will the option promote or enhance integration of transport modes, including interchange.
Integration +1 Alignment parallels the A7 with opportunities for integration with bus services. The intention is to integrate where possible with the transport network for new developments.
Transport Interchange
+1 Interchange with rail at Waverley and, possibly, Haymarket, and complementary to bus priority proposals on the parallel A701. Opportunities for park and ride and for possible future extensions.
Policy Integration:
How well does the option fit with wider policies at a local, regional or national level, including its integration with or contribution to land use policy.
Land Use Policy +1 Important contribution to the development at Shawfair and for the expansion of the New Royal Infirmary and associated developments.
Financial Sustainability:
Can the option meet its on-going operating costs and how likely is the option to attract any additional funding that may be necessary
+1 Possible developer contributions to capital costs. Revenue expected to cover operating costs.
Technical Feasibility:
How straightforward is it to implement the option, does this prejudice the costs or technical options available for other proposals.
0 Technically feasible and possible to implement alongside other public transport priorities and to integrate with other tram routes, but allocation of road space to tram could pose problems at some locations.
Operational Feasibility:
Are there any factors that may adversely affect the ability to operate the option over its projected life without significant additional costs.
+1 The gradient through the Old Town places some operational constraints for a short section of route.
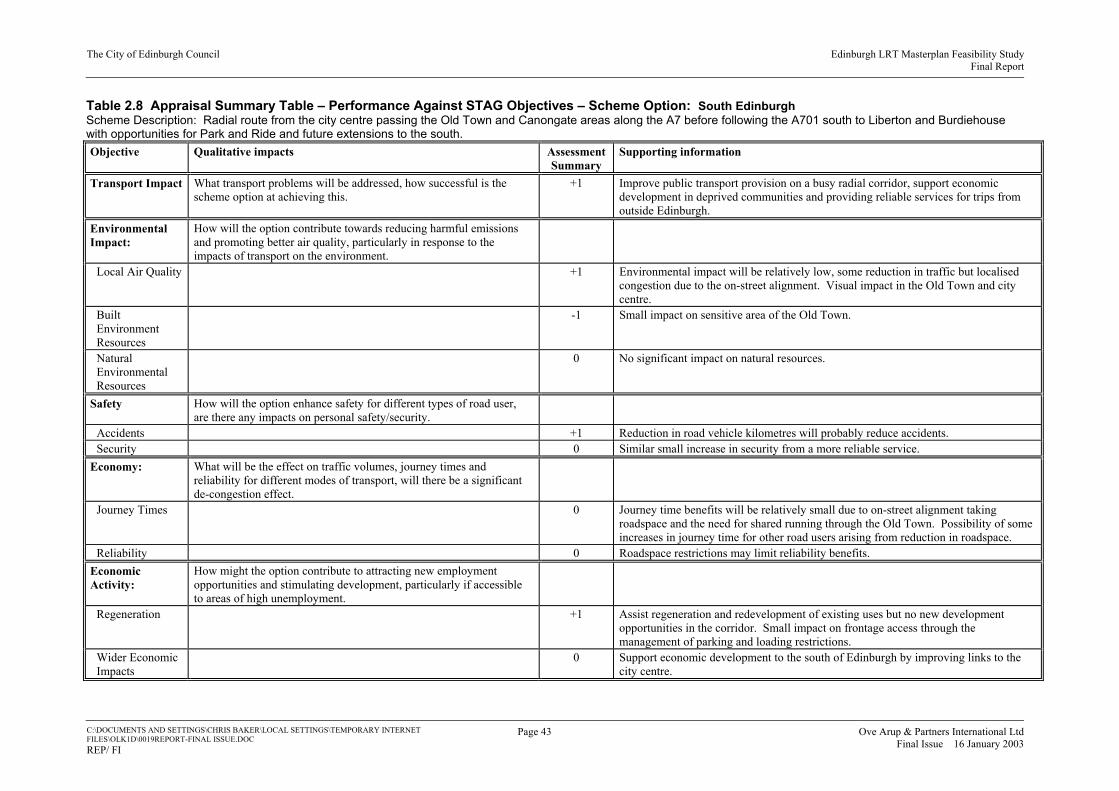
The City of Edinburgh Council Edinburgh LRT Masterplan Feasibility StudyFinal Report
C:\DOCUMENTS AND SETTINGS\CHRIS BAKER\LOCAL SETTINGS\TEMPORARY INTERNET FILES\OLK1D\0019REPORT-FINAL ISSUE.DOC REP/ FI
Page 43 Ove Arup & Partners International LtdFinal Issue 16 January 2003
Table 2.8 Appraisal Summary Table – Performance Against STAG Objectives – Scheme Option: South Edinburgh Scheme Description: Radial route from the city centre passing the Old Town and Canongate areas along the A7 before following the A701 south to Liberton and Burdiehouse with opportunities for Park and Ride and future extensions to the south. Objective Qualitative impacts Assessment
Summary Supporting information
Transport Impact What transport problems will be addressed, how successful is the scheme option at achieving this.
+1 Improve public transport provision on a busy radial corridor, support economic development in deprived communities and providing reliable services for trips from outside Edinburgh.
Environmental Impact:
How will the option contribute towards reducing harmful emissions and promoting better air quality, particularly in response to the impacts of transport on the environment.
Local Air Quality +1 Environmental impact will be relatively low, some reduction in traffic but localised congestion due to the on-street alignment. Visual impact in the Old Town and city centre.
Built Environment Resources
-1 Small impact on sensitive area of the Old Town.
Natural Environmental Resources
0 No significant impact on natural resources.
Safety How will the option enhance safety for different types of road user, are there any impacts on personal safety/security.
Accidents +1 Reduction in road vehicle kilometres will probably reduce accidents. Security 0 Similar small increase in security from a more reliable service.
Economy: What will be the effect on traffic volumes, journey times and reliability for different modes of transport, will there be a significant de-congestion effect.
Journey Times 0 Journey time benefits will be relatively small due to on-street alignment taking roadspace and the need for shared running through the Old Town. Possibility of some increases in journey time for other road users arising from reduction in roadspace.
Reliability 0 Roadspace restrictions may limit reliability benefits. Economic Activity:
How might the option contribute to attracting new employment opportunities and stimulating development, particularly if accessible to areas of high unemployment.
Regeneration +1 Assist regeneration and redevelopment of existing uses but no new development opportunities in the corridor. Small impact on frontage access through the management of parking and loading restrictions.
Wider Economic Impacts
0 Support economic development to the south of Edinburgh by improving links to the city centre.

The City of Edinburgh Council Edinburgh LRT Masterplan Feasibility StudyFinal Report
C:\DOCUMENTS AND SETTINGS\CHRIS BAKER\LOCAL SETTINGS\TEMPORARY INTERNET FILES\OLK1D\0019REPORT-FINAL ISSUE.DOC REP/ FI
Page 44 Ove Arup & Partners International LtdFinal Issue 16 January 2003
Objective Qualitative impacts Assessment Summary
Supporting information
Accessibility: How does the option affect accessibility for transport users including access to jobs, education and health facilities, and does it contribute to promoting social inclusion.
Social Inclusion +1 Route serves a number of areas of deprivation, thereby providing improved access to jobs and facilities.
Access to the Transport System
+1 The tram will provide a fully accessible mode with direct connections to other parts of the transport network, thereby improving mobility.
Transport Integration:
How will the option promote or enhance integration of transport modes, including interchange.
Integration 0 The tram route would not be compatible with the proposed bus priority measures on the corridor but would integrate well with existing development and services.
Transport Interchange
+1 Interchange with bus and rail in the centre of Edinburgh and possibly through Park and Ride at Burdiehouse.
Policy Integration:
How well does the option fit with wider policies at a local, regional or national level, including its integration with or contribution to land use policy.
Land Use Policy +1 Support to future developments in Midlothian identified in the Structure Plan. Financial Sustainability:
Can the option meet its on-going operating costs and how likely is the option to attract any additional funding that may be necessary
-1 Revenues may just cover operating costs with support from Park and Ride but there would be some revenue risk due to possible journey time and reliability issues from street running.
Technical Feasibility:
How straightforward is it to implement the option, does this prejudice the costs or technical options available for other proposals.
0 Issues relating to the use of North Bridge and South Bridge and with a suitable terminus or connection point in the city centre, but could use Pleasance/Dalkeith Road route as alternative.
Operational Feasibility:
Are there any factors that may adversely affect the ability to operate the option over its projected life without significant additional costs.
0 Possible threat of obstruction subject to traffic management measures affecting parking and loading, particularly on A701 north of Nether Liberton.

The City of Edinburgh Council Edinburgh LRT Masterplan Feasibility StudyFinal Report
C:\DOCUMENTS AND SETTINGS\CHRIS BAKER\LOCAL SETTINGS\TEMPORARY INTERNET FILES\OLK1D\0019REPORT-FINAL ISSUE.DOC REP/ FI
Page 45 Ove Arup & Partners International LtdFinal Issue 16 January 2003
Table 2.9 Appraisal Summary Table – Performance Against STAG Objectives – Scheme Option: Southern Orbital Route Scheme Description: Orbital tram route linking communities along the southern edge of Edinburgh, including Niddrie, Gilmerton, Fairmilehead and Wester Hailes with Edinburgh Park and The Gyle. Objective Qualitative impacts Assessment
Summary Supporting information
Transport Impact What transport problems will be addressed, how successful is the scheme option at achieving this.
0 Linking deprived communities and providing connections to employment outside Edinburgh city centre.
Environmental Impact:
How will the option contribute towards reducing harmful emissions and promoting better air quality, particularly in response to the impacts of transport on the environment.
Local Air Quality 0 Small environmental impact but does not significantly affect congested radial routes. Built Environment Resources
0 No significant impact on built environment.
Natural Environmental Resources
0 No significant impact on natural resources.
Safety How will the option enhance safety for different types of road user, are there any impacts on personal safety/security.
Accidents 0 Proposal is not expected to significantly reduce road traffic accidents and may cause some conflicts with traffic on radial routes.
Security +1 Improved security for public transport trips particularly affecting those that do not require access to the city centre and are not heavily patronised.
Economy: What will be the effect on traffic volumes, journey times and reliability for different modes of transport, will there be a significant de-congestion effect.
Journey Times 0 Journey times on the Edinburgh Bypass will compete with tram and some impact on radial corridors may result from the tram crossing main flows.
Reliability 0 Reliability may be affected by delays at major radials or localised congestion may result.
Economic Activity:
How might the option contribute to attracting new employment opportunities and stimulating development, particularly if accessible to areas of high unemployment.
Regeneration +1 Support to major developments, particularly in the south east of Edinburgh, and in providing access for labour markets from deprived areas.
Wider Economic Impacts
+1 Provides an important link between new residential development at Shawfair with employment sites and other facilities in West Edinburgh.
Accessibility: How does the option affect accessibility for transport users including access to jobs, education and health facilities, and does it contribute to promoting social inclusion.

The City of Edinburgh Council Edinburgh LRT Masterplan Feasibility StudyFinal Report
C:\DOCUMENTS AND SETTINGS\CHRIS BAKER\LOCAL SETTINGS\TEMPORARY INTERNET FILES\OLK1D\0019REPORT-FINAL ISSUE.DOC REP/ FI
Page 46 Ove Arup & Partners International LtdFinal Issue 16 January 2003
Objective Qualitative impacts Assessment Summary
Supporting information
Social Inclusion +2 Improved accessibility to Edinburgh Park, Gyle and New Royal Infirmary from the main residential areas to the south of the city, and from developments at Shawfair and Craigmillar.
Access to the Transport System
+1 Provides a new frequent public transport service not currently provided and improves access to the transport system for important future markets.
Transport Integration:
How will the option promote or enhance integration of transport modes, including interchange.
Integration +1 Opportunity to feed other services on radial routes and to integrate with key interchange points, including park and ride.
Transport Interchange
+1 Interchange with rail at Edinburgh Park and Newcraighall and with bus routes on radial corridors, as well as opportunities for Park and Ride.
Policy Integration:
How well does the option fit with wider policies at a local, regional or national level, including its integration with or contribution to land use policy.
Land Use Policy +1 Improves access for labour markets to new developments supporting local plans and land use proposals.
Financial Sustainability:
Can the option meet its on-going operating costs and how likely is the option to attract any additional funding that may be necessary
-2 Unlikely to be financially viable as a frequent tram service. Also a high cost scheme because of its length.
Technical Feasibility:
How straightforward is it to implement the option, does this prejudice the costs or technical options available for other proposals.
-1 Issue of allocation of road space throughout, if a degree of segregation is to be achieved.
Operational Feasibility:
Are there any factors that may adversely affect the ability to operate the option over its projected life without significant additional costs.
-1 Crosses all major southern radial routes – therefore, difficult to provide reliable service without impact on all these radials.

The City of Edinburgh Council Edinburgh LRT Masterplan Feasibility StudyFinal Report
C:\DOCUMENTS AND SETTINGS\CHRIS BAKER\LOCAL SETTINGS\TEMPORARY INTERNET FILES\OLK1D\0019REPORT-FINAL ISSUE.DOC REP/ FI
Page 47 Ove Arup & Partners International LtdFinal Issue 16 January 2003
2.9 Phase 1 Findings
2.9.1 AST Comparison
The assessment summary scores with ASTs are summarised in Table 2.10, which gives them for each LRT corridor. This permits direct ranking based on unweighted score totals. The best performing schemes are West Edinburgh, North Edinburgh and South East Edinburgh with Queensferry ranked fourth but with a significantly lower score. The scores show South Suburban as the weakest performer.
Although no weights were introduced in the ranking, it is clear that LRT schemes that are unlikely to cover their operating costs are weak candidates for further consideration. The STAG 1 assessment indicates that four of the schemes: South Suburban, Queensferry, South Edinburgh and Southern Orbital are unlikely to be viable as LRT schemes. However, the performance of Queensferry and South Edinburgh could be improved. The Queensferry line need not extend beyond the contiguous built up area of Edinburgh to reduce its costs and improve performance, the South Edinburgh Line might perform better as a branch of the South East Edinburgh Line.
2.9.2 Performance against Local Objectives
The main part of the Phase 1 appraisal focuses on all five of the central government objectives as set out in the STAG. In addition to this assessment, we considered the performance of each route in terms of the City of Edinburgh Council’s Local Transport Strategy (LTS) objectives in relation to the Integrated Transport Investment Package. The LTS details the Council’s policies and proposals for transport in and around Edinburgh. The objectives common to the LTS and to the ITI follow a major public consultation programme. The four LTS objectives adopted by City of Edinburgh Council are stated at the start of the Appraisal section above.
Accessibility Objective
The measure of accessibility is most directly applied to those where transport choice is restricted, either in terms of access to geographical areas or access to modes. This then focuses on the population that do not have a car available for their journey. A new public transport service may provide access to communities where none previously existed or, more usually, provide greater choice of mode or destination, including to employment or other facilities.
Each of the routes considered provide greater choice but do not offer wholly new public transport provision because the urban bus network already caters for many of the journeys. The greatest benefit, therefore, is derived from providing better or more direct access to areas already served by public transport.
All routes perform well in terms of accessibility, with North Edinburgh, West Edinburgh, South East Edinburgh and Southern Orbital all promoting social inclusion by offering direct access between existing or new residential communities and employment centres and other facilities. In particular this includes those opportunities outside the city centre, for example at Edinburgh Park, Edinburgh Waterfront and the New Royal Infirmary. These routes also access communities where average income is low. Although the South Suburban line provides access between socially or economically deprived communities and potential developments, the accessibility is not as high as the route is largely segregated and grade separated, requiring additional infrastructure to ensure full accessibility for mobility impaired people.
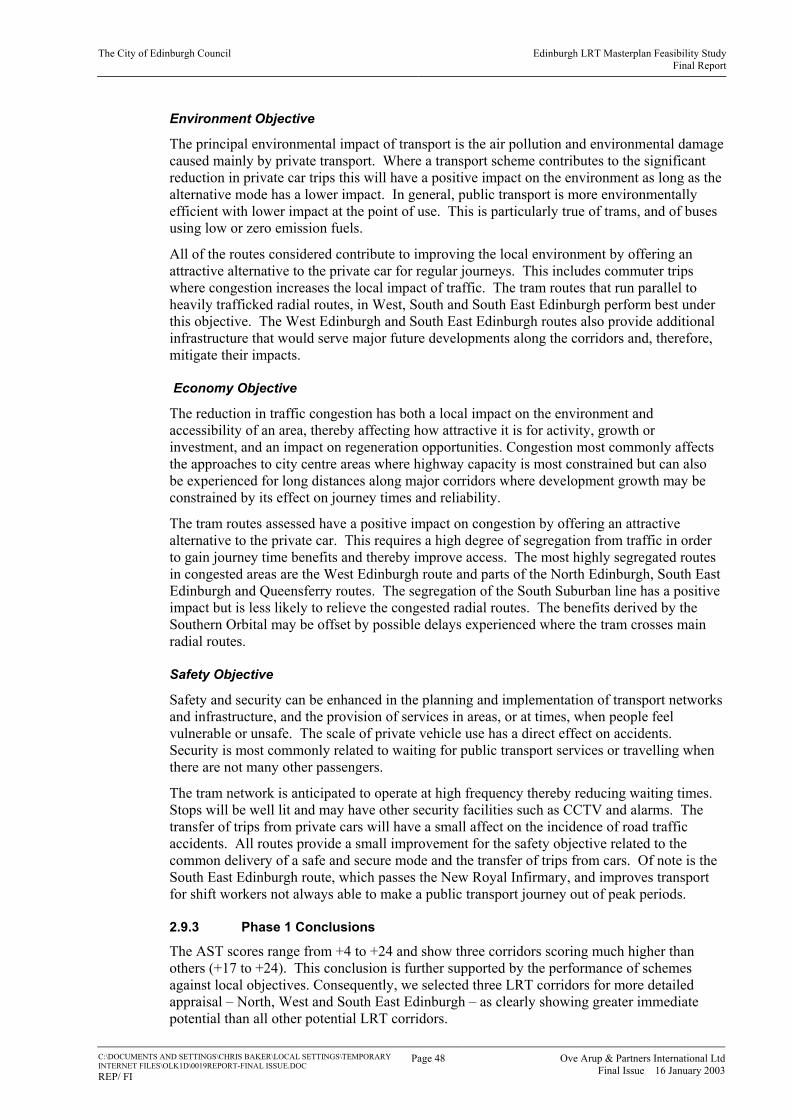
The City of Edinburgh Council Edinburgh LRT Masterplan Feasibility StudyFinal Report
C:\DOCUMENTS AND SETTINGS\CHRIS BAKER\LOCAL SETTINGS\TEMPORARY INTERNET FILES\OLK1D\0019REPORT-FINAL ISSUE.DOC REP/ FI
Page 48 Ove Arup & Partners International LtdFinal Issue 16 January 2003
Environment Objective
The principal environmental impact of transport is the air pollution and environmental damage caused mainly by private transport. Where a transport scheme contributes to the significant reduction in private car trips this will have a positive impact on the environment as long as the alternative mode has a lower impact. In general, public transport is more environmentally efficient with lower impact at the point of use. This is particularly true of trams, and of buses using low or zero emission fuels.
All of the routes considered contribute to improving the local environment by offering an attractive alternative to the private car for regular journeys. This includes commuter trips where congestion increases the local impact of traffic. The tram routes that run parallel to heavily trafficked radial routes, in West, South and South East Edinburgh perform best under this objective. The West Edinburgh and South East Edinburgh routes also provide additional infrastructure that would serve major future developments along the corridors and, therefore, mitigate their impacts.
Economy Objective
The reduction in traffic congestion has both a local impact on the environment and accessibility of an area, thereby affecting how attractive it is for activity, growth or investment, and an impact on regeneration opportunities. Congestion most commonly affects the approaches to city centre areas where highway capacity is most constrained but can also be experienced for long distances along major corridors where development growth may be constrained by its effect on journey times and reliability.
The tram routes assessed have a positive impact on congestion by offering an attractive alternative to the private car. This requires a high degree of segregation from traffic in order to gain journey time benefits and thereby improve access. The most highly segregated routes in congested areas are the West Edinburgh route and parts of the North Edinburgh, South East Edinburgh and Queensferry routes. The segregation of the South Suburban line has a positive impact but is less likely to relieve the congested radial routes. The benefits derived by the Southern Orbital may be offset by possible delays experienced where the tram crosses main radial routes.
Safety Objective
Safety and security can be enhanced in the planning and implementation of transport networks and infrastructure, and the provision of services in areas, or at times, when people feel vulnerable or unsafe. The scale of private vehicle use has a direct effect on accidents. Security is most commonly related to waiting for public transport services or travelling when there are not many other passengers.
The tram network is anticipated to operate at high frequency thereby reducing waiting times. Stops will be well lit and may have other security facilities such as CCTV and alarms. The transfer of trips from private cars will have a small affect on the incidence of road traffic accidents. All routes provide a small improvement for the safety objective related to the common delivery of a safe and secure mode and the transfer of trips from cars. Of note is the South East Edinburgh route, which passes the New Royal Infirmary, and improves transport for shift workers not always able to make a public transport journey out of peak periods.
2.9.3 Phase 1 Conclusions
The AST scores range from +4 to +24 and show three corridors scoring much higher than others (+17 to +24). This conclusion is further supported by the performance of schemes against local objectives. Consequently, we selected three LRT corridors for more detailed appraisal – North, West and South East Edinburgh – as clearly showing greater immediate potential than all other potential LRT corridors.

The City of Edinburgh Council Edinburgh LRT Masterplan Feasibility StudyFinal Report
C:\DOCUMENTS AND SETTINGS\CHRIS BAKER\LOCAL SETTINGS\TEMPORARY INTERNET FILES\OLK1D\0019REPORT-FINAL ISSUE.DOC REP/ FI
Page 49 Ove Arup & Partners International LtdFinal Issue 16 January 2003
Table 2.10 Summary Of Phase 1 Appraisal –Assessment Summary Scores North
Edinburgh South Suburban Queensferry West Edinburgh South East Edinburgh
South Edinburgh
Southern Orbital
Transport Impact +2 +1 +1 +2 +2 +1 0 Environmental Impact Local Air Quality +1 +1 +1 +2 +1 +1 0 Built Environment Resources -1 +1 -1 -1 -1 -1 0 Natural Environmental Resources 0 0 0 0 0 0 0 Safety Accidents +1 +1 +1 +1 +1 +1 0 Security +1 0 0 +1 +1 0 +1 Economy Journey Times +1 +1 +1 +2 +1 0 0 Reliability +2 -1 +1 +2 +1 0 0 Economic Activity Regeneration +2 +1 +1 +2 +2 +1 +1 Wider Economic Impacts +1 +1 +1 +2 +1 0 +1 Accessibility Social Inclusion +2 +1 +1 +2 +2 +1 +2 Access to the Transport System +2 0 +1 +1 +1 +1 +1 Transport Integration Integration +1 +1 +1 +1 +1 0 +1 Transport Interchange +1 +1 +1 +2 +1 +1 +1 Policy Integration Land Use Policy +2 +1 +1 +1 +1 +1 +1 Financial Sustainability +2 -2 -2 +2 +1 -1 -2 Technical Feasibility +1 -2 -1 +1 0 0 -1 Operational Feasibility +1 -2 +1 +1 +1 0 -1 TOTAL +22 +4 +9 +24 +17 +6 +5 RANK 2 7 4 1 3 5 6

The City of Edinburgh Council Edinburgh LRT Masterplan Feasibility StudyFinal Report
C:\DOCUMENTS AND SETTINGS\CHRIS BAKER\LOCAL SETTINGS\TEMPORARY INTERNET FILES\OLK1D\0019REPORT-FINAL ISSUE.DOC REP/FI
Page 50 Ove Arup & Partners International LtdFinal Issue 16 January 2003
3. APPROACH TO PHASE 2
3.1 Introduction The aim for the Phase 2 appraisal was to review the preferred tram routes recommended as best performers in Phase 1 and to assess them in greater detail. This necessitated the resolution of alignment issues to define them in sufficient detail for more reliable cost assessment, and to forecast patronage as a basis for revenue and benefit projections.
The definition of alignments involved the mapping of environmental constraints, the identification of stop locations having regard to topography and other layout considerations, and based on the need to serve fruitful catchment areas and travel objectives. Having defined alignments and stops it was then possible to assess the likely run time for trams to provide a basis for fleet size calculation and the competitiveness of trams with other modes.
3.2 Technical Issues and Costs
3.2.1 Alignment Definition
Alignment design criteria will need to be developed in the detailed design of Edinburgh light rail. The following indicate criteria typical of light rail/tram networks and were adopted for this study:
• absolute minimum horizontal radius 25m, but radii should be maximised as far as possible so that speed of operation is maximised;
• minimum vertical radius for slab track 250m;
• minimum vertical radius for ballasted track 400m;
• desirable maximum gradient 6%;
• absolute maximum gradient 10%.
These criteria were used in planning the tram alignments in sufficient detail to resolve feasibility issues and to identify costs at a greater level of accuracy than in the Phase 1 appraisal. More detailed assumptions about infrastructure were also made as set out below.
3.2.2 Trackwork
The trackwork for the network will be predominantly either:
• Conventional ballasted track on the segregated sections of the line, using flat-bottom rail on precast concrete sleepers. Either “mono-block” or “duo-block” sleepers would be used – depending on the Contractor’s choice of his most economic supplier, with rails inclined at 1:40 rather than the standard heavy rail inclination of 1:20.
• For street sections, grooved tramway rail set vertically and embedded in a coating of elastomer to provide electrical isolation from the road material. This is necessary because the running rails form the return path back to the substations for the 750V dc power for the trams. Additional stray-current collection measures are also needed.
Sketches of the above track-forms are shown in Appendix D.
For particularly environmentally sensitive areas additional types of track may be needed, such as one that maximises the amount of grass either side of the rails (see sketch details in Appendix D), or additional noise attenuation measures such as booted sleepers or floating track slab. These issues will need to be evaluated in the next stage of the design.

The City of Edinburgh Council Edinburgh LRT Masterplan Feasibility StudyFinal Report
C:\DOCUMENTS AND SETTINGS\CHRIS BAKER\LOCAL SETTINGS\TEMPORARY INTERNET FILES\OLK1D\0019REPORT-FINAL ISSUE.DOC REP/FI
Page 51 Ove Arup & Partners International LtdFinal Issue 16 January 2003
The lighter axle loads on a LRT system (say 10T) will permit substantially reduced rail sections to be used compared to those on heavy rail systems. Typical light rail sections are:
• SEI 35G for grooved-rail on-street sections;
• BS70 for flat-bottomed rail on ballasted track.
3.2.3 Traction Power/Overhead Line Equipment (OHLE)
Traction Power will be supplied from sub-stations every 2 to 3 kilometres along the route where 11/22Kv ac power input will be transformed and rectified down to 750v dc. This 750v dc supply is fed to the overhead line at each sub-station, with the OHLE double-insulated – eliminating the need for any earthing of the trackside OHLE equipment except at Traction Feed Poles.
On sections limited to traffic speed limit of ‘30mph’ (48/50kph) the OHLE will be installed as Fixed Termination Trolley Wire, thus eliminating the need for tensioning gear and permitting the use of light-weight OHLE equipment that is less visually intrusive than other systems. Wherever possible, building fixings will be used for street sections to minimise the amount of street furniture. A cross section of typical LRT street running is included in Appendix D.
The return path to the sub-stations for the 750v DC traction current for the trams is via the running rails. Consequently, extensive measures are needed prevent stray currents arising and causing severe corrosion problems for Statutory Undertakers’ pipes and cables and problems for Railtrack Signalling. Amongst the measures needed are:
• preparation of a Stray Current Code of Practice to regulate the permitted level of stray currents;
• detailed monitoring of actual stray currents before and after the tramway is energised and operated;
• effective electrical insulation of the running rails; in paved areas by means of embedment in an elastomer, and on ballasted track by use of insulators;
• incorporation of stray current mats and a stray current collector in the reinforced concrete slabs below paved track;
• ensuring that all ancillary metalwork near the tracks is either insulated from the rails or is itself insulated from all other works.
Recent experience on other UK Light Rail Systems has demonstrated how critical this issue is, and the need for high levels of quality control to achieve the required standard.
3.2.4 Signalling
We assume that driving of trams will be on line-of-sight, thus no conventional railway signalling is needed for the safe operation of the trams. Nevertheless, some signalling may be used for vehicle location, operation of crossovers and maintaining higher vehicle speeds in areas of limited visibility. The principal elements of railway-type signalling that are assumed include:
• track-circuits at discrete points along the route (probably adjacent to the trams stops) to provide information on position reporting of trams;
• interlocking at cross-overs and junctions between lines;
• interlocking on any sections of single track and signalling / track circuits in areas of poor visibility to improve permitted operating speeds.
The City of Edinburgh Council Edinburgh LRT Masterplan Feasibility StudyFinal Report
C:\DOCUMENTS AND SETTINGS\CHRIS BAKER\LOCAL SETTINGS\TEMPORARY INTERNET FILES\OLK1D\0019REPORT-FINAL ISSUE.DOC REP/FI
Page 52 Ove Arup & Partners International LtdFinal Issue 16 January 2003
When running on-street, special highway signalling is installed to control the operation for the trams using similar technology to that of conventional traffic signal systems. All of the tramway information at a junction is processed to a tramway controller located adjacent to the traffic signalling controller, and these are linked together.
3.2.5 Communications
Extensive communications will be needed using a fibroptic network and a radio system. The fibroptic network will include some or all of the following:-
• signalling;
• data links to the ticket vending machines;
• voice communications to/from tram stops;
• links to passenger information displays;
• links to emergency call points;
• telephones;
• links to traction substations;
• CCTV.
A high integrity radio system will be required to maintain communications links with trams and staff at all points on the system. To maintain flexibility, especially in times of emergency, two (or probably three) channels will be needed. Subsidiary transmitters will probably be needed to maintain full coverage over the entire network.
3.2.6 Tram Stops
The tram stops are assumed to have low platforms compatible with the treadplate height of the trams, with the surface approximately 350mm above road surface. Ramps will be provided at each end of the platforms to ensure easy access for the mobility impaired. The ramps would normally be at 1:20 but, on roads with a steep gradient, up to 1:12 may be necessary. Plans showing general arrangements for tram stops are in Appendix D.
The range of facilities at the tram stops will need to be resolved in due course, but it is likely to include:
• canopy/shelter;
• ticket vending machines;
• seating;
• electronic passenger information displays;
• public address system;
• emergency call points;
• CCTV;
• cycle racks;
• lighting;
• litter bins.
The City of Edinburgh Council Edinburgh LRT Masterplan Feasibility StudyFinal Report
C:\DOCUMENTS AND SETTINGS\CHRIS BAKER\LOCAL SETTINGS\TEMPORARY INTERNET FILES\OLK1D\0019REPORT-FINAL ISSUE.DOC REP/FI
Page 53 Ove Arup & Partners International LtdFinal Issue 16 January 2003
Where tram stops are off-street, ramps and staircases will be provided, or in the case of any stops at very high or very low level (say more than 8m level change) lifts/escalators. All stops will be fully compliant with the requirements of HMRI and the DDA regulations.
3.2.7 Utility Diversions
Where the tramway runs on-street there will need to be a comprehensive programme of utility diversions to remove existing services from under the trackslabs. The only significant exceptions to this would be services perpendicular to the tracks and deep-level sewers, which would be provided with side entry manholes where necessary, and some very major services such as large high pressure water mains. (If these were to fail, the disruption would be major even if they were diverted clear of the trackslab, and the risk of accidental damage is less if they are left under the trackslab).
The cost of utility diversions can reach 10% of the total cost of on-street works and take over a year at any location. Thus the disruption/cost is very significant and needs to be effectively managed at all stages to ensure the success of the project.
3.2.8 Approvals
Extensive approvals will be needed from CEC as Planning and Roads Authority; Transport Initiatives Edinburgh Limited as the Client; Her Majesty’s Railway Inspectorate and many other interested parties/stakeholders such as frontagers and utility companies. This must be fully taken into account in the programmes for the design/construction and commissioning to ensure that the engineering works are satisfactorily completed and approved in accordance with the Project’s requirements.
3.2.9 Depot
Depot facilities are required, which could be shared between lines. The general need is for:
• stabling sidings; • inspection/repair workshops and tracks; • offices; • control room; • stores (indoor and outdoor); • wash plant; • sanding plant; • traction power sub-station; • staff car parking; • access roads.
Without sharing facilities with other lines such a ‘free-standing’ depot site would need an area of approximately 30,000m² to deal with all of the operational/maintenance requirements for a fleet of up to 25 trams. This is the optimum area for unrestricted operations in the Depot; if the available site(s) are smaller, a reduction to 20-25,000m² could be considered. Ideally, tramway access should be available at either end of the depot so that operational flexibility/reliability can be maximised.
Recent experience on UK light rail projects has shown that (with the exception of a single Engineers’ Siding for craneage work and delivery of trams) all tracks within the Depot should be electrified. This includes all of the tracks within the maintenance/inspection building. Special electrical isolation measures need to be interlocked with the traction power supply on tracks where lifting or roof-access to the trams is needed.

The City of Edinburgh Council Edinburgh LRT Masterplan Feasibility StudyFinal Report
C:\DOCUMENTS AND SETTINGS\CHRIS BAKER\LOCAL SETTINGS\TEMPORARY INTERNET FILES\OLK1D\0019REPORT-FINAL ISSUE.DOC REP/FI
Page 54 Ove Arup & Partners International LtdFinal Issue 16 January 2003
3.2.10 Land Requirements
For all off-street sections of the routes land will need to be acquired or agreement reached with the freeholder for the operation of the tramway. Whenever the tramway is operating within the highway no land is required as agreement will be reached with the Roads Authority in respect of the tramway.
On Railtrack land, whilst the necessary powers for compulsory purchase will be incorporated in the Tramway Bills submitted to the Scottish Executive, it is unlikely that the land would actually be purchased – the necessary agreements being entered into with Railtrack to protect the rights for operation of the Tramway. This particularly applies where the tramway is alongside an existing operational heavy rail track such as on the West Edinburgh Line to the West of Haymarket. The situation in respect of the disused railway line on the North Edinburgh Line between Granton and Haymarket will need to be reviewed with Railtrack.
Where the tramway is off-street, the desirable minimum width of land needed for double track route is approximately 9m for plain lengths of track, but additional land would be needed / desirable to allow for:-
• tramstops, and access thereto;
• substations;
• depots;
• embankments/cuttings;
• any improved access requirements.
The detailed land requirements can only be finalised when the outline design has been developed to a sufficient degree.
3.3 Rolling Stock The trams are envisaged to be:
• low floor vehicles with a minimum of 50-60% of the floor area at less than 400mm above rail level - all passenger doors will be in the low-floor area, thus facilitating the incorporation of tram stops into the urban streetscape, the platforms being approximately 350mm above road level;
• powered by 750v dc from Overhead Line;
• 2.4m to 2.65m wide and 24-35m long;
• capable of negotiating 25m radius horizontal curves, 250m radius vertical curves, and 10% gradients if required on any route on the system [to maintain operational flexibility the trams should be capable of operating on any route, a gradient of approx 10% could occur on the SE Edinburgh route at Pleasance];
• fully compliant with HMRI and Disability Discrimination Act 1995 requirements.
For the Phase 2 appraisal we assumed that single articulated trams of 24m length would be used. Their capacity is likely to be of the order of: 60 seated + 120 standing (total 180/car) but could vary depending on seat density. Trams could operate as coupled pairs if demand warranted, but this is a matter for more detailed investigation.
The cost of light rail vehicles (LRVs) is fairly well established from existing modern British tram systems and depends on the vehicle specifications and the batch size. We assumed that the average cost per tram is £1.6M for the small to medium batches envisaged for individual light rail schemes, based on 24m long trams.

The City of Edinburgh Council Edinburgh LRT Masterplan Feasibility StudyFinal Report
C:\DOCUMENTS AND SETTINGS\CHRIS BAKER\LOCAL SETTINGS\TEMPORARY INTERNET FILES\OLK1D\0019REPORT-FINAL ISSUE.DOC REP/FI
Page 55 Ove Arup & Partners International LtdFinal Issue 16 January 2003
3.4 Tram Services, Run Times and Operating Costs For appraisal, a clear definition is needed of each of the alignments in Phase 2 and the tram services envisaged. For each line, therefore, termini and stop locations were specified as described later in this report.
To assess the run times on each route, tram operation was simulated using the Arup Runtime model employing the following main assumptions:
• Average acceleration rate: 1 m/sec2
• Average service braking rate: -0.9m/sec2
• Maximum speed on segregated route: 80kph
• Maximum speed on street track: 50kph
• Average dwell time per intermediate stop: 20 seconds
• Average delay to trams at traffic signals: 15 seconds
The run times for each route are reported in the relevant sections of this report. The run time results and the basis for key assumptions are given in Appendix A.
Frequency of service was assumed to be 10 trams per hour (tph) for basic services (6 minute headway) in line with plans already developed for the North Edinburgh Line. Given the constraints in CSTM3, it proved impossible to relate level of service to peak capacity requirements for this study. Therefore, 10 tph peak service was retained for fleet size assessment and more detailed assumptions about off peak level of service were adopted for operating cost assessment as follows:
Mon-Fri: 0700 – 1000, 1600 – 1900 10 tph
other times 6 tph
Sat: 0600 – 2400 8 tph
Sun: 0700 – 2300 6 tph
Operating and Maintenance (O&M) costs in the Phase 2 work were assumed to be based on £3.15/car km reported for Manchester Metrolink but driven by the more realistic level of service specified above and applied to each line. The average O&M cost per tram kilometre was assumed to remain constant in real terms over the forecasting and appraisal period.
Higher O&M unit costs maybe expected if profit for an operating concessionaire is included and if staffing levels exceed those for Manchester.
3.5 Environmental Impact Two areas of Environmental Impact were assessed, firstly, those of air quality, noise and vibration resulting from transport activity (principally from road traffic) and, secondly, environmental constraints associated with built or natural sites of particular sensitivity.
3.5.1 Air Quality, Noise and Vibration
Where routes involve street running, the impact is likely to be confined to key junctions where traffic levels may produce localised changes to noise or air quality. Where the route is off-street, on vacant ground, disused railway lines or countryside areas, the environmental constraints may need to be investigated further.
The degree to which the tram network contributes to a reduction in road vehicles, or to a change in the nature of traffic flow (related to speed and therefore emissions) is derived from

The City of Edinburgh Council Edinburgh LRT Masterplan Feasibility StudyFinal Report
C:\DOCUMENTS AND SETTINGS\CHRIS BAKER\LOCAL SETTINGS\TEMPORARY INTERNET FILES\OLK1D\0019REPORT-FINAL ISSUE.DOC REP/FI
Page 56 Ove Arup & Partners International LtdFinal Issue 16 January 2003
the CSTM3 model. This provides the change in average vehicle time and distance for each movement aggregated by CSTM district in the Do-Something test and the volume of car and public transport trips being made. These are compared with the equivalent values for the Do-Minimum to calculate the difference. These will illustrate areas where levels of noise and air quality have altered as a result of the tram network.
3.5.2 Environmental Constraints
As part of the environmental assessment a review of constraints was undertaken for each Phase 2 corridor. For simplicity, the environmental planning constraints for the routes were divided into four categories:
• primary and secondary constraints due to ecological and landscape designations;
• primary and secondary constraints, based on designations for the built environment.
Primary constraints are those thought to be the most significant, mainly because of a statutory designation, or affect important national assets. Secondary constraints are those designations driven by local development planning activities.
The following environmental constraints comprise the planning designations of the City that would appear to be the most relevant to the preferred route corridors. Other constraints were considered but not presented, as they were unlikely to be affected directly or indirectly, and these were omitted. The planning designations included:
• RAMSAR sites, Special Areas of Conservation, and Special Protection Areas, as all are covered by SSSI designations in the study area;
• Biosphere and Biogenic Reserves (none in vicinity);
• Intermediate and Raised Bogs, and Landscape Character Assessments (classifications rather than designations);
• Significant Open Spaces, and Neighbourhood Nature Areas (non-statutory and covered by other designations);
• HSE Hazard Consultation Zones (only important in specific circumstances).
3.6 Demand Forecasting
3.6.1 Forecasting Model
The demand forecasting was undertaken using the Central Scotland Transport Model version 3 (CSTM3). This is a multi-modal model developed to represent traffic movements and mode share for a 1997 Base year. It covers all the main urban centres in Scotland other than Aberdeen and Inverness.
CSTM3 includes all trunk roads, the motorway network, most A class roads and, in the urban areas, local distributors, etc. CSTM3 incorporates all rail and bus services including the inter-city services. Car parking is not modelled in CSTM3.
CSTM3 forecasts for three specific time periods:
• morning peak hour (0800 - 0900); • off-peak period (1000 - 1600); • evening peak hour (1700 - 1800).
The transport networks were represented in “strategies” that feature the LRT system and complementary schemes and policies, primarily consisting of highway adjustments. The models were developed for an indicative opening year of 2011, a CSTM3 forecast year.
The City of Edinburgh Council Edinburgh LRT Masterplan Feasibility StudyFinal Report
C:\DOCUMENTS AND SETTINGS\CHRIS BAKER\LOCAL SETTINGS\TEMPORARY INTERNET FILES\OLK1D\0019REPORT-FINAL ISSUE.DOC REP/FI
Page 57 Ove Arup & Partners International LtdFinal Issue 16 January 2003
The following strategies were modelled:
• Strategy RC 2011 - Reference Case (Do-Nothing);
• Strategy 01 2011 - all LRT corridors (Phase 1);
• Strategy 02 2011 - West Edinburgh Line (Newbridge-St. Andrew Square);
• Strategy 03 2011 - North Edinburgh;
• Strategy 05 2011 - West Edinburgh, North Edinburgh and SE Edinburgh lines;
• Strategy 06 2011 - SE Edinburgh line (Danderhall-Haymarket).
Key Assumptions
CSTM3 has a base year of 1997 and a price base of 1997. For this study a central economic growth forecast was applied.
The Reference Case was developed from the 1997 Base Model. For the 2001 Reference Case the transport network and services within the Edinburgh area were updated. The 2011 Reference Case assumed no further changes to the transport network or services.
The alignment for each LRT line was coded based on plans developed for this study, except for the North Edinburgh alignment which was as specified in the Andersen work. The LRT alignments were coded as a mixture of highway and dedicated public transport infrastructure. There were three types of possible alignment for LRT:
• fully segregated (private right of way); • segregated on-street; and • street running.
It was assumed that segregated on-street alignments would be shared with other public transport vehicles, i.e. buses and public hire taxis.
LRT was coded for each junction on the street sections to model the impact on other traffic. This involved the detailed coding of road space and signals to reflect the interaction of the tram with general traffic and to provide a degree of priority for trams.
For the full Phase 2 network (Strategy 05 2011), four tram services were coded, covering the full network:
• North Edinburgh Loop;
• Newbridge to Edinburgh waterfront – combine West Edinburgh and eastern side of North Edinburgh loop, via city centre;
• Danderhall to Edinburgh waterfront – combine South East Edinburgh line and western side of North Edinburgh loop, via city centre;
• Newbridge to Danderhall.
For each of the above services 5 tph were assumed for each time period giving a combined frequency of 10 tph on each of the three core lines and a combined 20 cars per hour between Haymarket and St Andrew Square. Individual lines were tested at 10 tph.
A fare structure consistent with bus fares was coded for all LRT services.
Segregated sections and former/existing rail alignments were modelled with an operating speed of 70 kph. For segregated street alignments this was 40 kph. Operating speeds for these two types of alignment were adjusted to allow for deceleration, dwell time and acceleration associated with stops. For street running, speeds were determined by the model dynamically from car speeds and will generally be less than 40 kph.

The City of Edinburgh Council Edinburgh LRT Masterplan Feasibility StudyFinal Report
C:\DOCUMENTS AND SETTINGS\CHRIS BAKER\LOCAL SETTINGS\TEMPORARY INTERNET FILES\OLK1D\0019REPORT-FINAL ISSUE.DOC REP/FI
Page 58 Ove Arup & Partners International LtdFinal Issue 16 January 2003
Analysis Demand forecasts from CSTM3 were compiled as 24 hour production-attraction matrices for the main modes (car and public transport), and time period statistics for public transport sub-modes and cars. This gives mode split, car and public transport only, and daily information and some detail at a time period level. The restrictions on the number of modes available in CSTM3 mean that not all information is available at the sub-mode level.
Changes in journey distance and time were also produced by the model and the average trip length implied for LRT was derived. Results were aggregated by CSTM3 district, made up of a number of zones, and a further summary aggregation by sector was derived to represent the main areas of demand for each corridor. The sectors are as follows:
• New Town; • North Central Edinburgh; • Haymarket; • Old Town; • Waterfront; • Portobello; • South East Edinburgh; • South West Edinburgh; • Urban West Edinburgh; • Silverknowes; • East Lothian; • Midlothian; • Rural West Edinburgh; • West Lothian; • Fife.
The model was developed for interurban forecasting and has limitations when applied in a detailed urban context. This limits the detail of the output that can be obtained. In particular, it means that it was not possible to represent all tram links separately from other modes so that the loading on tram services cannot be determined unambiguously except for links not shared with other traffic. Nor is it possible to derive tram patronage on its own. All forecasts are public transport (i.e. bus, tram and rail) totals but our tests were carefully defined to keep bus and heavy rail services constant so that the difference between Do-Something Strategic and the Reference Case represents the impact of tram.
3.6.2 Development Related Trips
A number of major developments are planned close to each of the three tram corridors. These could have a significant impact on the demand and revenue forecasts for each line. Developments on the North Edinburgh Line were considered by the Andersen team in their work for Waterfront Edinburgh. The method they use for calculating the number of development trips is sound, so we have not sought to reproduce this exercise. The information they collated was used in checking our own forecasts of development trips.
We calculated trip rates for each of the major developments identified along each route and checked these against similar development types in North Edinburgh. The distribution of these trips is assumed to be similar to neighbouring zones exhibiting similar land use patterns, and, using the CSTM3 model outputs, the trips in scope for LRT were identified and a comparable mode share applied, with reference to neighbouring zones where the impact on journey time and cost is similar. Finally the LRT mode share for the development was re-checked with North Edinburgh assumptions. The compiled developments and sources of information include the following:
• North Edinburgh Developments (identified and forecast in the Andersen report);

The City of Edinburgh Council Edinburgh LRT Masterplan Feasibility StudyFinal Report
C:\DOCUMENTS AND SETTINGS\CHRIS BAKER\LOCAL SETTINGS\TEMPORARY INTERNET FILES\OLK1D\0019REPORT-FINAL ISSUE.DOC REP/FI
Page 59 Ove Arup & Partners International LtdFinal Issue 16 January 2003
• Edinburgh Park – expansion from existing (from WEPF);
• Royal Bank of Scotland – new headquarters at Gogarburn (development trips from RBOS consultants);
• Edinburgh Airport – growth in airport activity (from WEPF/Surface Access Strategy);
• Shawfair – significant residential and community development (Shawfair Local Plan related documents);
• New Royal Infirmary and associated uses – major hospital development and adjacent medi-park development (local planning information).
3.6.3 Fares
In assessing the case for each LRT scheme, it is necessary to forecast the revenue that would arise based on projected patronage at specified fares. There are three basic fare structures that could apply:
• flat fares, with a single fare applying to all trips regardless of distance, although there would be discounts for children and concessionary fares;
• sectional or stage fares, the most common structure on British public transport, in which fare is related to distance on a route-specific basis;
• zonal fares, which may be based on concentric (as in London) or on cellular zones – both systems facilitate through-ticketing for single fares.
All of these systems can accommodate season tickets (travelcards), which can be stage or zone based.
The present commercial context for trams in Edinburgh is a bus and rail network with sectional fare systems and season tickets. The main bus operators are Lothian Buses (LB) and First Edinburgh (FE). The former provides service in all of the corridors concerned. LB offers “Daysaver” tickets for £2.20 all day and other seasons. FE also offers various season tickets.
Under present competition law (Competition Act, 1998) cooperation between public transport operators is not encouraged and integrated operation is permitted only if it can be shown to be non-monopolistic. The government has now adopted a regulation exempting some ticketing schemes from this Act to facilitate integration. This applies to multi-operator travelcards and through tickets. The scope for integrated fares, therefore, is now improved and could be most easily introduced if an incumbent bus operator had a stake in the LRT. However, a new LRT operator should be required to participate in area-wide travelcard and concessionary schemes, which would provide some through ticketing. Consequently, we have assumed that tram fares would be sectional (distance-based) for forecasting, that a proportion of users would have travelcards, and that concessionary fares would also apply. However, there were no data on which to base forecasts of travelcard or concessionary fare travel.
The CSTM3 demand forecasting model contains fares projections but includes only adult full fare trips. For the Phase 1 appraisal, fares are assumed to be held at 1997 levels; revenue was assessed on adult full fare trips only.
For the Phase 2 appraisal, revenue forecasts were also based on sectional fares that apply on buses now. The best fit scale based on LB fares is 50p boarding charge plus 10p per kilometre. For business case preparation, it would be appropriate to include allowances for concessionary fares (an additional proportion of adult fares) and for discounts for travelcard users and child fares (a reduction on adult fares) but information on these proportions in the Edinburgh public transport market was not readily available.
The City of Edinburgh Council Edinburgh LRT Masterplan Feasibility StudyFinal Report
C:\DOCUMENTS AND SETTINGS\CHRIS BAKER\LOCAL SETTINGS\TEMPORARY INTERNET FILES\OLK1D\0019REPORT-FINAL ISSUE.DOC REP/FI
Page 60 Ove Arup & Partners International LtdFinal Issue 16 January 2003
3.6.4 Park and Ride Forecasting
Guidelines for planning Park & Ride have been published, mainly for bus based facilities, and many of these are applicable to light rail Park & Ride. The tram network in Edinburgh could offer frequent and reliable service, competitive with the alternative car journey. However, the location of the Park & Ride sites will be particularly important in achieving significant mode shift. Key factors include:
• proximity to the strategic highway network;
• safe and easy access and egress;
• site should be outside the congested area to maximise the potential advantage;
• sufficient adjacent land to allow expansion to meet growth in demand;
• in keeping with surrounding land uses and site should meet planning requirements, in particular, Green Belt.
Careful attention to detail in the layout of the site design will be essential to create a safe environment for pedestrians and motorists and to engender a sense of security and confidence in the system. Additional facilities should be considered early in the design stage to ensure safe and secure car parking.
The provision of high quality Park and Ride with the right level of security and staffing would inevitably incur substantial capital and operating costs. There are a number of ways of dealing with charging in order to address these costs and broadly four types of approach are commonly used in the UK:
• rail based, where the charge for parking is separate from the ticket. In some cases, a ‘premium charge’ is imposed, with refunds from the ticket office against the purchase of a rail ticket above a certain value;
• bus based, where parking is free and the only transaction is the bus fare;
• bus based, with parking and the bus journey separately charged;
• bus based, where there is a charge per vehicle and the bus travel is free regardless of the number of occupants of the car.
The concept of charging only for travel is the most widely used in bus Park and Ride. These systems are often very successful although few are commercially viable, and the charging regimes are usually set according to maximising patronage and modal switch rather than revenue. In calculating Park and Ride demand and revenue we have assumed that this charging model will apply.
The demand and revenue arising from each site, was based on a number of assumptions, derived from observation of park and ride sites elsewhere in the UK, and on the utilisation of the total spaces available. This was checked against the level of passing traffic from the Park and Ride catchment. The mode shift forecasts from the CSTM3 model for the corridor were then used as a diversion factor applied to passing traffic in the Do-Something case. The other assumptions used were:
• of the total spaces available, a proportion determined by general AM peak mode shift in the corridor would be occupied by peak period users (i.e. before 0930 hours). The remaining spaces are occupied by off peak users;
• the length of stay for off peak users leads to some additional space utilisation based on a parking space turnover of 1.1, these are effectively treated as off-peak spaces in terms of the assumptions made;

The City of Edinburgh Council Edinburgh LRT Masterplan Feasibility StudyFinal Report
C:\DOCUMENTS AND SETTINGS\CHRIS BAKER\LOCAL SETTINGS\TEMPORARY INTERNET FILES\OLK1D\0019REPORT-FINAL ISSUE.DOC REP/FI
Page 61 Ove Arup & Partners International LtdFinal Issue 16 January 2003
• local car occupancy factors are used for peak and off peak users to derive tram demand;
• all car occupants are assumed to result in a return tram fare.
Daily revenue totals are factored up to give annual revenue totals. These were calculated for all sites to give total fare revenue and total parking revenue.
3.6.5 Revenue
Revenue forecasts for tram schemes use average tram trip length from CSTM3 and the number of passengers implied by model outputs applied to the bus fare scale, with no premium fares. Daily revenue was converted to annual using a revised annualisation factor of 320 (i.e. 251 M-F + 52 SAT + 52 SUN + 9 HOL + 1 day no service).
3.7 Appraisal
3.7.1 Appraisal of Phase 2 Network
The appraisal of the Phase 2 network was also based on STAG with further detail provided on key indicators relating to environmental and economic impacts of each of the three lines assessed. This is supported by forecasts from CSTM3 for each core route.
Key indicators for each line under each of the STAG objectives are as follows:
• Environment – constraints mapping for natural features etc (inc SSSIs, historic monuments etc), issues requiring detailed investigation, areas of significant reduction in traffic-related pollution;
• Safety – impact on conflict points and problem locations, reduction in vehicle kilometres travelled affecting the general incidence of road traffic accidents;
• Economy – preliminary costs and revenues, impact on development opportunities, travel time savings, quality and reliability benefits including impact on de-congestion feeding into a preliminary cost-benefit appraisal to provide an indicative present value of costs and benefits over a typical 30 year appraisal period at a standard discount rate. This will take account of quantified benefits (principally journey time and non-user benefits), capital expenditure, operating costs and revenues (see below);
• Integration – summary of key interchange points, integration with existing public transport, park and ride, public transport mode share, land use integration, new opportunities for travel, policy integration;
• Accessibility – impact on areas of multiple deprivation, effect on social inclusion, public transport links/service provision, access to employment markets and increased opportunities.
As part of the assessment of the wider network benefits, the issues of integrated ticketing, regeneration and future network development were considered.
3.7.2 Network Extensions
Several lines into SESTRANS areas were to be considered and a broad assessment of their benefits undertaken. This took the form of a qualitative review of the impacts in relation to the wider travel to work area for Edinburgh, supporting future development and improving public transport accessibility. The opportunities for integration with bus and rail networks and for park and ride were considered. The degree to which the extensions could provide a positive addition to the Phase 2 network in terms of catchment and providing links to new markets were assessed with due reference to construction cost to indicate, in broad terms, likely value for money.

The City of Edinburgh Council Edinburgh LRT Masterplan Feasibility StudyFinal Report
C:\DOCUMENTS AND SETTINGS\CHRIS BAKER\LOCAL SETTINGS\TEMPORARY INTERNET FILES\OLK1D\0019REPORT-FINAL ISSUE.DOC REP/FI
Page 62 Ove Arup & Partners International LtdFinal Issue 16 January 2003
3.7.3 Restricted Cost Benefit Analysis
Outputs from the CSTM3 model were used to calculate the benefits arising from each tram route. These were valued using Transport Economic Note, 2001 (TEN) parameters for the value of time, vehicle operating costs and trend factors, were applied to calculate the monetary benefits where no local data were available. There are three main benefits for quantification.
1. The principal user benefits arising from the tram schemes are from reduced journey times. The resulting benefit was calculated by comparing journey time for each journey made in the Do-Something case with that in the Do-Minimum reference case. The cumulative time saving is monetised using values of time and annualised. It is standard practice to average the benefit attributable to each user of a new mode (tram) by using the “Rule of Half”, which reflects the fact that some people will switch modes with a very small, marginal improvement in journey time and others will realise the full difference in journey time between Do-Something and Do-Minimum.
2. Road users may also see journey time benefits arising from the reduction in congestion due to the switch to tram. These benefits are calculated in the same way as for users with appropriate values of time. However, as there is no mode switch involved, the full value of their time savings is included.
3. A reduction in road traffic is assumed to result in accident savings. The estimation of savings is directly related to the number of car kilometres on the network. Different accident rates apply on different categories of road and standard DfT monetary values for fatal, serious and slight road traffic accidents are applied to the difference between the Do-Something and the Do-Minimum number of vehicle kilometres for each forecast.
Costs and benefits accruing to tram schemes can be calculated across the period of operation consistent with a typical operating concession of, say, 30 years. The stream of benefits and costs are discounted to yield a Net Present Value. The DfT has recently changed its standard discount rate from 6% per annum to 3.5% per annum for the assessment of transport schemes. However, we retained 6% for this appraisal.
GDP trend growth was applied to revenues at +2% per annum, this is below the current UK forecast. Growth in the value of time was applied using factors from TEN.

The City of Edinburgh Council Edinburgh LRT Masterplan Feasibility StudyFinal Report
C:\DOCUMENTS AND SETTINGS\CHRIS BAKER\LOCAL SETTINGS\TEMPORARY INTERNET FILES\OLK1D\0019REPORT-FINAL ISSUE.DOC REP/FI
Page 63 Ove Arup & Partners International LtdFinal Issue 16 January 2003
4. NORTH EDINBURGH LOOP
4.1 Alignment and Engineering Issues
4.1.1 Alignment
The alignment is fully detailed in the documents prepared by others in earlier studies for the North Edinburgh Line. A summary is provided below, and on Figure 4.1, which is taken from Drawing 61664\EDN\0002, Rev. A of the North Edinburgh Outline Business Case.
The line provides a loop between Princes Street in the South and Granton Harbour to Port of Leith in the North, approximately 85% of which is on-street; the segregated section being from Haymarket to Crewe Toll – predominantly along disused railway alignment.
Other aspects of the alignment include:
• The proposed junction with the South East Edinburgh Line at Waverley Bridge would necessitate some realignment of the tramway in Princes Street.
• The section of the route from Haymarket to St Andrew Square via Princes Street is the core of the whole network and can be expected to be used by trams on other lines such as the West Edinburgh and South East Edinburgh routes. Care will, therefore, need to be taken to ensure that the track layout and tramstop size/facilities are suitable for the predicted medium-term network rather than just the North Edinburgh Line. [Whilst cost constraints may necessitate deferral of some facilities, they should be designed at an early stage to ensure that the initial works as constructed are compatible with and easily modified for future enhanced works.]
• Since the majority of the route is on-street, the line could be subject to extensive delays unless junction priority and other measures are put in place.
Since the definition of the North Edinburgh Loop alignment was undertaken in previous work by the Andersen team, we have not reviewed the choice of alignment nor the possible alternatives that were considered, including the construction of only part of the Loop.
4.1.2 Depot
The criteria for the design of the system are outlined elsewhere, but the depot site, relating in particular to the North Edinburgh Line, should be noted. The selected depot site (Sites 18 and 19 at Port of Leith) is quite restricted in terms of layout and size. Greater flexibility and economy could be obtained by transferring some of the facilities to the West Edinburgh Depot if this line is approved sufficiently early.
4.1.3 Land Area Required
The area of land needed for the North Edinburgh Line other than within highway boundaries is estimated to be 68,500m² of which about 30,000m² is on dismantled railway alignment that may still belong to Railtrack. A notional cost for this land is included in our construction cost estimate.

The City of Edinburgh Council Edinburgh LRT Masterplan Feasibility StudyFinal Report
C:\DOCUMENTS AND SETTINGS\CHRIS BAKER\LOCAL SETTINGS\TEMPORARY INTERNET FILES\OLK1D\0019REPORT-FINAL ISSUE.DOC REP/FI
Page 64 Ove Arup & Partners International LtdFinal Issue 16 January 2003
[Insert Figure 4.1 – North Edinburgh Line]

The City of Edinburgh Council Edinburgh LRT Masterplan Feasibility StudyFinal Report
C:\DOCUMENTS AND SETTINGS\CHRIS BAKER\LOCAL SETTINGS\TEMPORARY INTERNET FILES\OLK1D\0019REPORT-FINAL ISSUE.DOC REP/FI
Page 65 Ove Arup & Partners International LtdFinal Issue 16 January 2003
4.2 Demand and Revenue This section summarises the demand and revenue forecasts from CSTM3 for the North Edinburgh Loop and compares them with the forecasts prepared by the Andersen team for the Waterfront Transit study.
In addition to annual demand projections for LRT, average trip length on LRT and annual revenue forecasts are given. Demand and revenue are built up from model (i.e. CSTM3) output, development-related trips and Park and Ride trips. Table 4.1 gives the daily and annual demand for the North Edinburgh Loop. The projected development trips are those reported in the Andersen work corresponding to 2011, the CSTM3 forecast year. These development trips are principally related to the regeneration of the Waterfront and Granton areas and, therefore, have an impact on loadings on the northern part of the loop. However, the maximum peak tram loading would occur close to the city centre.
Our results indicate a lower demand than the forecasts by the Andersen team but, with bus fares applied to LRT, our projection implies a higher average fare (consistent with the average trip length) and a smaller difference in revenues. Although it would be unreasonable to expect our forecasts to be the same as the Andersen team’s, there are several key reasons for the difference. Our forecasts are based on the projected CSTM3 2011 base, which includes a decline in public transport patronage of about 20% in the peak between 1997 and 2011, whereas the number of public trips was held constant at 1997 levels in the Andersen team forecasts. Secondly, we have used 12 hour trips in our forecasts, not full day. We have not applied the 12 hr → 24 hr trip factor of 1.23 used in CSTM3 because this implies that nearly one fifth of public transport trips would occur in the remaining six hours of the operating day. While a factor of this size may be appropriate for car traffic in interurban markets, which is the principal focus of CSTM3, we consider that it is likely to be an over-estimate in the urban public transport context.
Table 4.2 provides estimates of peak demand on the line and a peak line loading to illustrate demand in relation to capacity. At 10 tph the hourly capacity is 1,800. Allowing for a peak within the peak hour approximately equal to 50% of the peak hour in a 20 minute period, this would result in a tram peak load factor of 125% in the forecast year.
Table 4.3 illustrates the effect of transfer to tram on network mode split. A significant proportion of LRT trips will transfer from bus. Therefore, the overall impact on public transport mode split is small. The numbers quoted refer to CSTM3 Districts directly served by the line.
Table 4.1 Demand and Revenue (2011) North Edinburgh Tram
Modelled Trips
Development Trips
Park and Ride Trips TOTAL
Daily Demand 19,149 19,203 -- 38,352 Average Trip Length (kms) 5.13 Annual Demand (M) 6.128 5.448 -- 11.576 Annual Revenue (£M) 6.209 3.424 -- 9.633 Waterfront Transit Daily Demand 50,482 19,203 -- 69,685 Waterfront Transit Annual Demand 14.591 5.448 -- 20.039 Waterfront Transit Annual Revenue 7.763 3.424 -- 11.187
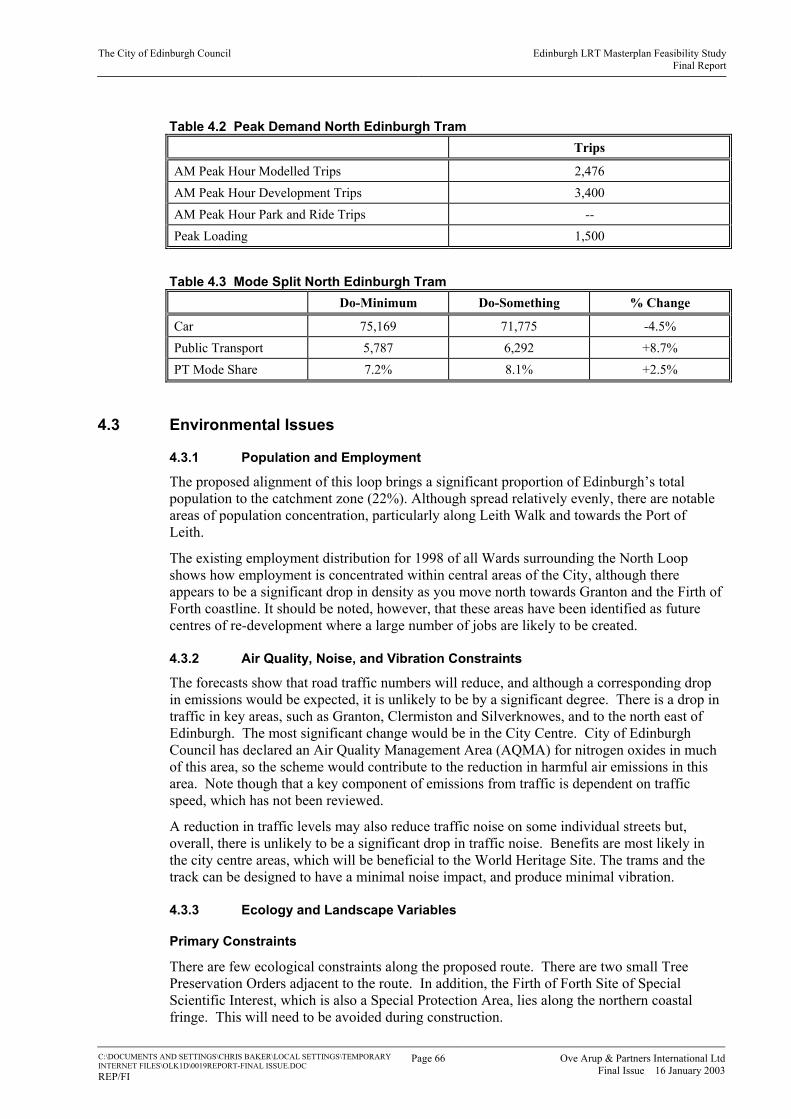
The City of Edinburgh Council Edinburgh LRT Masterplan Feasibility StudyFinal Report
C:\DOCUMENTS AND SETTINGS\CHRIS BAKER\LOCAL SETTINGS\TEMPORARY INTERNET FILES\OLK1D\0019REPORT-FINAL ISSUE.DOC REP/FI
Page 66 Ove Arup & Partners International LtdFinal Issue 16 January 2003
Table 4.2 Peak Demand North Edinburgh Tram Trips
AM Peak Hour Modelled Trips 2,476 AM Peak Hour Development Trips 3,400 AM Peak Hour Park and Ride Trips -- Peak Loading 1,500
Table 4.3 Mode Split North Edinburgh Tram
Do-Minimum Do-Something % Change
Car 75,169 71,775 -4.5% Public Transport 5,787 6,292 +8.7% PT Mode Share 7.2% 8.1% +2.5%
4.3 Environmental Issues
4.3.1 Population and Employment
The proposed alignment of this loop brings a significant proportion of Edinburgh’s total population to the catchment zone (22%). Although spread relatively evenly, there are notable areas of population concentration, particularly along Leith Walk and towards the Port of Leith.
The existing employment distribution for 1998 of all Wards surrounding the North Loop shows how employment is concentrated within central areas of the City, although there appears to be a significant drop in density as you move north towards Granton and the Firth of Forth coastline. It should be noted, however, that these areas have been identified as future centres of re-development where a large number of jobs are likely to be created.
4.3.2 Air Quality, Noise, and Vibration Constraints
The forecasts show that road traffic numbers will reduce, and although a corresponding drop in emissions would be expected, it is unlikely to be by a significant degree. There is a drop in traffic in key areas, such as Granton, Clermiston and Silverknowes, and to the north east of Edinburgh. The most significant change would be in the City Centre. City of Edinburgh Council has declared an Air Quality Management Area (AQMA) for nitrogen oxides in much of this area, so the scheme would contribute to the reduction in harmful air emissions in this area. Note though that a key component of emissions from traffic is dependent on traffic speed, which has not been reviewed.
A reduction in traffic levels may also reduce traffic noise on some individual streets but, overall, there is unlikely to be a significant drop in traffic noise. Benefits are most likely in the city centre areas, which will be beneficial to the World Heritage Site. The trams and the track can be designed to have a minimal noise impact, and produce minimal vibration.
4.3.3 Ecology and Landscape Variables
Primary Constraints
There are few ecological constraints along the proposed route. There are two small Tree Preservation Orders adjacent to the route. In addition, the Firth of Forth Site of Special Scientific Interest, which is also a Special Protection Area, lies along the northern coastal fringe. This will need to be avoided during construction.

The City of Edinburgh Council Edinburgh LRT Masterplan Feasibility StudyFinal Report
C:\DOCUMENTS AND SETTINGS\CHRIS BAKER\LOCAL SETTINGS\TEMPORARY INTERNET FILES\OLK1D\0019REPORT-FINAL ISSUE.DOC REP/FI
Page 67 Ove Arup & Partners International LtdFinal Issue 16 January 2003
Secondary Constraints
There are no secondary ecological constraints along or immediately adjacent to the route.
4.3.4 The Built Environment
Primary Constraints
The route runs through the Edinburgh World Heritage Site, where it meets Haymarket Terrace through Princes Street and west to Leith Walk. The World Heritage Site designation protects the physical appearance of the historic buildings and the streetscape of the city centre.
The line also passes through Conservation Areas that are not within the World Heritage Site. Again, this protects the character of the area. There are also several listed buildings along the route. As most of the route is on street, there are unlikely to be impacts on listed buildings.
Sensitive solutions to the erection of overhead line are needed to preserve the aesthetics of the “street-scape”.
Secondary Constraints
There are cycle routes along a good deal of the length of the tram route. Therefore, the trams would be sharing road space with cyclists, or alternative cycle routes would need to be found. This particularly applies to the section of disused railway from Granton to Corstorphine. This then joins the street cycle route through Princes Street. The tram route diverts round St Andrew Square but meets the cycle route again on street along Leith Walk.
4.4 Integration One of the key impacts of the North Edinburgh tram Loop is integration with other modes of transport and new developments. The land use interaction also contributes to the importance of transport integration. The tram loop will feed a number of key interchange points, providing access for the deprived communities of North Edinburgh to facilities across the city.
The scheme will provide links to main line train services at Waverley and Haymarket stations. A key interchange with buses will be provided at St. Andrew Square. This will also be the nearest location to Waverley Station so it will be particularly important to ensure excellent facilities, information and signage for the interchange. Further interchange with buses will be provided at Crewe Toll, where a number of bus services provide access along Ferry Road and link into other areas at North Edinburgh not directly served by the tram. Although direct, seamless interchange with rail is not possible at either Waverley or Haymarket, the high frequency of tram service should enable attractive connections to be made without scheduling. Interchange with buses will be particularly easy, both at St. Andrew Square and along Princes Street.
4.5 Tram Operations and Car Requirements The run time for the North Edinburgh Loop was assessed using the Arup Runtime model applied to the alignment developed for the North Edinburgh Outline Business Case, the stop locations already defined for it and tram performance assumptions summarised earlier in this report. Demand forecasts were based on simple circular service with 10 tph in both directions. The run time for a complete circuit was assessed at 36 min:18 secs (see Appendix A), excluding layover time, which would be essential for reliable operation. Following practice on other circular routes, such as Milano route 29/30, the layover was set equal to the headway. Assuming 10 tph for peak service, this yields 42 min:18 secs, which would require 7 cars per direction if layover were cut to 5 min:42 secs.

The City of Edinburgh Council Edinburgh LRT Masterplan Feasibility StudyFinal Report
C:\DOCUMENTS AND SETTINGS\CHRIS BAKER\LOCAL SETTINGS\TEMPORARY INTERNET FILES\OLK1D\0019REPORT-FINAL ISSUE.DOC REP/FI
Page 68 Ove Arup & Partners International LtdFinal Issue 16 January 2003
A service of 7 cars in each direction implies 14 cars in service and 10% engineering spare cars which rounds to 2 spare cars. Therefore, a fleet of 16 cars would be needed. This corresponds to the NE Outline Business Case projection. The NE Outline Business Case was prepared assuming £1.8M/tram yielding a cost of £28.8M. Our LRV unit cost assumption is £1.6M, which gives a cost of £25.6M.
Our O&M cost assessment, for the North Edinburgh Line (circular service 15.61km long) is based on the level of service summarised earlier and an average cost per car km of £3.15 as follows:
1.452M car kms/year x £3.15 per car km = £4.57M/year.
This compares with the Andersen team figure of £5.43M/year.
4.6 Costs Our assessment of the costs of North Edinburgh Scheme as defined by the Andersen team is given in Table 4.4 on a consistent basis with our pre-feasibility assessments for the other two lines. The Andersen assessment is £192M within a ±25% range. Our assessment is £155M for construction with an allowance for land to which the cost of LRVs and depot must be added. LRV costs are assumed at £1.6M x 16 cars = £25.6M and depot cost, £8M. Therefore, our assessment is £188.6M or 2% less than the Andersen team figure. We have not attempted detailed reconciliation since that would involve unpicking the Andersen team costs in depth, but the close correspondence of costs gives some comfort.
Our assessment of construction cost yields an average cost of £9.93M/route km for the North Edinburgh Line, excluding depot provision.
Table 4.4 Outline Construction Cost of the North Edinburgh Tram Route (excluding depot) Category of Work Total £M
Earthworks/Landscaping, etc. 4.90 Structures 0.00 Trackwork 56.20 Highways Work 9.82 Substations and OHLE 6.16 Tramstops 4.75 Park and Ride 0.00 Signalling and Control Equipment 2.00 Utility Diversions 13.29 Commissioning 1.48 Land 7.82 Railtrack 1.00 Other items 10.57 Client Costs – 10% Design and Site Supervision – 15% 37.02 Allowance for Contingencies – 10% TOTAL 155.02
The City of Edinburgh Council Edinburgh LRT Masterplan Feasibility StudyFinal Report
C:\DOCUMENTS AND SETTINGS\CHRIS BAKER\LOCAL SETTINGS\TEMPORARY INTERNET FILES\OLK1D\0019REPORT-FINAL ISSUE.DOC REP/FI
Page 69 Ove Arup & Partners International LtdFinal Issue 16 January 2003
4.7 Appraisal The North Edinburgh Loop was subject to a STAG initial assessment in Phase 1 and the resulting AST is included in this report. The Phase 2 tests of the scheme described above yield the following key results. The main financial projections are:
Capital cost £188.60M O&M cost £4.57M per year Revenue £9.63M per year Operating ratio 2.11
Therefore, the Phase 2 appraisal indicates that the line could cover its operating costs but has a significant funding gap. It must be emphasised that both O&M costs and revenues are highly sensitive to change in forecasting assumptions, O&M costs are determined by the level of service offered while revenue is based on existing bus fares with no premium for higher quality service, a 10% premium might be reasonable which would increase the operating ratio.
Our initial assessment of the net benefits of the scheme in a restricted cost benefit analysis gives the following main results:
PV of benefits : +£182.1M
PV of costs : -£218.5M
NPV : -£36.4M
The scheme would achieve a modest mode shift across the city as a whole. The reduction in car trips of 3,394 per day represents a reduction in 4.85M car trips per year contributing to environmental improvement and decongestion.

The City of Edinburgh Council Edinburgh LRT Masterplan Feasibility StudyFinal Report
C:\DOCUMENTS AND SETTINGS\CHRIS BAKER\LOCAL SETTINGS\TEMPORARY INTERNET FILES\OLK1D\0019REPORT-FINAL ISSUE.DOC REP/FI
Page 70 Ove Arup & Partners International LtdFinal Issue 16 January 2003
5. WEST EDINBURGH LINE
5.1 Context The existing transport system in West Edinburgh is under significant pressure. The traffic effects of major new business developments in the west of the city over the past decade have added to underlying traffic growth. Table 5.1 indicates the scale of traffic growth in West Edinburgh over the 20 years 1980 to 2000. It should be noted that during this period the M8 extension opened, taking significant traffic away from the A8.
Table 5.1 Traffic growth on major roads in West Edinburgh between 1980 and 2000
Location Morning peak inbound
Evening Peak outbound All day
A90 at edge of city 40% 41% 62%
A8 at edge of city 25% 42% 35%
The A8 Glasgow Road is one of the key radial corridors in Edinburgh. It serves a significant area of suburban Edinburgh and is a major route into the city from West Lothian and beyond. It feeds into the City of Edinburgh Bypass at Gogar and parallels the main Edinburgh to Glasgow railway to Haymarket. The A8 is also one of Edinburgh’s Greenways, offering bus priorities through various traffic management measures and provision of dedicated roadspace.
Currently the volume of eastbound traffic on the A8 at the edge of the city centre (Haymarket Terrace) is around 1600 vehicles in the peak hour. Average car occupancy on the A8 derived from monitoring surveys is around 1.3. This means that there are in excess of 2000 people travelling into Edinburgh city centre by car in the morning peak period on Glasgow Road alone.
Bus surveys of outbound evening peak buses at Haymarket Terrace show over 2000 passengers in the two hour period from 1600 to 1800. This corresponds to over 1.25 million two way peak period passengers per annum.
Car journey times along the corridor are quite variable, in peak , inter-peak and off peak periods. As would be expected there is increased congestion throughout the corridor in the peak periods, particularly around Gogar roundabout and along Roseburn Terrace and West Coates approaching Haymarket. Outside peak periods, traffic travelling to South Gyle Shopping Centre and Edinburgh Park also causes delays on local access routes and at key junctions. The main congestion hotspots are:
South Gyle Broadway - from the Gogar Roundabout to the Gyle Roundabout is generally operating at capacity during the AM peak period.
Gyle Roundabout - junctions within Edinburgh Park & South Gyle Park are congested during the peak periods with significant delays. During the AM peak period queues along South Gyle Broadway back onto the A8 in both directions.
Gyle Centre Bus Terminus - delays at Gogar roundabout lead to variable delays at the Gyle Roundabout in the peak periods.
South Gyle Crescent - delays during the PM peak period as traffic accessing South Gyle Broadway backs up.
Edinburgh Park - congestion linked to the queuing experienced at the Gyle Roundabout.
Hermiston Gait Roundabout/Cultins Road – heavy traffic flows during peak periods, queuing at the junction with the A71.
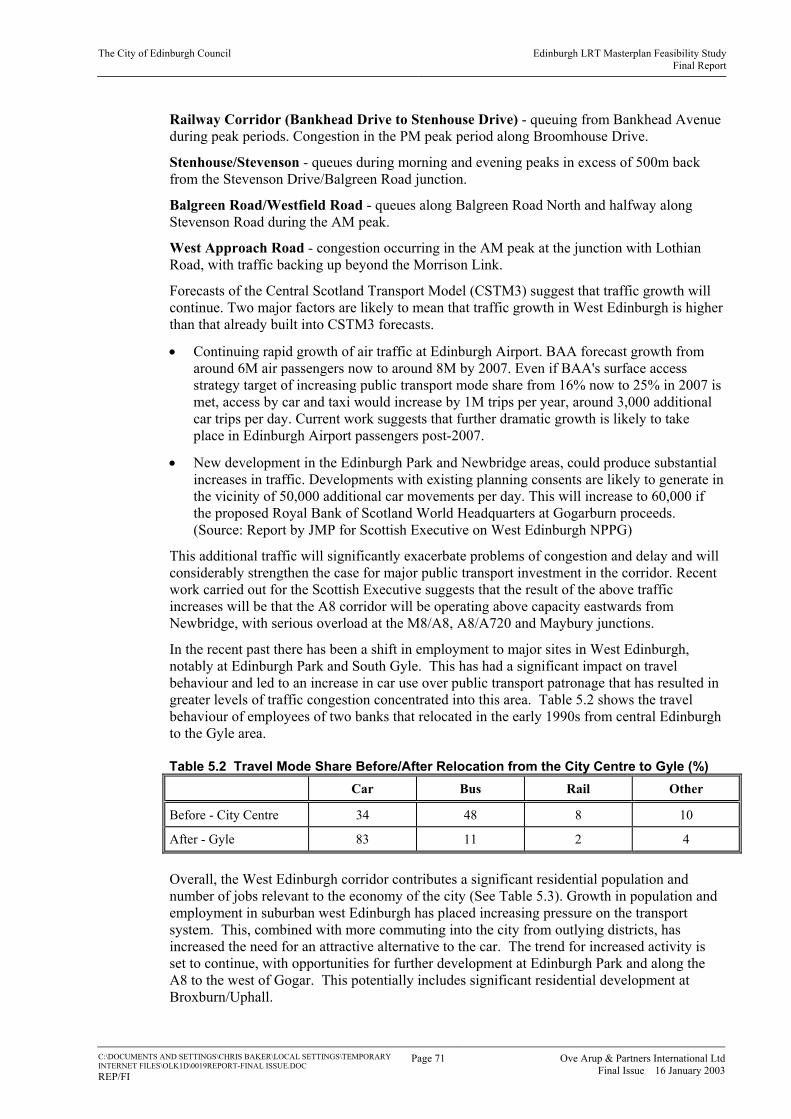
The City of Edinburgh Council Edinburgh LRT Masterplan Feasibility StudyFinal Report
C:\DOCUMENTS AND SETTINGS\CHRIS BAKER\LOCAL SETTINGS\TEMPORARY INTERNET FILES\OLK1D\0019REPORT-FINAL ISSUE.DOC REP/FI
Page 71 Ove Arup & Partners International LtdFinal Issue 16 January 2003
Railway Corridor (Bankhead Drive to Stenhouse Drive) - queuing from Bankhead Avenue during peak periods. Congestion in the PM peak period along Broomhouse Drive.
Stenhouse/Stevenson - queues during morning and evening peaks in excess of 500m back from the Stevenson Drive/Balgreen Road junction.
Balgreen Road/Westfield Road - queues along Balgreen Road North and halfway along Stevenson Road during the AM peak.
West Approach Road - congestion occurring in the AM peak at the junction with Lothian Road, with traffic backing up beyond the Morrison Link.
Forecasts of the Central Scotland Transport Model (CSTM3) suggest that traffic growth will continue. Two major factors are likely to mean that traffic growth in West Edinburgh is higher than that already built into CSTM3 forecasts.
• Continuing rapid growth of air traffic at Edinburgh Airport. BAA forecast growth from around 6M air passengers now to around 8M by 2007. Even if BAA's surface access strategy target of increasing public transport mode share from 16% now to 25% in 2007 is met, access by car and taxi would increase by 1M trips per year, around 3,000 additional car trips per day. Current work suggests that further dramatic growth is likely to take place in Edinburgh Airport passengers post-2007.
• New development in the Edinburgh Park and Newbridge areas, could produce substantial increases in traffic. Developments with existing planning consents are likely to generate in the vicinity of 50,000 additional car movements per day. This will increase to 60,000 if the proposed Royal Bank of Scotland World Headquarters at Gogarburn proceeds. (Source: Report by JMP for Scottish Executive on West Edinburgh NPPG)
This additional traffic will significantly exacerbate problems of congestion and delay and will considerably strengthen the case for major public transport investment in the corridor. Recent work carried out for the Scottish Executive suggests that the result of the above traffic increases will be that the A8 corridor will be operating above capacity eastwards from Newbridge, with serious overload at the M8/A8, A8/A720 and Maybury junctions.
In the recent past there has been a shift in employment to major sites in West Edinburgh, notably at Edinburgh Park and South Gyle. This has had a significant impact on travel behaviour and led to an increase in car use over public transport patronage that has resulted in greater levels of traffic congestion concentrated into this area. Table 5.2 shows the travel behaviour of employees of two banks that relocated in the early 1990s from central Edinburgh to the Gyle area.
Table 5.2 Travel Mode Share Before/After Relocation from the City Centre to Gyle (%) Car Bus Rail Other
Before - City Centre 34 48 8 10
After - Gyle 83 11 2 4
Overall, the West Edinburgh corridor contributes a significant residential population and number of jobs relevant to the economy of the city (See Table 5.3). Growth in population and employment in suburban west Edinburgh has placed increasing pressure on the transport system. This, combined with more commuting into the city from outlying districts, has increased the need for an attractive alternative to the car. The trend for increased activity is set to continue, with opportunities for further development at Edinburgh Park and along the A8 to the west of Gogar. This potentially includes significant residential development at Broxburn/Uphall.

The City of Edinburgh Council Edinburgh LRT Masterplan Feasibility StudyFinal Report
C:\DOCUMENTS AND SETTINGS\CHRIS BAKER\LOCAL SETTINGS\TEMPORARY INTERNET FILES\OLK1D\0019REPORT-FINAL ISSUE.DOC REP/FI
Page 72 Ove Arup & Partners International LtdFinal Issue 16 January 2003
Table 5.3 Population & Employment for Wards in the West Edinburgh Corridor
Ward Name Population No. of employee jobs (1998)
Dalmeny/Kirkliston 7700 10900
Gyle 8200 9700
Sighthill 9900 15100
S.E. Corstorphine 7800 2300
N.E. Corstorphine 8100 1800
Stenhouse 7800 500
Moat 7000 6000
Murrayfield 7700 11100
Shandon 7100 2300
Dalry 7200 8600
TOTALS 78500 68300 Source: Population figures from GROS -mid-2000 estimates Employment from National Statistic website - 1998 figures
5.2 The West Edinburgh Busway Scheme (WEBS) Funds have been allocated for this scheme, which is being designed. It forms a possible tram alignment. It comprises a series of bus priority measures at junctions, bus lanes on key lengths of the main radial corridor and a guideway section parallel to the main Edinburgh to Glasgow railway line. In total the scheme includes over 7 km of bus lane, over 3 km of guideway and in excess of 20 priority measures at junctions.
The priority route offers journey time benefits over congested sections of highway, particularly around Gogar and South Gyle and routes into the city centre. WEBS will directly serve Edinburgh Park and the Gyle area, significantly upgrading the quality and reliability of bus links to this important area and supporting further development at Edinburgh Park, South Gyle and Sighthill. It will provide high quality interchange with a new railway station at Edinburgh Park and will enhance the public transport system for existing residential areas of South Gyle, Broomhouse, Carrick Knowe and Saughton. It also offers potential for improved bus links to Edinburgh Airport, the new park and ride site at Ingliston and, subject to planning approval, the new Royal Bank of Scotland Headquarters at Gogarburn.
Earlier studies for the WEBS project proposed an enhanced concrete slab to minimise the disruption and cost should the WEBS route be upgrade to tramway. The West Edinburgh Tram costs quoted in this report take no account of the savings that would arise if the guideway were to be converted to tramway. The cost of providing a basic guideway is attributable to the WEBS proposal and, therefore, represents a saving to the tram scheme of £1.4m. However, the additional cost of installing an enhanced track slab is hard to identify without detailed work but could be considered as part of the tram scheme cost.
Any disruption to WEBS on conversion to tramway could be almost fully eliminated if the tram rails were also to be laid as part of the WEBS project. This should be further considered in due course.

The City of Edinburgh Council Edinburgh LRT Masterplan Feasibility StudyFinal Report
C:\DOCUMENTS AND SETTINGS\CHRIS BAKER\LOCAL SETTINGS\TEMPORARY INTERNET FILES\OLK1D\0019REPORT-FINAL ISSUE.DOC REP/FI
Page 73 Ove Arup & Partners International LtdFinal Issue 16 January 2003
5.3 The West Edinburgh Tram
5.3.1 Options
The corridor defined by CEC indicates an alignment from the city centre to the south of, and then along, the A8 corridor to Newbridge. However, there are alignment choices and options for initial phases of the scheme to terminate at Edinburgh Park, Gogarburn or Edinburgh Airport before extending to Newbridge. Possible extensions on to Livingston or Queensferry may also be considered as later phases of development.
The choice of alignment for West Edinburgh was influenced by the desire to provide access to key development sites, including Edinburgh Park and Edinburgh Airport, and to remain consistent with WEBS proposals that CEC are pursing. In considering alternative alignments we took account of the implementation of WEBS and the fact that it could compete with LRT if retained. A route summary is shown in Figure 5.1.
From the western end of the route, an alignment close to the A8 was preferred for ease of access to Edinburgh Airport, the new Royal Bank of Scotland headquarters at Gogarburn and other potential development sites. In addition, access to Edinburgh Park dictated an alignment north of the main Glasgow-Edinburgh rail line where it crosses the Edinburgh Bypass. The alignment options to the west of Gogar roundabout are, therefore, fairly flexible and alternative route options from Edinburgh Airport to Gogar could be chosen.
The alternative to crossing the A8 to gain access to Edinburgh Park would be to run along Corstorphine Road into the city centre. This was discussed above under Phase 1 appraisal work but problems of road space allocation and bus competition mean that the WEBS alignment that parallels the railway line is preferred. A street alignment further to the south would also compete with the A71 Greenway; the segregated alignment available provides direct access to the western fringes of the city centre and allows stops close to existing crossings of the railways.
There are several options for the future extension of the West Edinburgh tramway beyond an initial terminus between Edinburgh Park and Newbridge. Links to the west or north could provide direct access to Livingston via Broxburn or South Queensferry/Dalmeny Station via Kirkliston. Either link would widen the scope for park and ride and interchange providing greater accessibility for communities further afield from Edinburgh. This is likely to become increasingly important with the expected growth in inward commuting.
The scheme to Newbridge would improve public transport services for an immediate catchment population in excess of 78,000 in addition to serving city centre areas, and through park and ride to a significant part of West Lothian and parts of Fife, Falkirk and Lanarkshire. WEBS and West Edinburgh Tram also serve three of the core development areas identified in the Edinburgh and the Lothians Structure Plan, those of Central West Lothian, Newbridge/Kirkliston/Ratho and Edinburgh Park/South Gyle/Sighthill. Together, these have a housing allocation of around 8,000 dwellings. Although the draft West Edinburgh NPPG rules out major non-airport development before 2020, development already committed will create over 20,000 new jobs in the tram corridor, while the proposed major expansion of Edinburgh Airport’s traffic will create major additional demands for surface access. The provision of improved public transport links to these areas will help to support future development.
5.3.2 Chosen Alignment
From a junction with the North Edinburgh Tram route west of Haymarket, the current preferred tram alignment to Edinburgh Park parallels the route of the Edinburgh-Glasgow railway. Over the section of route where WEBS would be on guideway, the tramway alignment adopts the route of this guideway. To the west of Edinburgh Park station the proposed route turns north to pass through the business park and runs adjacent to the Gyle Shopping Centre before turning west adjacent to the A8 Glasgow Road.
The City of Edinburgh Council Edinburgh LRT Masterplan Feasibility StudyFinal Report
C:\DOCUMENTS AND SETTINGS\CHRIS BAKER\LOCAL SETTINGS\TEMPORARY INTERNET FILES\OLK1D\0019REPORT-FINAL ISSUE.DOC REP/FI
Page 74 Ove Arup & Partners International LtdFinal Issue 16 January 2003
[Insert Figure 5.1 – West Edinburgh Line]

The City of Edinburgh Council Edinburgh LRT Masterplan Feasibility StudyFinal Report
C:\DOCUMENTS AND SETTINGS\CHRIS BAKER\LOCAL SETTINGS\TEMPORARY INTERNET FILES\OLK1D\0019REPORT-FINAL ISSUE.DOC REP/FI
Page 75 Ove Arup & Partners International LtdFinal Issue 16 January 2003
Due to constraints imposed by the Royal Bank of Scotland on redevelopment of Gogarburn Hospital, the route will need to cross to the north of the A8 east of the hospital site. Access to Edinburgh Airport would be provided directly to the terminal building. Park and Ride would also feature as part of the overall scheme through the identified site at Ingliston and/or a site near Newbridge.
The following key factors affect the chosen alignment of the West Edinburgh Line:
i) Newbridge. This was assumed be the western limit of the route, unless the line were to be shortened to terminate at Edinburgh Airport or extended to run northwards along the disused railway line to Kirkliston and/or South Queensferry. It could also be extended west to Broxburn, Uphall or Livingston. There are major developments proposed to the NW and SW of Newbridge, which may necessitate a future review of the proposed location of the terminals. For testing the scheme, the terminus was assumed to be at Lochend Road, NE of the A8 roundabout.
ii) Park and Ride Sites. It is important that adequate Park and Ride Sites are provided to maximise the patronage on the system and the benefits arising from congestion relief. On the West Edinburgh Line three Park and Ride Sites were considered:
• To the east of Newbridge, between the tram alignment and the A8. This site, allowing for landscaping bunds to shield adjacent properties, could accommodate approximately 700-800 cars.
• To the east of the existing access road to Edinburgh Airport (Eastfield Road). The size of this site would be dependant on which alignment option (A or B) was selected but could accommodate 1,000 to 2,000 cars.
• At the end of the spur from the alignment at Hermiston Junction of the M8/City of Edinburgh Bypass. To gain access to this site extensive viaduct and bridge works are necessary. For this reason, together with the operations complications arising from operating a spur route, this site seems unlikely to have an adequate cost/benefit ratio unless the spur were to be extended to Heriot Watt University’s campus.
iii) Edinburgh Airport. The tram route runs along the southern perimeter of the Airport, to the North of the Royal Highland Showground, with stops at the showground, outside the Airport Terminal, and at the Park and Ride site near the A8. The precise layout of the tramway needs to be finalised in conjunction with development plans for the Airport (taking account of the Department for Transport’s plans for the future of UK Airports). Options have been publicised in a National Consultation set of documents issued in July 2002. It should be noted that all of the options for development of the Airport focus the main core airport works to the North, clear of any direct impact on the tram alignment. The principal effects of the development on the tram alignment are whether the Royal Highland Showground is to be retained and where extra ancillary facilities such as car parks/hotels/office accommodation would be located. None of these is critical for its location, so should not severely affect or prejudice the feasibility of obtaining a suitable alignment for the tram. On the contrary, the provision of an efficient and conveniently located tramway could assist redevelopment if it is incorporated in the Airport’s plans at a sufficiently early stage.
iv) Royal Bank of Scotland Site. The RBS propose a new Headquarters development to the south of the A8 on the site of the former Gogarburn Hospital. This will be major development, with 3,250 employees on site. Discussions have taken place with RBS staff and their consultants to review possible schemes for integration of the tramway and the RBS development. From integration and patronage aspects it would have been desirable to have the tramway (and a tramstop) immediately adjacent to the RBS development, to the South of the A8. However, it has not yet been possible to get any agreement to this and RBS prefer the tram route to stay to the North of the A8 at this

The City of Edinburgh Council Edinburgh LRT Masterplan Feasibility StudyFinal Report
C:\DOCUMENTS AND SETTINGS\CHRIS BAKER\LOCAL SETTINGS\TEMPORARY INTERNET FILES\OLK1D\0019REPORT-FINAL ISSUE.DOC REP/FI
Page 76 Ove Arup & Partners International LtdFinal Issue 16 January 2003
location. Further consultations should be undertaken with RBS to endeavour to obtain their agreement to integration of the tramway into their site. This would avoid additional walking distances of 200 to 300 metres from tramstop to RBS site, and the need to cross over the A8 on a walkway/footbridge.
v) Gogar Roundabout. A number of alignment options were considered at Gogar Roundabout, taking account of adjacent options (such as whether to be N or S of the A8 at the RBS Site) and of possible links to a Northern Section of the Orbital route. Whilst at-grade and grade-separated options have been considered, the latter would seem to be the preferable option because of the considerable road congestion at this location and the consequent disruption to tram operation.
vi) Edinburgh Park to Murrayfield. On this section of the route the alignment is alongside the existing Glasgow to Edinburgh railway line, to the South of the railway at the west end, and to the north at the east end, with the crossover point at the western edge of Carrick Knowe Golf Course. It should be noted that the proposed alignment to the East of Balgreen Road runs to the North of the railway, at the bottom of the gardens along the Southern side of Baird Drive. This is a particularly sensitive issue because undertakings were given not to locate the CERT alignment there. Unfortunately, the alignment constraints for the tram necessitate its being located north of the railway at this location.
vii) Murrayfield to Haymarket Station. Immediately to the East of the ‘Water of Leith’, the alignment descends to grade with a tram stop as far to the west as possible to maximise its distance from the Stadium and hence to permit the introduction of crowd control measures. To the South East of Murrayfield Stadium the alignment continues along Roseburn Street to its junction with Roseburn Terrace, then follows Roseburn Terrace to join the North Edinburgh line immediately to the West of Haymarket Station. Consideration should be given to realigning the North Edinburgh Line from where it crosses over Roseburn Terrace to Haymarket Station so that it runs along the route of the West Edinburgh Line, which could save several million pounds. This could be achieved by diverting the proposed North Edinburgh Line via Roseburn Terrace using the CEC owned land to the northeast of the bridge carrying the existing North Edinburgh route over Roseburn Terrace.
Route alignments and the locations of bridges and the proposed tram stops were discussed during the course of the study. Indicative structure drawings are included in Appendix C.
5.3.3 Hermiston Gait Branch
A possible spur off the West Edinburgh Line to Hermiston Gait is identified in the Study Brief to serve a site for Park and Ride. This corresponds to a location previously identified by CEC for strategic Park and Ride. The site is adjacent to Heriot Watt University and the spur could also provide a direct link from the university to the city centre. The Park and Ride site would be accessed from the A71 with close links to the M8 and A720 Edinburgh Bypass.
Although this is a good strategic location for Park and Ride, its position makes access by tram particularly difficult from the proposed West Edinburgh Line. The nearest point of connection is immediately west of the new Edinburgh Park rail station, adjacent to the M8/A720 Hermiston Gait interchange. To gain access to the Park and Ride site, the alignment must cross the main carriageways and the associate slip roads. It would also need to cross the A71 and the Union Canal, which itself is elevated over the Edinburgh Bypass (Scott Russell Aqueduct). The cost of the necessary structures would be very high. The alignment would be constrained by the Royal Mail processing centre to the east of the bypass. The alternative, a spur off the West Edinburgh route north of the M8, would significantly increase the branch length and still involves crossing the motorway and Union Canal, possibly using Gogar Station Road. All these options would entail significant extra cost.

The City of Edinburgh Council Edinburgh LRT Masterplan Feasibility StudyFinal Report
C:\DOCUMENTS AND SETTINGS\CHRIS BAKER\LOCAL SETTINGS\TEMPORARY INTERNET FILES\OLK1D\0019REPORT-FINAL ISSUE.DOC REP/FI
Page 77 Ove Arup & Partners International LtdFinal Issue 16 January 2003
Also, the spur would either need a dedicated service in addition to the Newbridge service, at extra cost, or involve diversion of part of the Edinburgh Airport and Newbridge service. Consequently, the branch was not considered further.
5.3.4 Structures
Since the West Edinburgh Line is predominantly segregated to the west of Murrayfield, apart from a few at-grade crossings of minor roads, a number of bridges/viaducts are needed to cross major roads/railways or waterways. In total some 8 to 12 structures are needed, ranging from 12m to 190m long. The number of bridges depends on the option selected and on whether there are at-grade crossings of minor roads.
5.3.5 Depot
The depot should, ideally, be located as near the middle of the route as possible so that operation flexibility is maximised and there is the minimum of non-revenue mileage. Unfortunately, the built-up nature of the eastern end of the line means that there is no suitable site available on this part of the route, other than by property demolition or by taking part of Carrick Knowe Golf Course – neither of which would be desirable, but it should be noted that acquisition of part of the Golf Course was proposed for the CERT Project.
Therefore, the depot site would either need to be west of Gogar roundabout or could be on the spur leading to the Park and Ride site near the Hermiston Campus of Heriot Watt University. For the present, only sites west of Gogar roundabout are considered.
Whilst there are substantial open spaces along the route to the west of Gogar roundabout that might be suitable for a depot site, the presence of the following significantly reduce the options available:
• Edinburgh Airport (allowing space for expansion of the Airport and associated facilities such has Hotels);
• Royal Highland Showground;
• proposed Park and Ride sites;
• Castle Gogar and associated listed lodge and driveway;
• Gogar Church and Glebe Lands to the South West of Gogar farm (known Archaeological Site).
Even without conflicting with any of the above sites, it should be noted that the remaining feasible sites to the East of the Airport are all ‘Green Belt’ areas of Class 2 Agricultural Land, so significant environmental issues will need to be satisfactorily resolved prior to permission for their use as a depot site.
Notwithstanding these environmental issues, the optimum site for a depot would seem to be to the East of the proposed Park and Ride site on the Eastern side of the access road to the Airport (Eastfield Road). Should the above site not be available, an alternative site to the West of Ingliston Market seems to be the most suitable site.
The preferred depot site for the North Edinburgh Line, near the Port of Leith’s Albert Dock, only has tram access at the West end and is quite constrained. Consideration should be given to reducing the scale of, or eliminating, the North Edinburgh Depot, which would release this potentially valuable / expensive site for other uses whilst only slightly increasing the overall size requirements for the West Edinburgh Depot. A detailed evaluation of the benefits / disbenefits would be needed, but a minimal facility comprising stabling for 5-10 trams and a single track un-pitted building with limited staff facilities could be considered.

The City of Edinburgh Council Edinburgh LRT Masterplan Feasibility StudyFinal Report
C:\DOCUMENTS AND SETTINGS\CHRIS BAKER\LOCAL SETTINGS\TEMPORARY INTERNET FILES\OLK1D\0019REPORT-FINAL ISSUE.DOC REP/FI
Page 78 Ove Arup & Partners International LtdFinal Issue 16 January 2003
5.3.6 Land Area Required
The area of land needed for the West Edinburgh Line other than within highway boundaries is estimated to be 162,000m² of which about 34,000m² is alongside railway alignment and is assumed to belong to Railtrack. A notional cost for this land is included in our construction cost estimate.
5.4 Demand and Revenue This section summarises the demand and revenue forecasts from CSTM3 for the West Edinburgh Line and the additional demand and revenue from developments and Park and Ride along the corridor that are not included in the model.
In addition to annual demand and revenue projections for LRT, average trip length on LRT and annual revenue forecasts are given. Demand and revenue are built up from model (i.e. CSTM3) output, development-related trips and Park and Ride trips.
Table 5.4 presents the daily and annual demand for the West Edinburgh Line. Development trips are included for the CSTM3 forecast year of 2011. The assumed development areas include the following:
• Edinburgh Park – expansion; • Royal Bank of Scotland at Gogarburn – new headquarters; • Edinburgh Airport – developments and growth; • Newbridge – business and commercial development.
Park and Ride is assumed at the site adjacent to the Royal Highland Showground. An additional location to the east of Edinburgh Airport was identified but only one site was included in the demand projections.
The CSTM3 forecasts show a longer average trips length for trips West of Edinburgh Line consistent with a significant proportion of trips to the city centre. There are also a considerable number of trips outbound to Edinburgh Park in the morning peak period. This contra-peak movement is consistent with many of the additional development trips.
Table 5.5 provides forecasts of peak demand on the line and a peak line loading for comparison with line capacity. At 10 tph the hourly capacity is 1,800. Assuming a peak within the peak hour equivalent to 50% of the peak hour demand in a 20 minute period, this approximates to a tram peak load factor of 104% in the forecast year.
Table 5.6 shows the forecast transfer from car to tram based on changes in total car and public transport trips. The area-wide mode shift is modest and can be expected to be greater in the local area served by the line.
Table 5.4 Demand and Revenue (2011) West Edinburgh Tram
Modelled Trips
Development Trips
Park and Ride Trips TOTAL
Daily Demand 9,276 2,880 946 13,102 Average Trip Length (kms) 9.79 Annual Demand (M) 2.968 0.922 0.286 4.176 Annual Revenue (£M) 4.422 1.087 0.500 6.009

The City of Edinburgh Council Edinburgh LRT Masterplan Feasibility StudyFinal Report
C:\DOCUMENTS AND SETTINGS\CHRIS BAKER\LOCAL SETTINGS\TEMPORARY INTERNET FILES\OLK1D\0019REPORT-FINAL ISSUE.DOC REP/FI
Page 79 Ove Arup & Partners International LtdFinal Issue 16 January 2003
Table 5.5 Peak Demand West Edinburgh Tram Trips
AM Peak Hour Modelled Trips 1,174 AM Peak Hour Development Trips 222 AM Peak Hour Park and Ride Trips 379 Peak Loading 1,250
Table 5.6 Mode Split West Edinburgh Tram
Do-Minimum Do-Something % Change
Car 24,985 24,382 -2.4% Public Transport 1,758 1,983 +12.8% PT Mode Share 6.6% 7.5% +13.6%
5.5 Environmental Issues
5.5.1 Population and Employment
In terms of overall population distribution, there is a definite concentration around the western fringes of the City (Saughton, Murrayfield), with very few people resident within the Green Belt area to the west of the Edinburgh. Reasons for this include the fact that, as well as being Green Belt land, this area also serves as the location of Edinburgh International Airport and other areas of industry.
5.5.2 Air Quality, Noise, and Vibration Constraints
The West Edinburgh Line forecasts demonstrate that the benefits of the scheme will mostly be felt towards the city centre end. The Haymarket area is within the AQMA and the scheme should contribute to an overall reduction in air emissions.
Reductions in noise may result in improvements to the amenity of adjacent areas, and this would be particularly appreciated in Conservation Areas towards the City Centre. However, noise impacts are not expected to be significant as a whole across the route catchment.
5.5.3 Ecology and Landscape Variables
Primary Constraints The only primary ecology and landscape constraint along the route is a Historic Garden and Designed Landscape at Millburn Tower. Two alignment options pass near to the edge of this site, the preferred alignment passes to the north.
Secondary Constraints
The tram route runs in designated Greenbelt area between the western end at the M9 and the City bypass. Two of the alignment options transect the Area of Outstanding Landscape Value (AOLV) at Gogar Park, and clip the edge of the AOLV at Millburn Tower. Millburn Tower is also designated as an area of Long Established Woodland. These environmental considerations should be taken into account when finalising the route. The other two options clip the edge of Gogar Park.

The City of Edinburgh Council Edinburgh LRT Masterplan Feasibility StudyFinal Report
C:\DOCUMENTS AND SETTINGS\CHRIS BAKER\LOCAL SETTINGS\TEMPORARY INTERNET FILES\OLK1D\0019REPORT-FINAL ISSUE.DOC REP/FI
Page 80 Ove Arup & Partners International LtdFinal Issue 16 January 2003
5.5.4 The Built Environment
Primary Constraints The tram route’s eastern end runs through Conservation Areas and the city centre World Heritage Site. There are several Listed Buildings is this area also. However, there are no further examples of these constraints along the rest of the route. The West Edinburgh Line crosses five rights of way along the route.
The Hermiston Gait Park and Ride branch crosses the Union Canal, which is a Scheduled Ancient Monument and right of way.
The alignment options that cross the A8 to the west of Gogar roundabout also clip the edge of a Scheduled Ancient Monument at Gogar. The remaining options run adjacent to this feature.
Secondary Constraints
The proposed tram route crosses seven cycle routes, and cycle routes run alongside the proposed tram route at two locations. The tram route crosses the Water of Leith Walkway at Murrayfield. The easternmost alignments through Gogar link in to a further cycle route at South Gyle.
5.6 Integration In addition to being integrated with important land use developments, the West Edinburgh tram is unique in offering interchange with bus, rail, air and Park and Ride. This could have a significant impact on patronage and opportunities for feeder services to widen the catchment for tram. The direct, segregated alignment would provide good access to interchange facilities in the city centre as well as connections at key locations in the corridor.
In addition to serving Waverley and Haymarket stations, the tram could also serve a dedicated interchange with train services at the new Edinburgh Park station. The high frequency bus interchange would be provided at St. Andrew Square and at the Gyle, where services along the A8 and other local routes serving the shopping centre could act as feeders to tram.
The route of the West Edinburgh Line is defined to give direct access to Edinburgh Airport with a stop immediately adjacent to the terminal entrance. The tram should, therefore, act as feeder mode from the airport to Edinburgh Park and the city centre. It will be important to provide a very high quality and fully accessible interchange at the airport consistent with air passengers’ expectations. This should focus on access with luggage, comfort and security. Real time passenger information and simple ticketing would also help make the tram attractive.
Although a number of possible Park and Ride sites exist, they focus on easy access from the A8 and would offer an attractive alternative to the congested route into the city centre from Gogar. In order to the successful, the Park and Ride site should be well designed to minimise transfer time and must represent value for money when the tram fare is compared with parking and other car travel costs. Security at the site will be a prime concern for travellers as will a reliable regular service with simple ticketing and comfortable facilities.
5.7 Tram Operations and Car Requirements
5.7.1 Run Times
The route selected for Phase 2 testing was defined as Newbridge (Lochend Road) to St. Andrew Square via the alignment described above. The peak level of service as assumed to be 10 tph for demand and revenue forecasting. The Arup Runtime model was used to define the “all out” stop to stop times for the alignments and stop locations discussed during the

The City of Edinburgh Council Edinburgh LRT Masterplan Feasibility StudyFinal Report
C:\DOCUMENTS AND SETTINGS\CHRIS BAKER\LOCAL SETTINGS\TEMPORARY INTERNET FILES\OLK1D\0019REPORT-FINAL ISSUE.DOC REP/FI
Page 81 Ove Arup & Partners International LtdFinal Issue 16 January 2003
study. Additional time was allowed for normal operating contingencies (recovery) and for junction delays. The calculations are reported in Appendix A. The resulting times are as follows:
Lochend Rd-St. Andrew Sq. run time: 29 min:38 secs, i.e. 32 minutes including recovery
Minimum round trip time: 64 minutes
Add layover time 6 minutes x 2: 76 minutes
5.7.2 Service Pattern
For the Phase 2 demand forecasts and appraisal, peak service of 10 tph was assumed for a line operating St. Andrew Square-Newbridge with no short workings. Since the line was tested as a free-standing scheme, the opportunities for through running with other routes were not exploited for the test.
5.7.3 LRV Requirements
These run times imply the need for 13 LRVs at 10 tph level of service. In addition, 10% spare cars are generally needed to provide for maintenance requirements; this implies that 1.3 cars are needed which would be appropriate if the West Edinburgh Line were part of a larger network. As a free-standing route, however, it would require 2 LRVs spare given a total fleet of 15 cars.
5.7.4 Operating Costs
The O&M cost for the West Edinburgh Line was based on the standard level of service adopted for Phase 2 and described in an earlier section. The total annual car kms for the 16.26km route (Newbridge-St. Andrew Square) was multiplied by the cost per car km as follows:
1.522M car kms/year x £3.15/car km = £4.79M/year.
5.8 Costs The construction cost for the West Edinburgh Line is based on the alignment defined for Newbridge to Haymarket and the alignment already defined for the North Edinburgh Line from Haymarket to St. Andrew Square via Princes Street. Therefore, the costs refer to the 16.36 km from Newbridge to St. Andrew Square as a free-standing route. The costs for the common section of route are discussed later in this report.
The £155.2M represents a construction cost per route km of £9.49M. Trackwork and land costs represent 39% of the construction cost. This excludes depot costs.
In addition to construction costs in Table 5.7, there would be the cost of 15 trams assessed at £24M and a depot at the cost of £8M giving a total cost for the West Edinburgh Line, if implemented on its own, of £187.18M.

The City of Edinburgh Council Edinburgh LRT Masterplan Feasibility StudyFinal Report
C:\DOCUMENTS AND SETTINGS\CHRIS BAKER\LOCAL SETTINGS\TEMPORARY INTERNET FILES\OLK1D\0019REPORT-FINAL ISSUE.DOC REP/FI
Page 82 Ove Arup & Partners International LtdFinal Issue 16 January 2003
Table 5.7 Outline Construction Cost of the West Edinburgh Tram Route Category of Work Total £M
Earthworks/Landscaping, etc. 4.97 Structures 5.78 Trackwork 39.64 Highways Work 5.25 Substations and OHLE 7.92 Tramstops 3.25 Park and Ride 3.00 Signalling and Control Equipment 2.10 Utility Diversions 5.28 Commissioning 2.00 Land 21.32 Railtrack 6.50 Other items 10.69 Client Costs – 10% Design and Site Supervision – 15% 37.48 Allowance for Contingencies – 10% TOTAL 155.18
5.9 Appraisal The West Edinburgh Line was subject to a STAG initial assessment in Phase 1 and the resulting AST is included in this report. The Phase 2 tests of the scheme described above yield the following key results. The main financial projections are:
Capital cost £187.20M O&M cost £4.79M per year Revenue £6.01M per year Operating ratio 1.25
Therefore, the Phase 2 appraisal indicates that the line could cover its operating costs but has a relatively high construction cost and a significant funding gap. It must be emphasised that both O&M costs and revenues are highly sensitive to change in forecasting assumptions, O&M costs are determined by the level of service offered while revenue is based on existing bus fares with no premium for higher quality service, a 10% premium might be reasonable which could increase the operating ratio to 1.38.
Our initial assessment of the net benefits of the scheme in a restricted cost benefit analysis gives the following main results:
PV of benefits : +134.9M
PV of costs : -£220.5M
NPV : -£85.6M
The scheme would achieve a modest mode shift across the city as a whole. The reduction in car trips of 603 per day represents a reduction in 0.9M car trips per year contributing to environmental improvement and decongestion.

The City of Edinburgh Council Edinburgh LRT Masterplan Feasibility StudyFinal Report
C:\DOCUMENTS AND SETTINGS\CHRIS BAKER\LOCAL SETTINGS\TEMPORARY INTERNET FILES\OLK1D\0019REPORT-FINAL ISSUE.DOC REP/FI
Page 83 Ove Arup & Partners International LtdFinal Issue 16 January 2003
6. SOUTH EAST EDINBURGH LINE
6.1 Context Transport issues in southeast Edinburgh are related mainly to travel to and from the city centre, and the spread of trips to and from non-central areas using a number of parallel routes. These two important travel markets give rise to significant congestion on roads approaching the Old Town area to the south of Waverley Station.
Three principal routes provide radial access from junctions on the A720 Edinburgh Bypass:
• A7 Dalkeith Road from Sheriffhall Junction south of Danderhall;
• A772 Gilmerton Road from Gilmerton Junction (westbound on-slip and eastbound off slip only);
• A701 Liberton Road from Straiton Junction south of Burdiehouse.
Together these routes comprise one of the key radial corridors in Edinburgh and a major route into the city from Midlothian, East Lothian and beyond. Travel from Dalkeith, Bonnyrigg/Lasswade, Newtongrange, Gorebridge, Loanhead and Penicuik all feed into this corridor. Currently the parallel routes of the A7 and the A701 just north of Cameron Toll carry a two-way traffic flow of over 5,000 vehicles in the morning peak period.
The significant development opportunities that are being realised in the corridor will place additional pressure on the local transport infrastructure. The New Royal Infirmary of Edinburgh (NRIE) is not yet fully operational but contributes additional peak hour traffic as well as a significant number of trips throughout the day. Future developments adjacent to the NRIE south and east of Danderhall and south of Craigmillar will generate a large number of extra trips. A significant proportion of these new trips will be to or from the city centre.
Gilmerton Road joins Liberton Road at Nether Liberton adjacent to the Cameron Toll Shopping Centre and from here northwards the degree of frontage development and commercial activity increases. This leads to pressure on the local highway network from loading and frontage access to commercial properties. This can cause problems for buses and further delay to general traffic.
North of Cameron Toll, two parallel routes carry significant volumes of traffic into the city centre. The principal route, from Clerk Street to North Bridge, is congested throughout the day. The parallel route of St. Leonard’s Street and Pleasance is less heavily trafficked but peak period congestion also occurs.
In the recent past there has been a significant shift in employment to major sites outside the centre of Edinburgh, notably to the west, southeast and Waterfront areas. This trend is set to continue as development pressures focus on providing access to employment growth from a more widespread residential population. This has had a significant impact on travel behaviour and promoted an increase in car use over public transport patronage resulting in greater levels of traffic congestion. With significant developments planned for the South East Wedge and around the New Royal Infirmary for Edinburgh, the impacts on traffic will become more acute in the southeast sector of the city. Table 6.1 presents the population and employment figures for wards in the vicinity of the proposed tram route.

The City of Edinburgh Council Edinburgh LRT Masterplan Feasibility StudyFinal Report
C:\DOCUMENTS AND SETTINGS\CHRIS BAKER\LOCAL SETTINGS\TEMPORARY INTERNET FILES\OLK1D\0019REPORT-FINAL ISSUE.DOC REP/FI
Page 84 Ove Arup & Partners International LtdFinal Issue 16 January 2003
Table 6.1 Population & Employment for Wards in the South East Edinburgh Corridor Ward Name Population No. of employee jobs (1998)
Holyrood 7,000 15,800 Southside 8,000 4,700 Prestonfield 8,100 1,300 Newington 8,200 n/a Alnwickhill 8,200 600 Craigmillar 7,800 5,600 Moredun 8,000 n/a Gilmerton 8,200 600 TOTALS 63,500 28,600 Sources: Population figures from GROS -mid-2000 estimates Employment from National Statistic website - 1998 figures
The Central Scotland Transport Model (CSTM3) suggests that traffic growth will continue, partly through increased activity and growth in the Edinburgh economy and also through an increase in car ownership. In addition to these wider economic factors, significant additional development in the area is likely to mean that traffic growth in South East Edinburgh will be higher than that already built into CSTM3 forecasts.
There are several key developments that will affect future traffic flows, these are:
• Phase 2 of the NRIE, which opened in January 2002, will be completed in summer 2003, when the transfer from the old facilities at Lauriston Place and in the city centre will be finished. This will provide nearly 900 beds, facilities for non-residential patients and visitors and will employ around 5,000 staff.
• To the north east of the hospital a major housing development is proposed to extend Craigmillar and Niddrie, with access to Kinnaird Park and the new Edinburgh Crossrail station at Newcraighall. To the south east of the hospital a major new community is proposed as part of the development of the South East Wedge area. This will provide around 3,500 dwellings at Shawfair with two new primary schools and a town centre. Two urban extensions to the north and south of Danderhall will provide a further 500 houses. An additional 22 hectares of land is identified for business and industrial use, 9 hectares south of Danderhall and 13 hectares adjacent to Newcraighall. Further land at the former Monktonhall Colliery and adjacent to the Millerhill marshalling yards are also being promoted for development.
• Adjacent to NRIE, a medi-park is to be developed providing additional medical and biotechnology services, employing up to 7,000 people.
The charging regime for parking at the New Royal Infirmary is similar to that employed throughout the city centre and this should support the introduction of extensive public transport services to access the hospital and surrounding developments. Options for park and ride at Newcraighall and Danderhall are also being considered for access to the hospital.
6.2 Alignment A number of choices exist for alignments to the South East. The preferred route is shown in summary on Figure 6.1 and was compared with a route along the A701. Route alignments and the locations of bridges and the proposed tram stops were discussed during the course of the study. Indicative structure drawings are included in Appendix C.

The City of Edinburgh Council Edinburgh LRT Masterplan Feasibility StudyFinal Report
C:\DOCUMENTS AND SETTINGS\CHRIS BAKER\LOCAL SETTINGS\TEMPORARY INTERNET FILES\OLK1D\0019REPORT-FINAL ISSUE.DOC REP/FI
Page 85 Ove Arup & Partners International LtdFinal Issue 16 January 2003
[Insert Figure 6.1 – South East Edinburgh Line]

The City of Edinburgh Council Edinburgh LRT Masterplan Feasibility StudyFinal Report
C:\DOCUMENTS AND SETTINGS\CHRIS BAKER\LOCAL SETTINGS\TEMPORARY INTERNET FILES\OLK1D\0019REPORT-FINAL ISSUE.DOC REP/FI
Page 86 Ove Arup & Partners International LtdFinal Issue 16 January 2003
The catchment areas for tram fall either side of the A7 with most residential development to the West. This offers some opportunity for dedicated roadspace or roadside reservation or the Southern section of the route where there is little or no frontage access. This also supports an alignment close to the new Royal Infirmary, which could include diversion away from the main road to serve the new hospital directly. The parallel route in Gilmerton Road has a much greater level of frontage development and much more constrained roadspace despite providing good access to residential areas. The A7 and Dalkeith Road also offer opportunities for Park and Ride North of the Edinburgh Bypass that would be easy to serve by tram.
Immediately to the east of the A7, a significant residential development with a local centre and other community facilities is planned at Shawfair. This development could yield significant additional demand and an alignment that serves this area directly should be considered. This would be possible from the preferred alignment by the routes east from the new Royal Infirmary to run along the western edge of the development side.
North of Cameron Toll, three route options were identified. The westernmost of these (along Mayfield Road, Causewayside, Buccleuch Street) would have a significant impact on frontage access and much of the route is significantly constrained, which would cause some technical difficulties. The central route (Craigmillar Park, Minto Street, Clerk Street, South Bridge, North Bridge) provides good access to existing facilities and communities, but also has problems of roadspace allocation and frontage access. However, the proposed Leith to Straiton Quality Bus Corridor scheme is also planned for this route. The tram would suffer reliability problems on this route and the connection into the rest of the tram network at North Bridge/Princes Street could be problematical.
The easternmost alignment (Dalkeith Road, St. Leonard’s Street, Pleasance) would have the lowest immediate impact on existing traffic and access and potentially an excellent connection to Princes Street with a stop adjacent to Waverly Station, probably on Waverley Bridge. It would also facilitate a stop close to a new Scottish Parliament building.
While it is possible to combine different sections of these routes, for example via East Preston Street, Cross Causeway or West Richmond Street, this will add journey time and may involve delays associated with crossing traffic streams, unless significant additional traffic management is implemented. A segregated route close to Holyrood Park was considered to be particularly sensitive on environmental grounds and would lead to difficulties in achieving a technical solution through the Canongate area.
The recommended route runs from Danderhall, adjacent to the new development at Shawfair then parallel to the A7 Dalkeith Road past the New Royal Infirmary for Edinburgh to Cameron Toll. To the north, the route runs on street along Dalkeith Road before taking one of a number of optional alignments into the city centre. These options are intended to provide access to the rest of the tram network at one of two points:
• via North Bridge/South Bridge, then Princes Street to St Andrew Square;
• via Pleasance/Market Street/Waverley Bridge to Princes Street.
The choice of Dalkeith Road to the south of Cameron Toll is based on the following:
• it provides the greatest level of segregation and, therefore, should generate the greatest journey time savings;
• it provides easy access to major development sites, including the New Royal Infirmary for Edinburgh, and offers a number of park and ride opportunities;
• it offers the greatest opportunities for future extensions and for interchange with future heavy rail proposals;

The City of Edinburgh Council Edinburgh LRT Masterplan Feasibility StudyFinal Report
C:\DOCUMENTS AND SETTINGS\CHRIS BAKER\LOCAL SETTINGS\TEMPORARY INTERNET FILES\OLK1D\0019REPORT-FINAL ISSUE.DOC REP/FI
Page 87 Ove Arup & Partners International LtdFinal Issue 16 January 2003
• access to park and ride on Gilmerton Road is restricted due to the limited access junction with Edinburgh Bypass and there is less scope for full segregation;
• there is much less opportunity for segregated running alongside Liberton Road;
• loading and access requirements would make street running on Liberton Road more difficult and this route has also been identified for a quality bus corridor.
The detailed alignment of the route south of the hospital will depend on the degree of access that can be afforded to the Shawfair development site, whilst not prejudicing access to existing markets. Future connection to heavy rail services, or extension into Midlothian communities will also be considered and the location of any Park and Ride facilities.
The route includes sections of segregated tram operation and street running. Whilst journey times will be minimised through the maximum use of segregated alignments, the preferred route offers excellent access to residential and commercial areas and to important development sites. The route would be served by a park and ride facility near Danderhall and could, through possible extensions, provide connections to Newcraighall, Musselburgh, Dalkeith and Penicuik. These could allow for further interchange with heavy rail services, via Newcraighall to Edinburgh Crossrail services or to the proposed Waverley Line Borders rail service. Connections to the south are dependent on other studies relating to multi-modal access into Midlothian though they are discussed in outline later.
6.2.1 Land Area Required
The area of land needed for the South East Line other than within highway boundaries is set at 8,000m² if the predominantly street and roadside reserved alignment is followed. If, however, an off-street alignment is followed in the area of the New Royal Infirmary about 34,000m² would be required. A notional cost for this land is included in our construction cost estimate.
6.3 Demand and Revenue This section summarises the demand and revenue forecasts from CSTM3 for the South East Edinburgh Line and the additional demand and revenue from developments and Park and Ride along the corridor that are not included in the model.
In addition to annual demand projections for LRT, average trip length on LRT and annual revenue forecasts are given. Demand and revenue are built up from model (i.e. CSTM3) output, development-related trips and Park and Ride trips.
Table 6.2 gives the daily and annual forecasts of demand for the South East Edinburgh Line. Projected development-related trips are included for the CSTM3 forecast year of 2011. The assumed developments included in the demand estimates are as follows:
• Shawfair – residential and community development;
• New Royal Infirmary – hospital development not included in CSTM3;
• Craigmillar – medi-park and related business development.
Park and Ride is assumed to be provided at a single site south of Danderhall at a location conveniently accessed from Sheriffhall Interchange.
The CSTM3 modelled forecasts show that flows inbound to the city centre dominate, including destinations in the New Town and Old Town. Average trip length is relatively short due to the more concentrated development close to the city centre and a number of trips destined for the Old Town.

The City of Edinburgh Council Edinburgh LRT Masterplan Feasibility StudyFinal Report
C:\DOCUMENTS AND SETTINGS\CHRIS BAKER\LOCAL SETTINGS\TEMPORARY INTERNET FILES\OLK1D\0019REPORT-FINAL ISSUE.DOC REP/FI
Page 88 Ove Arup & Partners International LtdFinal Issue 16 January 2003
The development-related trips are split between residential trips from the Shawfair development and other trips from employment, health and business users. These contribute some contra-peak demand.
Table 6.3 shows the peak demand on the line and the peak loading for comparison with line capacity of 1,800. Assuming that demand has a peak within the peak equivalent to 50% of hour demand in a 20 minute period, this leads to a percentage tram peak load factor of 79% in the forecast year. This allows enough capacity for future growth and for the impacts of further development.
Table 6.4 reports the transfer from car to tram is achieving an overall percentage change in public transport mode share. It is based on prediction for the two main modes in CSTM3 Districts directly served by the route.
Table 6.2 Demand and Revenue (2011) South East Edinburgh Tram
Modelled Trips
Development Trips
Park and Ride Trips TOTAL
Daily Demand 8,133 3,049 674 11,856 Average Trip Length (kms) 5.16 Annual Demand (M) 2.603 0.976 0.204 3,783 Annual Revenue (£M) 2.649 0.991 0.302 3.942
Table 6.3 Peak Demand South East Edinburgh Tram Trips
AM Peak Hour Modelled Trips 942 AM Peak Hour Development Trips 394 AM Peak Hour Park and Ride Trips 355 Peak Loading 1,000
Table 6.4 Mode Split South East Edinburgh Tram
Do-Minimum Do-Something % Change
Car 51,583 51,250 -0.6% Public Transport 3,583 3,871 +8.0% PT Mode Share 6.5% 7.0% +7.7%
6.4 Environmental Issues
6.4.1 Population
Current distributions of population along the South East Edinburgh Line are, as one would expect, more concentrated within central areas of the city. The Shawfair development will add significantly to the residential population in the corridor. The Ward Employment Catchment for the line is again more concentrated in central areas, although a noticeable concentration is also apparent throughout the Craigmillar and Niddrie areas. Overall though, much of the existing ‘employment’ catchment of the South East Line is of relative low density. This will be affected to a significant degree by the inclusion of employment at the New Royal Infirmary and associated development south of Craigmillar.

The City of Edinburgh Council Edinburgh LRT Masterplan Feasibility StudyFinal Report
C:\DOCUMENTS AND SETTINGS\CHRIS BAKER\LOCAL SETTINGS\TEMPORARY INTERNET FILES\OLK1D\0019REPORT-FINAL ISSUE.DOC REP/FI
Page 89 Ove Arup & Partners International LtdFinal Issue 16 January 2003
6.4.2 Air Quality, Noise, and Vibration Constraints
Reductions of traffic at the City Centre end of the line should be beneficial to the AQMA in assisting the Council meet its air quality targets. Reductions of traffic are also predicted around the central section of the line, which will benefit these communities. Lesser reductions are predicted in the less built up areas to the south east, which are likely to have good air quality overall in any case.
A reduction in traffic noise may potentially occur in individual streets, which would be beneficial in Conservation Areas and the World Heritage Site, but an overall a reduction in noise is unlikely. Vibration is unlikely to be a significant impact.
6.4.3 Ecology and Landscape Variables
Primary Constraints
The tram route runs on-street for most of the route, and four Tree Preservation Orders lie adjacent to the route. The route is also adjacent to the Historic Garden and Designed Landscape at Drum. It lies close to Holyrood Park, which is a Designed Landscape and SSSI. The on-street alignment is not expected to affect these important sites.
Secondary Constraints
The route lies alongside Greenbelt from Cameron Toll to its southern terminus. Four Long-Established Woodlands also border the route.
6.4.4 The Built Environment
Primary Constraints
The Edinburgh World Heritage Site is located at the north-west section of the route. The route is also bordered by Conservation Areas from the City Centre to Cameron Toll. Listed Buildings are more common on this section of the route. There is a Scheduled Ancient Monument designated at Craigmillar Castle, which lies to the east of the route.
Secondary Constraints
The suggested location for one of the tram stops ties into a cycle route at Holyrood Park and at Cameron Toll. There is a further cycle route that terminates at Little France.
6.5 Integration The South East Edinburgh tram line would connect with mainline train services at Waverley and Haymarket. There are also a number of important locations for interchange with bus, both along the corridor and in the city centre, and opportunities for Park and Ride. These connections will be important for new developments at Shawfair and the new Royal Infirmary providing access to and from the wider transport network. Interchange at Waverley Station could be direct from stops on Waverley Bridge or on Market Street.
Interchange with bus at Cameron Toll and Ferniehill Road will connect to crosscity and orbital services thought these may not be easy to provide as fully integrated interchanges without taking property. Where stops are not conveniently located, it will be important to provide well signed and secure routes with appropriate information and through ticketing. It is anticipated that further interchange with bus services will be provided at the New Royal Infirmary and at Shawfair, if alignments that provide direct access are adopted.
At the hospital, careful planning and location of facilities should be undertaken, with focus on accessibility, comfort and safety. If the alignment is able to run through the hospital site, a fully covered access is preferred. If the tram alignment penetrates the Shawfair development,

The City of Edinburgh Council Edinburgh LRT Masterplan Feasibility StudyFinal Report
C:\DOCUMENTS AND SETTINGS\CHRIS BAKER\LOCAL SETTINGS\TEMPORARY INTERNET FILES\OLK1D\0019REPORT-FINAL ISSUE.DOC REP/FI
Page 90 Ove Arup & Partners International LtdFinal Issue 16 January 2003
there will be further opportunities to connect it to bus services feeding other areas of the city, particularly orbital routes.
Park and Ride close to Sheriffhall Interchange will offer an alternative for car travel to the city centre. This could attract traffic from the Edinburgh Bypass as well as trips from Dalkeith, Bonnyrigg and Gorebridge.
6.6 Tram Operations and Car Requirements
6.6.1 Run Times
The route selected for Phase 2 testing was defined as Danderhall to Haymarket via the alignment described above. The peak level of service as assumed to be 10 tph for demand and revenue forecasting. The Arup Runtime model was used to define the “all out” stop to stop times for the alignments and stop locations discussed during the study. Additional time was allowed for normal operating contingencies (recovery) and for junction delays. The calculations are reported in Appendix A. The resulting times are as follows:
Danderhall-Haymarket run time: 22 min:48 secs, i.e. 24 minutes including recovery
Minimum round trip time: 48 minutes
Add layover time 6 minutes x 2: 60 minutes
6.6.2 Service Pattern
For the Phase 2 demand forecasts and appraisal, peak service of 10 tph was assumed with all cars operating Haymarket-Danderhall following the North Edinburgh Loop via Princes Street between Haymarket and Waverley. Opportunities for through working to other lines would exist on an LRT network but were not introduced for the test.
6.6.3 LRV Requirements
These run times imply the need for 10 LRVs at 10 tph level of service. In addition, 10% spare cars are generally needed to provide for maintenance requirements; this implies that 11 cars are needed. As a free-standing route, however, it would require 2 LRVs spare to give a total fleet of 12 cars.
6.6.4 Operating Costs
The O&M cost for the SE Edinburgh Line was based on the standard level of service adopted for Phase 2 and described in an earlier section. The total annual car kms for the 10.1km route (Danderhall-Haymarket) was multiplied by the cost per car km as follows:
0.939M car kms/year x £3.15/car km = £2.96M/year.
6.7 Costs The construction costs for the SE Line were built up using the alignments definition described above in the cost categories shown in Table 6.5. Costs are dominated by trackwork and highway works and were assessed for a free-standing line: Danderhall to Haymarket via Waverley Bridge and Pleasance. The overall cost of £124.83M is £12.36M/route km. There is a common section of route with the other two lines.
In addition to construction costs in Table 6.5, there would be the cost of 12 trams assessed at £19.2M and a depot would be required at a cost of £8M giving a total cost for the South East Line, if implemented on its own, of £152.03M.

The City of Edinburgh Council Edinburgh LRT Masterplan Feasibility StudyFinal Report
C:\DOCUMENTS AND SETTINGS\CHRIS BAKER\LOCAL SETTINGS\TEMPORARY INTERNET FILES\OLK1D\0019REPORT-FINAL ISSUE.DOC REP/FI
Page 91 Ove Arup & Partners International LtdFinal Issue 16 January 2003
Table 6.5 Outline Construction Cost of the South East Edinburgh Tram Route Category of Work Total £M
Earthworks/Landscaping, etc. 3.04 Structures 1.20 Trackwork 42.19 Highways Work 10.40 Substations and OHLE 6.11 Tramstops 2.75 Park and Ride 2.00 Signalling and Control Equipment 1.30 Utility Diversions 10.14 Commissioning 1.28 Land 5.00 Railtrack 1.00 Other items 8.54 Client Costs – 10% Design and Site Supervision – 15% 29.88 Allowance for Contingencies – 10% TOTAL 124.83
6.8 Appraisal The South East Line was subject to a STAG initial assessment in Phase 1 and the resulting AST is included in this report. The Phase 2 tests of the scheme described above yield the following key results. The main financial projections are:
Capital cost £152.03M O&M cost £2.96M per year Revenue £3.94M per year Operating ratio 1.33
Therefore, the Phase 2 appraisal indicates that the line could cover its operating costs but has a relatively high construction cost and a significant funding gap. It must be emphasised that both O&M costs and revenues are highly sensitive to change in forecasting assumptions, O&M costs are determined by the level of service offered while revenue is based on existing bus fares with no premium for higher quality service, a 10% premium might be reasonable which could increase the operating ratio to 1.46.
Our initial assessment of the net benefits of the scheme in a restricted cost benefit analysis gives the following main results:
PV of benefits : +£88.2M PV of costs : -£165.7M NPV : -£77.5M
The scheme would achieve a modest mode shift across the city as a whole. The reduction in car trips of 333 per day represents a reduction in 0.5M car trips per year contributing to environmental improvement and decongestion. .

The City of Edinburgh Council Edinburgh LRT Masterplan Feasibility StudyFinal Report
C:\DOCUMENTS AND SETTINGS\CHRIS BAKER\LOCAL SETTINGS\TEMPORARY INTERNET FILES\OLK1D\0019REPORT-FINAL ISSUE.DOC REP/FI
Page 92 Ove Arup & Partners International LtdFinal Issue 16 January 2003
7. REVIEW OF EXTENSIONS BEYOND THE CITY OF EDINBURGH
7.1 Introduction A supplement to the study brief states that cognisance should be taken of extensions of LRT into the SESTRAN areas. Therefore, preliminary indications of the prospects for extensions in the corridors indicated were provided as a basis for possible later work. Extending beyond the City of Edinburgh administrative boundary acknowledges the importance of the city for regional commuting and as an important social and leisure destination.
A review of possible extensions in the SESTRANS area was undertaken to determine the overall prospects for links into Fife, West Lothian, Midlothian and East Lothian. This identifies the principal alignment issues, planning opportunities and constraints and order of magnitude of possible demand for potential future phases of light rail. It is clear that none of the SESTRANS area extensions would be viable without penetrating the centre of Edinburgh. Therefore, all are considered as extensions, not stand-alone lines. Indicative corridors for SESTRANS extensions are shown in Figure 7.1.
7.2 Phase 1 Appraisal – Recommended Lines The three LRT routes recommended from Phase 1 and studied in more detail are:
• North Edinburgh Loop – connecting Waverley, Haymarket, Granton and Leith Docks;
• West Edinburgh Tramway – via Edinburgh Park, Gyle and Edinburgh Airport to Newbridge;
• South East Edinburgh Tramway – via Dalkeith Road, New Royal Infirmary to Danderhall.
The preferred route of the North Edinburgh Loop was defined in a previous study. A number of route options are possible for both the West Edinburgh and South East Edinburgh routes. The alignment options include the following:
West Edinburgh
• variants for crossing the A8 and the Edinburgh Bypass;
• the alignment parallel to the A8 past the new Royal Bank of Scotland Headquarters;
• serving Edinburgh Airport and Newbridge;
• the location of Park and Ride facilities.
South East Edinburgh
• the alignment between Princes Street and Cameron Toll;
• route options to serve new developments at Shawfair at the New Royal Infirmary directly;
• the location of Park and Ride facilities;
• the terminus.
These options have an impact on the assessment of later extensions, in terms of their feasibility and cost, and the planning and demand issues involved. We have assumed the alignments defined for our Phase 2 appraisal.
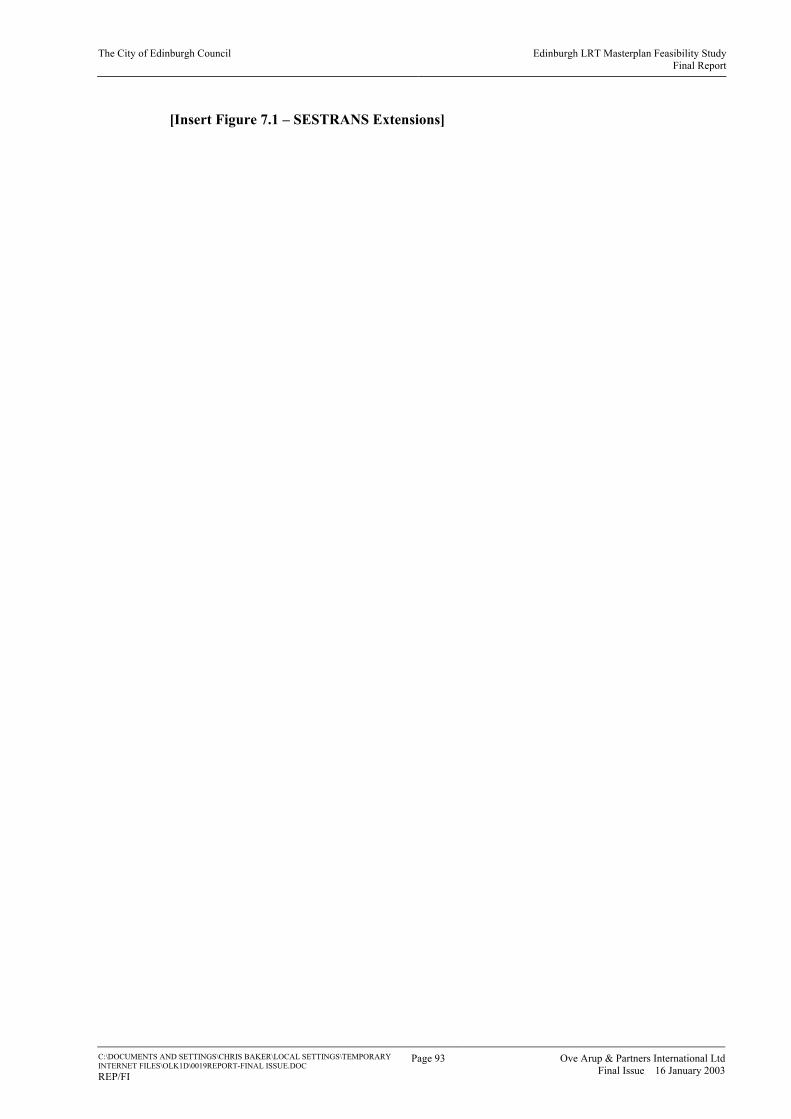
The City of Edinburgh Council Edinburgh LRT Masterplan Feasibility StudyFinal Report
C:\DOCUMENTS AND SETTINGS\CHRIS BAKER\LOCAL SETTINGS\TEMPORARY INTERNET FILES\OLK1D\0019REPORT-FINAL ISSUE.DOC REP/FI
Page 93 Ove Arup & Partners International LtdFinal Issue 16 January 2003
[Insert Figure 7.1 – SESTRANS Extensions]

The City of Edinburgh Council Edinburgh LRT Masterplan Feasibility StudyFinal Report
C:\DOCUMENTS AND SETTINGS\CHRIS BAKER\LOCAL SETTINGS\TEMPORARY INTERNET FILES\OLK1D\0019REPORT-FINAL ISSUE.DOC REP/FI
Page 94 Ove Arup & Partners International LtdFinal Issue 16 January 2003
The recommended network allows extensions to each of East Lothian, Midlothian, West Lothian and Fife. Therefore, all were considered, in very broad terms, as possible extensions of the three lines considered in Phase 2 of the appraisal.
7.3 Assumptions Direct extensions into SESTRANS were considered as possible prolongations of the North, West and South East Edinburgh lines.
In order to consider these extensions on a common basis the following approach was adopted:
• standard assessment of demand, revenue and operating costs were made, see below;
• capital costs for each extension are calculated using the same per kilometre rates used in the Phase 1;
• that any extensions will be planned to complement rather than compete with any existing or future planned public transport schemes.
• the use of existing heavy rail infrastructure is on the basis of existing and committed rail services only;
• tram extensions were considered using the broad alignments given in the brief without investigating enhancement that could improve their viability. This may include dedicated interchange facilities with bus or train services and park and ride.
The testing of these extensions identifies only the immediate local catchment available and focuses on trips into central Edinburgh or to key development sites directly served by the tram. Each extension is considered in the context of existing public transport alternatives and the private car and does not assess the impact of other proposals, for example, rail enhancements.
Where public transport trips exist the assumption was that, in the model, tram would compete favourably on journey time and tram was assumed equal or better than interurban bus on fare, frequency and distance. Therefore, we may expect the model to share do-something interurban bus trips with tram on the basis of a 50:50 split. For car trips the introduction of a new public transport mode, competitive on journey time, would lead to a modest increase in public transport mode share, say 5% of car trips.
By summing these figures for the CSTM3 zones directly served by the extension, for trips to Edinburgh city centre zones, we derived patronage for each extension on the same basis.
Operating cost for each extension was calculated from the annual tram kilometres for the line at a rate of £3.15 per tram kilometre. Revenue was calculated using Phase 2 appraisal assumptions but the average trip length was assumed to reflect additional trip distance equal to 40% of the extension length (i.e. the average additional trip length if using the extension, assuming the same distribution of trips).
7.4 Possible Extensions A number of different extensions were considered as part of the future expansion of a light rail network for Edinburgh. Whilst no business cases are presented for these extensions their outline feasibility was assessed and an indication of the main opportunities and constraints is given.

The City of Edinburgh Council Edinburgh LRT Masterplan Feasibility StudyFinal Report
C:\DOCUMENTS AND SETTINGS\CHRIS BAKER\LOCAL SETTINGS\TEMPORARY INTERNET FILES\OLK1D\0019REPORT-FINAL ISSUE.DOC REP/FI
Page 95 Ove Arup & Partners International LtdFinal Issue 16 January 2003
7.4.1 Extension A – North to Dalmeny/Queensferry via Kirkliston
This option runs north from the anticipated West Edinburgh terminus at Newbridge providing a stop at Kirkliston and possible interchange with heavy rail at Dalmeny. It could improve accessibility between Queensferry and Fife and origins/destinations not served on the A90 Queensferry-Edinburgh corridor (e.g. Edinburgh Airport, Edinburgh Park). There is a need for improved capacity for trips to Edinburgh from Fife, due to a significant forecast increase in commuting from north of the Firth of Forth. It also provides a public transport link from Fife to Edinburgh Airport without interchange in the city centre. This would result in significant journey time savings – a tram from Dalmeny to Edinburgh Airport would be approximately 15 minutes quicker than by train/bus via Haymarket. This extension would increase the range of direct destinations by public transport but does not address capacity issues on the two existing river crossings at Queensferry. It may be possible to provide a tram link that penetrates the community of Queensferry better than the existing rail station at Dalmeny, which is peripheral to the residential area. The key opportunities are as follows:
• possible access to development sites at Queensferry;
• serving the community at Kirkliston, which is planned for expansion;
• improved access between Fife and Edinburgh Airport/Edinburgh Park;
• interchange with rail services to Fife at Dalmeny;
• does not require crossing the M9;
• efficient use of former rail alignment.
There are several constraints also:
• the limited catchment south of Dalmeny;
• it is difficult to provide access into the centre of existing communities at Kirkliston and Queensferry;
• the corridor misses key development sites in Newbridge;
• there would be competition with heavy rail between Dalmeny and central Edinburgh.
7.4.2 Extension B – North to Dalmeny/Queensferry, Inverkeithing and Dunfermline
Extending A into Fife will provide an important link north of the Firth of Forth serving the increasing commuter population. This would link to either the existing or a new park and ride site north of the river. The intention would be to provide access via interchange with local bus services to the new East Dunfermline development area, to Rosyth docks and local communities. There is a significant constraint on delivering this extension, namely capacity for crossing the river. It is not possible to utilise any carriageway on the existing road bridge due to its construction and capacity on the rail bridge is severely limited. In order to deliver this extension some enhancement of the existing rail bridge, if feasible, would be required or a new crossing provided both of which would involve very significant cost. The extension would provide the following opportunities:
• increased accessibility to Fife;
• potential for relief the congested road bridge;
• access to developments in West Edinburgh not served by heavy rail;
• opportunities for Park and Ride.
The main constraints it faces are:

The City of Edinburgh Council Edinburgh LRT Masterplan Feasibility StudyFinal Report
C:\DOCUMENTS AND SETTINGS\CHRIS BAKER\LOCAL SETTINGS\TEMPORARY INTERNET FILES\OLK1D\0019REPORT-FINAL ISSUE.DOC REP/FI
Page 96 Ove Arup & Partners International LtdFinal Issue 16 January 2003
• Forth Rail Bridge not available for a regular, frequent service and engineering problems preclude use of Forth Road Bridge, therefore, additional crossing capacity is required;
• the distance between travel markets beyond Inverkeithing;
• competing heavy rail and bus services.
7.4.3 Extension C – West to Broxburn, Uphall and Livingston
An extension into West Lothian could serve important development areas and support an increased commuter population along the M8 motorway corridor. The extension would provide direct access to development sites at Newbridge then parallel the A89 via Broxburn and Uphall before crossing the M8 into Livingston. Significant new development and housing allocations are planned for the corridor including a major extension of the community at Broxburn/Uphall. Furthermore, the committed developments along the A8 corridor will place increasing pressure on the existing infrastructure and a tram service extending west of Newbridge would support growth. This corridor does benefit from motorway access and a direct rail service that will compete with the tram. Proposed enhancement of the rail service to Bathgate may weaken the case for light rail. Key opportunities are as the follows:
• access to development sites at Newbridge and further west;
• direct access to Edinburgh Airport and Edinburgh Park;
• provision of additional capacity to support planned developments;
• segregated alignment possible with potential for further Park and Ride near M8;
However, there are two main constraints:
• competing rail and bus services from Livingston;
• competition from the M8 motorway.
7.4.4 Extension D1 – Musselburgh/Joppa
The direct route to Musselburgh is via Joppa along the inner area corridor of high demand. There are problems in defining a tram route between Portobello and the city centre if a good degree of segregation is to be achieved. One potential route is via the A6415 and A1140, Portobello Road then London Road to its junction with Leith Walk where the line could join the North Edinburgh Loop alignment. There are other alignment options that need detailed investigation such as using part of the ECML alignment to avoid narrow sections of highway.
This direct route is potentially attractive since it could deliver short journey times to a strong existing inner area travel market for which tram would need to compete with bus. Musselburgh could be reached via Musselburgh Road. However, it would be necessary to take road space for tram or accept street running. The former Musselburgh rail branch alignment could be used but would require street running on, or closure of, Olive Bank Road. Key opportunities are as follows:
• direct tram service to central Edinburgh with strong local market;
• possible new interchange with bus at Musselburgh;
• possible private sector contributions associated with development in central Musselburgh;
• can exploit the North Edinburgh Loop alignment Leith Walk/Princes Street;
• route could split/divert to serve Newcraighall.
However, there are several problems:

The City of Edinburgh Council Edinburgh LRT Masterplan Feasibility StudyFinal Report
C:\DOCUMENTS AND SETTINGS\CHRIS BAKER\LOCAL SETTINGS\TEMPORARY INTERNET FILES\OLK1D\0019REPORT-FINAL ISSUE.DOC REP/FI
Page 97 Ove Arup & Partners International LtdFinal Issue 16 January 2003
• how to achieve segregation throughout the route;
• terminal alignments in Musselburgh require careful consideration;
• significant bus competition.
7.4.5 Extension D2 –Musselburgh via the SE Edinburgh Line
This offers a link from part way along the South East Edinburgh route, adjacent to the New Royal Infirmary, north east to Musselburgh. It would provide an important interchange at Newcraighall with the Edinburgh Crossrail train service and direct access to the nearby commercial development. It would continue across the A1 into Musselburgh, thereby providing much better access to the town than the existing railway station. Existing bus services focus mainly on direct access from Musselburgh into Edinburgh city centre. The tram extension would provide an important connection to the new hospital and other development sites in the area, and increase accessibility for cross-city movements. The key opportunities are as follows:
• better access to new development areas;
• direct access from Musselburgh to new hospital;
• route adjacent to residential development at Craigmillar;
• opportunity for Park and Ride and interchange at Newcraighall;
• possible new interchange with bus in Musselburgh;
• possible private sector contributions associated with development in central Musselburgh.
However, there are also several problems to overcome:
• some engineering and alignment issues through Newcraighall;
• terminus and alignment in Musselburgh require careful consideration and are subject to planning pressures;
• the timing of the extension may be dependent on development;
• could dilute the service beyond the junction on the South East, south of the new hospital.
7.4.6 Extension E – South to Loanhead and Penicuik
This extension would take advantage of disused rail alignments south of Danderhall, crossing the Edinburgh Bypass and providing direct service to Loanhead and Penicuik. A detailed review of the condition of available former rail alignments is required. Available routes are limited due to the topography and alternative modes and options will need to be considered. It is anticipated that a tram extension would be evaluated as part of a wider transportation study for links into Midlothian. The Quality Bus Corridor proposal for the A701 to Straiton may encourage bus competition from Penicuik and Loanhead, which would dilute the potential market. Key opportunities are the following:
• opportunity for additional Park and Ride;
• efficient use of former rail alignment;
• use of an existing crossing of the Edinburgh Bypass may be possible;
• opportunities for bus and rail interchange and integration with Midlothian transport strategies;
However, there are several possible constraints:

The City of Edinburgh Council Edinburgh LRT Masterplan Feasibility StudyFinal Report
C:\DOCUMENTS AND SETTINGS\CHRIS BAKER\LOCAL SETTINGS\TEMPORARY INTERNET FILES\OLK1D\0019REPORT-FINAL ISSUE.DOC REP/FI
Page 98 Ove Arup & Partners International LtdFinal Issue 16 January 2003
• the alignment is difficult to combine with penetration of Shawfair development;
• competition with bus Park and Ride at Straiton;
• long distances between settlements would be hard to serve cost-effectively;
• competition for alignment with heavy rail proposals;
7.4.7 Extension F – South to Dalkeith and Bonnyrigg
The use of former rail alignments provides a route for a tram extension into Dalkeith or to Bonnyrigg and Lasswade. A crossing of the Edinburgh Bypass may be available but proposals for an extension to the Edinburgh Crossrail service south on the Waverley Line would compete with this scheme. Engineering issues will need to be considered in the crossing of the River North Esk. It is anticipated that the relative merits of a tram extension and heavy rail proposals would need to be evaluated as part of a wider transportation study for links into Midlothian. However, there may also be potential for shared heavy/light rail operation. This should include possible terminus points and phasing for each and the opportunities for providing access for the tram into the centre of Dalkeith. The option would provide the following main opportunities:
• potential for access to new housing development at Shawfair;
• further opportunities for Park and Ride;
• possible links to heavy rail proposals with interchange options;
However, there are also several problems and issues:
• crossing of Edinburgh Bypass to be confirmed;
• timing dependent on development;
• possible competition with heavy rail for former alignment (Waverley Line).
7.5 Preliminary Assessment Our consideration of possible LRT extensions with the SESTRANS area produced the following main results, which give an indication of their probable relative performance in a more extensive planning exercise – see Table 7.1. The cross-Forth extension is excluded because of high cost and dependence on Extension A.
Table 7.1 SESTRANS Extensions – Preliminary Consideration, Summary
Extension Length (km)
Daily Demand (pass.)
Annual Demand
(000s)
Annual Revenue
(£m)
Annual Operating Cost (£m)
Operating Ratio
Capital Cost (£m)
Annual Pax per
route km (million)
A. Queensferry/Kirkliston 7.0 1,841 589 1.04 1.22 0.85 85 0.08
C. Broxburn/Livingston 14.0 5,677 1,817 3.70 2.45 1.51 176 0.13
D1. Musselburgh/Joppa 9.5 6,788 2,172 2.32 2.73 0.85(1) 121 0.23
D2. Musselburgh/SE Line 6.0 3,768 1,206 1.20 2.01 0.60 79 0.20
E. Penicuik 12.5 1,805 577 0.88 2.19 0.40 144 0.05
F. Dalkeith 4.5 2,714 869 1.04 0.79 1.32 58 0.19
Note: (1) Assuming headways same as ‘urban’ routes – this ratio improves to 1.4 if the same headways as other extensions are assumed.

The City of Edinburgh Council Edinburgh LRT Masterplan Feasibility StudyFinal Report
C:\DOCUMENTS AND SETTINGS\CHRIS BAKER\LOCAL SETTINGS\TEMPORARY INTERNET FILES\OLK1D\0019REPORT-FINAL ISSUE.DOC REP/FI
Page 99 Ove Arup & Partners International LtdFinal Issue 16 January 2003
Extension E (Penicuik) is high cost and has relatively low patronage and is unlikely to be viable. Extension C (Livingston) seems to have the second best demand prospects but, because of its length, would have high capital and operating costs and is, therefore, ranked lower.
The Dalkeith extension (F) has the lowest cost and a relatively high patronage density together with a potentially good operating ratio. The two options for Musselburgh as a branch off the SE Line (D2) and directly via Joppa (D1) both have attractive features. D2 is likely to be cheaper and easier to construct but is less attractive for radial trips to Edinburgh. D1 is likely to have higher trip density and benefits but would also cost more. Its operating ratio is 0.85 because we assumed it will be served at the standard urban headway of 10 tph in the peaks and 6 tph at other times, but this ratio could easily be improved. Also, the revenue on D1 is put at twice on D2, Therefore, D1 is preferred.
Each extension was reviewed against the STAG appraisal criteria to identify the main areas of impact. This relates to positive, neutral or negative only as the scale of impact cannot be determined without more detailed study. The relative performance of each extension must also be considered in conjunction with the relevant Edinburgh LRT line to which it is connected. Table 7.2 gives a summary of the likely impacts under the STAG criteria headings.
Table 7.2 Summary of Possible STAG Impacts STAG Appraisal Criteria
Extension
Env
iron
men
t
Safe
ty
Eco
nom
y
Eco
nom
ic
Act
ivity
Acc
essi
bilit
y
Tra
nspo
rt
Inte
grat
ion
Polic
y In
tegr
atio
n
Fina
ncia
l Su
stai
nabi
lity
A. Queensferry/Kirkliston O O + + + O O O
C. Broxburn/Livingston O O + + O + + +
D1. Musselburgh/Joppa + O O + + + O O(1)
D2. Musselburgh /SE Line O O O + + + O -
E. Penicuik O O + + + O O -
F. Dalkeith O O + + + + O +
Key: Note: (1) Becomes + if same headways as other extensions are used. Positive Impact + Negative Impact - Neutral Impact O
We conclude that there appears to be a case for more detailed study of three of the SESTRANS extensions (D1, F, C) and that this should cover demand, revenue, costs and feasibility together with economic evaluation and will need to identify and resolve alignment choices and competition with other modes, including heavy rail.

The City of Edinburgh Council Edinburgh LRT Masterplan Feasibility StudyFinal Report
C:\DOCUMENTS AND SETTINGS\CHRIS BAKER\LOCAL SETTINGS\TEMPORARY INTERNET FILES\OLK1D\0019REPORT-FINAL ISSUE.DOC REP/FI
Page 100 Ove Arup & Partners International LtdFinal Issue 16 January 2003
8. ADDITIONAL ISSUES
8.1 Benchmarking Against Other UK LRT Systems In order to check the validity of the Edinburgh LRT demand and cost estimates a benchmarking exercise was carried out to compare each line with other LRT schemes in the UK. Whilst it is not suggested that any other system has the same characteristics as the Edinburgh tram network a number of indicators are used as a logic check against the forecasts and to give an indication as to how the lines may be expected to perform commercially against other systems.
Tables 8.1, 8.2 and 8.3 below show the results of this benchmarking analysis. The figures for the other systems were taken from published DTLR statistics (“Transport Statistics Great Britain 2000 and Light Rail Statistics: England: 2000/01 – Key Facts”) for 2000/01. The Docklands Light Railway and the Tyne & Wear Metro are excluded from this comparison because they are of a heavier nature than conventional light rail.
The first table establishes data on demand, in terms of passenger journeys and passenger demand, together with the physical characteristics of the networks and the number of vehicle kilometres run.
The second compares levels of demand, looking at passenger journeys per stop, passenger journeys per route kilometre, passenger kilometres per route kilometre and passenger kilometres per vehicle kilometre (this last also representing ‘average tram load’). It should be noted that this does not take into account the differences in vehicle capacity on different systems.
The third table compares revenue, looking at overall figures, average fare and revenue per tram kilometre.
The busiest system in the UK at present in terms of total patronage and density (passengers per route km) is Croydon Tramlink but, in terms of demand per stop, Manchester Metrolink (Bury-Altrincham) is highest with an average of 0.57m per annum.
In general the benchmarking exercise indicates that the demand and revenue estimates for the three Edinburgh LRT lines are within the range indicated by other UK systems. This comparison indicates that the estimated demand and revenue appear reasonable although density and revenue/tram km for North Edinburgh are high compared to other networks.
Table 8.1 Benchmarking – Demand and Physical Characteristics Annual Demand
System/Line Passenger journeys (millions)
Passenger km
(million)
No. of Stops Route km
Vehicle kms run
(per annum)
Stops per km
Manchester Metrolink: Phase 1 - Bury/Altrincham 13.7 136.1 24 30.9 3.4 0.8 Phase 2 - Eccles 2.3 16.2 15 9.2 1.00 1.6 Croydon Tramlink 16.2 97.0 38 28 2.8 1.4 Sheffield Supertram 11.1 38.0 47 29 2.4 1.6 Midland Metro 5.4 55.8 23 20.4 2.5 1.1
North Edinburgh Loop 11.6 59.5 15.6 1.5 West Edinburgh Line 4.2 41.1 16.4 1.5 South East Edinburgh Line 3.8 19.6 10.1 0.9

The City of Edinburgh Council Edinburgh LRT Masterplan Feasibility StudyFinal Report
C:\DOCUMENTS AND SETTINGS\CHRIS BAKER\LOCAL SETTINGS\TEMPORARY INTERNET FILES\OLK1D\0019REPORT-FINAL ISSUE.DOC REP/FI
Page 101 Ove Arup & Partners International LtdFinal Issue 16 January 2003
Table 8.2 Benchmarking – Traffic Density
System/Line
Demand per stop (Million
passenger journeys)
Passenger Journeys per
route km (Million)
Passenger km per route km
(Million)
Average Tram Load (Persons)
Manchester Metrolink: Phase 1 - Bury / Altrincham 0.57 0.44 4.40 40.03 Phase 2 - Eccles 0.15 0.25 1.76 16.20 Croydon Tramlink 0.43 0.58 3.46 34.64 Sheffield Supertram 0.26 0.38 1.31 15.83 Midland Metro 0.23 0.26 2.74 29.37
North Edinburgh Loop 0.74 3.81 West Edinburgh Line 0.26 2.51 South East Edinburgh Line 0.38 1.94
Table 8.3 Benchmarking – Revenue System/Line Annual Revenue (£M) Average Fare (£) Revenue per tram km
Manchester Metrolink: Phase 1 - Bury / Altrincham 15.8 1.15 4.65 Phase 2 - Eccles 1.9 0.83 1.90 Croydon Tramlink 12.2 0.75 4.36 Sheffield Supertram 7.1 0.64 2.96 Midland Metro 3.1 0.57 1.63
North Edinburgh Loop 9.6 0.83 6.4 West Edinburgh Line 6.0 1.42 4.0 South East Edinburgh Line 3.9 1.03 4.3
8.2 Wider Economic Benefits Including Urban Regeneration
8.2.1 Objective
This section provides a preliminary assessment of the possible urban regeneration impact of the Phase 2 Edinburgh LRT routes. It covers job creation and economic development including:
• Property impact covering land requirements for LRT construction and property likely to be affected by nuisance or benefiting from enhanced access: Whilst in the short term there are likely to be some negative construction impacts on areas around the alignments, improved public transport access will have a beneficial effect overall. Future development land and currently planned schemes will be more attractive with good transport provision and, in the long run, Edinburgh LRT may cause some reduction in the need for parking provision. This will be of benefit to developers when planning schemes.
• The effect on retail activity in areas directly served by the scheme and for areas indirectly affected by changing accessibility: Edinburgh LRT is likely to have a modest effect on retail activity; there may be some modal shift from car towards the tram,

The City of Edinburgh Council Edinburgh LRT Masterplan Feasibility StudyFinal Report
C:\DOCUMENTS AND SETTINGS\CHRIS BAKER\LOCAL SETTINGS\TEMPORARY INTERNET FILES\OLK1D\0019REPORT-FINAL ISSUE.DOC REP/FI
Page 102 Ove Arup & Partners International LtdFinal Issue 16 January 2003
although it is likely that many trips will continue to be car-based because of the need to easily transport heavy or cumbersome purchases. Impact on residential development is likely to be more significant as the provision of high quality public transport links will add to the attraction of housing developments through the reduced need for multiple car ownership.
• Identification of development “hot spots” and their potential for additional construction and employment: Maximum development impact will occur where there is greatest synergy between the positive impacts of schemes. Those sites where there is consistency between planning and transport policies and aims will experience the greatest benefit.
8.2.2 Assessment of impact
Previous studies have demonstrated that there are certain necessary conditions which must be in place for public transport schemes to have significant positive economic development impacts. These include:
• a buoyant economy – public transport infrastructure improvements have had a beneficial development effect where they are able to release an existing development constraint (thereby unleashing latent demand), open up new sites for development, or act as a catalyst to underlying demand;
• readily available, attractive sites – continuity between transport investment schemes and regeneration, economic development and planning policies is key in ensuring maximum possible beneficial impact;
• step-change in service – where transport improvements constitute a significant “step change” in provision (i.e. major journey time reductions, quality, or network coverage improvements).
A first review of the planning and economic context of the proposed tram routes suggests the following.
• Economic prospects on all three alignments will benefit from the buoyant economy. Each route alignment runs past or through several major new or planned developments which are expected to create large numbers of new jobs.
• The northern alignment is particularly well placed as it has several development sites already being marketed with potential for in excess of 20,000 jobs. The alignment will run very close to most planned major developments in the town centre, particularly the planned Edinburgh’s Waterfront and Ocean Terminal projects in the harbour area north of the city centre.
• The western alignment is planned to connect with important new developments including Edinburgh International Airport, Edinburgh Park/South Gyle and the Newbridge Area, where three new business parks are planned.
• The south east alignment will serve the area of land known as the South East Wedge, south of Craigmillar, upon which housing, industrial, community and retail facilities will be provided as well as a new university campus, a medical research park and the New Royal Infirmary Edinburgh.
• In all cases the tram can be said to offer a significant improvement and, possibly, a step change in public transport provision. Public transport provision is already reasonable on the western and south-eastern alignments, with a mature highway network.
The City of Edinburgh Council Edinburgh LRT Masterplan Feasibility StudyFinal Report
C:\DOCUMENTS AND SETTINGS\CHRIS BAKER\LOCAL SETTINGS\TEMPORARY INTERNET FILES\OLK1D\0019REPORT-FINAL ISSUE.DOC REP/FI
Page 103 Ove Arup & Partners International LtdFinal Issue 16 January 2003
• On the western alignment the tram will be mostly segregated, but run parallel to the A8, which has bus priority. However, Edinburgh Airport will be provided with a direct light rail link, which will mean a step-change improvement, as it has no rail link at present.
• On the south-east route there is an opportunity to integrate with orbital bus services. Here the increase in quality of transport network coverage is high, as there are several points of interchange between these services and the radial alignment of the tram system.
• Public transport in the town centre along the northern alignment is also already good, however the introduction of the tram will improve interchange. Incremental benefit may be lower here than on the other two alignments.
Given that there exist these pre-requisites for positive impacts (which are likely to be strongest on the northern alignment, given its proximity to some high specification commercial and retail developments), the effects of the proposals are likely to be manifest through:
• improved quality of development. High quality public transport access is likely to improve the attractiveness and locational competitiveness of new schemes, leading to higher employment densities and more professional jobs per square metre;
• accelerated timing of development (in terms of build out and take up of floorspace);
hence,
• enhanced land values, and stimulation (or acceleration) of job creation.
Scheme benefits will also be evident in terms of ride quality and frequency. Less easily quantifiable, but potentially important, there may be a positive impact on image and perception of Edinburgh as a modern, successful economy with high quality infrastructure, with a knock-on small positive effect on city-wide land values.
Each of the effects outlined above should provide positive economic development impacts. However, research studies into the development effect of new or improved transport infrastructure suggest that transport provision is a necessary but not sufficient condition for economic development. Therefore, it will provide benefits as a vital component of a package of factors, which may include economic buoyancy, appropriate planning policy, measures to encourage development on land on and around route alignments where it is not already planned. The key point to draw from these research studies is the importance of the complementarity of various policies.
8.2.3 Conclusions
Research into transport provision and economic development suggests that the most important pre-requisites for maximising potential scheme benefits are:
• a buoyant economy;
• available, attractive sites for development;
• a step-change improvement in service.
It seems likely that the first two requirements will be met by the proposed schemes. Edinburgh is one of the UK’s most prosperous cities, and its economy is the fastest growing major city in the country1. Also, along each of the proposed alignments are several of the most important developments planned to be completed in Edinburgh in the next 5 to 10 years. Local planning policy is conducive to these developments.
The improvement in service should also be provided by each of the alignments, although for some stretches this will be more of a step-change than others (for example, the provision of a
1 Source: Cambridge Econometrics, quoted on www.edinburgh.gov.uk,

The City of Edinburgh Council Edinburgh LRT Masterplan Feasibility StudyFinal Report
C:\DOCUMENTS AND SETTINGS\CHRIS BAKER\LOCAL SETTINGS\TEMPORARY INTERNET FILES\OLK1D\0019REPORT-FINAL ISSUE.DOC REP/FI
Page 104 Ove Arup & Partners International LtdFinal Issue 16 January 2003
non-road link to Edinburgh Airport, and the connection with orbital bus services on the South-eastern alignment).
It is also likely that there will be quality benefits in terms of reliability, ride quality, service frequency, and the overall business and public perception of Edinburgh as a modern and successful economy.
8.3 Network Economies and Benefits There are several cost economies in light rail networks that need to be considered when assessing network implementation. The appraisal in this report was based on the separate assessment of the cost for each of three lines selected from a range of seven corridors indicated by CEC. Each line, if built in isolation, would need to be self-contained and the costs and forecasts for each line were based on this assumption. However, when considered as a network, some costs can be shared, principally:
• common sections of route;
• depot provision;
• spare rolling stock.
In addition, the management of the operation involves relatively fixed overhead costs such as senior staff and office costs that can be shared over a larger network.
If the three Phase 2 lines are considered as a network, the following savings could be realised:
• for common sections, i.e. St. Andrew Square-Haymarket which is common to all three lines. This gives a three line network construction cost of £391.95M, a saving of £43.08M over the sum of the three lines considered separately;
• the three lines were assessed separately to require a tram fleet of 43 cars but only 41 would be needed on a three line network with a common fleet;
• depot cost is assessed at £8M, much of which is independent of fleet and depot size. Each line considered separately needs a depot but a single depot for 41 cars would be appropriate for a three line network (similar to Croydon Tramlink).
These network economies in capital cost are summarised in Table 8.4.
Table 8.4 Economies of Capital Cost – Three Line Network (£M) Line Construction Depot Trams Totals
North 155.02 8 25.6
West 155.18 8 24.0
South East 124.83 8 19.2
Total 435.03 24 68.8 527.83
Saving -43.08 -16 -3.2
Network Cost 391.95 8 65.6 465.55

The City of Edinburgh Council Edinburgh LRT Masterplan Feasibility StudyFinal Report
C:\DOCUMENTS AND SETTINGS\CHRIS BAKER\LOCAL SETTINGS\TEMPORARY INTERNET FILES\OLK1D\0019REPORT-FINAL ISSUE.DOC REP/FI
Page 105 Ove Arup & Partners International LtdFinal Issue 16 January 2003
9. DRAFT FUNDING AND IMPLEMENTATION STRATEGY
9.1 Scheme Development A series of tasks will be necessary to bring the tram schemes to a successful STAG2 application and subsequent Parliamentary Bill. These include the following:
• Refinement of patronage estimates;
• Development of economic impact analysis;
• Review of route alignment, including detailed investigation of structures and refinement;
• Environmental impact study;
• Finalisation of depot site location and area required;
• Refinement of cost estimates to determine the level of public funding required;
• Identification of development opportunities on the route, to secure financial contributions;
• Financial analysis of the preferred scheme;
• Consultation;
• Project procurement structure and timetable;
• Parliamentary Bill;
A draft programme to Royal Assent is presented in Table 9.1 for the West Edinburgh tram scheme and for the South East Line in Table 9.2. The North Edinburgh scheme is already being planned in detail and is not reviewed here. While this timetable is achievable it is challenging and will need to be driven forward by CEC.
Table 9.1 Draft Programme for West Edinburgh Tram PREPARATION Completion by
Initial Design & spec August 2003 Finalisation of Scheme October 2003 Scottish Executive approval January 2004 Bill lodged January 2004 Objections lodged May 2004 Principles October 2004 Details & evidence July 2005 Referrals & amendments December 2005 Royal Assent January 2006
CONSTRUCTION Completion by
Pre-qualification of consortia January 2006 Tender May 2006 Contract Award January 2007 Construction March 2009

The City of Edinburgh Council Edinburgh LRT Masterplan Feasibility StudyFinal Report
C:\DOCUMENTS AND SETTINGS\CHRIS BAKER\LOCAL SETTINGS\TEMPORARY INTERNET FILES\OLK1D\0019REPORT-FINAL ISSUE.DOC REP/FI
Page 106 Ove Arup & Partners International LtdFinal Issue 16 January 2003
Table 9.2 Draft Programme for South East Edinburgh Tram PREPARATION Completion by
Initial Design & spec October 2003 Finalisation of Scheme January 2004 Scottish Executive approval May 2004 Bill lodged May 2004 Objections lodged September 2004 Principles January 2005 Details & evidence October 2005 Referrals & amendments March 2006 Royal Assent May 2006
CONSTRUCTION Completion by
Pre-qualification of consortia June 2006 Tender September 2006 Contract Award June 2007 Construction August 2009
It is noted that immediately following construction will be a commissioning period, when the tramway is operational but not open for public use, so that safety and equipment checks can be carried out. Only following this period can the tramway start to attract revenue.
9.2 Funding Options Edinburgh LRT will be expensive. A step-change in the quality of public transport provision beyond what has been achieved with Greenways and upgrading of the rail network is fundamental to ITI and, to the sustainable economic and environmental health of the capital city. Like all urban rail schemes, it cannot be financed from fare revenue alone.
The scale of cost for a three line network is about £466M and our forecasts indicated that the net revenue stream from the network with premium fares could be about £5M per year. Therefore, although the forecast operating ratio is positive, the scheme will still require substantial grant and other external funding contributions to cover the capital costs.
In the UK, all LRT schemes so far have received government grant but the proportion of costs covered by grant varies by scheme, generally reflecting the scale of forecasts benefits associated with the scheme and, the level of funding from other sources.
The Scottish Parliament may allocate grant if it is satisfied that the scheme provides sufficient benefits and meets other criteria set out under STAG. The Scottish Executive has money under the Public Transport Fund and the Integrated Transport Fund, which have so far been used for major scheme preparation and minor scheme support.
Local authority contributions may be possible, either direct grants in recognition of particular local benefits or monies contributed by developers granted conditional planning approvals, usually to finance transport infrastructure needed to support the development or to mitigate its impact. Congestion charging or workplace parking charges could also be used to generate money to pay for the scheme.
In some areas of the UK, grants from the European Union may be obtained for tram projects but only if the area concerned meets the EU support criteria – generally “Objective 1 and 2” areas. At present Edinburgh is not in one of these areas.

The City of Edinburgh Council Edinburgh LRT Masterplan Feasibility StudyFinal Report
C:\DOCUMENTS AND SETTINGS\CHRIS BAKER\LOCAL SETTINGS\TEMPORARY INTERNET FILES\OLK1D\0019REPORT-FINAL ISSUE.DOC REP/FI
Page 107 Ove Arup & Partners International LtdFinal Issue 16 January 2003
The Government has made it clear that major public transport schemes must be brought forward under the remit of the Public Private Partnership (PPP) initiative to ensure that, in addition to grant, there is also a significant investment from the private sector. This could happen in two main ways:
• contributions from organisations that will benefit from the scheme;
• private finance payments for a concession to operate the scheme for a set number of years.
Contributions to the scheme from other sources could come from:
• developments along the corridors that would benefit from the tramway;
• property owners with sites along the corridors that would benefit from increased values;
• major businesses in the city centre that would benefit from better accessibility;
• advertising and sponsorship.
There are various options for private finance. If, as is usual these days, a concession to design, build, operate and maintain (DBOM) is granted to a consortium, the latter will have several sources of finance which include:
• equity/loans from consortium members;
• bank loans secured on the concession agreement;
• bank finance for debt funding;
• securitisation of revenue (sale of revenue stream for guaranteed income).
Most of these sources are fruitful only if the forecast net revenue stream is large or the concession agreement is sufficiently attractive. The private sector will consider all risks, particularly who bears the revenue risk and the scale of this risk.
The study for the North Edinburgh Line examined a number of available procurement options. Whilst leaving the question of public or private control largely open, the study recommended that the construction and installation of the scheme should be procured by conventional means while its operation and maintenance would be by renewable seven to ten year franchises.
Subsequently the Council have formed a wholly owned company (Transport Initiatives Edinburgh Limited) for the purposes of entering into commercial arrangements with service providers for the delivery of the Integrated Transport Initiative. This vehicle is likely to be the Council’s preferred delivery mechanism for the LRT network, which forms the major component of the New Transport Initiative. The availability of this procurement route is closely linked to the success of the Council’s application to the Scottish Executive for a Road User Charging (RUC) scheme under the Transport (Scotland) Act 2001. This approach strongly implies that the favoured model for Edinburgh is hypothecation from RUC revenue, assuming RUC is introduced as intended, following other transport investment as outlined in the early part of this report.
9.3 Implementation Strategy
9.3.1 Developing the Scheme
Development of the scheme prior to construction will need a comprehensive technical team to undertake work on behalf of CEC. This team will probably include:
• project and cost managers;
• utilities engineers;

The City of Edinburgh Council Edinburgh LRT Masterplan Feasibility StudyFinal Report
C:\DOCUMENTS AND SETTINGS\CHRIS BAKER\LOCAL SETTINGS\TEMPORARY INTERNET FILES\OLK1D\0019REPORT-FINAL ISSUE.DOC REP/FI
Page 108 Ove Arup & Partners International LtdFinal Issue 16 January 2003
• civil and structural engineers;
• legal and financial experts;
• transport and town planners;
• public relations and communications experts.
A team could be assembled from within CEC, by using external advisors or by a combination of public and private sector resources, depending on availability and finance. A key appointment will be an experienced Project Director with responsibility for managing and driving forward the project on behalf of CEC.
Statutory utilities plant and equipment represent particularly important costs and risks for light rail schemes. Therefore, CEC should also consider discussions with all the major statutory utilities on the relocation of plant and equipment and, the costs of these works. It is worth considering how to better manage the costs and risks associated with utilities plant and equipment by undertaking advance diversion works ahead of the main construction contract. Early discussions with Her Majesty’s Railway Inspectorate (HMRI) on the safety case are recommended. These issues can have a significant impact on programme and costs.
In addition to preparing the reports needed for the STAG2 appraisal and the Parliamentary Bill, the technical team would also prepare and assemble information for the bidders. The level of detail in this information will influence the quality of bids. Key information needed for the Invitation to Tender will include:
• background information memorandum;
• draft concession agreement;
• any undertakings or agreements as part of the Parliamentary Bill procedures;
• design standards guide including highways interface;
• utilities interface report;
• topographical, geotechnical and structural surveys;
• clearances and swept path information;
• run time estimates;
• fares and ticketing policy;
• demand and revenue forecasts including models and data.
9.3.2 Concession Agreement
The principal type of concession agreement that has been used in the UK for light rail schemes is a DBOM contract, although the details in each concession vary widely. Alternatively, as was proposed for North Edinburgh, the scheme could be split into separate design / build and operate / maintain contracts. In any event CEC should explore ways of bringing in operating experience at an early stage to assess the practicability of the scheme, and assist in refining the proposals.
The concession agreement will stipulate minimum level of service and performance for the system and may also include a policy on fares. The concessionaire will normally be required to meet all operating and maintenance costs and will retain all farebox revenue. The Invitation to Bid for the concession will detail the operating requirements that each bidder should conform to so that comparable bids may be evaluated. However, bidders may also submit bids that illustrate different implementation strategies and approaches to phased construction.

The City of Edinburgh Council Edinburgh LRT Masterplan Feasibility StudyFinal Report
C:\DOCUMENTS AND SETTINGS\CHRIS BAKER\LOCAL SETTINGS\TEMPORARY INTERNET FILES\OLK1D\0019REPORT-FINAL ISSUE.DOC REP/FI
Page 109 Ove Arup & Partners International LtdFinal Issue 16 January 2003
CEC will also need to consider how the concession deals with issues such as non-performance, quality standards and the introduction of future extensions to the network. CEC will need to establish acceptable performance measures for the concession and, penalty regimes for non-compliance. This should be linked to a monitoring regime based on easily collected data and a transparent method of evaluating performance.
The length of the franchise, the probable annual revenue generated and, the level of cost and revenue risk will be major factors for potential consortia. These must be addressed by CEC if a high level of interest is to be generated in the scheme by potential bidders. It is probable that the bidding consortia will also submit bids that are non-compliant with the outline concession agreement. These need to be carefully evaluated on an equal basis to ensure that financially better options are identified, albeit while still meeting the economic case for the scheme. These might include phasing options, fare strategies, standard or revised networks or variant system specifications.
9.3.3 Procurement Process
Tables 9.1 and 9.2 provide outline timetables for the delivery of the West Edinburgh and South East Edinburgh lines. It is also noted that the proposed timetable for North Edinburgh is similar to that for West Edinburgh. These assume that procurement and construction will take approximately three and a half years in total. From experience of other systems, this is a short timescale for delivering major light rail schemes in the UK. Therefore, the better the quality of information provided to bidders the more chance there is of meeting this timetable.
Stage One in the procurement process for the scheme would be to issue a formal notice in the Official Journal of the European Community (OJEC). This notice would inform potential bidders, either independent companies or consortia, about the scheme and the timetable for implementing it. In some cases this is supported by an open day for bidders to provide more details and provide opportunity for questions.
Stage Two would be a further OJEC inviting expressions of interest for Public / Private Partnership concession for the scheme. Respondents would be sent a pre-qualification questionnaire to establish the credentials of the bidders to design, build, operate, maintain and finance the scheme being procured. This would be evaluated to draw up initial shortlist of (4-6) bidders that would be capable of delivering the project. These bidders are likely to be in the form of consortia, which will be invited to submit a formal tender. On the basis of this tender these bidders would be reduced to two consortia, or a single preferred bidder, for Best And Final Offer (BAFO) bids.
The OJEC periods would be determined by the relevant EU regulations. Evaluation criteria for each of the stages will need to be published in advance to inform the bidders on the decision making process. This approach will ensure a fair and transparent competition.

The City of Edinburgh Council Edinburgh LRT Masterplan Feasibility StudyFinal Report
C:\DOCUMENTS AND SETTINGS\CHRIS BAKER\LOCAL SETTINGS\TEMPORARY INTERNET FILES\OLK1D\0019REPORT-FINAL ISSUE.DOC REP/FI
Page 110 Ove Arup & Partners International LtdFinal Issue 16 January 2003
10. RECOMMENDED STRATEGY The recommended strategy was developed in several steps. First, we identified all of the main corridors of movement that have the potential to support LRT, taking account of future developments, and two additional corridors identified by CEC. These were reviewed against initial sieving criteria, including the following:
• existing or future market for potential LRT demand;
• reducing congestion;
• complementary ,as far as possible, to existing public transport;
• potential for operation without financial support;
• ease of implementation;
• minimal construction cost.
Seven corridors were taken forward to a STAG Part 1 broad appraisal. The two others (Corstorphine and Portobello) have significant potential but face implementation problems and are not recommended as priorities. Earlier detailed analysis of two of the corridors: North Edinburgh Loop and South Suburban Line, was reviewed to consider their potential role in an LRT network.
Broadly defined light rail schemes were developed for all seven corridors and ASTs were prepared for each. They were also considered against key local objectives. Indicative capital and operating costs were compiled with forecasts of revenue derived from the CSTM3 model. Three corridors emerged as scoring significantly better than others in the Stage 1 appraisal and are also the most likely to have positive operating ratios. These are: north, west and south east Edinburgh that were taken forward for more detailed investigation in Phase 2.
A more detailed investigation of each of the three routes was conducted in Phase 2 in which each scheme was developed and assessed covering, among other things:
• outline alignments;
• operations;
• demand and revenue;
• environmental constraints assessment;
• restricted economic evaluation.
Based on this appraisal, we recommend that the North Edinburgh Loop be accorded highest priority among the corridors tested and that the Masterplan should include both West and South East lines as high priority schemes (see Figure 10.1).
A benchmarking exercise carried out against other light rail systems in Britain shows that forecast passenger kilometres per route kilometre for all three lines is in the range defined by other UK schemes. In terms of car kilometres and route length, the combination of the three routes is comparable with Manchester Metrolink. Forecast patronage is also comparable with Metrolink outturn traffic
The order of implementation is not determined by technical issues or clear performance ranking. However, there is a strong case for considering the West Edinburgh Line next because of development pressure, the availability of alignments and traffic congestion. We suspect that the performance of this line in our tests was affected by CSTM3 model limitations and the demand forecasts undertaken for Phase 2 will need careful review at an early stage.

The City of Edinburgh Council Edinburgh LRT Masterplan Feasibility StudyFinal Report
C:\DOCUMENTS AND SETTINGS\CHRIS BAKER\LOCAL SETTINGS\TEMPORARY INTERNET FILES\OLK1D\0019REPORT-FINAL ISSUE.DOC REP/FI
Page 111 Ove Arup & Partners International LtdFinal Issue 16 January 2003
The three lines work well as a network, based on the core Haymarket-Princes Street alignment. This would achieve important economies, reducing the forecast capital cost from £528m to £466m, and improve the financial case for all lines. They are shown in Figure 10.1.
There is potential for further development of all three lines, which would make fuller use of network assets: inner area branches of the North Edinburgh Loop are possible, including to Davidson’s Mains, which forms part of the Queensferry alignment, and the branch off South East Edinburgh towards Liberton. However, a branch off the West Edinburgh line to Hermiston Gait is not recommended.
Extensions into the SESTRANS area are also possible but the case for these is more difficult to make. None of these is likely to be attractive as stand-alone schemes and all should be considered as extensions of Edinburgh core lines. However, preliminary assessment indicted that extension of the West Edinburgh line to West Lothian (Broxburn/Livingston) and of the Southeast line to Dalkeith have the greatest potential, followed by Musselburgh via the Portobello/Joppa corridor, but this would depend on the case for the Portobello line which needs further investigation.
The development of the three priority lines will require the development of detailed business cases which should involve new patronage and revenue forecasts using tool/s developed for the task. These should also enable the likely impact of road user charging and other aspects of the ITI to be taken fully into account. The confirmation of the network strategy outlined here and the priority for subsequent lines/extensions should be reviewed on the same basis. It will be particularly important to resolve alignment problems and to gain a clearer picture of forecast competition between public transport modes.
Figure 10.1 Recommended Priority LRT Routes


APPENDIX A LRT Run Time Calculations

The City of Edinburgh Council Edinburgh LRT Masterplan Feasibility StudyFinal Report
C:\DOCUMENTS AND SETTINGS\CHRIS BAKER\LOCAL SETTINGS\TEMPORARY INTERNET FILES\OLK1D\0019REPORT-FINAL ISSUE.DOC REP/FI
Page A1 Ove Arup & Partners International LtdFinal Issue 16 January 2003
APPENDIX A – LRT RUN TIME CALCULATIONS To assess the run times on each route, tram operation was simulated using the Arup Runtime model employing the following main assumptions:
• Average acceleration rate: 1 m/sec2
• Average service braking rate: -0.9m/sec2
• Maximum speed on segregated route: 80kph
• Maximum speed on street track: 50kph
• Average dwell time per intermediate stop: 20 seconds
• Average delay to trams at traffic signals: 15 seconds
In order to assess LRT run times, it is also necessary to determine the likely delay in trams passing through signalised junctions.
In all cases it is assumed that the priority is given to the tram whenever possible. However, it is not possible to provide absolute priority through junctions. The average junction signal cycle time is assumed to be 90 seconds. At 10 tph in both directions, a tram would be expected at a given junction, on average, every two cycles. In terms of allocating green time for the tram, an absolute worst case (i.e. the longest time an LRV would take to pass through a junction) is estimated as 30 seconds. Therefore, with no priority for trams the maximum delay would be 60 seconds and the average delay 30 seconds.
Allowing for the fact that a trams arrives every other cycle and that it would be the intention that as much priority as possible would be given to LRVs, we have assumed half of the average delay that would be experienced if no priority were given, i.e. 15 seconds. Therefore, 15 seconds delay per signalled junction was added to the LRT run times. The junctions involved may be summarised as follows.
North Edinburgh Leith Walk 3 x 15 secondsLower Granton Road 1 x 15 seconds West Edinburgh Gogar Roundabout 1 x 15 secondsEdinburgh Park 1 x 15 secondsSighthill 1 x 15 seconds South East Edinburgh Pleasance 1 x 15 secondsDalkeith Road 2 x 15 secondsOld Dalkeith Road 3 x 15 seconds Common Route Roseburn Terrace 1 x 15 secondsHaymarket 2 x 15 secondsPrinces Street 4 x 15 seconds

The City of Edinburgh Council Edinburgh LRT Masterplan Feasibility StudyFinal Report
C:\DOCUMENTS AND SETTINGS\CHRIS BAKER\LOCAL SETTINGS\TEMPORARY INTERNET FILES\OLK1D\0019REPORT-FINAL ISSUE.DOC REP/FI
Page A2 Ove Arup & Partners International LtdFinal Issue 16 January 2003
The run times for each of the three urban LRT lies are summarised below, showing the assumption used to derive scheduled end-to-end run time.
West Edinburgh Line Node Kms Min:Sec Newbridge (Lochend) (1) 13.20 19:50 Dalry (2) 2.63 5:40 St David Street (3) 0.53 1:34 N St Andrew Street (4) Totals 16.36 27:04 Signal delays (10 junctions x 15 sec.) 2:30 Total Run 29.34 Recovery time (5%) 1:25 Run time (excl. layover) 30:59 [Average speed = 31.7 kph] North Edinburgh Line Kms Min:Sec North St Andrew Street (4) 12.45 24:35 Dalry (2) 2.63 5:40 St David Street (3) 0.53 1:34 North St Andrew Street (4) Totals 15.61 31:49 Signal delays 11 junctions x 15 secs 2:45 Total run 34:34 Recovery time (5%) 1:44 Run time (excl. layover) 36:18 [Av. speed = 25.9 kph]
South East Edinburgh Line (Haymarket – Danderhall) Node Kms Min:Sec
Danderhall (6) 8.24 15:24 Waverley Bridge (5) 0.12 00:18 St David Street (3) 1.74 4:06 Haymarket (7) Totals 10.10 19:48 Signal delays (12 junctions x 15 secs) 3:00 Run time 22:48 Recovery time (5%) 1:08 Run time each layover 23:56 [Av speed = 25.3kph]

APPENDIX B Forecasting using CSTM3

The City of Edinburgh Council Edinburgh LRT Masterplan Feasibility StudyFinal Report
C:\DOCUMENTS AND SETTINGS\CHRIS BAKER\LOCAL SETTINGS\TEMPORARY INTERNET FILES\OLK1D\0019REPORT-FINAL ISSUE.DOC REP/FI
Page B1 Ove Arup & Partners International LtdFinal Issue 16 January 2003
APPENDIX B – FORECASTING USING CSTM3
CSTM3 CSTM3, is a multi-modal model developed to represent strategic traffic movements and mode share for a 1997 Base year. The model covers an area from Dundee in the northeast, south to the Borders and Dumfries & Galloway represented by 1180 geographical zones. Therefore, it incorporates all the main urban centres in Scotland other than Aberdeen and Inverness.
The CSTM3 highway network includes all trunk roads, motorways and the majority of A class roads. In the urban areas the network definition extends to a lower level of road category, for instance local distributors. On the public transport side CSTM3 incorporates all elements of the rail network and bus services including inter-city services.
CSTM3 was developed from a series of 'seed' models, including the Edinburgh Area Traffic Model (EATM) for a definition of the road network within Edinburgh and a VIPS model of the city for public transport provision, including services and fares.
CSTM3 was created to assess traffic conditions for different network and demand situations for three specific time periods, namely:
• morning peak hour (0800 - 0900);
• off-peak period (1000 - 1600); and
• evening peak hour (1700 - 1800).
Forecasts of travel demand are available for four assessment years, namely 2001, 2006, 2011 and 2021, using a trip end model incorporating all major land use development proposals within the modelled area and demographic projections. The future years also have planning data supplied by the local authorities included in the matrices. Predictions of traffic conditions are available for low, central and high economic growth forecasts. The CSTM3 land use data were used directly in the new National Trip End Model.
The modelling work was undertaken using the TRIPS/32 version 2, as provided by Citilabs (formerly MVA). The version of the CSTM3 model is 1.2, as provided by MVA.
Link Coding As light rail alignments are a mixture of highway and dedicated public transport infrastructure it is necessary to code almost the entire light rail network in the CSTM3 highway model. The exception occurs when the light rail network has to connect to the rail network, for example at the Forth Rail Bridge.
There are three types of coded alignment for light rail:
• fully segregated;
• roadside segregated;
• street running.
Roadside links are assumed to allow buses and taxies to share the alignments.
The first two types of light rail alignment were coded explicitly using a TRIPS Link Type 25 and 30, respectively. To overcome restrictions in the TRIPS highway assignment model, it was necessary to add a node upstream of the junction node and join the light rail links to this new node. Links associated with street running do not require any link changes.
To connect light rail to zones and to the highway network, two types of connector were used. The first type represents additional zone centroid connectors. Judgement was used on where

The City of Edinburgh Council Edinburgh LRT Masterplan Feasibility StudyFinal Report
C:\DOCUMENTS AND SETTINGS\CHRIS BAKER\LOCAL SETTINGS\TEMPORARY INTERNET FILES\OLK1D\0019REPORT-FINAL ISSUE.DOC REP/FI
Page B2 Ove Arup & Partners International LtdFinal Issue 16 January 2003
and how many connectors were used to reflect the urban area represented by a zone, any physical restrictions that may limit the access to specific zones and the types of connectors used for the rail network. This latter consideration determined the link characteristics, of which link length is the most important.
All light rail stops were given at least one connection to the highway network. This is important to ensure that there is connectivity to zones that do not have specific light rail centroid connectors but can access the light rail network via the highway network, where walking is permitted in the model. Highway connectors to rail in the vicinity of the light rail station were used as a guide for coding the light rail highway connectors.
Junction Coding Wherever a light rail alignment interacts with a traffic junction it is important to represent the impact on general traffic. It was assumed that almost all such junctions feature signal control – there are a small number of priority ‘T’ junctions where the minor arm would stay as a ‘Give Way’ following the introduction of light rail.
The outcome of light rail priorities at road junctions is that conflicting traffic movements lose ‘green time’ and road space. To allow the consistent coding of these capacity reductions a number of general rules were used. Two types of junction are encountered within the CSTM3 model - modelled junctions; and uncontrolled junctions. For modelled junctions there are three types, as discussed below.
Priority junctions cannot have more than four connecting arms in TRIPS. Where the light rail alignment follows the major arms of a priority junction there should be no changes to the junction whether it is segregated or street running. If the light rail alignment uses a minor arm then the junction was assumed to be changed to signals.
Roundabouts can have up to eight connecting arms. Where an light rail alignment crosses a roundabout it was assumed that ‘pre-signals’ will be added to all highway arms and that traffic will have a 15 second delay to allow trams to pass through the roundabout. Using this assumption there is no need to connect the trams to the roundabout node and instead the light rail alignment should pass to the side of the roundabout node. It was assumed that there will be no road space lost for general traffic at roundabouts as the nature of the ‘pre-signals’ should mean that, within the roundabout layout, light rail and general traffic will share the same road space.
Signalised junctions cannot have more than four connecting arms in TRIPS. Two adjustments were made to the junction coding to allow for light rail interaction. The first involved reducing the saturation flow at the junction to account for road space taken by the dedicated light rail lane. This involved either reducing the number of effective lanes on the light rail arm or reducing the collective saturation flows. For the latter the saturation flow for any adjusted arm should not be less than 1965 PCUs/hour. The second involved reducing the proportion of green time available for each movement. CSTM3 does not use VA signalling and so, for any particular movement, the designated green time represents a fixed percentage of the total cycle time.
For 10 tph in each direction, the time lost at a set of signals as a result of light rail is assumed to be 20 seconds. The number of trams through any particular junction was assessed and the amount of loss time calculated accordingly. A cycle time of 100 seconds was assumed for each junction. The proportion of green time for each stage was reduced according to the number of trams passing through it.
Since light rail routes follow bus corridors it was assumed that the majority of bus services would share the light rail alignment where possible.
Care was taken to read all warning output from TRIPS during the network building process.

The City of Edinburgh Council Edinburgh LRT Masterplan Feasibility StudyFinal Report
C:\DOCUMENTS AND SETTINGS\CHRIS BAKER\LOCAL SETTINGS\TEMPORARY INTERNET FILES\OLK1D\0019REPORT-FINAL ISSUE.DOC REP/FI
Page B3 Ove Arup & Partners International LtdFinal Issue 16 January 2003
Public Transport Services To allow for the reporting of light rail patronage it was important that it had a unique public transport sub-mode within TRIPS. While TRIPS can accommodate numerous sub-modes, the CSTM3 control data cannot be edited and so CSTM3 is limited to four sub-modes. Therefore, Glasgow Underground was recoded with the same characteristics as inter urban bus to allow light rail to exclusively use PT sub-mode 4.
Two types of PT service coding were required. Firstly, bus services were adjusted to make use of light rail/bus lanes. The best approach is to make global adjustments to bus services using the NODEO and NODEN TRIPS facility. In order to adopt this approach, it was necessary to obtain a revised version of the MVPUBL software from Citilabs. This resolved a problem with a bug in the CSTM3 version that produced errors with the PT lines file. The second type of service to code is light rail.
Service Pattern for the Recommended Network Four services were defined, covering the three line network. The four light rail services defined for the Phase 2 Appraisal were:
• North Edinburgh Loop – closed and continuous loop.
• Kirkliston to Edinburgh waterfront – combine West Edinburgh and eastern side of North Edinburgh loop, via city centre.
• Danderhall to Edinburgh waterfront – combine South East Edinburgh line and western side of North Edinburgh loop, via city centre.
• Kirkliston to Danderhall – combine West Edinburgh and South East Edinburgh lines.
For each route 5 tph was assumed all day giving a combined frequency of 10 tph on each of the three lines and 20 tph between Haymarket and St Andrew Square. Individual lines were tested at 10 tph using simple end-to-end services as described in the main report.
Operating Speed Segregated sections of light rail and former/existing rail alignments were coded to a maximum speed of 70kph and street alignment to a maximum of 40kph. However, the speed on street sections in the forecasts was determined by equilibrium traffic speed subject to the 40 kph maximum. Operating speeds for these two alignments were adjusted to allow for deceleration, dwell time and acceleration associated with stops. This can only be input for the segregated sections of track (sections of shared running cannot be adjusted as the speeds are determined dynamically from car speeds).
Due to the hard coding of parameters in CSTM3 the stop delay allowance must be input as a change to link speed. This change to link speed was calculated by measuring the length of each segregated section and counting the number of stops on each section. We assumed dwell time to be between 20 and 30 seconds and used a clearance of 25 seconds. The acceleration/ deceleration associated with 40 kph was estimated at 14 seconds in total, and for 70 kph 20 seconds in total. Therefore, using a value of 39 and 45 seconds for street and fully segregated respectively, link speeds were adjusted and then added to each light rail link within each particular section of track.
Stop Locations Phase 2 of the testing involved some alterations to the locations of the stops used in the preliminary assessment. The North Edinburgh stops devised by the Andersen team were used. For the West Edinburgh and South East Edinburgh lines stop locations were consistent with the alignments considered as part of this study.

The City of Edinburgh Council Edinburgh LRT Masterplan Feasibility StudyFinal Report
C:\DOCUMENTS AND SETTINGS\CHRIS BAKER\LOCAL SETTINGS\TEMPORARY INTERNET FILES\OLK1D\0019REPORT-FINAL ISSUE.DOC REP/FI
Page B4 Ove Arup & Partners International LtdFinal Issue 16 January 2003
Fare Structure Due to difficulties of not being able to add PT sub-modes to CSTM3 the Phase 1 results were based on a flat fare. While it is recognised that this is unrealistic, it does represent a particular input for revenue forecasting and applied consistently in the initial comparative sifting process. Phase 2 strategy tests included the interurban bus fare structure in CSTM3.
Traffic Signal Assumptions The light rail headway depends on the number of services running on each section of line. Therefore, the time associated with delay at traffic signals to general traffic will vary. The calculation below uses a frequency of 10 tph:
Light rail headway = 6 minutes;
Stage time required for light rail (considered worst case) = 30 seconds;
Average Signal Cycle Time = 90 seconds.
As a tram arrives on average one every three minutes and there are two cycles per three minute period, on average there will be a delay of 15 seconds per cycle. Therefore, assuming that all traffic junctions including light rail movements will be signalised, any such junction will have 15 seconds additional delay added to conflicting traffic movements.
Furthermore, for each extra 5 tph, 7.5 seconds additional delay was added to conflicting traffic movements so that sections of light rail network with 20 tph combined frequency had 30 seconds additional delay.
Complimentary Transport Strategy and Policy No complimentary transport strategy or policy that would directly discourage the use of private vehicles has been modelled, for example road user charging. Assumptions on the sharing of light rail segregated on-street alignments with bus have been included.
Node Numbering All new nodes coded that form part of the light rail system were coded in the 31xx-36xx node series. The table below contains details of node numbering systems that were used.
Node Series Description
3100 – 3108 Northern Edinburgh Line (from Waterfront to west of Princes St) 3109 – 3126 West Edinburgh Line (from CC to West Edinburgh) 3127 – 3132 Queensferry to Newbridge Link (from south to north)
3132 Node link to Dalmeny railway station 3133 Spur to Edinburgh Airport
3136 – 3152 Queensferry Line (from CC to Queensferry) 3160 – 3191 S Edinburgh QBC (from east side of Princes St down A7 and A701 towards
Penicuik) 3192 – 3194 Fully segregated light rail section of western side of Princes St
3195 Spur to Heriot Watt University 3200 – 3215 S Edinburgh QBC (from A7/A701 junction down A7 towards Dalkeith) 3220 – 3224 West side of Southern Orbital Line (link from West Edinburgh to Queensferry) 3250 – 3254 Split external links for highway/walk links to new light rail stations 3301 – 3312 Southern Orbital Route (from west to east)

The City of Edinburgh Council Edinburgh LRT Masterplan Feasibility StudyFinal Report
C:\DOCUMENTS AND SETTINGS\CHRIS BAKER\LOCAL SETTINGS\TEMPORARY INTERNET FILES\OLK1D\0019REPORT-FINAL ISSUE.DOC REP/FI
Page B5 Ove Arup & Partners International LtdFinal Issue 16 January 2003
Node Series Description
3320 – 3329 One-way dummy links at roundabouts for junction modelling 3340 – 3343 Roundabout junction modelling, light rail only nodes 3424, 3442 Original CSTM3 nodes
3500 – 3533 New nodes on S Edinburgh line, 10m from existing junction 3550 – 3564 Completion of the north part of N Edinburgh loop - Phase 1 3600 – 3625 South Suburban line from east to west – Phase 1 3650 – 3656 Eastbound light rail line on Princes St – Phase 2 3660 – 3688 Clockwise N Edinburgh along Leith Walk and westbound along Princes St 3690 – 3694 Completion of the north part of N Edinburgh loop – Phase 2
Model Tests The modelling work was organised into strategies that feature the light rail system and other schemes and policies, primarily consisting of highway works. The following list represents the development of modelling strategies to test each of the light rail proposals studied and the reference case used for comparison:
• Strategy RC – 2001 Reference Case – Do-Nothing
Version A – as supplied
Version B – Glasgow Underground (originally PT sub-mode 4) re-coded for comparison with light rail
Version C – 2001 PT services (supplied by MVA) added
• Strategy RC – 2011 Reference Case – Do-Nothing
Version A – as supplied
Version B – Glasgow Underground (originally PT sub-mode 4) re-coded for comparison with light rail
Version C – 2001 PT services (supplied by MVA) added
• Strategy 01 2011 – full light rail system, built from a 2011 Do-Nothing
Version A – AM only, light rail coded as PT sub-mode 4
Version B – OP and PM added
Version C – Glasgow Underground (originally PT sub-mode 4) re-coded as Inter Urban Bus (PT sub-mode 2) and light rail coded as PT sub-mode 4.
Version D – corrected light rail fares added and LRT.dat amended
Version E – Recode.dat changed to avoid light rail junction delays
Version F – complete North Edinburgh and South Suburban line added
Version G – 2001 PT services (supplied by MVA) added
Version H – distance of some walk links corrected
Version J – location of stops on W Edinburgh and SE Edinburgh revised
Version K – new method of junction coding applied
• Strategy 02 2011 – West Edinburgh line, built from a 2011 Do-Nothing

The City of Edinburgh Council Edinburgh LRT Masterplan Feasibility StudyFinal Report
C:\DOCUMENTS AND SETTINGS\CHRIS BAKER\LOCAL SETTINGS\TEMPORARY INTERNET FILES\OLK1D\0019REPORT-FINAL ISSUE.DOC REP/FI
Page B6 Ove Arup & Partners International LtdFinal Issue 16 January 2003
Version A – detail as specified by Strategy 01G
Version B – no Queensferry link. Stops of W Edinburgh and SE Edinburgh revised
Version C – loss times altered on junction modelling
Version D – speed Adjustments made to account for light rail dwell time and acceleration/retardation
• Strategy 03 2011 – North Edinburgh, built from a 2011 Do-Nothing
Version A – detail as specified by Strategy 01G
Version B – speed adjustments made to account for light rail dwell time and acceleration/retardation
Version C – loss times altered on junction modelling
Version D – new method of junction coding applied
Version E – airport zone centroid connectors amended
• Strategy 04 2011 – West Edinburgh and North Edinburgh lines, built from a 2011 Do-Nothing
Version A – detail as specified by Strategy 01G
• Strategy 05 2011 – West Edinburgh, North Edinburgh and SE Edinburgh line, built from a 2011 Do-Nothing
Version A – detail as specified by Strategy 01G
Version B – adjustments made to junction delays
Version C – loss times altered on junction modelling
Version D – new method of junction coding applied
Version E – adjustments made to stop locations
Version F – airport zone centroid connectors amended, distances amended on SE Edinburgh
Strategy 06 2011 – SE Edinburgh including Princes St
Version A – details as specified by 01G
Version B – airport zone centroid connectors amended, distances amended on SE Edinburgh

APPENDIX C Indicative Structures for West and SE Edinburgh Routes

The City of Edinburgh Council Edinburgh LRT Masterplan Feasibility StudyFinal Report
C:\DOCUMENTS AND SETTINGS\CHRIS BAKER\LOCAL SETTINGS\TEMPORARY INTERNET FILES\OLK1D\0019REPORT-FINAL ISSUE.DOC REP/FI
Page C1 Ove Arup & Partners International LtdFinal Issue 16 January 2003
APPENDIX C – INDICATIVE STRUCTURES FOR WEST AND SE EDINBURGH ROUTES The following drawings illustrate indicative structures associated with alignment options for the West Edinburgh and South East Edinburgh tram routes.
Bridge No. 6 Indicative structure for bridge over the South Suburban railway line at Cameron Toll.
Bridge No. 11 Indicative structure for bridge over the A8 at Gogar roundabout.
Bridge No. 12 Indicative structure for bridge over the Edinburgh – Falkirk railway line immediately south of Edinburgh Park
Bridge No. 16 Indicative structure for bridge over the Edinburgh – Falkirk railway line adjacent to Carrick Knowe golf course

APPENDIX D Track Forms, OHLE & Stop Layouts

The City of Edinburgh Council Edinburgh LRT Masterplan Feasibility StudyFinal Report
C:\DOCUMENTS AND SETTINGS\CHRIS BAKER\LOCAL SETTINGS\TEMPORARY INTERNET FILES\OLK1D\0019REPORT-FINAL ISSUE.DOC REP/FI
Page D1 Ove Arup & Partners International LtdFinal Issue 16 January 2003
APPENDIX D – TRACK FORMS, OHLE & STOP LAYOUT The drawings in this appendix show key features of Edinburgh light rail assumed for costing and feasibility purposes:
1. Three track forms are shown for:
- track embedded in road with asphalt surfacing;
- grassed track for reservation;
- ballasted track for reservation.
2. The layout of typical tram stops are shown in four drawings:
- plan at 1:1000 of a side platform stop at Dalkeith Road/Holyrood Park Road;
- a centre (island) platform stop on Burdiehouse Road at Southhouse Broadway;
- cross section of track and platform at stops on and off street;
- a schematic platform layout with canopy shelter.
3. A cross section showing street operation with typical span wire and traction pole arrangement.
APPENDIX E Fares for LRT Revenue Forecasts

The City of Edinburgh Council Edinburgh LRT Masterplan Feasibility StudyFinal Report
C:\DOCUMENTS AND SETTINGS\CHRIS BAKER\LOCAL SETTINGS\TEMPORARY INTERNET FILES\OLK1D\0019REPORT-FINAL ISSUE.DOC REP/FI
Page E1 Ove Arup & Partners International LtdFinal Issue 16 January 2003
APPENDIX E – FARES FOR LRT REVENUE FORECASTS We reviewed the current fare structure being used by Lothian Buses for urban services in Edinburgh. These operate on a distance-based function specified by stages with a minimum 50p fare. It is noted that all fare payments are made on the basis of exact change only. The length between fare stages can vary significantly, therefore it is only possible to derive an average fare – distance relationship based on this information.
As a guide, Service 33, which crosses from Ferniehill in south east Edinburgh to Wester Hailes via Princes Street, Haymarket and Saughton was checked.
The Lothian Buses fare structure is as follows for adult single fares:
1-2 stages 50p 3-8 stages 80p 9-13 stages 90p 14+ stages £1.00
Radial corridors typically have between 10 and 15 stages between the city centre and the edge of the urban area. This means that the longest trips in any one corridor would cost £1.00, as would any cross city trips. Local journeys and those within the city centre (e.g., between Waverley and Haymarket) are 50p.
The LRT fare levels that best fit this structure are for a minimum fare equivalent to bus, i.e. 50p, and a 10p per kilometre distance based fare. This would lead to much higher fare values than bus for longer distance journeys so it may be necessary to cap the maximum fare in the same way as for bus travel, but perhaps at a premium level (for example £1.20). Furthermore, the tram system will require purchase of a ticket before boarding and will include provision for giving change, therefore the farebox revenue will more closely reflect the actual journeys undertaken.
The table below illustrates the Lothian Buses fare structure, taking tram network stops as examples.
Fare
Dan
derh
all
Mor
edun
Roy
al In
firm
ary
Cam
eron
Tol
l
Com
mon
wea
lth P
ool
Parli
amen
t
Wav
erle
y
Wes
t End
Hay
mar
ket
Mur
rayf
ield
Saug
hton
Sten
hous
e
Edin
burg
h Pa
rk
Danderhall - 50 80 80 80 90 90 90 90 100 100 100 100
Moredun 50 - 50 80 80 80 90 90 90 90 100 100 100
Royal Infirmary 80 50 - 50 80 80 80 90 90 90 90 100 100
Cameron Toll 80 80 50 - 50 80 80 80 90 90 90 90 100
Commonwealth Pool 80 80 80 50 - 50 80 80 80 90 90 90 90
Parliament 90 80 80 80 50 - 50 80 80 80 90 90 90
Waverley 90 90 80 80 80 50 - 50 80 80 80 90 90
West End 90 90 90 80 80 80 50 - 50 80 80 80 90
Haymarket 90 90 90 90 80 80 80 50 - 50 80 80 80
Murrayfield 100 90 90 90 90 80 80 80 50 - 50 80 80
Saughton 100 100 90 90 90 90 80 80 80 50 - 50 80
Stenhouse 100 100 100 90 90 90 90 80 80 80 50 - 50
Edinburgh Park 100 100 100 100 90 90 90 90 80 80 80 50 -

The City of Edinburgh Council Edinburgh LRT Masterplan Feasibility StudyFinal Report
C:\DOCUMENTS AND SETTINGS\CHRIS BAKER\LOCAL SETTINGS\TEMPORARY INTERNET FILES\OLK1D\0019REPORT-FINAL ISSUE.DOC REP/FI
Page E2 Ove Arup & Partners International LtdFinal Issue 16 January 2003
Distance
Dan
derh
all
Mor
edun
Roy
al In
firm
ary
Cam
eron
Tol
l
Com
mon
wea
lth P
ool
Parli
amen
t
Wav
erle
y
Wes
t End
Hay
mar
ket
Mur
rayf
ield
Saug
hton
Sten
hous
e
Edin
burg
h Pa
rk
Danderhall - 1 2.2 3.9 5.2 6.4 7.3 8.4 9.2 10.9 12.8 13.9 15
Moredun 1 - 1.2 2.9 4.2 5.4 6.3 7.4 8.2 9.9 11.8 12.9 14
Royal Infirmary 2.2 1.2 - 1.7 3 4.2 5.1 6.2 7 8.7 10.6 11.7 12.8
Cameron Toll 3.9 2.9 1.7 - 1.3 2.5 3.4 4.5 5.3 7 8.9 10 11.1
Commonwealth Pool 5.2 4.2 3 1.3 - 1.2 2.1 3.2 4 5.7 7.6 8.7 9.8
Parliament 6.4 5.4 4.2 2.5 1.2 - 0.9 2 2.8 4.5 6.4 7.5 8.6
Waverley 7.3 6.3 5.1 3.4 2.1 0.9 - 1.1 1.9 3.6 5.5 6.6 7.7
West End 8.4 7.4 6.2 4.5 3.2 2 1.1 - 0.8 2.5 4.4 5.5 6.6
Haymarket 9.2 8.2 7 5.3 4 2.8 1.9 0.8 - 1.7 3.6 4.7 5.8
Murrayfield 10.9 9.9 8.7 7 5.7 4.5 3.6 2.5 1.7 - 1.9 3 4.1
Saughton 12.8 11.8 10.6 8.9 7.6 6.4 5.5 4.4 3.6 1.9 - 1.1 2.2
Stenhouse 13.9 12.9 11.7 10 8.7 7.5 6.6 5.5 4.7 3 1.1 - 1.1
Edinburgh Park 15 14 12.8 11.1 9.8 8.6 7.7 6.6 5.8 4.1 2.2 1.1 -
pence per kilometre(1)
Dan
derh
all
Mor
edun
Roy
al In
firm
ary
Cam
eron
Tol
l
Com
mon
wea
lth P
ool
Parli
amen
t
Wav
erle
y
Wes
t End
Hay
mar
ket
Mur
rayf
ield
Saug
hton
Sten
hous
e
Edin
burg
h Pa
rk
Danderhall - 10 18 10 8 8 7 6 5 6 5 4 4
Moredun 10 - 8 14 10 7 8 7 6 5 5 5 4
Royal Infirmary 18 8 - 6 13 10 8 8 7 6 5 5 5
Cameron Toll 10 14 6 - 8 16 12 9 9 7 6 5 5
Commonwealth Pool 8 10 13 8 - 8 19 13 10 9 7 6 5
Parliament 8 7 10 16 8 - 11 20 14 9 8 7 6
Waverley 7 8 8 12 19 11 - 9 21 11 7 8 6
West End 6 7 8 9 13 20 9 - 13 16 9 7 8
Haymarket 5 6 7 9 10 14 21 13 - 6 11 9 7
Murrayfield 6 5 6 7 9 9 11 16 6 - 5 13 10
Saughton 5 5 5 6 7 8 7 9 11 5 - 9 18
Stenhouse 4 5 5 5 6 7 8 7 9 13 9 - 9
Edinburgh Park 4 4 5 5 5 6 6 8 7 10 18 9 - (1) Figures allow for boarding charge.

APPENDIX F Mapping of Social Deprivation and Housing Indices

The City of Edinburgh Council Edinburgh LRT Masterplan Feasibility StudyFinal Report
C:\DOCUMENTS AND SETTINGS\CHRIS BAKER\LOCAL SETTINGS\TEMPORARY INTERNET FILES\OLK1D\0019REPORT-FINAL ISSUE.DOC REP/FI
Page F1 Ove Arup & Partners International LtdFinal Issue 16 January 2003
APPENDIX F – MAPPING OF SOCIAL DEPRIVATION AND HOUSING INDICES
Future Regional Development In addition to existing population and employment distributions it is necessary to assess how population, employment, and travel activity distributions may change as a result of programmed land use policies in the region. The following, defined as ‘core development areas’ within the Lothian Region draft Structure Plan, are of relevance:
• Central West Lothian
• Newbridge / Kirkliston / Ratho
• Edinburgh Park / South Gyle / Sighthill
• Waterfront Edinburgh
• Edinburgh City Centre
• North Midlothian
• East Lothian Transport Corridors
New areas for employment and housing are also defined within the Fife Structure Plan. Planned employment developments are particularly concentrated in the Dunfermline - Rosyth - Inverkeithing area. In common with the Draft Lothian Structure Plan, Fife also faces pressure to allocate land for new housing to meet ambitious housing targets over the next decade or so.
Figure F1 provides a broad indication of the distribution of additional housing across the Lothians and Fife region implied by their respective Structure Plans. It is clear that the most significant expansion of housing will occur beyond the City of Edinburgh, within Central West Lothian. Other significant concentrations will occur as a result of the Waterfront Edinburgh redevelopment within the City, and the Dalkeith – Gorebridge area in Midlothian
It is assumed that the distribution of economic development will not match the distribution of new housing outside Edinburgh as anticipated in the Structure Plan. It is therefore likely that commuting between Edinburgh and its surrounding areas will increase. If this is not to result in unacceptable levels of additional car traffic, there will be requirement for expanding the public transport network to areas such as Central West Lothian and South-East Edinburgh in particular.

The City of Edinburgh Council Edinburgh LRT Masterplan Feasibility StudyFinal Report
C:\DOCUMENTS AND SETTINGS\CHRIS BAKER\LOCAL SETTINGS\TEMPORARY INTERNET FILES\OLK1D\0019REPORT-FINAL ISSUE.DOC REP/FI
Page F2 Ove Arup & Partners International LtdFinal Issue 16 January 2003
Figure F1 Penetration of Preferred Network Into Areas of New Housing Allocated within the Lothians and Fife.

The City of Edinburgh Council Edinburgh LRT Masterplan Feasibility StudyFinal Report
C:\DOCUMENTS AND SETTINGS\CHRIS BAKER\LOCAL SETTINGS\TEMPORARY INTERNET FILES\OLK1D\0019REPORT-FINAL ISSUE.DOC REP/FI
Page F3 Ove Arup & Partners International LtdFinal Issue 16 January 2003
Social Deprivation Indices In 1998 the Central Research Unit of the Scottish Executive published the findings of a research study of social deprivation in Scotland, undertaken by the Department of Urban Studies at the University of Glasgow. The study considered that social deprivation in Scotland could be best understood in terms of the following six dimensions of human activity:
• housing;
• health;
• labour market;
• crime/wider environment;
• education;
• poverty.
Census and non-census indicators of these dimensions were selected and mapped across Scotland to identify the distribution of social deprivation across Scotland. The report showed that some of the most socially deprived areas of Scotland are within the Lothian region. These are shown in Figure F2 in relation to the Phase 2 LRT network.
The figure shows that the LRT network will provide public transport access to many areas within Edinburgh currently suffering from the symptoms of social deprivation. It also indicates that improved access to selected destinations of regional importance such as the New Royal Infirmary, the Edinburgh Waterfront Development, and Edinburgh Park, would arise.
Figure F3 presents a distribution of Social Inclusion Partnerships (SIPS) and Assisted Areas that qualify for regional selective assistance from the Scottish Executive. This indicates the desirability in social inclusion terms of focusing LRT operations in the north and south-eastern sections of the City. It can also be seen from the figure that the assisted areas of South Queensferry and Kirkliston would also benefit.

The City of Edinburgh Council Edinburgh LRT Masterplan Feasibility StudyFinal Report
C:\DOCUMENTS AND SETTINGS\CHRIS BAKER\LOCAL SETTINGS\TEMPORARY INTERNET FILES\OLK1D\0019REPORT-FINAL ISSUE.DOC REP/FI
Page F4 Ove Arup & Partners International LtdFinal Issue 16 January 2003
Figure F2 Penetration of the Preferred Network into Areas of Social Deprivation.

The City of Edinburgh Council Edinburgh LRT Masterplan Feasibility StudyFinal Report
C:\DOCUMENTS AND SETTINGS\CHRIS BAKER\LOCAL SETTINGS\TEMPORARY INTERNET FILES\OLK1D\0019REPORT-FINAL ISSUE.DOC REP/FI
Page F5 Ove Arup & Partners International LtdFinal Issue 16 January 2003
Figure F3 Penetration of the Preferred Network into Assisted Areas and ‘Area-Based’ Social Inclusion Partnerships (SIPS).

APPENDIX G Environmental Constraints Mapping

The City of Edinburgh Council Edinburgh LRT Masterplan Feasibility StudyFinal Report
C:\DOCUMENTS AND SETTINGS\CHRIS BAKER\LOCAL SETTINGS\TEMPORARY INTERNET FILES\OLK1D\0019REPORT-FINAL ISSUE.DOC REP/FI
Page G1 Ove Arup & Partners International LtdFinal Issue 16 January 2003
APPENDIX G – ENVIRONMENTAL CONSTRAINTS MAPPING This appendix presents a broad assessment of the environmental constraints relevant to the proposed LRT network within the City of Edinburgh. The assessment is intended for use within a STAG (Scottish Transport Appraisal Guidance) Stage 1 framework. Consequently, the following key variables were examined:
• natural and built environmental constraints and opportunities;
• links to other key policy initiatives.
Network Definition This assessment was conducted in general terms for each corridor at Phase 1 and our findings are reported in the main text of the report. This appendix concentrates on the three lines of the Edinburgh LRT network that was the subject of evaluation in Phase 2 of this study. We used data provided by CEC from their GIS database and other available information. In order that a suitable assessment of the above variables is undertaken, each corridor is examined individually.
Environmental Constraint Data Environmental constraints may be described as two-fold:
• planning constraints of land designated for another purpose, such as cycle routes, natural heritage designations and listed buildings; and
• constraints due to noise and air quality, due to changes in traffic movements.
Where routes involve street running, it is unlikely that there is going to be any significant impact on the environmental resources along the route. The impact is likely to be confined to key junctions where traffic levels may produce localised changes to noise or air quality. However, where the route is off-street, on vacant ground, disused railway lines or countryside areas, the environmental constraints may need to be investigated further.
The environmental planning constraints for the routes were divided into four categories:
• Primary and secondary constraints due to ecological and landscape designations; and
• Primary and secondary constraints based on designations for the built environment.
Primary constraints are those thought to be the most significant, mainly because of a statutory designation (i.e. one enacted through legislation), or are important national assets. Secondary constraints are those designations driven by local development planning activities.
The environmental constraint figures that follow illustrate the planning designations of the City of Edinburgh that are the most relevant to the preferred route corridors. Other constraints were considered but not presented. These included:
• RAMSAR sites, Special Areas of Conservation, and Special Protection Areas (all are covered by SSSI designations in the study area);
• Biosphere and Biogenic Reserves (none in vicinity);
• Intermediate and Raised Bogs, and Landscape Character Assessments (classifications rather than designations);
• Significant Open Spaces, and Neighbourhood Nature Areas (non-statutory and covered by other designations); and
• HSE Hazard Consultation Zones (only important in specific circumstances).

The City of Edinburgh Council Edinburgh LRT Masterplan Feasibility StudyFinal Report
C:\DOCUMENTS AND SETTINGS\CHRIS BAKER\LOCAL SETTINGS\TEMPORARY INTERNET FILES\OLK1D\0019REPORT-FINAL ISSUE.DOC REP/FI
Page G2 Ove Arup & Partners International LtdFinal Issue 16 January 2003
NORTH EDINBURGH LOOP
Environmental Constraints and Opportunities
Ecology and Landscape Variables – Primary Constraints
Figure G1 illustrates the distribution of primary ecological and landscape constraints in the vicinity of the tramway. There are few ecological constraints along the proposed route. There are two small Tree Preservation Orders adjacent to the route. In addition, the Firth of Forth Site of Special Scientific Interest, which is also a Special Protection Area, lies along the northern coastal fringe. This will need to be avoided during construction and mitigating measures taken to prevent ongoing disturbance or degradation of the site.
Ecology and Landscape Variables – Secondary Constraints
Figure G2 shows the secondary ecological and landscape constraints near to the tramway. There are no secondary ecological constraints along or immediately adjacent to the route.
The Built Environment – Primary Constraints
Figure G3 illustrates the primary built environment constraints around the tramway alignment. The route runs through the Edinburgh World Heritage Site, from where it meets Haymarket Terrace through Princes Street and west to Leith Walk. The World Heritage Site designation protects the physical appearance of the historic buildings and the streetscape of the city centre. It is important that the tram system is designed to minimise the impact on the appearance of the historic buildings.
The line passes through Conservation Areas that are not within the World Heritage Site that also protect the character of the area. There are also several listed buildings along the route. As most of the route is either on-street or runs on former railway alignment, there are unlikely to be significant impacts on listed buildings.
The Built Environment – Secondary Constraints
Figure G4 shows the distribution of secondary built environment constraints in the vicinity of the tramway. There are cycle routes along a significant length of the tram route, and the tram will either share the alignment with parallel provision for cyclists, or alternative cycle routes will need to be found in accordance with City of Edinburgh Council policy. This particularly applies to the section of disused railway from Granton to Corstorphine.

The City of Edinburgh Council Edinburgh LRT Masterplan Feasibility StudyFinal Report
C:\DOCUMENTS AND SETTINGS\CHRIS BAKER\LOCAL SETTINGS\TEMPORARY INTERNET FILES\OLK1D\0019REPORT-FINAL ISSUE.DOC REP/FI
Page G3 Ove Arup & Partners International LtdFinal Issue 16 January 2003
Figure G1 Primary Ecological and Landscape Constraints of the North Edinburgh Loop.

The City of Edinburgh Council Edinburgh LRT Masterplan Feasibility StudyFinal Report
C:\DOCUMENTS AND SETTINGS\CHRIS BAKER\LOCAL SETTINGS\TEMPORARY INTERNET FILES\OLK1D\0019REPORT-FINAL ISSUE.DOC REP/FI
Page G4 Ove Arup & Partners International LtdFinal Issue 16 January 2003
Figure G2 Secondary Ecological and Landscape Constraints of the North Edinburgh Loop.

The City of Edinburgh Council Edinburgh LRT Masterplan Feasibility StudyFinal Report
C:\DOCUMENTS AND SETTINGS\CHRIS BAKER\LOCAL SETTINGS\TEMPORARY INTERNET FILES\OLK1D\0019REPORT-FINAL ISSUE.DOC REP/FI
Page G5 Ove Arup & Partners International LtdFinal Issue 16 January 2003
Figure G3 Primary Built Environment Constraints of the North Edinburgh Loop.

The City of Edinburgh Council Edinburgh LRT Masterplan Feasibility StudyFinal Report
C:\DOCUMENTS AND SETTINGS\CHRIS BAKER\LOCAL SETTINGS\TEMPORARY INTERNET FILES\OLK1D\0019REPORT-FINAL ISSUE.DOC REP/FI
Page G6 Ove Arup & Partners International LtdFinal Issue 16 January 2003
Figure G4 Secondary Built Environment Constraints of the North Edinburgh Loop.

The City of Edinburgh Council Edinburgh LRT Masterplan Feasibility StudyFinal Report
C:\DOCUMENTS AND SETTINGS\CHRIS BAKER\LOCAL SETTINGS\TEMPORARY INTERNET FILES\OLK1D\0019REPORT-FINAL ISSUE.DOC REP/FI
Page G7 Ove Arup & Partners International LtdFinal Issue 16 January 2003
WEST EDINBURGH LINE
Environmental Constraints and Opportunities
Ecology and Landscape Variables – Primary Constraints
Figure G5 shows the Primary Ecological Constraints for the West Edinburgh Line. The only primary ecology and landscape constraint along the route is a Historic Garden and Designated Landscape at Millburn Tower. Two of the alignment options considered pass near to the edge of this site, the preferred alignment passes to the north.
Ecology and Landscape Variables – Secondary Constraints
Figure G6 shows the Secondary Ecological Constraints for the West Edinburgh Line. The tram route runs in designated Greenbelt between the western end close to the M9 and the City of Edinburgh Bypass. Two of the alignment options transect the Area of Outstanding Landscape Value (AOLV) at Gogar Park, and clip the edge of the AOLV at Millburn Tower. Millburn Tower is also designated as an area of Long Established Woodland. These environmental considerations should be taken into account when finalising the route. The other two options, including the preferred alignment clip the edge of Gogar Park.
The Built Environment – Primary Constraints
Figure G7 illustrates the primary built environment constraints around the tramway alignment. The tram route’s eastern end runs through Conservation Areas and the World Heritage Site at Corstorphine. There are several Listed Buildings is this area also. However, there are no further examples of these constraints along the rest of the route. The West Edinburgh Line crosses five rights of way along the route.
The Hermiston Gait Park and Ride branch crosses the Union Canal, which is a Scheduled Ancient Monument and right of way. The alignment options that cross the A8 to the west of Gogar roundabout also clip the edge of a Scheduled Ancient Monument at Gogar. The remaining options run adjacent to this feature.
The Built Environment – Secondary Constraints
Figure G8 shows the distribution of secondary built environment constraints in the vicinity of the tramway. The proposed tram route crosses seven cycle routes, and cycle routes run alongside the proposed tram route at two locations. The tram route crosses the Water of Leith Walkway at Murrayfield. The easternmost alignments through Gogar link in to a further cycle route at South Gyle.

The City of Edinburgh Council Edinburgh LRT Masterplan Feasibility StudyFinal Report
C:\DOCUMENTS AND SETTINGS\CHRIS BAKER\LOCAL SETTINGS\TEMPORARY INTERNET FILES\OLK1D\0019REPORT-FINAL ISSUE.DOC REP/FI
Page G8 Ove Arup & Partners International LtdFinal Issue 16 January 2003
Figure G5 Primary Ecological and Landscape Constraints of the West Edinburgh Line.

The City of Edinburgh Council Edinburgh LRT Masterplan Feasibility StudyFinal Report
C:\DOCUMENTS AND SETTINGS\CHRIS BAKER\LOCAL SETTINGS\TEMPORARY INTERNET FILES\OLK1D\0019REPORT-FINAL ISSUE.DOC REP/FI
Page G9 Ove Arup & Partners International LtdFinal Issue 16 January 2003
Figure G6 Secondary Ecological and Landscape Constraints of the West Edinburgh Line.

The City of Edinburgh Council Edinburgh LRT Masterplan Feasibility StudyFinal Report
C:\DOCUMENTS AND SETTINGS\CHRIS BAKER\LOCAL SETTINGS\TEMPORARY INTERNET FILES\OLK1D\0019REPORT-FINAL ISSUE.DOC REP/FI
Page G10 Ove Arup & Partners International LtdFinal Issue 16 January 2003
Figure G7 Primary Built Environment Constraints of the West Edinburgh Line.

The City of Edinburgh Council Edinburgh LRT Masterplan Feasibility StudyFinal Report
C:\DOCUMENTS AND SETTINGS\CHRIS BAKER\LOCAL SETTINGS\TEMPORARY INTERNET FILES\OLK1D\0019REPORT-FINAL ISSUE.DOC REP/FI
Page G11 Ove Arup & Partners International LtdFinal Issue 16 January 2003
Figure G8 Secondary Built Environment Constraints of the West Edinburgh Line.

The City of Edinburgh Council Edinburgh LRT Masterplan Feasibility StudyFinal Report
C:\DOCUMENTS AND SETTINGS\CHRIS BAKER\LOCAL SETTINGS\TEMPORARY INTERNET FILES\OLK1D\0019REPORT-FINAL ISSUE.DOC REP/FI
Page G12 Ove Arup & Partners International LtdFinal Issue 16 January 2003
SOUTH EAST EDINBURGH LINE
Environmental Constraints and Opportunities
Ecology and Landscape Variables – Primary Constraints
Figure G9 illustrates the distribution of primary ecological and landscape constraints in the vicinity of the South East Edinburgh tramway. The tram alignment runs on-street for most of the route, and does not impact on any designated sites. There are four Tree Preservation Orders adjacent to the indicated alignment but these should not be affected. The route is also adjacent to the Historic Garden and Designed Landscape at Drum. At its northern end it lies close to Holyrood Park, which is a Designed Landscape and SSSI. The on-street alignment is not expected to significantly affect these important sites and no mitigating measures are anticipated being necessary.
Ecology and Landscape Variables – Secondary Constraints
Figure G10 shows the secondary ecological and landscape constraints near to the tramway. The route lies alongside Greenbelt from Cameron Toll to its southern terminus but stays on or adjacent to the existing highway for the majority of this section. Four Long-Established Woodlands also border the route.
The Built Environment – Primary Constraints
Figure G11 illustrates the primary built environment constraints around the tramway alignment. The Edinburgh World Heritage Site is located at the north-west section of the route and covers the whole of the Old Town and Canongate areas. The route is also bordered by Conservation Areas from the City Centre to Cameron Toll. Listed Buildings are more common on this section of the route and careful planning of the tramway infrastructure will be necessary to avoid or minimise any impact. There is a Scheduled Ancient Monument designated at Craigmillar Castle, which lies to the east of the route, but this is not close enough to the alignment to be affected.
The Built Environment – Secondary Constraints
Figure G12 shows the distribution of secondary built environment constraints in the vicinity of the tramway. The indicated location of tram stops tie into cycle routes at Holyrood Park and at Cameron Toll. There is a further cycle route that terminates at Little France, which is not a constraint on either the on-street alignment or if the route was diverted to serve the New Royal Infirmary directly.

The City of Edinburgh Council Edinburgh LRT Masterplan Feasibility StudyFinal Report
C:\DOCUMENTS AND SETTINGS\CHRIS BAKER\LOCAL SETTINGS\TEMPORARY INTERNET FILES\OLK1D\0019REPORT-FINAL ISSUE.DOC REP/FI
Page G13 Ove Arup & Partners International LtdFinal Issue 16 January 2003
Figure G9 Primary Ecological and Landscape Constraints of the South East Edinburgh Line.

The City of Edinburgh Council Edinburgh LRT Masterplan Feasibility StudyFinal Report
C:\DOCUMENTS AND SETTINGS\CHRIS BAKER\LOCAL SETTINGS\TEMPORARY INTERNET FILES\OLK1D\0019REPORT-FINAL ISSUE.DOC REP/FI
Page G14 Ove Arup & Partners International LtdFinal Issue 16 January 2003
Figure G10 Secondary Ecological and Landscape Constraints of the South East Edinburgh Line.

The City of Edinburgh Council Edinburgh LRT Masterplan Feasibility StudyFinal Report
C:\DOCUMENTS AND SETTINGS\CHRIS BAKER\LOCAL SETTINGS\TEMPORARY INTERNET FILES\OLK1D\0019REPORT-FINAL ISSUE.DOC REP/FI
Page G15 Ove Arup & Partners International LtdFinal Issue 16 January 2003
Figure G11 Primary Built Environment Constraints of the South East Edinburgh Line.

The City of Edinburgh Council Edinburgh LRT Masterplan Feasibility StudyFinal Report
C:\DOCUMENTS AND SETTINGS\CHRIS BAKER\LOCAL SETTINGS\TEMPORARY INTERNET FILES\OLK1D\0019REPORT-FINAL ISSUE.DOC REP/FI
Page G16 Ove Arup & Partners International LtdFinal Issue 16 January 2003
Figure G12 Secondary Built Environment Constraints of the South East Edinburgh Line.