edexcel gce geography - physics & maths...
TRANSCRIPT

Turn over
Paper Reference
GeographyAdvanced SubsidiaryUnit 1: Global ChallengesRESOURCE BOOKLETTuesday 17 May 2011 – Afternoon
6GE01/01Do not return the Resource Booklet with the question paper.
P38854A©2011 Edexcel Limited.
1/1/1!"#$$%&'!
Edexcel GCE
PMT
2P38854A
SECTION A
The following resources relate to Questions 1–6.
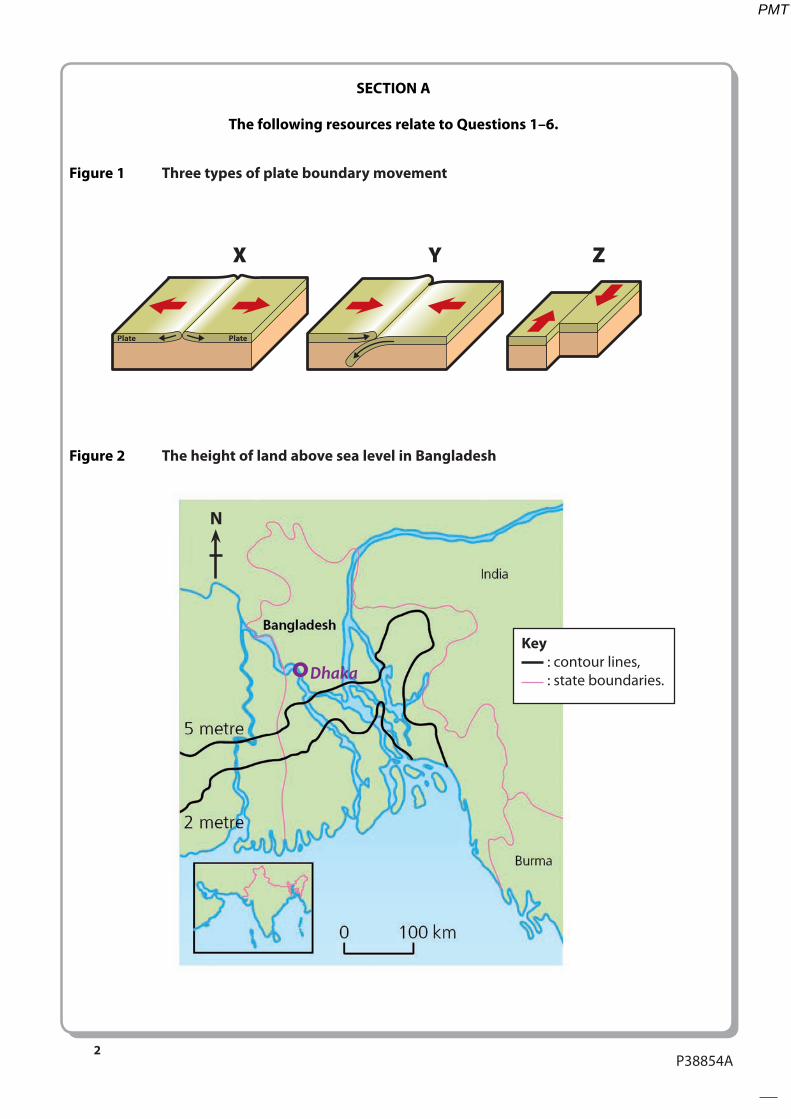
Figure 1 Three types of plate boundary movement
Figure 2 The height of land above sea level in Bangladesh
X Y Z
°!"#$#
N
Key : contour lines, : state boundaries.
PMT
3
Turn overP38854A
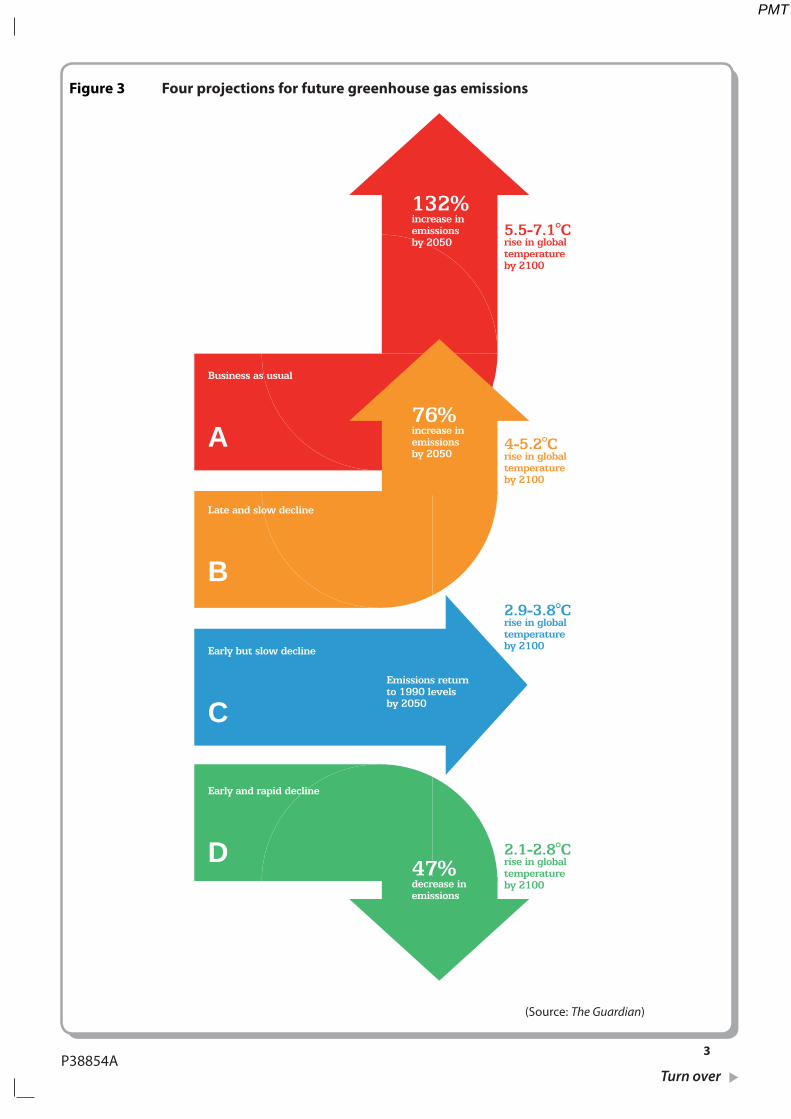
Figure 3 Four projections for future greenhouse gas emissions
(Source: The Guardian)
5.5-7.1°Crise in globaltemperatureby 2100
132%increase inemissionsby 2050
76%increase inemissionsby 2050
47%decrease inemissions
Emissions returnto 1990 levelsby 2050
Early and rapid decline
D
Early but slow decline
C
Late and slow decline
B
Business as usual
A 4-5.2°Crise in globaltemperatureby 2100
2.9-3.8°Crise in globaltemperatureby 2100
2.1-2.8°Crise in globaltemperatureby 2100
PMT
4P38854A
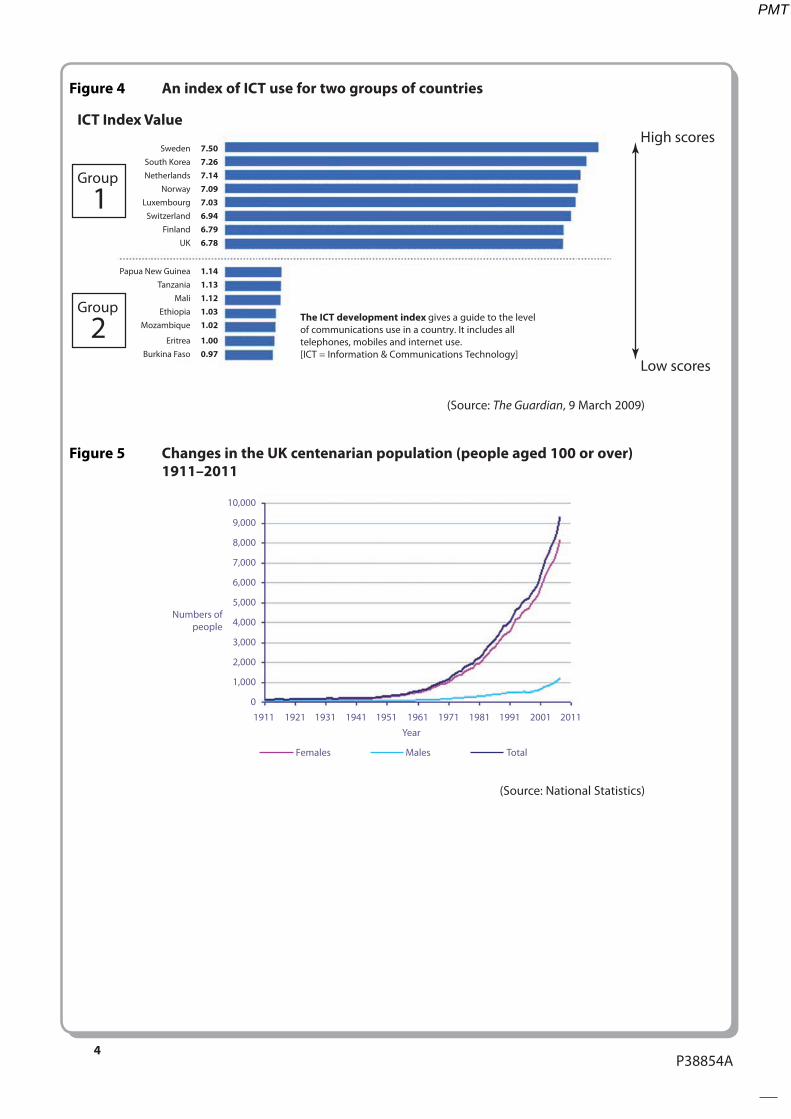
Figure 4 An index of ICT use for two groups of countries
The ICT development index gives a guide to the level of communications use in a country. It includes all telephones, mobiles and internet use.[ICT = Information & Communications Technology]
Group
2
Group
1
ICT Index ValueHigh scores
Low scores
Sweden 7.50 South Korea 7.26 Netherlands 7.14 Norway 7.09 Luxembourg 7.03 Switzerland 6.94 Finland 6.79 UK 6.78
Papua New Guinea 1.14 Tanzania 1.13 Mali 1.12 Ethiopia 1.03 Mozambique 1.02
Eritrea 1.00 Burkina Faso 0.97
(Source: The Guardian, 9 March 2009)
Figure 5 Changes in the UK centenarian population (people aged 100 or over) 1911–2011
10,000
9,000
8,000
7,000
6,000
5,000
4,000
3,000
2,000
1,000
01911 1921 1931 1941 1951 1961 1971 1981 1991 2001 2011
Females Males Total
Numbers ofpeople
Year
(Source: National Statistics)
PMT
5
Turn overP38854A
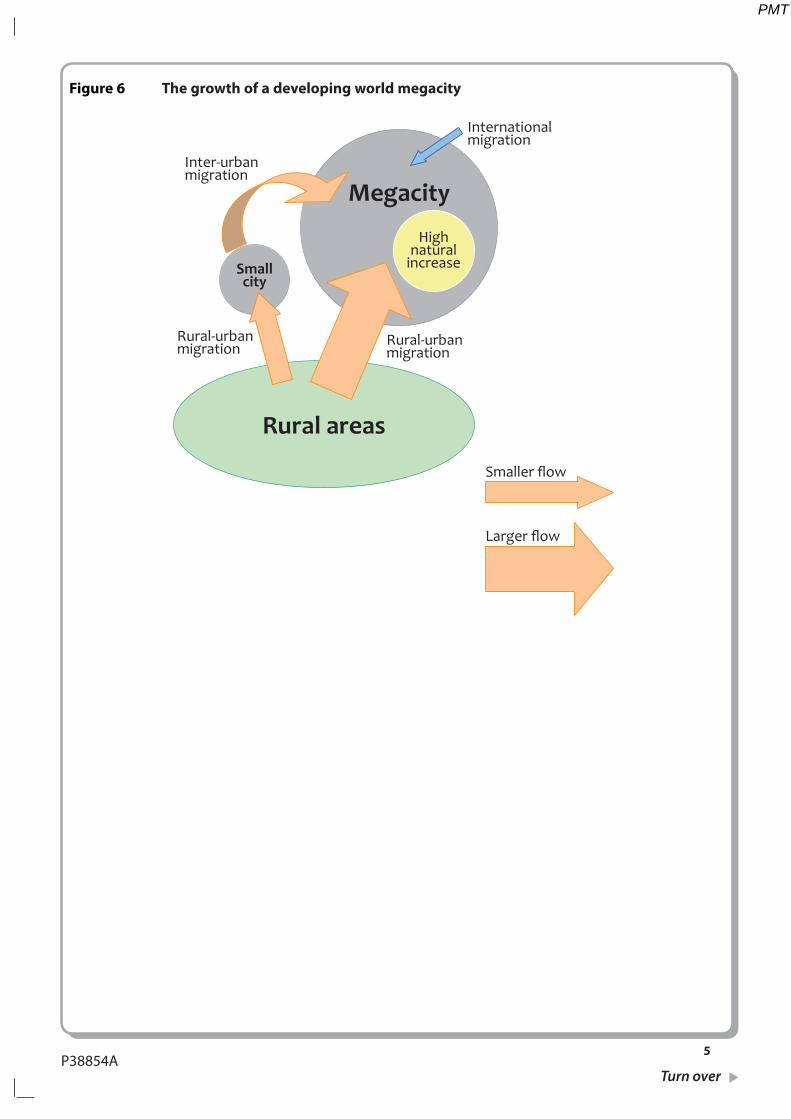
Figure 6 The growth of a developing world megacity
Rural areas
Megacity
Inter-urbanmigration
Internationalmigration
Rural-urbanmigration
Smaller flow
Larger flow
Highnatural
increaseSmallcity
Rural-urbanmigration
PMT
6P38854A
SECTION B
The following resources relate to Questions 7–10.
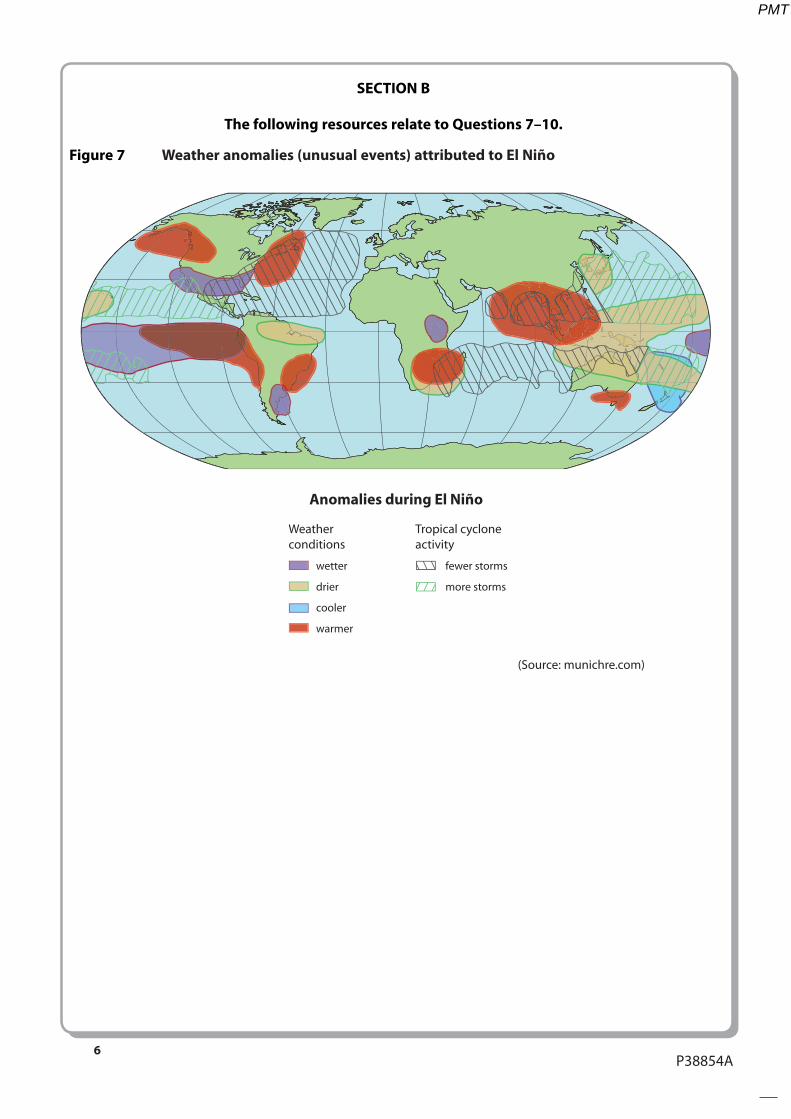
Figure 7 Weather anomalies (unusual events) attributed to El Niño
(Source: munichre.com)
Anomalies during El Niño
Weather conditions
wetter
drier
fewer storms
more storms
cooler
warmer
Tropical cycloneactivity
PMT
7
Turn overP38854A
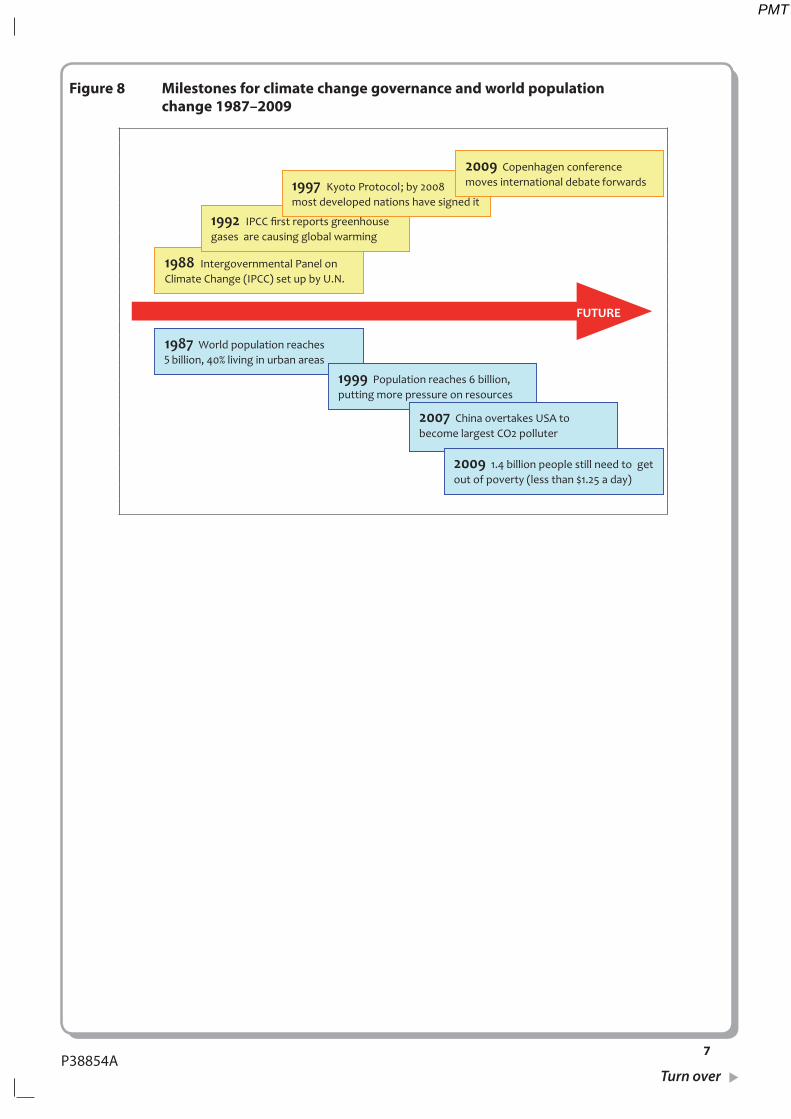
Figure 8 Milestones for climate change governance and world population change 1987–2009
1987 World population reaches 5
billion, 40% living in urban areas
1999 Population reaches 6 billion, putting more pressure on resources
2009 1.4 billion people still need to get out of poverty (less than $1.25 a day)
2007 China overtakes USA to become largest CO2 polluter
1988 Intergovernmental Panel on Climate Change (IPCC) set up by U.N.
1992 IPCC first reports greenhouse gases are causing global warming
1997 Kyoto Protocol ; by 20most developed nations have signed it
08
2009 Copenhagen conference moves international debate forwards
FUTURE
PMT
8P38854A
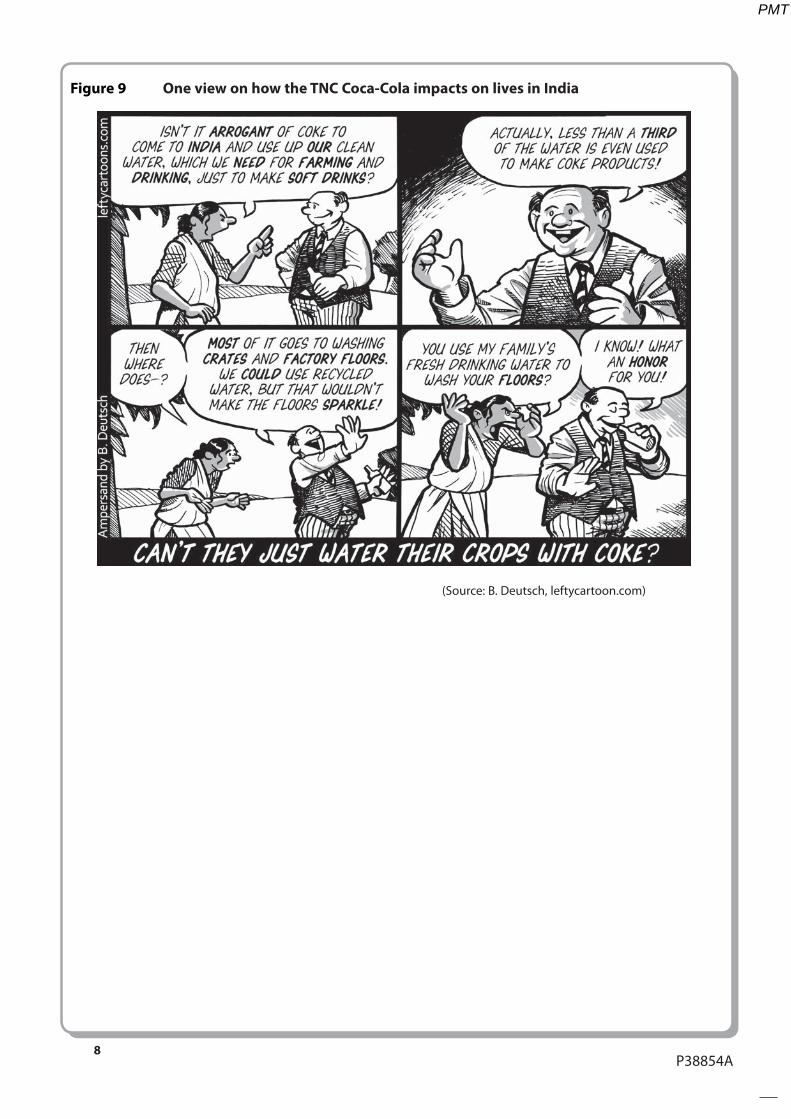
Figure 9 One view on how the TNC Coca-Cola impacts on lives in India
(Source: B. Deutsch, leftycartoon.com)
PMT
9P38854A
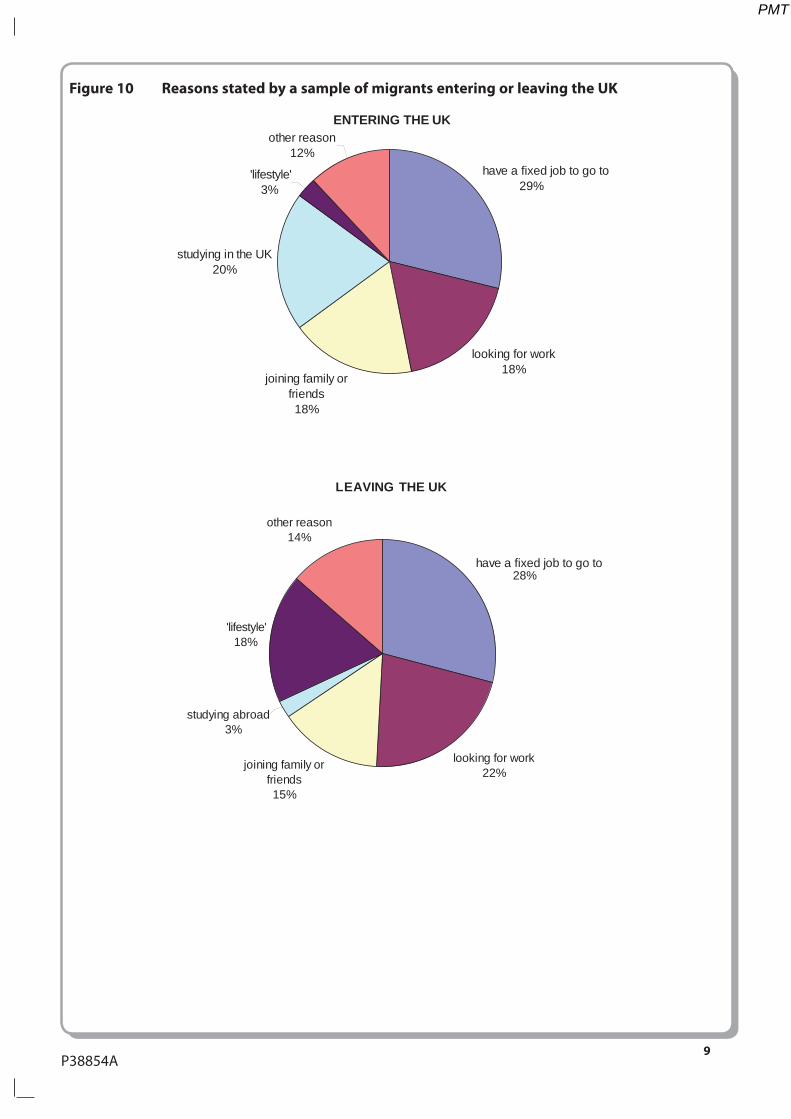
Figure 10 Reasons stated by a sample of migrants entering or leaving the UK
ENTERING THE UK
have a fixed job to go to
have a fixed job to go to
29%
looking for work18%
joining family orfriends18%
studying in the UK20%
'lifestyle'3%
other reason12%
LEAVING THE UK
28%
looking for work22%joining family or
friends15%
studying abroad3%
'lifestyle'18%
other reason14%
PMT