ecosystem functions and densities of contributing functional groups respond in a different way to...
TRANSCRIPT
ECOSYSTEM FUNCTIONS AND DENSITIES OF CONTRIBUTING FUNCTIONAL GROUPSRESPOND IN A DIFFERENT WAY TO CHEMICAL STRESS
FREDERIK DE LAENDER,*y FRIEDA B. TAUB,z and COLIN R. JANSSENyyLaboratory of Environmental Toxicology and Aquatic Ecology, Ghent University, Ghent, Belgium
zSchool of Aquatic and Fishery Sciences, University of Washington, Seattle, Washington, USA
(Submitted 5 May 2011; Returned for Revision 22 July 2011; Accepted 15 September 2011)
Abstract—Understanding whether and to what extent ecosystem functions respond to chemicals is a major challenge in environmentaltoxicology. The available data gathered by ecosystem-level experiments (micro- and mesocosms) often describe the responses of taxadensities to stress. However, whether these responses are proportional to the responses of associated ecosystem functions to stress isunclear. By combining a carbon budget modeling technique with data from a standardized microcosm experiment with a knowncommunity composition, we quantified three ecosystem functions (net primary production [NPP], net mesozooplankton production[NZP], and net bacterial production [NBP]) at three Cu concentrations, with a control. Changes of these ecosystem functions withincreasing chemical concentrations were not always proportional to the Cu effects on the densities of the contributing functional groups.For example, Cu treatments decreased mesozooplankton density by 100-fold and increased phytoplankton density 10- to 100-fold whileincreasing NZP and leaving NPP unaltered. However, in contrast, Cu affected microzooplankton and the associated function (NBP) in acomparable way. We illustrate that differences in the response of phytoplankton/mesozooplankton densities and the associatedecosystem functions to stress occur because functional rates (e.g., photosynthesis rates/ingestion rates) vary among Cu treatments and intime. These variations could be explained by food web ecology but not by direct Cu effects, indicating that ecology may be a useful basisfor understanding environmental effects of stressors. Environ. Toxicol. Chem. 2011;30:2892–2898. # 2011 SETAC
Keywords—Ecosystem functioning Functional rates Microcosms Risk assessment Inverse modeling
INTRODUCTION
Assessing the effects of chemicals on the structure andfunction of aquatic ecosystems is a major challenge in con-temporary environmental sciences [1]. Micro- and mesocosmsare generally considered a realistic approach to observe effectsof chemicals on species assemblages [2]. The ability to studyfood-web-mediated indirect effects of chemicals [3] and toevaluate population and ecosystem recovery [4] are two advan-tages that multispecies approaches have over more straightfor-ward techniques based on toxicity tests with single species [5].
The majority (88%) of the multispecies experimentsreported in the literature that have examined the effects ofchemicals in micro- or mesocosms report how populationdensities of species change with increasing chemical concen-trations [6]. However, whether the responses of ecosystemfunctions to chemical stress are directly proportional to densitychanges of the populations within the contributing functionalgroups is unclear [7]. Indeed, it has been hypothesized thatfunctional rates of species, and thus their contribution to a givenecosystem function, are not fixed attributes but instead aredetermined by the presence and functional rates of their pred-ators and prey and by environmental forcing [8]. Chemicalshave been shown to remove individuals from among popula-tions selectively in a way comparable to that of predators [9] andmay therefore alter patterns of predation, competition, and foodavailability. The restructuring of an ecosystem through theselective removal of sensitive taxa by a chemical can thus be
hypothesized to alter functional rates of taxa such as ingestionand growth rates. If this hypothesis is valid, effects on ecosys-tem functions will be different from effects on densities of thecontributing functional groups. Unfortunately, little informa-tion is available from which to support or reject this hypothesis.One reason for this data scarcity is the difficulty of functionalrate quantification of species in an ecosystem. This is especiallythe case for plankton, because obtaining direct quantitativeinformation on resource use and allocation of planktonic spe-cies is not straightforward. Although such rates can be directlyobserved for larger species, for example, through gut contentanalysis, time-consuming analyses are required to obtain indi-rect information on the resource use of planktonic species [10].Nevertheless, information on functional rates of planktonicspecies and whether they change following chemical exposureis essential, because plankton assist in vital ecosystem functionsin virtually all aquatic ecosystems. Autotrophic phytoplanktonare responsible for more than 50% of the global primaryproduction [11], and microzooplankton such as protozoa androtifers are key to bacterivory, detritus decomposition, andbacterial production fuelling through the microbial loop [12–14]. Mesozooplankton form an essential link between themicrobial community and the higher trophic levels that provideecosystem services to man, such as fish production [15].
In the present study, we compare effects of copper on thedensities of functional groups with the effects on associatedecosystem functions. To this end, we combine data from astandardized aquatic microcosm experiment [16] with arecently proposed food-web-modeling approach that wasspecifically developed to estimate ecosystem functions fromchemical-induced changes in plankton taxa densities [17,18].The use of a standardized microcosm data set guarantees aperfectly known taxonomic composition, thereby ruling out the
Environmental Toxicology and Chemistry, Vol. 30, No. 12, pp. 2892–2898, 2011# 2011 SETAC
Printed in the USADOI: 10.1002/etc.698
All Supplemental Data may be found in the online version of this article.* To whom correspondence may be addressed
([email protected]).Published online 27 September 2011 in Wiley Online Library
(wileyonlinelibrary.com).
2892
possibility that any essential food web compartment would beneglected in the modeling. Also, the well-known dimensionsand taxonomy of the included species ensure a minimal uncer-tainty when converting abundance to units of carbon needed forfood web modeling. From among the available standardizedaquatic microcosm data sets, we selected the one using Cu as amodel substance because the administered Cu concentrationswere high enough to ensure clear chemical effects on taxadensities. The ecosystem functions that we consider are netprimary production (NPP), net bacterial production (NBP), andnet mesozooplankton production (NZP). The responses of thesethree functions to Cu are compared with the response of thedensities of the functional groups that contribute to thesefunctions: phytoplankton (contribute to NPP), microzooplank-ton (contribute to NBP), and mesozooplankton (contribute toNZP). In addition, the estimated carbon budgets are used tocalculate functional rates (density-specific rates of carbonuptake and loss) of the three functional groups in the 24microcosms.
MATERIALS AND METHODS
Microcosm experiment
The effects of three Cu treatments (low, medium, and high:63-d time-weighted averages of 131, 236, and 321 mg dissolvedCu/L) on the densities of 17 taxa were examined in 3-Lstandardized aquatic microcosms. Supplemental Data, FigureS1, shows the measured dissolved concentrations. Per treat-ment, six microcosms were used, and six additional microcosmsserved as a control, resulting in 24 microcosms in total. In thetreated enclosures, Cu sulfate was added after 7 d, and the den-sities of the 17 taxa were monitored on 18 sampling occasions(days 4, 7, 11, 14, 18, 21, 25, 28, 32, 35, 39, 42, 46, 49, 53, 56,60, and 63). Abundances were converted to carbon (mgC L�1)for subsequent carbon budget calculation (see below underCarbon budget calculation) using organism dimensions thatwere measured during the microcosm experiment and volumeto carbon ratios (Supplemental Data, Tables S1 and S2). Alldetails of the microcosm experiment can be found in otherpublications [16,19,20], and here we give only a brief descrip-tion of the experiment, which was one of seven used forinterlaboratory testing of the American Society for Testingand Materials (ASTM) protocol [19]. In the controls, a phyto-plankton bloom developed between day 0 and day 20 that wasfollowed by an increase in the mesozooplankton, most notablyDaphnia sp., density between days 10 and 30. The low treat-ment delayed the phytoplankton bloom by 10 d and eliminatedmesozooplankton during the first 20 d. The phytoplanktonbloom in the low treatment was higher than that of the control,fuelling the mesozooplankton bloom that appeared on day 30. Inthe medium Cu treatment, the phytoplankton bloom wasdelayed until day 35, when it reached greater densities thanin controls or lower treatments because of mesozooplanktondensities that were approximately 1,000 times smaller than inthe controls or lower treatments. At the high Cu treatments,phytoplankton were almost entirely inhibited, and mesozoo-plankton did not occur after day 7.
Carbon budget calculation
Carbon budgets were initially calculated for all 24 micro-cosms at 15 different points in time (days 11, 14, 18, 21, 25, 28,32, 35, 39, 42, 46, 49, 53, 56, 60), following an earlier method-ology [17] by constructing 360 (24� 15) linear inverse models(LIMs). Linear inverse modeling allows one mathematically to
combine prior knowledge on a set of physiological constraintswith site-specific food web topology, taxa densities, and rates ofchange of these densities to estimate carbon flows betweenecosystem components [21,22]. Recent advances in LIM sol-ution allow accounting for the complete distribution of thephysiological constraints. Hence, every carbon flow is esti-mated as a distribution reflecting uncertain physiology, inter-and intraspecies variability, and measurement error [23]. Notethat the LIM framework is not a predictive one but ratherunravels elemental budgets. Whereas more conventional mod-eling approaches presume rates of carbon uptake and loss topredict changes in species densities [24], inverse modelinginfers such properties from observed changes in densities.Technical details on linear inverse modeling are explained inSupplemental Data, Section S1.
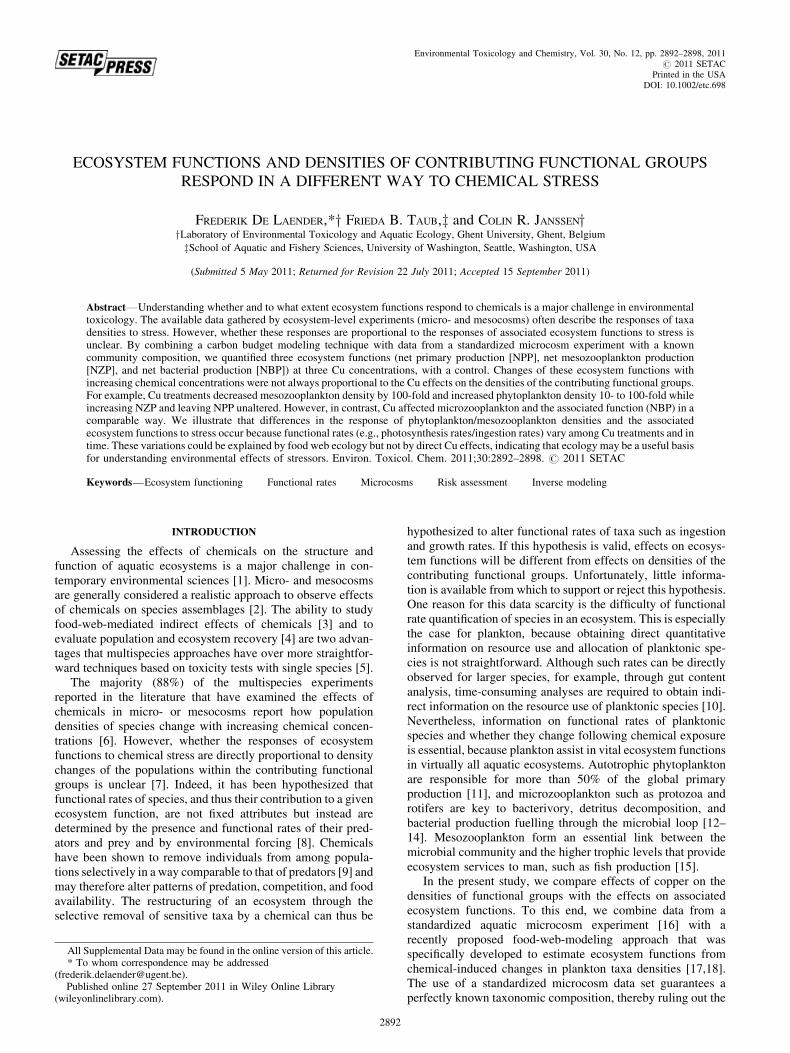
The conceptual food web on which all 360 LIMs were based(Fig. 1) groups the taxa for which the abundance was measuredin the microcosms into functional groups and adds dissolvedorganic carbon, bacteria, detritus, and dead mesozooplankton asadditional ecosystem components. Taxa were divided intofunctional groups based on their carbon and energy acquisi-tion mode [25] and suspected dietary preferences and bodysize. Two microzooplankton groups were present: the rotiferPhilodina sp. and protozoa.Daphnia magna and ostracods werethe only two mesozooplankton groups. Feeding relationshipsare justified in detail in Supplemental Data, Section S2.
It is important to note that defining a feeding relationship hasno implications for its quantitative importance, because itsvalue will result from LIM solution and thus from the includeddata and constraints (see below). Phytoplankton species weregrouped based on their presumed carbon source and theirnutritional value for grazers [26]: strict autotrophs, possiblemixotrophs, and cyanophytes. Members of all functional groupsare listed in Supplemental Data, Tables S1 and S2. Food web
MORT
DET
DOC
BAC
AUT
MIXCYA
DAP
OSTR
PHIL
PRO
DICACC
Fig. 1. Food web topology in the microcosms. Abbreviations ofcompartments are strict autotrophs (AUT), possible mixotrophs (MIX),cyanophytes (CYA), dissolved organic carbon (DOC), bacteria (BAC),detritus (DET), dead (micro- andmeso-) zooplankton (MORT),Philodina sp.(PHIL) and protozoa (PRO),Daphniamagna (DAP), and ostracods (OSTR).Food web input and output were dissolved inorganic carbon (DIC) andaccumulation of detritus and dead zooplankton (ACC). Arrows betweencompartments¼ carbon flows and are elaborated in Supplemental Data,Table S4.
Food web ecology explains effects in contaminated microcosms Environ. Toxicol. Chem. 30, 2011 2893

input and output to dissolved inorganic carbon (DIC) repre-sented primary production and respiration, respectively. Toallow accumulation of detritus and dead mesozooplanktonduring the experiment, an additional output termed ACC wasforeseen. Mortality induced by Cu was accounted for by a flowfrom all heterotrophs to the dead mesozooplankton compart-ment, the latter being treated essentially as detritus.
To calculate the 360 carbon budgets, densities and rates ofchange of all heterotrophs and autotrophs measured in themicrocosms were combined with physiological constraints ofrespiration, ingestion, and production rates; excretion proc-esses; and assimilation or production efficiencies reported inthe literature (Supplemental Data, Table S3). Rates of changeon a given day were calculated by comparing the density on thisday with the density on the following sampling day and bydividing the difference between densities by the number of daysbetween both sampling occasions. For that reason, LIMs couldnot be solved for the last sampling day (day 63), because norates of change could be calculated. In addition, sampling daysbefore Cu addition (day 7) were excluded from our carbonbudget analysis. Flows to dead mesozooplankton were con-strained using literature data from single-species toxicity testswith mortality as an endpoint [27,28] and a log-logistic con-centration response curve as discussed in depth in SupplementalData, Section S3.
As is typically the case, the LIMs had fewer equations thanthe number of unknown flows [29] and were therefore math-ematically underdetermined. Also, the physiological constraintsused are variable and uncertain, reflecting inter- and intra-species variability and measurement error. To account for thesesources of variability, we applied linear programming using theR function xranges [30]. Consequently, the uncertainty rangesassociated with the n estimated carbon flows could be quanti-fied. Among the 360 LIMs, we were able to obtain suchuncertainty ranges for 312 LIMs; thus, the model was able todescribe the ecological processes in the microcosms success-fully in 87% of the cases. The day and treatment combinationsfor which the LIM could not be solved are plotted as Supple-mental Data, Figure S2.
For a selection of sampling days, a Markov chain MonteCarlo technique was used to obtain probability density functionsfor the estimated carbon flows based on the uncertainty rangesfor these flows [23]. This selection was made to keep calculationtime within limits (40 h on a 4-GB RAM 2.53-GHz personalcomputer). Days 11, 18, 25, 32, and 46 were selected becausethis period included the onset, bloom, and decline of theincluded functional groups and thus presented an overviewof the whole experiment. In addition, at least three LIMs couldbe solved per treatment level on these dates (Suppl. Data, Fig.S2). In essence, the Markov chain Monte Carlo techniqueconstructs a probability density function for every carbon flow,by sampling the uncertainty ranges of the carbon flows. Sam-pling was performed using the R function xsample [23] andoccurred randomly with 10,000 iterations, yet respecting massbalances within the food web. In this way, 10,000 possiblevalues are obtained per estimated carbon flow.
Ecosystem functions and rates per functional group
The calculated carbon budgets for the different samplingdays and Cu treatments were used to estimate NPP and NBP.Net mesozooplankton production could be obtained directlyfrom the microcosm data, without the use of the inverse models,as the measured rates of change of D. magna and ostracods. Netprimary production was calculated as total gross primary pro-
duction, minus phytoplankton respiration. Net bacterial pro-duction was calculated as DOC uptake by bacteria minusbacterial respiration and losses from lysis. Note that, because10,000 values were obtained per carbon flow estimated for aparticular treatment and day combination, also 10,000 valueswere obtained per NPP and NBP estimation. As for the carbonflows, the 10,000 NPP and NBP values reflect the uncertaintyassociated with the uncertainties surrounding the physiologicalprocesses listed in Supplemental Data, Table S3. The modeledNPP was compared with NPP estimates that were based onindependent measurements of daytime oxygen gain, a measurefor carbon uptake minus daytime carbon loss through respira-tion (see Supplemental Data, Section S4).
We used the carbon flows estimated by the inverse models tocalculate three functional rates per functional group (d�1):carbon uptake (ingestion for heterotrophs, gross primary pro-duction for autotrophs), respiration, and excretion. Weexpressed functional rates as specific rates (rate divided bydensity) to disentangle true changes in functional rates fromchanges in density. For the selection of sampling days, theprobability density functions of the carbon flows (days 11, 18,25, 32, and 46; see previous section) were used to infer theprobability of increase or decrease of an ecosystem function orfunctional rate, as explained in Supplemental Data, Section S5.
RESULTS
Ecosystem functions and density of functional groups
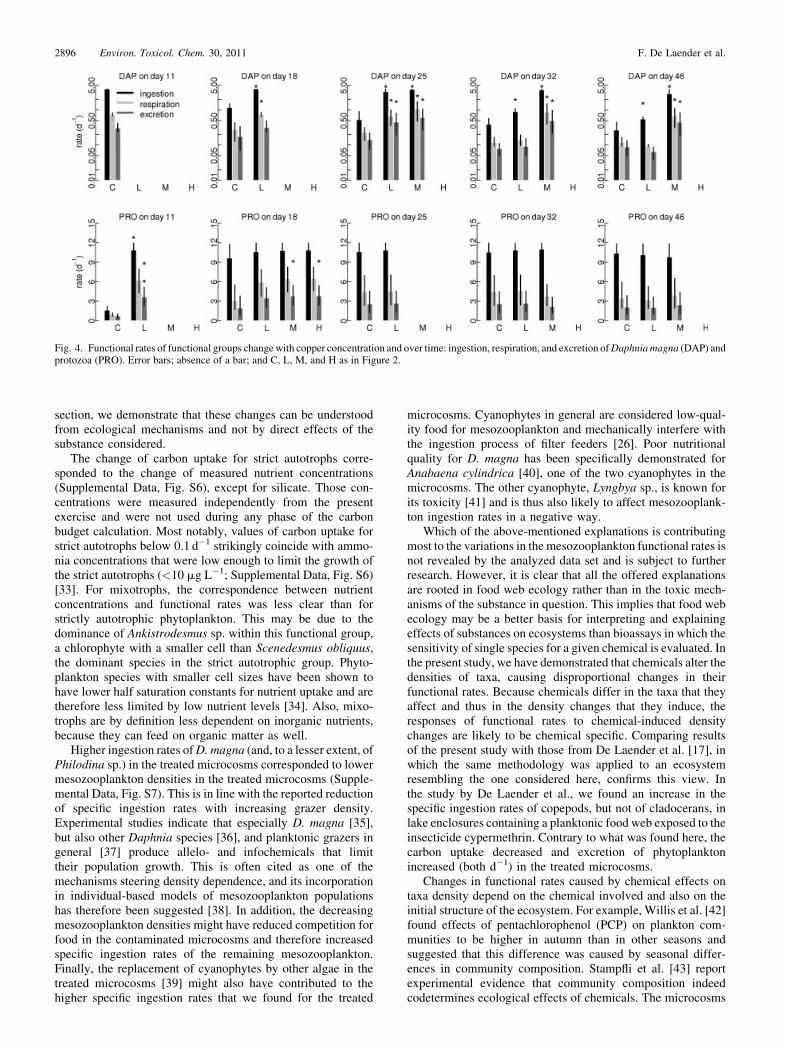
During the first 25 d of the experiment, NPP remained atcontrol levels in the low- and medium-Cu treatments, althoughthe same treatments caused a 10- to 100-fold increase inphytoplankton density (Fig. 2). On days 32 and 46, themedium-Cu treatment caused a small (1.5–2-fold) increase inNPP but large (100-fold) increases in phytoplankton, the asso-ciated functional group. The highest Cu treatment affected NPPand phytoplankton density in a similar fashion, except on day46, when effects on NPP were much more pronounced thaneffects on phytoplankton density. Modeled effects of Cu onNPP corresponded well to effects on NPP, inferred from oxygenmeasurements during the microcosm experiments (Suppl. Data,Fig. S3).
Net mesozooplankton production and mesozooplanktondensity responded similarly to all Cu treatments during the first18 d. On day 25, a small (10%) but significant increase in NZPwas observed in the low treatment, and the same treatmentreduced mesozooplankton density tenfold. Higher Cu concen-trations decimated both NZP and mesozooplankton density onday 25. The same was observed on day 32: effects of the low Cutreatment on NZP were different from effects on mesozoo-plankton density. Toward the end of the experiment, mesozoo-plankton density and NZP responded in a similar way to the Custress.
The responses of NBP and microzooplankton density to allCu treatments and on all days were comparable, with threefoldreductions in the low and medium treatments and zero densitiesand ecosystem function rates in the high Cu treatments. Ingeneral, the response of two of the three studied ecosystemfunctions (NPP, NZP) to the Cu treatments was not alwayscomparable to that of the contributing functional group’sdensities, neither in size nor in sign. Following, we show thatthe functional rates of all functional groups, essentially theircontribution to the ecosystem functions, therefore changed intime and among chemical treatments. As functional rates,density-specific rates of carbon uptake and loss are considered.
2894 Environ. Toxicol. Chem. 30, 2011 F. De Laender et al.

Functional rates of functional groups
Among all phytoplankton groups, only cyanophytes haddensity-specific carbon uptake (d�1), respiration (d�1) andexcretion rates (d�1) that were independent of the Cu treatmentand sampling day (Fig. 3). However, this was not the case forthe other two phytoplankton groups, strict autotrophs (Fig. 3)and mixotrophs (Supplemental Data, Fig. S4). On day 18, low-Cu treatments decreased the functional rates, whereas two- tofivefold increases were observed at medium and high concen-trations. On days 25 and 32, rates of strict autotrophs were 10times lower with the low and medium treatments than in thecontrol, whereas the highest treatment increased these rates.
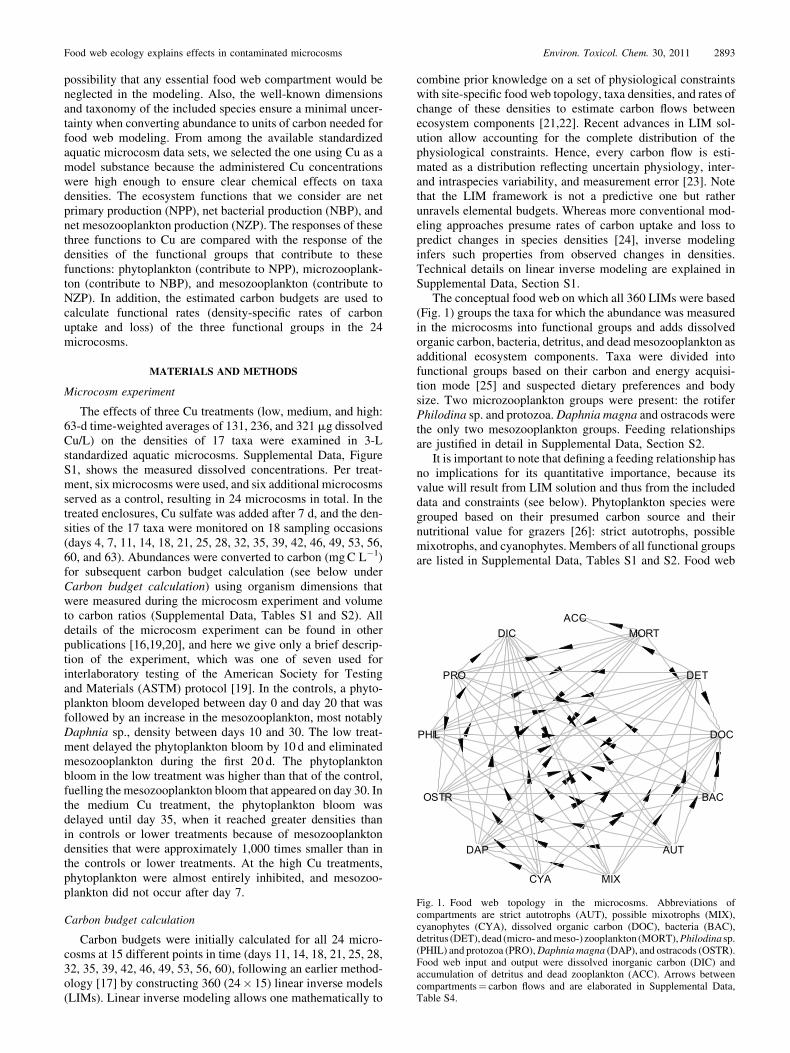
Functional rates of mesozooplankton did also not remainconstant with varying treatments. Throughout the experiment,all treatments drastically (two- to tenfold) increased specificrates (d�1) of D. magna compared with the control (Fig. 4).Carbon uptake and loss of ostracods did not change withincreasing Cu concentrations (Suppl. Data, Fig. S5). For micro-
zooplankton, changes of functional rates with varying Cu treat-ment or time were less pronounced than for mesozooplankton(protozoa in Fig. 4 and the rotifer Philodina sp. in SupplementalData, Fig. S5).
DISCUSSION
Why are functional rates not constant?
Some of the functional rates considered in the present studyhave been shown to be sensitive to Cu, the selected modelsubstance. For example, feeding rates of mesozooplankton [31]as well as photosynthesis and respiration rates of phytoplankton[32] have been shown to be reduced by Cu. However, a cleardose-dependent relationship of these functional rates was notfound here (Figs. 3 and 4 and Supplemental Data, Figs. S4 andS5), indicating that direct effects alone are insufficient toexplain the observed differences in functional rates betweenthe control and the contaminated microcosms. In the following
ecosystem functions on day 11
NPPNZPNBP
mg
C l−
1 d−1
-10
12
3
s s s
C L M H
* * *
ecosystem functions on day 18
mg
C l−
1 d−1
-10
12
3
s s s
C L M H
*
* * *
ecosystem functions on day 25
mg
C l−
1 d−1
-10
12
3
s s s
C L M H
** *
ecosystem functions on day 32
mg
C l−
1 d−1
-10
12
3
s
s s
C L M H
*
** *
ecosystem functions on day 46
mg
C l−
1 d−1
-10
12
3
s s s
C L M H
*
**
1e-4
1e-2
11e
2m
g C
l−1
densities on day 11phytoplanktonmesozooplanktonmicrozooplankton
s
C L M H
densities on day 11phytoplanktonmesozooplanktonmicrozooplankton
s s s
densities on day 11phytoplanktonmesozooplanktonmicrozooplankton
s
s s
1e-4
1e-2
11e
2m
g C
l−1
densities on day 18
ss
s
C L M H
s
s s
s s s
1e-4
1e-2
11e
2m
g C
l−1
densities on day 25
s s
s
C L M H
s
s
ss s
1e-4
1e-2
11e
2m
g C
l−1
densities on day 32
s s
C L M H
s
ss s
1e-4
1e-2
11e
2m
g C
l−1
densities on day 46
s
s
C L M H
s
s
ss
Fig. 2. Ecosystem functions (upper panels) and functional group densities (lower panels) respond differently to low (L), medium (M), and high (H) copperconcentrations on five different days. C¼ control values. Error bars¼ 5th to 95th percentiles, as calculated with the R function quantile, based on the pooledestimates of all corresponding microcosms. Functional groups have the same color as the ecosystem function to which they contribute. Asterisks (net primaryproduction [NPP], and net bacterial production [NBP]) indicatea� 95%probability for deviation from the control value (see SupplementalData for calculations).For net mesozooplankton production (NZP) and densities, S indicates a significant deviation from the control (unpaired t test,a¼ 0.05). Absence of a bar denotesabsence of species group or densities <10 mg C L�1. [Color figure can be seen in the online version of this article, available at wileyonlinelibrary.com]
0.01
0.05
0.50
5.00
AUT on day 11
rate
(d−1
)0.
010.
050.
505.
000.
010.
050.
505.
00
C L M H
0.01
0.05
0.50
5.00
CYA on day 11
sGPPrespirationexcretion
rate
(d−1
)0.
010.
050.
505.
000.
010.
050.
505.
00
C L M H
0.01
0.05
0.50
5.00
AUT on day 18
0.01
0.05
0.50
5.00
0.01
0.05
0.50
5.00
C L M H
**
**
*
*
0.01
0.05
0.50
5.00
CYA on day 18
0.01
0.05
0.50
5.00
0.01
0.05
0.50
5.00
C L M H
0.01
0.05
0.50
5.00
AUT on day 25
0.01
0.05
0.50
5.00
0.01
0.05
0.50
5.00
C L M H
*
* **
**
0.01
0.05
0.50
5.00
CYA on day 25
0.01
0.05
0.50
5.00
0.01
0.05
0.50
5.00
C L M H
0.01
0.05
0.50
5.00
AUT on day 32
0.01
0.05
0.50
5.00
0.01
0.05
0.50
5.00
C L M H
* ** ** *
0.01
0.05
0.50
5.00
CYA on day 32
0.01
0.05
0.50
5.00
0.01
0.05
0.50
5.00
C L M H
0.01
0.05
0.50
5.00
AUT on day 46
0.01
0.05
0.50
5.00
0.01
0.05
0.50
5.00
C L M H
***
0.01
0.05
0.50
5.00
CYA on day 46
0.01
0.05
0.50
5.00
0.01
0.05
0.50
5.00
C L M H
Fig. 3. Functional rates of functional groups change with copper concentration and over time: specific rates of gross primary production (sGPP), respiration andexcretion of autotrophs (AUT) and cyanophytes (CYA). Asterisks denote that a change relative to the control values was�95%probable (see Supplemental Data,Section S5, for calculations). Error bars; absence of a bar; and C, L, M, and H as in Figure 2.
Food web ecology explains effects in contaminated microcosms Environ. Toxicol. Chem. 30, 2011 2895
section, we demonstrate that these changes can be understoodfrom ecological mechanisms and not by direct effects of thesubstance considered.
The change of carbon uptake for strict autotrophs corre-sponded to the change of measured nutrient concentrations(Supplemental Data, Fig. S6), except for silicate. Those con-centrations were measured independently from the presentexercise and were not used during any phase of the carbonbudget calculation. Most notably, values of carbon uptake forstrict autotrophs below 0.1 d�1 strikingly coincide with ammo-nia concentrations that were low enough to limit the growth ofthe strict autotrophs (<10 mg L�1; Supplemental Data, Fig. S6)[33]. For mixotrophs, the correspondence between nutrientconcentrations and functional rates was less clear than forstrictly autotrophic phytoplankton. This may be due to thedominance of Ankistrodesmus sp. within this functional group,a chlorophyte with a smaller cell than Scenedesmus obliquus,the dominant species in the strict autotrophic group. Phyto-plankton species with smaller cell sizes have been shown tohave lower half saturation constants for nutrient uptake and aretherefore less limited by low nutrient levels [34]. Also, mixo-trophs are by definition less dependent on inorganic nutrients,because they can feed on organic matter as well.
Higher ingestion rates ofD. magna (and, to a lesser extent, ofPhilodina sp.) in the treated microcosms corresponded to lowermesozooplankton densities in the treated microcosms (Supple-mental Data, Fig. S7). This is in line with the reported reductionof specific ingestion rates with increasing grazer density.Experimental studies indicate that especially D. magna [35],but also other Daphnia species [36], and planktonic grazers ingeneral [37] produce allelo- and infochemicals that limittheir population growth. This is often cited as one of themechanisms steering density dependence, and its incorporationin individual-based models of mesozooplankton populationshas therefore been suggested [38]. In addition, the decreasingmesozooplankton densities might have reduced competition forfood in the contaminated microcosms and therefore increasedspecific ingestion rates of the remaining mesozooplankton.Finally, the replacement of cyanophytes by other algae in thetreated microcosms [39] might also have contributed to thehigher specific ingestion rates that we found for the treated
microcosms. Cyanophytes in general are considered low-qual-ity food for mesozooplankton and mechanically interfere withthe ingestion process of filter feeders [26]. Poor nutritionalquality for D. magna has been specifically demonstrated forAnabaena cylindrica [40], one of the two cyanophytes in themicrocosms. The other cyanophyte, Lyngbya sp., is known forits toxicity [41] and is thus also likely to affect mesozooplank-ton ingestion rates in a negative way.
Which of the above-mentioned explanations is contributingmost to the variations in the mesozooplankton functional rates isnot revealed by the analyzed data set and is subject to furtherresearch. However, it is clear that all the offered explanationsare rooted in food web ecology rather than in the toxic mech-anisms of the substance in question. This implies that food webecology may be a better basis for interpreting and explainingeffects of substances on ecosystems than bioassays in which thesensitivity of single species for a given chemical is evaluated. Inthe present study, we have demonstrated that chemicals alter thedensities of taxa, causing disproportional changes in theirfunctional rates. Because chemicals differ in the taxa that theyaffect and thus in the density changes that they induce, theresponses of functional rates to chemical-induced densitychanges are likely to be chemical specific. Comparing resultsof the present study with those from De Laender et al. [17], inwhich the same methodology was applied to an ecosystemresembling the one considered here, confirms this view. Inthe study by De Laender et al., we found an increase in thespecific ingestion rates of copepods, but not of cladocerans, inlake enclosures containing a planktonic food web exposed to theinsecticide cypermethrin. Contrary to what was found here, thecarbon uptake decreased and excretion of phytoplanktonincreased (both d�1) in the treated microcosms.
Changes in functional rates caused by chemical effects ontaxa density depend on the chemical involved and also on theinitial structure of the ecosystem. For example, Willis et al. [42]found effects of pentachlorophenol (PCP) on plankton com-munities to be higher in autumn than in other seasons andsuggested that this difference was caused by seasonal differ-ences in community composition. Stampfli et al. [43] reportexperimental evidence that community composition indeedcodetermines ecological effects of chemicals. The microcosms
Fig. 4. Functional rates of functional groups changewith copper concentration and over time: ingestion, respiration, and excretion ofDaphniamagna (DAP) andprotozoa (PRO). Error bars; absence of a bar; and C, L, M, and H as in Figure 2.
2896 Environ. Toxicol. Chem. 30, 2011 F. De Laender et al.

that were used in the present study have a community compo-sition that is characterized by a relatively low richness, com-pared with larger mesocosms that use field communities. Thislow richness might have constrained functional redundancy inthese microcosms, so it can be suggested that the effects that wereport here are more pronounced than those observed in fieldcommunities.
The influence of chemical and initial ecosystem structure onecological effects of chemicals does not seem to encourageefforts to incorporate community ecology into risk assessment.However, we believe that the combination of quantitativetechniques with data sets from experimental ecosystems createsopportunities to understand better how stressors affect ecosys-tem functions. Data sets frommicro- andmesocosms containingtemporal changes in taxa densities at different chemical con-centrations are abundant. In the last 25 years (1985–2010), atleast 500 studies have been described in the literature thatproduced that type of data set (ISI Web Of Science with thefollowing search term, where � is a wildcard: ([mesocosm� ORmicrocosm� OR enclosure�] AND [chemical� OR toxic�]) andrefined to subject categories Toxicology and Environmentalsciences). The variety of chemicals and ecosystems includedin these data makes a uniform and quantitative analysis anonstraightforward but critical step toward a better understand-ing of chemical effects on ecosystem functions.
CONCLUSIONS
The responses of two ecosystem functions, net primaryproduction and net mesozooplankton production, to chemicalstress was not proportional to density changes of the contribu-ting functional groups. This could be explained because thecontribution of species to an associated ecosystem function isnot a fixed attribute but varies in time and with chemicalconcentration. However, chemical concentrations alone cannotexplain these variations. Instead, relationships between andwithin functional groups and between functional groups andtheir resources are necessary to understand how functional ratesof species change in contaminated ecosystems. We concludethat food web ecology, next to single-species bioassays, shouldbe included in the effect assessment of chemicals on ecosys-tems.
SUPPLEMENTAL DATA
Supplemental Data, Sections S1–S5.Tables S1–S4.Figs. S1–S7. (170KB PDF).
Acknowledgement—The data used were generated through funding bythe U.S. Food and Drug Administration (contract 223-83-7000). F. DeLaender is a postdoctoral research fellow from the Research Foundation—Flanders. Two anonymous reviewers are thanked for their constructivecomments and support.
REFERENCES
1. Sumpter JP. 2009. Protecting aquatic organisms from chemicals: Theharsh realities.Philos Trans R SocAMathPhysEng Sci 367:3877–3894.
2. Van den Brink PJ. 2006. Response to recent criticism on aquatic (semi-)field studies experiments: opportunities for new developments inecological risk assessment of pesticides. Integr Environ Assess Manag2:202–203.
3. Fleeger JW, Carman KR, Nisbet RM. 2003. Indirect effects ofcontaminants in aquatic ecosystems. Sci Total Environ 317:207–233.
4. Liess M, Schulz R. 1999. Linking insecticide contamination andpopulation response in an agricultural stream. Environ Toxicol Chem18:1948–1955.
5. Forbes VE, Calow P. 2002. Species sensitivity distributions revisited: Acritical appraisal. Hum Ecol Risk Assess 8:473–492.
6. De Laender F, De Schamphelaere KAC,VanrolleghemPA, JanssenCR.2009. Comparing ecotoxicological effect concentrations of chemicalsestablished in multi-species vs. single-species toxicity test systems.Ecotoxicol Environ Saf 72:310–315.
7. Hooper DU, Chapin FS, Ewel JJ, Hector A, Inchausti P, Lavorel S,Lawton JH, Lodge DM, Loreau M, Naeem S, Schmid B, Setala H,SymstadAJ,Vandermeer J,WardleDA. 2005. Effects of biodiversity onecosystemfunctioning:Aconsensusof current knowledge.EcolMonogr75:3–35.
8. Fox JW, Harpole WS. 2008. Revealing how species loss affectsecosystem function: The trait-based price equation partition. Ecology89:269–279.
9. Relyea R,Hoverman J. 2006.Assessing the ecology in ecotoxicology:Areview and synthesis in freshwater systems. Ecol Lett 9:1157–1171.
10. Van den Meersche K, Middelburg JJ, Soetaert K, van Rijswijk P,Boschker HTS, Heip CHR. 2004. Carbon-nitrogen coupling and algal-bacterial interactions during an experimental bloom: Modeling a C-13tracer experiment. Limnol Oceanogr 49:862–878.
11. Field CB, Behrenfeld MJ, Randerson JT, Falkowski P. 1998. Primaryproduction of the biosphere: Integrating terrestrial and oceaniccomponents. Science 281:237–240.
12. Biagini GA, Finlay BJ, Lloyd D. 1998. Protozoan stimulation ofanaerobic microbial activity: Enhancement of the rate of terminaldecomposition of organic matter. FEMS Microbiol Ecol 27:1–8.
13. Fenchel T, Harrison P. 1976. The significance of bacterial grazing andmineral cycling for the decomposition of particulate detritus. InAnderson JM, Macfadyen A, eds, The Role of Terrestrial and AquaticOrganisms in Decomposition Processes. Blackwell, Oxford, UnitedKingdom, pp 285–299.
14. Jumars PA, PenryDL,Baross JA, PerryMJ, Frost BW. 1989.Closing themicrobial loop—Dissolved carbon pathway to heterotrophic bacteriafrom incomplete ingestion, digestion and absorption in animals. DeepSea Res 36:483–495.
15. Carpenter SR, Brock WA. 2004. Spatial complexity, resilience, andpolicy diversity: Fishing on lake-rich landscapes. Ecol Soc 9:31.
16. Taub FB. 1989. Standardized aquatic microcosm—Development andtesting. In Boudou A, Ribeyre F, eds, Aquatic Ecotoxicology:Fundanienta1 Concepts and Methologies, vol 2. CRC, Boca Raton,FL, USA, pp 47–92.
17. De Laender F, Soetaert K, Middelburg JJ. 2010. Inferring chemicaleffects on carbon flows in aquatic food webs: Methodology and casestudy. Environ Pollut 158:1775–1782.
18. DeLaender F,Van denBrinkP, JanssenC. 2011. Functional redundancyand food web functioning in linuron-exposed ecosystems. EnvironPollut 159:3009–3017.
19. American Society for Testing andMaterials. 2007. Standard Practice forStandardized Aquatic Microcosms: Fresh Water. American society fortesting and materials. E1366. West Conshohocken, PA.
20. Taub FB. 1993. Standardizing an aquatic microcosm test. In Soares A,Calow P, eds, Progress in Standardization of Aquatic Toxicity Tests.Lewis, Boca Raton, FL, USA, pp 159–188.
21. KlepperO, Vandekamer JPG. 1987. The use ofmass balances to test andimprove the estimates of carbon fluxes in an ecosystem. Math Biosci85:37–49.
22. van Oevelen D, Van den Meersche K, Meysman FJR, Soetaert K,Middelburg JJ, Vezina AF. 2010. Quantifying food web flows usinglinear inverse models. Ecosystems 13:32–45.
23. VandenMeerscheK,SoetaertK,VanOevelenD. 2009. xsample():AnRfunction for sampling linear inverse problems. J Statist Softw CodeSnippets 30:1–15.
24. De Laender F, De Schamphelaere KAC, JanssenCR, VanrolleghemPA.2007. An ecosystem modelling approach for deriving water qualitycriteria. Water Sci Technol 56:19–27.
25. Naeem S. 2002. Autotrophic-heterotrophic interactions and theirimpacts on biodiversity and ecosystem functioning. In Kinzig AP,Pacala SW, Tilman D, eds, The Functional Consequences of Bio-diversity. Princeton University Press, Princeton, NJ, USA, pp 120–150.
26. Martin-CreuzburgD, vonElert E. 2009.Good food versus bad food: Therole of sterols and polyunsaturated fatty acids in determining growth andreproduction of Daphnia magna. Aquat Ecol 43:943–950.
27. De Schamphelaere KAC, Heijerick DG, Janssen CR. 2002. Refinementand field validation of a biotic ligand model predicting acute coppertoxicity to Daphnia magna. Comp Biochem Physiol C ToxicolPharmacol 133:243–258.
Food web ecology explains effects in contaminated microcosms Environ. Toxicol. Chem. 30, 2011 2897

28. Van Sprang P, VangheluweM,VanHyfteA, HeijerickDMV,VerdonckF. 2007. European Union Risk Assessment Report on copper, copper IIsulphate, pentahydrate, copper I oxide, copper II oxide, dicopperchloride trihydroxide. Volunatry risk assessment, environmental effectpart. European Copper Institute, Brussels, Belgium.
29. Vezina AF, Platt T. 1988. Food web dynamics in the ocean. 1. Best-estimates of flow networks using inverse methods. Mar Ecol Prog Ser42:269–287.
30. Soetaert K, Van den Meersche K, van Oevelen D. 2009. limSolve:Solving linear inverse models. R package version 1.4. NetherlandsInstitute of Ecology, The Netherlands.
31. Ferrando MD, Andreu E. 1993. Feeding behavior as an index of copperstress in Daphnia magna and Brachionus calyciflorus. Comp BiochemPhysiol C Pharmacol Toxicol Endocrinol 106:327–331.
32. Perales-Vela HV, Gonzalez-Moreno S, Montes-Horcasitas C, Canizares-VillanuevaRO. 2007. Growth, photosynthetic and respiratory responsesto sub-lethal copper concentrations in Scenedesmus incrassatulus(Chlorophyceae). Chemosphere 67:2274–2281.
33. Toetz DW, Varga LP, Loughran ED. 1973. Half saturation constants foruptake of nitrate and ammonia by reservoir plankton. Ecology 54:903–908.
34. Litchman E, Klausmeier CA, Schofield OM, Falkowski PG. 2007. Therole of functional traits and trade-offs in structuring phytoplanktoncommunities: Scaling from cellular to ecosystem level. Ecol Lett10:1170–1181.
35. Guisande C. 1993. Reproductive strategy as population density varies inDaphnia magna (Cladocera). Freshw Biol 29:463–467.
36. LurlingM,RoozenF,VanDonkE,GoserB. 2003.Response ofDaphniato substances released from crowded congeners and conspecifics.J Plankton Res 25:967–978.
37. LarssonP,DodsonS. 1993. Invited review—Chemical communicationsin planktonic animals. Arch Hydrobiol 129:129–155.
38. Kratina P, Vos M, Bateman A, Anholt BR. 2009. Functional responsesmodified by predator density. Oecologia 159:425–433.
39. Meador JP, Taub FB, Sibley TH. 1993. Copper dynamics and themechanism of ecosystem-level recovery in a standardized aquaticmicrocoms. Ecol Appl 3:139–155.
40. Martin-Creuzburg D, von Elert E, Hoffmann KH. 2008. Nutritionalconstraints at the cyanobacteria–Daphnia magna interface: The role ofsterols. Limnol Oceanogr 53:456–468.
41. Dennison WC, O’Neil JM, Duffy EJ, Oliver PE, Shaw GR. 1999.Blooms of the cyanobacterium Lyngbya majuscula in coastalwaters of Queensland, Australia. Bull Instit Oceanogr 19:265–272.
42. Willis KJ, Van den Brink PJ, Green JD. 2004. Seasonal variation inplankton community responses of mesocosms dosed with pentachlor-ophenol. Ecotoxicology 13:707–720.
43. StampfliNC, Knillmann S, LiessM, BeketovMA. 2011. Environmentalcontext determinescommunity sensitivityof freshwater zooplankton toapesticide. Aquat Toxicol 104:116–125.
2898 Environ. Toxicol. Chem. 30, 2011 F. De Laender et al.