economics of nuclear desalination: new developments and site
TRANSCRIPT
IAEA-TECDOC-1561
Economics of Nuclear Desalination:New Developments and
Site Specific Studies Final Results of a Coordinated Research Project
2002–2006
July 2007

IAEA-TECDOC-1561
Economics of Nuclear Desalination:New Developments and
Site Specific Studies Final Results of a Coordinated Research Project
2002–2006
July 2007

The originating Section of this publication in the IAEA was:
Nuclear Power Technology Development Section International Atomic Energy Agency
Wagramer Strasse 5 P.O. Box 100
A-1400 Vienna, Austria
ECONOMICS OF NUCLEAR DESALINATION — NEW DEVELOPMENTS AND SITE SPECIFIC STUDIES
IAEA, VIENNA, 2007 IAEA-TECDOC-1561
ISBN 978–92–0–105607–8 ISSN 1011–4289
© IAEA, 2007
Printed by the IAEA in Austria July 2007
FOREWORD
Following successive General Conference Resolutions since the mid-eighties, the IAEA has continued to promote nuclear desalination and has been providing its Member States with the publication of guidebooks, technical documents and computer programs on nuclear desalination as well as the provision of technical assistance through the framework of technical cooperation programs.
In 1997, the IAEA launched the International Nuclear Desalination Advisory Group (INDAG), with well known experts from 16 participating Member States. INDAG has not only been successful in its advisory role in all aspects dealing with nuclear desalination, but has also been extremely efficient in promoting exchange of information and creating contacts between technology providers and its end-users.
A number of technical cooperation projects have assessed the feasibility of particular nuclear desalination projects. Under the IAEA inter-regional technical cooperation (TC) framework, several international collaboration activities were completed. For example: between China and Morocco; the Republic of Korea and Indonesia; France and Tunisia; and in Pakistan. TC national projects for the United Arab Emirates, Algeria and Jordan, for the techno-economic feasibility studies of nuclear desalination plants, are currently being considered.
The Coordinated Research Project (CRP1) on Optimization of the Coupling of Nuclear Reactors and Desalination Systems was completed in 2003 with the participation of 11 Member States. The results of the CRP were published as IAEA-TECDOC-1444 (2005).
Following recommendations from INDAG, a second CRP (CRP2) on Economic Research on, and Assessment of, Selected Nuclear Desalination Projects and Case Studies with the participation of ten Member States. It was started in 2002 and was completed in 2006.
The scope of CRP2 was to enable the Member States to dispose of precise and well validated methods for desalination cost evaluations and to contribute to the IAEA’s efforts to enhance prospects of demonstration and eventually for the successful implementation of nuclear desalination plants in Member States.
This TECDOC presents the results of techno-economic feasibility studies carried out for specific sites in the ten Member States, participating in CRP2. Some of the new developments, adopted by certain Member States, and aiming to further reduce desalted water costs, have also been discussed.
These results reflect the current practices, data, and assumptions specific to each participating country for the cost evaluations of nuclear and conventional water and energy cogeneration systems and their inter-comparisons. The values of various economic parameters are therefore country specific.
Results are site specific and are dependent on several factors and the economic assumptions used. However, the case studies have shown that, in general, the nuclear desalination costs can vary from 0.5 to 0.94 $/m3 for reverse osmosis (RO), from 0.6 to 0.96 $/m3 for multi effect distillation (MED) and from 1.18 to 1.48 $/m3 for multi stage flash (MSF) plants. All nuclear options are economically attractive as compared with the gas turbine combined cycle based desalination systems — as long as gas prices remain higher than 150 $/toe (21 $/bbl).
It is expected that the information provided in this report would be useful to engineers, scientists and students, as well as decision makers in the Member States and would incite them to consider or to accelerate the deployment of nuclear desalination plants in their respective countries.
This publication has been prepared through the collaboration of all the participants to the CRP. The IAEA appreciates this support and thanks all the authors who provided their reviews and contributions. Especially appreciated is the contribution of S. Nisan (CEA, France) in the compilation and preparation of this TECDOC.
The IAEA officers responsible for this publication were B.M. Misra and I. Khamis of the Division of Nuclear Power.

EDITORIAL NOTE
The papers in these proceedings are reproduced as submitted by the authors and have not undergone rigorous editorial review by the IAEA.
The views expressed do not necessarily reflect those of the IAEA, the governments of the nominating Member States or the nominating organizations.
The use of particular designations of countries or territories does not imply any judgement by the publisher, the IAEA, as to the legal status of such countries or territories, of their authorities and institutions or of the delimitation of their boundaries.
The mention of names of specific companies or products (whether or not indicated as registered) does not imply any intention to infringe proprietary rights, nor should it be construed as an endorsement or recommendation on the part of the IAEA.
The authors are responsible for having obtained the necessary permission for the IAEA to reproduce, translate or use material from sources already protected by copyrights.

CONTENTS
1. INTRODUCTION.............................................................................................................1 1.1. Objectives and scope................................................................................................1 1.2. Desalination as an alternate source of fresh water ...................................................1 1.3. The role of nuclear power in desalination................................................................3
1.3.1. Nuclear desalination......................................................................................4 1.3.2. Why nuclear desalination?............................................................................4 1.3.3. Environmental impact of desalination by fossil fuelled energy sources.......5
1.4. Impact of externalities on power and desalination costs..........................................8 1.4.1. Background ...................................................................................................8 1.4.2. Assessment of damage costs and their internalization................................11 1.4.3. Internalization of the power costs ...............................................................12 1.4.4. Other environmental impacts of desalination .............................................13
1.4.4.1. Brine pollution........................................................................................13 1.4.4.2. Adverse effects on land use ....................................................................14 1.4.4.3. Noise.......................................................................................................14
1.4.5. Remediation measures ................................................................................14 1.5. Historical developments and previous experience of nuclear desalination ...........14 1.6. Potential of nuclear desalination in Member States...............................................16
1.6.1. Techno-economic feasibility studies...........................................................16 1.6.2. Nuclear desalination demonstration projects ..............................................17
1.7. Safety considerations .............................................................................................18 1.7.1. Safety barriers .............................................................................................18 1.7.2. Transients and accidents induced by couplings ..........................................19
1.7.2.1. MED coupling ........................................................................................19 1.7.2.2. RO coupling............................................................................................21
1.7.3. Safety considerations for the HTR couplings .............................................21 1.7.4. Radiological protection of users of the
desalination plant, coupled to HTRs...........................................................22
2. THE ECONOMICS OF NUCLEAR DESALINATION ................................................23 2.1. General principles ..................................................................................................23
2.1.1. Cost evaluation............................................................................................23 2.2. Cost evaluation methods ........................................................................................26
2.2.1. The power credit method ............................................................................26 2.2.2. Water credit method ....................................................................................27 2.2.3. The exergy method .....................................................................................27
2.3. Techno-economic considerations of cogeneration.................................................28 2.4. The iaea desalination economic evaluation programme (DEEP) ..........................30
2.4.1. Historical background.................................................................................30 2.4.2. General structure of DEEP application.......................................................30
2.4.2.1. Case File .................................................................................................31 2.4.2.2. Comparative Presentation (CP) File .......................................................31 2.4.2.3. Control File.............................................................................................32
2.4.3. Scope of DEEP ...........................................................................................32 2.4.4. New developments in DEEP.......................................................................33
2.4.4.1 Thermal performance model...................................................................33 2.4.4.2 RO performance model...........................................................................35
2.5. Other methods of desalination cost evaluation ......................................................36 2.6. Further developments.............................................................................................38

3. INSTITUTIONAL ASPECTS.........................................................................................39 3.1. The deployment of nuclear energy in developing countries ..................................39 3.2. Financing................................................................................................................42
3.2.1. Financing arrangements ..............................................................................42 3.2.2. Public-private partnerships .........................................................................43 3.2.3. Financing options........................................................................................43 3.2.4. The financing mechanisms .........................................................................44
4. NEW TECHNOLOGICAL DEVELOPMENTS AND COST REDUCTION STRATEGIES..............................................................................46 4.1. Development of improved or new generation nuclear reactors .............................46 4.2. Advances in desalination technologies ..................................................................47
4.2.1. Thermal processes.......................................................................................47 4.2.2. Membrane based technologies ....................................................................48
4.2.2.1. Membrane based pre-treatment...............................................................48 4.2.2.2. Energy recovery devices .........................................................................49
4.3. Cost reduction strategies ........................................................................................49 4.3.1. Utilization of waste heat from nuclear reactors .........................................49
4.3.1.1. High temperature, gas cooled reactors....................................................49 4.3.1.2. Utilization of waste heat from the
condensers of PWRs and CANDUs (the ROph process) .......................52 4.3.2. Waste heat utilization from Indian PHWRs................................................54
4.3.2.1. The research reactor CIRUS...................................................................54 4.3.2.2. Waste heat utilization from the 500 MW(e) PHWR...............................55
4.4. Utilization of hybrid systems .................................................................................56 4.4.1. The Indian hybrid nuclear desalination plant..............................................57 4.4.2. The USA case study....................................................................................59
4.5. Extraction of valuable materials and minimization of brine discharge .................62 4.5.1. Selection of materials..................................................................................62 4.5.2. Principle of operation of the final method of extraction.............................63
5. RESULTS AND DISCUSSION OF CASE STUDIES FROM MEMBER STATES ....65 5.1. Summary of the site specific case studies ..............................................................66
5.1.1. MSF based systems.....................................................................................66 5.1.1.1. Sensitivity studies ...................................................................................67
5.1.2. MED, MED/VC based systems ..................................................................68 5.1.2.1. Sensitivity studies ...................................................................................69
5.1.3. RO nuclear desalination systems ................................................................71 5.1.3.1. Sensitivity studies ...................................................................................71
5.2. Hybrid systems.......................................................................................................72 5.3. Floating cogeneration plants ..................................................................................72 5.4. Transport costs .......................................................................................................74
5.4.1. Method of calculation .................................................................................75 5.4.2. Results and discussion ................................................................................75
5.5. General conclusions from the case studies ............................................................76
6. CONCLUSIONS .............................................................................................................78 6.1. Main conclusions ...................................................................................................78 6.2. Country specific conclusions .................................................................................79
6.2.1. Argentina (CAREM +RO system for the Porto Deseado site) ...................79 6.2.2. China (NHR-200 + MED systems for some costal locations)....................79 6.2.3. Egypt (PWR-1000 + MSF, MED and RO for a coastal site)......................79

6.2.4. France and Tunisia (PWR, GT-MHR and PBMR + MED, RO, for the la Skhira site in Tunisia)................................80
6.2.5. India (PHWR + hybrid MSF/RO, for the Kalpakkam site demonstration plant).............................................................................80
6.2.6. The Republic of Korea (SMART + MED, for a demonstration plant).......80 6.2.7. Pakistan (existing CANDU reactor, KANUPP + MED,
for Karachi region)......................................................................................81 6.2.8. Russian Federation (KLT-40S, RITM-200, GT-MHR + MED,
RO for a coastal site)...................................................................................81 6.2.9. Syrian Arab Republic (PBMR + MED/VC, RO,
for Damascus region)..................................................................................81 6.2.10. USA (PWR + MED, RO, and hybrid MED/RO)........................................82
6.3. Future investigations ..............................................................................................82
REFERENCES .........................................................................................................................83
ABBREVIATIONS ..................................................................................................................85
ANNEXES: CRP CASE STUDIES BY PARTICIPATING MEMBER STATES ANNEX 1: ARGENTINA ..............................................................................................................89
ANNEX 2: CHINA .......................................................................................................................105
ANNEX 3: EGYPT.......................................................................................................................119
ANNEX 4: FRANCE ....................................................................................................................128
ANNEX 5: INDIA ........................................................................................................................141
ANNEX 6: REPUBLIC OF KOREA............................................................................................157
ANNEX 7: PAKISTAN ................................................................................................................163
ANNEX 8: RUSSIAN FEDERATION.........................................................................................173
ANNEX 9: SYRIAN ARAB REPUBLIC.....................................................................................189
ANNEX 10: UNITED STATES OF AMERICA............................................................................205
CONTRIBUTORS TO DRAFTING AND REVIEW ............................................................217


1. INTRODUCTION
1.1. OBJECTIVES AND SCOPE In view of the significant number of studies on the economic aspects of integrated nuclear desalination systems being carried out in several Member States, INDAG recommended in its April 2000 meeting that a new CRP, complementary to the CRP on the Optimisation of the Coupling of Nuclear Reactors and Desalination Systems [1], be launched to derive added value through the coordination of these studies and to address additional issues that have been identified.
The IAEA’s NPTDS then organised a consultancy, with a group of international experts from 10 countries and from international organisations, in October 2000 at CNSTN, Tunisia, to further refine the objectives, scope and contents of the proposed CRP.
The CRP was actually launched in 2001, with research proposals received from 11 Member States.
The first RCM took place in July 2002. The second and third meetings were organised respectively in October 2003 and May 2005. A fourth and final meeting was held from October 31 to November 3, 2006 to finalize this TECDOC and to discuss future IAEA activities in the field of nuclear desalination economics. The meeting venue was the IAEA, Vienna, Austria.
The basic aim of the present TECDOC is to summarize the outputs from the Member States, participating in the CRP. The TECDOC therefore follows the same objectives and scope as those established for the CRP.
Member States, which participated in the CRP are: Argentina, China, Egypt, France, India, Republic of Korea, Pakistan, Russian Federation, Syrian Arab Republic and the USA.
The objectives of the CRP were to:
• Evaluate economic aspects and to investigate the competitiveness of nuclear desalination under particular site-specific conditions in case studies.
• Identify innovative techniques leading to further cost reduction of nuclear desalination systems.
• Refine economic assessment methods and tools.
These objectives were to be achieved through research in the following areas:
• Collection and analysis of economic and performance data of various existing nuclear desalination installations.
• Determination of economic and technical site specific conditions and conducting of national case studies.
• Update and validate the IAEA’s desalination cost evaluation software, DEEP, through benchmarking, integration of data from operating plants and inclusion of additional desalination/coupling options (e.g. HTRs and other reactors utilising waste heat for desalination).
• Development of a consistent, international approach for economic evaluation of nuclear desalination options, through the analysis of the results of the site-specific case studies.
1.2. DESALINATION AS AN ALTERNATE SOURCE OF FRESH WATER Seventy percent of the planet is covered with water, but only 2.5% of that is fresh water. Nearly 70% of this fresh water is frozen in the icecaps of Antarctica and Greenland. Most of the rest is in the form of soil moisture or in deep inaccessible aquifers or comes in the form of heavy rains and floods that are difficult to contain and exploit. Consequently, only less than 0.008% (about 70 000 km3) of the world’s water is readily accessible for direct human use, and even that is very unevenly distributed.
Recent statistics show that currently 2.3 billion people live in water-stressed areas and among them 1.7 billion live in water-scarce areas, where the water availability per person is less than 1000 m3/year.
1

In fact, the situation is expected to worsen further since, by 2025, the number of people suffering from water stress or scarcity could swell to 3.5 billion, out of which 2.4 billion would live in water-scarce regions. Water scarcity is a global issue. Every year new countries are affected by growing water problems.
It is for this reason that the Millennium Declaration by UN General Assembly in 2000 set up a target to halve, by the year 2015, the world population, which is unable to reach, or to afford, safe drinking water. Vision 21: shared vision for Hygiene, Water Supply and Sanitation, has a target to provide water, sanitation and hygiene for all by 2025. Better water conservation, water management, pollution control and water reclamation are all part of the integrated solution to projected water stresses. So too are new sources of fresh water, including the desalination of seawater.
Desalination technologies have been well established since the mid-20th century and widely deployed in the Middle East and North Africa. The contracted capacity of desalination plants has increased steadily since 1965 and is now about 36 million m3/day worldwide, as shown in Figure 1. This capacity could cater to world’s population roughly 6 litres a day per capita of fresh potable water. If this capacity were available to 1.5 billion in the world without direct access to drinking water, it would provide approximately 20 litres/day/capita.
Figure 1. Cumulative capacity of all land-based desalination plants (unit capacity > 100 m3/day)1.
Large scale commercially available desalination processes can generally be classified into two categories: (a) distillation processes that require mainly heat plus some electricity for ancillary equipment, and (b) membrane processes that require only electricity. In the first category (distillation) there are two major processes: multi-stage flash (MSF) and multi-effect distillation (MED). In both processes, seawater is heated; the steam that evaporates is condensed and collected as freshwater; and the residual brine is discharged.
1 International Symposium on Desalination and Water Purification, Jaipur (India), March 20-21, (2006).
2

In the second category (membranes) is the reverse osmosis process (RO), in which pure water passes from the high-pressure seawater side of a semi-permeable membrane to the low-pressure freshwater side. The pressure differential must be high enough to overcome the natural tendency for water to move from the low concentration freshwater side of a membrane to the high concentration seawater side in order to balance osmotic pressures.
The energy for the desalination plants is generally supplied in the form of either steam or electricity. Conventional fossil fuel-powered plants have normally been utilized as the primary sources but their intensive use raises increasing environmental concerns, specifically in relation to greenhouse gas emissions (Section 1.3.3). The depleting sources and the future price uncertainty of the fossil fuels and their better use for other vital industrial applications are also the factors to be considered.
1.3. THE ROLE OF NUCLEAR POWER IN DESALINATION The world energy requirements are presently met from oil, coal, gas, hydro, nuclear and renewable energies in that order as shown in Table 1.
TABLE 1. PERCENTAGE OF WORLD ENERGY USE
Fuel Percentage (%) Present trends
Oil 39 Short term: Building of additional plants continues.
Coal 25 Building of additional plants continues.
Gas 22 Short term: Building of additional plants continues; gas turbine combined cycle plants considered the cheapest of fossil fuelled plants.
Hydro 7 Building of dams continues, where possible.
Nuclear 6 More or less stagnant in developed countries, with a hope for renewed interest; high rate of expansion in emerging countries.
Renewable energies 1 Gradual expansion; continued efforts to reduce costs.
It is now universally recognized that there will be an increase in the world’s requirement for electricity over the next few decades. The present trend towards meeting this demand includes the building of fossil fuel plants, particularly combined cycle gas fired plants.
However, the spiralling increase in greenhouse gas (GHG) emissions has resulted in setting the emission targets in international meetings held at Toronto, Rio de Janeiro and Kyoto. The IAEA predicts that the GHG emissions would be 36-50% higher by 2010 compared to 1990 levels. Many analysts, therefore, feel that the only viable alternative to fossil fuels is nuclear energy to reduce the rate of increase of GHG, particularly, carbon dioxide.
3

Yet another incentive for nuclear power is to maintain diversity of supply. A national strategy limited to one particular form of energy (fossil fuels) will be vulnerable to increased fuel costs and pressures from exporting countries.
Nuclear power is a proven technology, which has provided more than 16% of world electricity supply in over 30 countries. More than ten thousand reactor-years of operating experience have been accumulated over the past 5 decades.
There are many reasons which favour a possible revival of the nuclear power production in the years to come. It is thus expected that this revival would also lead to an increased role of nuclear energy in non-electrical energy services, which, at the moment, are almost entirely dominated by fossil energy sources. Among various utilization of nuclear energy for non-electrical products, using it for the production of freshwater from seawater (nuclear desalination) has been drawing broad interest in the IAEA Member States as a result of acute water shortage issues in many arid and semi-arid zones worldwide. With technical co-ordination or support of the IAEA, several demonstration programs of nuclear desalination are also in progress in several Member States to confirm its technical and economical viability under country-specific conditions
The desalination of seawater using nuclear energy is a feasible option to meet the growing demand for potable water. Over 175 reactor-years of operating experience on nuclear desalination have already been accumulated worldwide.
1.3.1. Nuclear desalination
In the IAEA terminology, nuclear desalination is defined to be the production of potable water from seawater in a facility in which a nuclear reactor is used as the source of energy for the desalination process. Electrical and/or thermal energy may be used in the desalination process on the same site. The facility may be dedicated solely to the production of potable water, or may be used for the generation of electricity and production of potable water, in which case only a portion of the total energy output of the reactor is used for water production.
The design approaches for a nuclear desalination plant are essentially derived from those of the nuclear reactor alone, with some additional aspects to be considered in the design of a desalination plant and its integration with the nuclear system.
All nuclear reactor types can provide the energy required by the various desalination processes. In this regard, it has been shown that Small and Medium Reactors (SMRs) offer the largest potential as coupling options to nuclear desalination systems in developing countries. The development of innovative reactor concepts and fuel cycles with enhanced safety features as well as their attractive economics are expected to improve the public acceptance and further the prospects of nuclear desalination.
The coupling with nuclear system is not difficult technically but needs some consideration in (a) avoiding cross-contamination by radioactivity, (b) providing backup heat or power sources in case the nuclear system is not in operation (e.g. for refuelling and maintenance), (c) incorporation of certain design features, minimising the impact of the thermal desalination systems’ coupling to the nuclear reactors (Section 1.6).
1.3.2. Why nuclear desalination?
The International Atomic Energy Agency is a specialized organization of the UN system that seeks to accelerate and enlarge the contribution of atomic energy to peace, health and prosperity throughout the world. The institutional basis for the IAEA’s involvement in nuclear desalination is in its Statute and Medium Term Strategy.
Article II of the IAEA Statute provides that:
“ The Agency shall seek to accelerate and enlarge the contribution of atomic energy to peace, health and prosperity throughout the world”.
4

This refers implicitly to nuclear desalination as an option for the use of nuclear technologies.
The same applies to the Article III of the Statute, which authorizes the IAEA:
“ To encourage and assist research on, and development and practical application of, atomic energy for peaceful uses throughout the world….”; (Article III, A.1); and
“To foster the exchange of scientific and technical information on peaceful uses of atomic energy.” (Article III, A.3).
In addition, Objective A.3 of the Agency’s Medium Term Strategy requires the Agency:
“ To support and facilitate the development of new and emerging applications of nuclear technologies by co-generation and heat applications, including seawater desalination”.
Request of assessing feasibility of using nuclear energy for seawater desalination was first made by the five North African countries to the IAEA in 1989 and the General Conference adopted its resolution to resume the study. These countries are located in semi-arid zones and already suffer from water shortages.
In recent years, interests have been also been indicated by Member States in South and South East Asia for the feasibility, as well as the demonstration, of nuclear desalination projects. The issue has since then been repeatedly stressed at the General Conference (Committee on the Whole) and supported by many Member States including most members of Group-77. The support stems not only from their expectation of its possible contribution to the freshwater issue but has also been motivated by a variety of reasons that include: the economic competitiveness of nuclear desalination in areas lacking cheap hydropower or fossil fuel resources, energy supply diversification, conservation of fossil fuel resources and spin-off effects of nuclear technology for industrial development.
Looking to the future, there are several reasons for focusing now on expanding nuclear power’s contribution to desalination. Apart from the expanding demand for freshwater and the increasing concern about GHG emissions and pollution from fossil fuels, there is a renewed and growing emphasis on small and medium sized nuclear reactors, and this is particularly important for desalination because the countries most in need of new sources of freshwater often have limited industrial infrastructures and relatively weaker electricity grids. The size of the grid limits the possibilities for integrating a co-generating nuclear power plant into the grid to supply the electricity market, in addition to meeting the energy requirements of a desalination plant. The largest power unit that can be integrated into an electricity grid must not exceed about 10-20 % of the total grid capacity. Of course, smaller nuclear reactors would be more appropriate for remote areas that are not suitable for connections to the grid.
For nuclear desalination to be attractive in any given country, two conditions have to be satisfied simultaneously: a lack of water and the ability to use nuclear energy for desalination. In most regions, only one of the two is present. Both are present for example in China, the Republic of Korea, India and Pakistan. These regions already account for almost half the world’s population, and thus represent a potential long term market for nuclear desalination. The market will expand further to the extent that regions with high projected water needs, such as the Middle East and North Africa, increase their nuclear expertise and capabilities.
1.3.3. Environmental impact of desalination by fossil fuelled energy sources
Desalination is an energy intensive process. A future desalination strategy based only on the use of fossil fuelled systems is not sustainable: Fossil fuel reserves are finite and must be conserved for more important uses such as transport, petrochemical industry etc. Besides, the demands for desalted water would continue increasing as population grows and standards of living improve. Conservation
5
measures such as the modernisation of water networks to minimise leakages, the recycling of used water etc. will certainly reduce the future water demands slightly but they would not be able to halt the dissemination of desalination plants and consequently of the fossil fuelled based systems for the production of needed electricity and heat.
The following paragraphs illustrate the damaging consequences of such a policy by taking the example of the Mediterranean region.
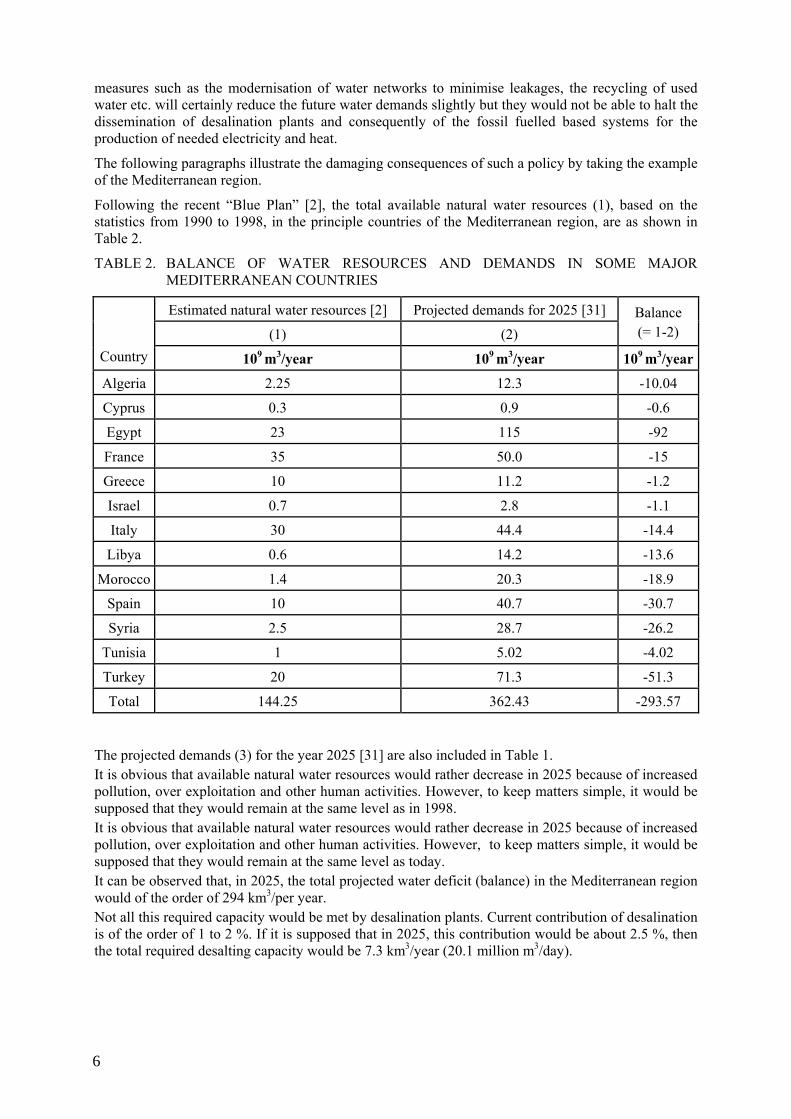
Following the recent “Blue Plan” [2], the total available natural water resources (1), based on the statistics from 1990 to 1998, in the principle countries of the Mediterranean region, are as shown in Table 2.
TABLE 2. BALANCE OF WATER RESOURCES AND DEMANDS IN SOME MAJOR MEDITERRANEAN COUNTRIES
Estimated natural water resources [2] Projected demands for 2025 [31]
(1) (2) Balance (= 1-2)
Country 109 m3/year 109 m3/year 109 m3/year
Algeria 2.25 12.3 -10.04
Cyprus 0.3 0.9 -0.6
Egypt 23 115 -92
France 35 50.0 -15
Greece 10 11.2 -1.2
Israel 0.7 2.8 -1.1
Italy 30 44.4 -14.4
Libya 0.6 14.2 -13.6
Morocco 1.4 20.3 -18.9
Spain 10 40.7 -30.7
Syria 2.5 28.7 -26.2
Tunisia 1 5.02 -4.02
Turkey 20 71.3 -51.3
Total 144.25 362.43 -293.57
The projected demands (3) for the year 2025 [31] are also included in Table 1. It is obvious that available natural water resources would rather decrease in 2025 because of increased pollution, over exploitation and other human activities. However, to keep matters simple, it would be supposed that they would remain at the same level as in 1998. It is obvious that available natural water resources would rather decrease in 2025 because of increased pollution, over exploitation and other human activities. However, to keep matters simple, it would be supposed that they would remain at the same level as today. It can be observed that, in 2025, the total projected water deficit (balance) in the Mediterranean region would of the order of 294 km3/per year. Not all this required capacity would be met by desalination plants. Current contribution of desalination is of the order of 1 to 2 %. If it is supposed that in 2025, this contribution would be about 2.5 %, then the total required desalting capacity would be 7.3 km3/year (20.1 million m3/day).
6

According to the EC ExternE study2, the total emissions of GHG per MW(e).h of electricity produced by representative fossil fuelled power plants in France, are as presented in Table 3.
TABLE 3. GHG AND PARTICLE EMISSIONS FROM SOME REPRESENTATIVE FOSSIL FUELLED PLANTS
Coal Oil Gas
Plant characteristics
Hypothetical new plantPulverized fuel, flue
gas, desulphurisation, steam turbine
Existing plant Low Sulphur oil Low NOx burner
Steam turbine
Hypothetical, new, gas turbine, combined
cycle plant
Plant size (MW(e)) 600 700 250
Annul production (GW(e).h) 2100 1050 1500
Conversion efficiency (%) 38 39 52
0.17 0.13 0.04 1085 866 433 1.36 5.26 0.04
Emissions (g/kW(e).h) PM10 CO2eq SOx NOx 2.22 1.2 0.71
The specific heat and electricity consumptions of three main desalination plants are given in Table 4, [3].
TABLE 4. SPECIFIC ENERGY CONSUMPTION OF DESALINATION PLANTS
Process Specific heat consumption Specific electricity consumption)
kW(th).h/m3 kW(e).h/m3
MSF 100 3
MED 50 2-3
RO 0 4.5
The data presented in the above Tables allows to calculate the approximate3 total GHG emissions produced by the fossil fuelled plants and the three desalination plants.
Results for a total desalting capacity of 20.1 million m3/day are presented in Table 5.
2 From the project report by A. Rable et al, www.externe.info. 3 In fact, the water source data as presented in Table 2 is based on the amount of water actually
pumped in the countries mentioned.
7

TABLE 5. ESTIMATED QUANTITIES OF GHG EMISSIONS BY DIVERSE FOSSIL FUELLED
PLANTS AND DESALINATION PROCESSES
Power plant MSF
(Mt/year) MED
Mt/year) RO
(Mt/year)
CO2 SOx NOx Particles CO2 SOx NOx Particles CO2 SOx NOx Particles
Coal fired 264.45 0.33 0.54 0.04 141.90 0.1779 0.2903 0.0222 32.250.04042 0.06559 0.00505
Oil fired 216.22 1.31 0.3 0.03 115.83 0.0.7036 0.1605 0.0174 25.740.15635 0,03567 0.00386
Gas turbine, CC 141.58 0.01 0.23 0.01 74.65 0.0.007810.1224 0.0069 12.870.00135 0.0211 0.00119
It can thus be concluded that for a desalting capacity of 20.1 million m3/day in the Mediterranean region alone, required in 2025, one would produce, depending upon the energy source and the desalination process used,
13 to 264 million tonnes/year of CO2.
1350 to 1 310 000 tonnes/year of SOx.
21 100 to 540 000 tonnes/year of NOx.
1190 to 40 000 tonnes/year of particles.
The potential levels of GHG and particle emissions on the world scale could then be more than double these figures.
These could naturally be avoided through the use of nuclear energy.
1.4. IMPACT OF EXTERNALITIES ON POWER AND DESALINATION COSTS4
1.4.1. Background
An obvious corollary to the discussion on GHG are the costs related to the environment. It is now generally recognised that the production and consumption of energy and related activities is linked to a wide range of environmental and social problems such as the health effects of pollution of air, water and soil, ecological disturbances and species loss, and landscape damages. Adopting a notion from welfare economics, the costs of such damages are referred to as external costs or externalities. An externality arises when the social or economic activities of one group of persons have an impact on another group and when that impact is not fully accounted or paid for by the main actors of the damages caused. In the particular case of energy production, fuel cycle externalities are the costs imposed on the society and the environment that are not accounted for (i.e. not integrated in the market accounting system) by the producers and consumers of energy. In the language of environmentalists, the term fuel cycle refers to the chain of processes linked to the generation of electricity from a given fuel. Thus, for example the coal fuel cycle would involve evaluations of the impacts associated with:
• Construction of the coal-fired plant. • Coal mining. • Limestone quarrying (for flue gas desulphurisation, where practiced). • Transport of coal, wastes, other materials. • Power generation.
4 This section is entirely synthesised from the documents of the EC projects ExternE, (which can be
consulted on: www.externe.info), in particular the documents and lectures by R. Friedrich and the ExternE team.
8

• Waste disposal. • Electricity transmission.
Effective control of these externalities, which are necessary for the pursuit of economic growth via energy services, poses a serious and difficult problem. It is absolutely essential that the socio-economic damages must first be quantified and monetized and then “internalized” so that the social and economic dimension of energy production be rebalanced with a purely economical one, thus leading to greater environmental sustainability. In the EU and some other European countries, policy analysts are being required to take account of environmental aspects in their decision making and to undertake new cost benefit analyses, taking into account the internalised costs of externalities for various energy options. During the last 15-20 years, the European Commission (EC) has been extremely active in the effort to quantify energy external costs. The EC first launched the ExternE project in collaboration with the US Department of Energy (DOE) in 1991. Intensive R&D was then carried out, in particular through the EC’s fifth framework programme (PCRD). The objectives of the research were also stressed in the 5th Environmental Action Program, in the White Paper on Growth, Competitiveness and Employment, in the White Paper on Energy and in the Göteborg Protocol of 2001. In the context of the 5th PCRD’s ExternE project, a multidisciplinary research team was constituted (50 research teams in over 20 countries) to develop an original methodology, the Impact Pathway Approach. This approach takes issues such as exposure response functions, especially the health impacts from air pollution (particles, oxides of nitrogen, sulphur dioxide, etc.) , the monetary valuation of these impacts (value of “statistical life”), the accidents in the whole energy supply chain, and the assessment of other impacts such as global warming, acidification and eutrophication (avoidance costs for reducing areas where critical loads are exceeded) resulting from the emission of GHG. The ExtrenE team has made an in-depth analysis of various fuels and technologies in the electricity sector. The methodology and the first results were published in 1995. A comparative evaluation has been made for the following technologies and fuel cycles. A decade of research has resulted in detailed set of data for impacts from :
• Fossil fuels: coal and oil technologies, with varying degrees flue gas cleaning, natural gas, centralised systems and CHP etc.
• Nuclear: A PWR, and associated Fuel cycle services, with and without reprocessing. • Renewable: On-shore and off-shore wind, hydro-electricity, a wide range of Biomass fuels
(e.g. waste wood, crops) and technologies. The application on transport externalities (road, rail, aircraft and navigation ) focussed on the specific requirements emission and dispersion modelling and the extension and update of dose response functions. In addition to air pollution impacts, those from noise and accidents have also been analysed. An update, considerably reducing the uncertainties of calculation models was issued in 1998. Despite the complexity of the task and remaining uncertainties, the ExternE methodology has been widely accepted in the scientific community and is now a world reference in the field. The impact pathway approach is illustrated in Table 6 in terms of various damages like morbidity or premature mortality (through chronic bronchitis, asthma, heart failure etc;). Other main categories are effects on crops and materials. The damages caused by Global warming, produced by GHG emissions have been assessed on a global level. The range of uncertainties is thus relatively higher as compared to other damages. In addition to damage costs estimates, for impacts on ecosystems and global warming, marginal and total avoidance costs to reach agreed environmental aims are calculated as an alternative second best approach. The cost for ecosystems are based on the political aim of reducing the area in the EU where critical loads are exceeded by 50%. For global warming, a shadow price for reaching the Kyoto reduction targets is used. The impact pathway approach, and the associated software package, EcoSense, to assess the environmental impact within the ExternE project series, use a bottom-up approach in which the environmental benefits and costs are calculated in the following steps:
9

Follow the pathway from source emissions (e.g. kg/year of particulates). Calculate the quality changes of air, water and soil (dispersion and increase of concentrations
at given receptor sites). Estimate the physical impact (through dose response functions). Translate the impacts into costs (monetary valuation).
This detailed bottom-up methodology is an improvement over earlier top-down approaches since the impacts, and hence the external costs, are highly site dependent.
TABLE 6. IMPACT PATHWAYS FOR THE EXTERNALITIES OF ENERGY AND TRANSPORT
Impact category Pollutant/burden Effects
PM205
, SO2, NOx, Reduction in life expectancy
As, Cd, Cr, Ni Benzene, Benzo-[a]-pyrene 1,- butadene Diesel particles
Cancers
Noise Loss of amenity, impact on health
Human Health -mortality
Accident risk Fatality risk from traffic and workplace accidents
PM20, O3, SO2, Respiratory hospital admissions
PM10, O3 Restricted activity days
PM10, CO Congestive heart failure Human Health -morbidity
PM10
Cerebro-vascular hospital admissions Cases of chronic bronchitis Cases of chronic cough in children Cough in asthmatics Lower respiratory systems
Hg, Pb Neurotoxicity (decreased IQ)
SO2, Acid deposition Ageing of galvanised steel, limestone, mortar, sand-stone, paint, rendering, and zinc for utilitarian buildings Building
Material Combustion particles Soiling of buildings
NOx, SO2 Yield change for wheat, barley, rye, oats, potato, sugar beet
O3 Yield change for wheat, barley, rye, oats, potato, rice, tobacco, sunflower seed Crops
Acid deposition Increased need for liming
Global Warming CO2, CH4, N2O, N, S
World-wide effects on mortality, morbidity, coastal impacts, agriculture energy demand, and economic impacts due to temperature change and sea level rise
Ecosystems Acid and nitrogen depositions Acidity and eutrophication
5 Particles with an aerodynamic diameter < 20 µm, including sulphate and nitrate aerosols.
10

1.4.2. Assessment of damage costs and their internalization
Results of comparison of damage costs/kWh for various technologies are presented in Table 7.
TABLE 7. EXTERNAL COSTS OF ELECTRICITY PRODUCTION IN THE EU FROM EXISTING TECHNOLOGIES (10-2 $/kW.h*)
Country Coal and lignite
Oil Gas Nuclear Biomass Hydro Solar PV Wind
Austria 1.3 to 3.8 2.5 to 3.8 0.13
Belgium 5.1 to 19 1.3 to 2.5 0.64
Denmark 5.1 to 8.9 2.5 to 3.8 1.3 0.13
Finland 2.5 to 5.1 1.3
France 8.9 to 12.7 10.2 to 14.0 2.5 to 5.1 0.38 1.3 1.3
Germany 3.8 to 7.6 6.4 to 10.2 1.3 to 2.5 0.25 3.81 0.76 0.063
Greece 6.4 to 10.2 3.8 to 6.4 1.3 0 to 1.01 1.3 0.32
Ireland 7.6 to 10.2
Italy 3.8 to 7.6 3.8 to 7.6 0.38
Netherlands 3.8 to 5.1 1.3 to 2.5 0,89 0.64
Portugal 5.1 to 8.9 1.3 to 2.5 1.3 to 2.5 0.038
Spain 6.4 to 10.2 1.3 to 2.5 3.8 to 6.4** 0.25
Sweden 2.5 to 5.1 0.38 0 to 0.89
United Kingdom 5.1 to 8.9 3.8 to 6.4 1.3 to 2.5 0,32 1.3 0.19
* Sub-total of quantifiable externalities (global warming, public health, occupational health, material damage); on the basis of 1€ = 1.26959 $. ** biomass co-fired with lignite
Table 7 leads to the following conclusions:
• Results are extremely site dependent.
• In general, wind technologies are most environmentally friendly with respect to GHG pollutants and particles. However, not every site is appropriate for wind power generation, which has a definite cost regarding the noise.
• Nuclear generates the lowest external costs after the wind power, even when the low probability accidents with high consequences are integrated into the calculation. These results are generated for 0 % discount rates. At 3 % discount rate, the external costs by nuclear are lower.
• Photovoltaic is the cleanest technology regarding the use. It has, however, considerable life cycle impacts.
• Gas fired technologies are relatively clean.
11

• Coal technologies are the worst in view of the high generation of CO2. They appear to have high impacts due to the primary –secondary aerosols.
Figure 2. External costs of power stations in Germany (CO2 =19 euros/t, 1 year of life lost = 50 000 euros).
Figure 26 shows an illustrative example of the power costs from various power plants for selected sites in Germany, with 2010 technologies.
It is observed that for the fossil fuelled electricity systems, human health effects, acidification of ecosystems and the potential global warming impacts are the major sources of external costs. Although the analysed power plants are all supposed to be equipped with abatement technologies, the emissions of SO2 and NOx due to the subsequent formation of sulphate and nitrate aerosols leads to considerable health risks.
External costs arising from the nuclear fuel cycle are significantly lower than those estimated for fossil fuel cycles.
External costs from renewable fuel cycles and hydropower mainly result from the use of fossil fuels for material supply and during the construction phase. External costs from current PV technologies are higher than nuclear and are close to that from the gas fired plants.
Impacts from wind and hydropower cycles are the lowest.
1.4.3. Internalization of the power costs
A logical and sustainable way to permit the choice between various technologies is to integrate the external costs in the production costs of these technologies.
Taking the above external costs and current generating costs of electricity in Germany, one would thus obtain the results a shown in Figure 3.
6 From A. Voss, www.ier.uni-stuttgart.de.
12

Figure 3. Total costs of various electricity generating technologies in Germany.
It is clearly seen that the power generation costs by renewable energies, especially by solar energy, is much higher than fossil energies or nuclear energy. It is also obvious that the full integration of external costs in the nuclear case would render it economically the most attractive option.
1.4.4. Other environmental impacts of desalination
Section 1.3 dealt with the emissions of GHG for desalination plants using fossil fuelled sources. These were mainly related to the relatively energy intensive nature of most desalination processes. The other environmental impacts of the desalination plants, discussed in detail in [4, 5, 28] can be summarized as follows.
1.4.4.1. Brine pollution Brine is obviously an un avoidable by product of desalination. The average concentration of the discharge brine is about 70 000 ppm, or more. There is on-going debate on the adverse effects of the direct discharge of this concentrated brine on the local marine eco-systems. It is nonetheless generally admitted that the hyper saline layer in the discharged brine sinks towards the sea bed because of its higher density and thus could potentially damage heavily the local marine biota.
In 2003, the United Nations Environmental Program (UNEP) published an alarming report on the massive discharge of concentrated brine along the Gulf coast [6].
In addition to the characteristics of the desalination process, the magnitude of the environmental impact of brine discharge would depend heavily on the hydrodynamic and biometric conditions, as well as the biological factors of the local marine environment.
A further problem associated with brine discharge, independent of its salinity, is the rather high temperature of the brine as compared to the local recipient water body. This is known to cause environmental damage, in particular to the fragile eco-systems such as corals.
Yet another aspect of brine discharge is related to the addition of chemicals that are used in the pre-treatment and post-treatment of desalted water. Chemicals are added to enhance flocculation, to avoid membrane deterioration in RO plants, to avoid scaling etc.
13

Anti-scaling agents are mainly phosphates or polymers of maleic acid or sulphuric acid. Anti-fouling agents are usually chlorine compounds, whereas anti-foaming agents are alkylated polyglycols, fatty acids or fatty acid easters.
These chemicals are discharged with the brine, along with the corrosion products containing metals such as copper, nickel, iron, chromium and zinc.
The net result could be not only marine desertification (due to the devastating impact of osmotic stresses on the benthic biota) but also eutrophication, variation in pH values, accumulation of heavy metals as well as the sterilizing properties of disinfectants.
1.4.4.2. Adverse effects on land use The area required for a seawater desalination plants is about 1 to 2 m2 per m3/day. There may thus be an important view adverse effect through the design and architecture of the buildings, especially when associated with the other sundry structures electricity transport, feed and intake water structures, pipings etc.
1.4.4.3. Noise High pressure pumps, energy recovery devices, turbines etc. used in the desalination plants all produce noise levels above dB(A).
1.4.5. Remediation measures
It is important to underline here that while the basic axiom of scientific research is a thorough discussion of the advantages and inconveniences of a given technology, its real or perceived adverse effects need to be put in a pragmatic, relativistic perspective. Thus, for example, the adverse effects of desalination technologies are orders of magnitude lower than those from the gargantuan civil works such as large dams and inter-basin water transfers.
Most of the adverse effects of desalination can be remedied through the adoption of appropriate measures. Thus, desalination plants can be built with higher levels of acoustic isolation and exigencies of local architectural design.
The effects of brine discharges can be mitigated through dilution or mixing before discharge. Thus, for example, in the case of large plants, such as Tampa Bay, a dilution ratio of 70:1 may be obtained. In section 4.5, an innovative scheme has been discussed which has not only the potential for zero discharge but also of bringing down the overall costs of a nuclear desalination complex through the extraction of valuable materials contained in the rejected brine and the subsequent surface storage of the remaining salt.
The real question is the environmental impact of energy production. It was shown above that among the clean technologies are the renewable energy sources and the nuclear power. However, not every site is fit for renewable energies nor every country is in a position to deploy nuclear reactors. It is known that desalination by renewable energies can only bring local, low-need solutions. Desalination by nuclear energy would cater to large demands.
A future world desalination strategy would therefore be a mix of technologies, depending upon the particular conditions of a given county or site. The need for alternative sources of water would be such that all solutions would play an important role.
1.5. HISTORICAL DEVELOPMENTS AND PREVIOUS EXPERIENCE OF NUCLEAR DESALINATION
Nuclear power has been used for five decades and has been one of the fastest growing energy options. By the end of 2004, there were 441 power reactors in operation worldwide, with a total installed capacity of 358 GWe. There were also 32 reactors under construction, with a total capacity of 27 GWe. In 2004, about 16% of the world electricity was generated by nuclear power. Although the rate
14

at which nuclear power has penetrated the world energy market has declined, it has retained a substantial share, and is expected to continue as a viable option well into the future.
Seawater desalination has also been growing very rapidly. By the end of 2003, the total contracted capacity of all desalination technologies was about 37.5 million m3/day (Figure 1), of which 60% was for desalting seawater. The normalized yearly addition of nuclear and desalination capacities show similarity in the trends of demand development for both nuclear and desalination technologies in the period 1960-2000 [1]. The demands for both technologies increased rapidly after the 1973 Arab-Israeli war that increased oil prices and reached their peaks just before the collapse of the oil prices in 1986 and the Chernobyl accident in the same year.
High oil prices then encouraged industrialized countries to rely on nuclear energy as a reliable and independent alternative source. At the same time increased financial resources of the oil exporting countries in the Middle East provided them with the means to acquire alternative source of potable water to augment their acute shortage of fresh water resources.
Subsequently, with the falling oil prices, annual demand for nuclear power and seawater desalination decreased. However, while this trend persisted for nuclear energy after the second Gulf War in 1991, it was reversed for seawater desalination. Nevertheless, both nuclear and desalination technologies are mature and proven, and are commercially available from a variety of suppliers. Therefore, there are benefits in combining the two technologies together. Oil prices have continually increased in recent years and the energy needs of many so called developing countries have nearly doubled. It also happens that most of these countries are suffering from water shortages. There is thus a renewed incentive to turn back to nuclear power for cogeneration plants, simultaneously providing water and electricity.
Since the completion of the Agency’s Options Identification Programme for Demonstration of Nuclear Desalination in 1996 and the International Symposium on Nuclear Desalination of Sea Water in 1997 in Korea, many Member States have taken steps to evaluate, plan, or in some cases, initiate nuclear desalination projects. In order to facilitate these activities, the Agency’s programme on nuclear desalination has gradually been shifting its focus from generic studies to specific needs-oriented activities in the form of co-ordinated research projects (CRPs) and technical cooperation (TC) projects.
Table 6 summarizes past experience as well as current developments and plans for nuclear-powered desalination based on different nuclear reactor types.
Japan now has over 150 reactor-years of nuclear powered desalination experience. Kazakhstan had accumulated 26 reactor-years before shutting down the Aktau fast reactor (BN-350) at the end of its lifetime in 1999.The experience gained with the Aktau reactor is unique as its desalination capacity was orders of magnitude higher than other facilities.
Most of the technologies in Table 8 are land-based, but the Table also includes a Russian initiative for barge-mounted floating desalination plants. Floating desalination plants could be especially attractive for responding to temporary demands for potable water.
15

TABLE 8. REACTOR TYPES AND DESALINATION PROCESSES
Reactor Type
Location Desalination Process
Status
LMFR Kazakhstan (Aktau) MED, MSF In service till 1999 Japan (Ohi, Takahama, Ikata, Genkai)
MED, MSF, RO
In service with operating experience of over 150 reactor-years.
Rep. of Korea Argentina, etc.
MED RO
Integral SMRs of the PWR type; under design or to be constructed
Russia MED, RO Under consideration (Barge mounted floating unit with the KLT-40)
PWRs
USA (Diabolo Canyon)
RO Operating
BWR Japan (Kashiwazaki-Kariva)
MSF Never in service following testing in 1980s, due to alternative freshwater sources; dismantled in 1999.
India (Kalpakkam) India (Trombay)
MSF/RO LT-MED
Under commissioning In service since 2004
HWR
Pakistan (KANUPP) MED Existing CANDU modified to be coupled to an MED plant (under construction)
NHR-200 China MED Dedicated heat only integral PWR; under design
HTRs France, The Netherlands, South Africa
MED, RO ANTARES, multipurpose reactor, GT-MHR and PBMR; under development and design
1.6. POTENTIAL OF NUCLEAR DESALINATION IN MEMBER STATES The following sections provide additional detail on the new developments in Member States, [3].
1.6.1. Techno-economic feasibility studies
• Argentina has identified a site for its small reactor (CAREM), which could be used for desalination. A related initiative on safety aspects of nuclear desalination addresses practical improvements and implementation and shares advances around the world.
• China has implemented and completed the feasibility study of .nuclear desalination project, using NHR-200 type of nuclear reactor, at an identified coastal Chinese site. A test system is being set up at INET (Institute of Nuclear and New Energy Technology, Tsinghua University, Beijing) for validating the thermal-hydraulic parameters of a multi-effect distillation process.
• Egypt has completed a feasibility study for a nuclear co-generation plant (electricity and water) at El-Dabaa. Construction of a pre-heat RO test facility at El Dabaa has been completed. The data generated will be shared with interested Member States.
• France has recently concluded several international collaborations: one with Libya designed to undertake a techno-economic feasibility study for a specific Libyan site and the adaptation of the Libyan experimental reactor at Tajoura into a nuclear desalination demonstration plant using both MED and RO processes in a hybrid combination. The other collaboration is with Morocco (The AMANE project) for a techno-economic feasibility study of Agadir and Laayoun sites. Under a bilateral collaboration signed between India and France, it has also
16

been agreed that the two partners will collaborate on the development of advanced calculation models, which will then be validated at Indian nuclear installations (the experimental reactor CIRUS and the Kalpakkam plant, with hybrid MSF-RO systems).
• Israel continues to regularly provide technical and economic information on low cost desalination technologies and their application to large-scale desalination plants.
• Japan continues with its operation of nuclear desalination facilities co-located inside many nuclear power plants.
• The Republic of Korea is proceeding with its SMART (System-integrated Modular Advanced Reactor) concept. The project is designed to produce 40 000 m3/day of potable water.
• Morocco continues the process of establishing an adequate legal and institutional legislative and regulatory nuclear framework while staying abreast of technical developments in general and nuclear desalination.
• Tunisia has completed its techno-economic feasibility study, in collaboration with France, for the la Skhira site in the southeast part of the country. The final report, presented in March 2005 was very favourably received by the Tunisian authorities who have already announced their willingness to go for the nuclear desalination option.
• USA will include in its Generation IV roadmap initiative a detailed discussion of potential nuclear energy products in recognition of the important role that future nuclear energy systems can play in producing fresh water.
• Further R&D activities are also underway in Indonesia and Saudi Arabia. In addition, interest has been expressed by Algeria, Brazil, Islamic Republic of Iran, Iraq, Italy, Jordan, Lebanon, Philippines, Syrian Arab Republic and United Arab Emirates in the potential for nuclear desalination in their countries or regions.
1.6.2. Nuclear desalination demonstration projects
• India is building a demonstration plant at Kalpakkam using a 6300 m3/day hybrid desalination system (MSF-RO) connected to an existing PHWR. The RO plant, with a production capacity of 1800 m3/day, was set up in 2002 and is since operating. The MSF plant (4500 m3/day) is to be commissioned in 2007. Already the CIRUS research reactor, providing waste-heat to a LT-MED plant, is operating since 2004. It is also planned to couple the forthcoming AHWR with a desalination unit.
• Libyan Arab Jamahiriya is considering, in collaboration with France, to use the Tajoura experimental reactor for nuclear desalination demonstration plant with a hybrid MED-RO system. The MED plant, of about 1000 m3/day production capacity, will be manufactured locally.
• Pakistan is constructing a 4800 m3/day MED thermal desalination plant coupled to a PHWR at Karachi. It is expected to be commissioned in 2007.
• The Republic of Korea is exploring a possibility of using a co-generating integral type reactor SMART combined with a multi-effect distillation (MED) plant producing 40 000 m3/day of fresh water. The basic design of 330 MW(th) SMART is completed. In parallel with out-pile tests, a one-fifth scale pilot plant SMART-P is being planned to construct along with a MED unit by 2008
• The Russian Federation continues its R&D activities in the use of small reactors for nuclear desalination and has invited partners to participate in an international nuclear desalination project based on a nuclear floating power unit (FPU) equipped with two KLT-40s reactors. The co-generation plant, foreseen for construction in 2006, will be sited at the shipyard in Severodvinsk, Arkhangelsk region in the western North Sea area where the FPU is being manufactured.
17

1.7. SAFETY CONSIDERATIONS The overall safety issues associated with an integrated nuclear desalination facility are primarily those associated with the nuclear plant itself [32]. Since these aspects are already taken care of in specific reactor safety studies, this section will only address those specific safety issues caused by the coupling between a reactor system and a desalination plant. These issues are related to:
• The potential for the transfer of radioactive materials from the nuclear plant to the desalination system during normal operation or as a result of an incident or accident. This issue involves an evaluation of the adequacy of the adopted containment-confinement boundaries in terms of number of barriers and their effectiveness.
• The potential for more severe reactor system transients induced by transients in the desalination plant, either during normal operation or as a result of an accident.
The safety impact of these issues is strongly dependent on the adopted coupling scheme. Safety verification was therefore made in the context of the EURODESAL project [7] for the coupling involving MED, RO and ROph processes. The Westinghouse AP-600 reactor was considered as the reference nuclear plant [8]. Conclusions are however applicable to other PWRs and reactor types. Similarly, the analysis deals with the case of backpressure coupling via PWR condensers. Again, the conclusions would be equally valid for an extraction coupling.
1.7.1. Safety barriers
The fact of coupling the nuclear reactor to any of the above mentioned processes does not reduce the number of safety barriers as compared to the standard nuclear plant configuration. Thus the usual barriers are maintained in all cases: fuel matrix, fuel cladding, primary circuit and the reactor containment system. In the case of coupling through the condenser, an additional safety barrier are the main condenser tubes.
In normal operation, the main condenser is at a lower pressure compared to its environment. There is thus no leakage of the secondary side steam outside the condenser.
Nevertheless, the integration of the nuclear plant with the desalination system can lead to a modification of the radioactive exposure pathways. This is due to the possibility that radioactive materials could be released to the potable water — and not to the sea or to the river — through the interface boundaries between the nuclear facility and the desalination system, e.g. main condenser or main condenser cooling water. Potential radioactive releases can be a consequence of normal operation routine releases — i.e. normal operating leakage at interface boundaries — or accidental events.
Radioactive releases to potable water can be prevented by a combination of design and operational provisions as discussed below.
• Leakages during normal operations can be precluded by assuring a leak-tight boundary and by maintaining a dynamic barrier, i.e. higher pressure on the process side (as compared to the reactor side) at the interface boundary for both the coupling schemes. In this case routine radioactive releases at the interface boundary are expected to be negligible. For MED coupling scheme, the dynamic barrier is obtained maintaining the cooling loop at higher pressure using a lamination valve, according to the scheme presented in Figure 4.
It is also important that the feed-water suction line be placed upstream of any waste liquid release discharge point located in the main condenser cooling water stream.
• In case of accident conditions at the nuclear plant which can result in an increase of the secondary side contamination or a loss of vacuum in the condenser — including condenser tube rupture — the desalination plant has to be put in shut-down condition in order to prevent a potential contamination of the potable water.
This protective action permits the “standard” exposure pathways associated with the reactor accident situations to be re-established.
18

• The water produced by the desalination system could be stored and monitored for radiological contamination before its distribution.
Figure 4. MED coupling with pressure reversal at the main condenser.
1.7.2. Transients and accidents induced by couplings
1.7.2.1. MED coupling The MED plant is normally coupled as by-pass to the main heat sink (river or sea). The partial or total unavailability of the MED system, which provides a redundant heat sink for the nuclear facility, could result in a partial or total loss of heat sink with consequent possible turbine trip and reactor trip [8]. This is analogous to a typical class 2 transient event in Safety Analysis.
Major causes of the transient are: • Loss of condenser vacuum. • Main condenser tube leakage. • Loss of re-circulating cooling water flow; this cause is usually negligible due to component
redundancies (pumps and electrical power) provided in the main condenser cooling water system.
The transient induced by the unavailability of the desalination plant is not expected to be more severe than the analysed transient. However, the transient frequency could change as a consequence of the connection with the desalination plant.
Two effects on transient frequency are anticipated:
• The cooling loop can process highly salted cooling water or salt free cooling water according to the scheme adopted. It should be recalled that the salt content in the cooling water can increase the erosion-corrosion problems at the main condenser tubes with consequent increase of the frequency of condenser leakage or pipe break events. A choice of appropriate material can avoid corrosion problems in the condenser tubes but would slightly increase costs.
• The desalination plant is a more complex system compared with a typical main condenser cooling circuit; this characteristic can increase the frequency of the loss of heat sink transient due to a failure in the desalination facility.
The change in the event frequency may affect the Plant Design Transients and the Probabilistic Risk Assessment (PRA) results (Initiating Event Frequencies). On the contrary, the accident analysis event categorization does not change because the transient is already classified as a frequent abnormal event (class 2 Event).
19

The impact on Plant Design Transients — reference transients for system component mechanical design - essentially depends on the transient’s frequency to be assumed in component design. The AP-600 standard design considers two reactor trips per year (from all causes) with the reactor at full power.
The frequency of the loss of condenser initiating event (IE) — from all causes — as assumed in the AP-600 PRA, is equal to 0.112 events per year. The IE results in a reactor trip produced by the loss of the plant normal heat sink due to a Loss of Condenser Vacuum (dominant cause) or a condenser leakage event.
The value assumed in the PRA is consistent with PWR values reported in the NRC document NUREG CR3862 as shown in Table 9:
TABLE 9. TRANSIENT FREQUENCIES IN PWRS
Transient EPRI-PWR Transient Category Frequency (event/year)
Loss of Condenser Vacuum (Causes: hardware failure or human Errors)
25 0.14
Condenser Leakage 27 0.04
On the basis of the above, it is reasonable to limit the reactor trip due to MED unavailability to 0.1 events per year, i.e. equivalent to the frequency of the dominant cause (loss of condenser vacuum). In this manner the overall frequency of a reactor trip due to a loss of condenser heat sink will be roughly doubled (floss of condenser = 0.2 event/year).
floss of condenser = floss of condenser vacuum + fMEDunavailability + fCondenser tube leakage In order to achieve the 0.1 event/year goal and possibly further reducing it, the MED coupling scheme has to cope with the following two design requirements:
• Transportation pipeline from nuclear site to MED site should carry water instead of steam.
Transportation of steam at a temperature below 100°C requires a large diameter pipeline maintained at a significant sub-atmospheric pressure. This solution reduces the overall availability of the MED system and renders the achievement of the transient frequency goal more difficult.
The proposed solution is to transport cooling water from the nuclear site to the flash tank located at the MED system site (Figure 5).
• Modular MED plant system
The MED plant should include sufficient number of modules (typically 10-11) to ensure that a loss (unavailability) of one module — due to a planned shutdown or an accident event — does not induce a reactor trip but only a load reduction acceptable for the nuclear plant (acceptable load reduction ≤10%).
Each module should integrate its own steam feeding system, i.e. lamination valve and flask tank. In this case, a loss of vacuum in a module would not result in a reactor trip.
This requirement is consistent with the present technology which is based on standardised modular plant.
The scheme in Figure 5 shows how the coupling configuration can be modified to satisfy the above stated requirements.
20
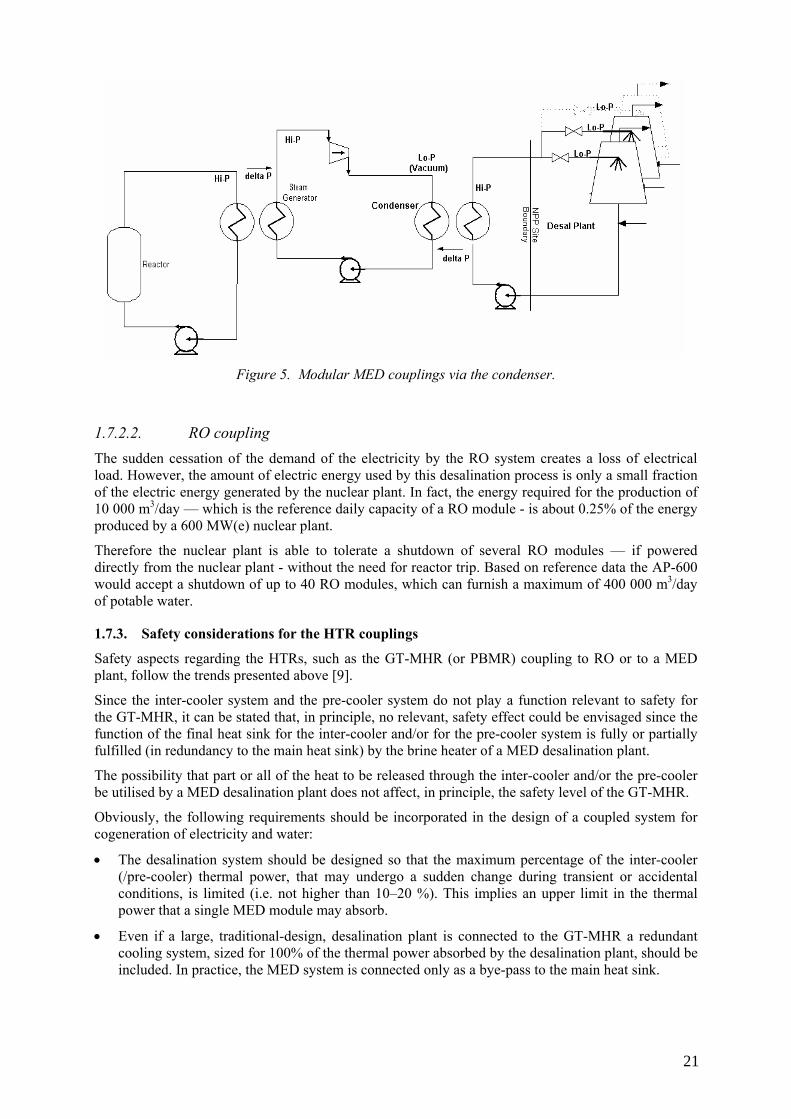
Figure 5. Modular MED couplings via the condenser.
1.7.2.2. RO coupling The sudden cessation of the demand of the electricity by the RO system creates a loss of electrical load. However, the amount of electric energy used by this desalination process is only a small fraction of the electric energy generated by the nuclear plant. In fact, the energy required for the production of 10 000 m3/day — which is the reference daily capacity of a RO module - is about 0.25% of the energy produced by a 600 MW(e) nuclear plant.
Therefore the nuclear plant is able to tolerate a shutdown of several RO modules — if powered directly from the nuclear plant - without the need for reactor trip. Based on reference data the AP-600 would accept a shutdown of up to 40 RO modules, which can furnish a maximum of 400 000 m3/day of potable water.
1.7.3. Safety considerations for the HTR couplings
Safety aspects regarding the HTRs, such as the GT-MHR (or PBMR) coupling to RO or to a MED plant, follow the trends presented above [9].
Since the inter-cooler system and the pre-cooler system do not play a function relevant to safety for the GT-MHR, it can be stated that, in principle, no relevant, safety effect could be envisaged since the function of the final heat sink for the inter-cooler and/or for the pre-cooler system is fully or partially fulfilled (in redundancy to the main heat sink) by the brine heater of a MED desalination plant.
The possibility that part or all of the heat to be released through the inter-cooler and/or the pre-cooler be utilised by a MED desalination plant does not affect, in principle, the safety level of the GT-MHR.
Obviously, the following requirements should be incorporated in the design of a coupled system for cogeneration of electricity and water:
• The desalination system should be designed so that the maximum percentage of the inter-cooler (/pre-cooler) thermal power, that may undergo a sudden change during transient or accidental conditions, is limited (i.e. not higher than 10–20 %). This implies an upper limit in the thermal power that a single MED module may absorb.
• Even if a large, traditional-design, desalination plant is connected to the GT-MHR a redundant cooling system, sized for 100% of the thermal power absorbed by the desalination plant, should be included. In practice, the MED system is connected only as a bye-pass to the main heat sink.
21

• The size of the additional, back-up cooling system could be reduced in the case of a high-reliability design of the MED plant. However, since the design standards of current MED systems are not comparable with the nuclear power plant design standards, it does not seem economically logical to interfere with the design criteria of the MED plant. A redundancy of the final heat sink appears therefore to be more suitable.
1.7.4. Radiological protection of users of the desalination plant, coupled to HTRs
In this regard, it should be recalled that a final safety analysis of new generation HTRs, such as the GT-MHR plant, has not yet been carried out and no information is available in the published literature on the radiological impact of such a plant on the surrounding environment.
Nevertheless if one refers to the results of the analysis carried out by DOE for a MHTGR, no special hazard can be recognised, especially if one takes into account the differences in the features of GT-MHR with respect to MHTGRs. Therefore, no special limitation for the coupling of a desalination plant with a GT-MHR may be envisaged.
A second issue concerns the possible release of radioactivity from the GT-MHR to the desalination plant, through the coupling itself between the two plants.
In the case of a GT-MHR being cooled totally or partially by a MED desalination plant, there is a physical interface between the two plants and a path for possible radioactive migration may be identified.
The pressure of the inter-cooler/pre-cooler circuit must be as low as possible in order to limit the introduction of water into the helium filled vessels in accidental scenarios. Furthermore, the intermediate circuit would utilise the pressure reversal principle. This is a positive feature in the view of creating dynamic barriers to the migration of radioactive materials towards the desalination plant.
Fast-closing fail-safe valves will have to guarantee the closure of the loop in case of radioactivity monitored within it.
Additional analysis and research is required regarding:
• Suitable design of the circuits connecting functionally the inter-cooler/pre-cooler circuits and the MED plant. At least one intermediate, high pressure, loop should be foreseen between the inter-cooler/pre-cooler systems and the MED plant, operating at a pressure both higher than the pressure of the inter-cooler/pre-cooler circuits and higher than the pressure in the first effect of the MED plant.
• Migration of tritium through metallic containment boundaries and the study of systems/devices able to avoid totally the contamination of desalted water because of tritium migration.
22

2. THE ECONOMICS OF NUCLEAR DESALINATION
2.1. GENERAL PRINCIPLES There are no specific nuclear reactors for desalination. Any reactors, capable of providing electrical and/or thermal energy can be coupled to an appropriate desalination process. These reactors can operate as dedicated (or single purpose) systems, producing only desalted water or as co-generation (or dual purpose) systems, producing both water and electricity.
Single purpose nuclear desalination systems are considered more suitable for remote, isolated regions.
The fundamental role of the economic evaluation of any engineering project is to enable coherent and just comparisons with alternative options, to prepare the financing details for the implementation of the project, to fix tariffs and finally to furnish a clear choice of options to decision makers.
There are several factors which affect desalination costs and thus determine the successful implementation of desalination systems, using nuclear or other energies. These factors include [10]:
• Site characteristics: The main parameters at a given site are the availability of adequate land and its proximity to the water source and of the concentrated brine discharge locations. The geological nature of the terrain may also be a factor influencing pumping costs and the costs of pipe installations. Yet another factor influencing land cost could be the local regulatory requirements and the costs associated with the acquisition of permits etc.
• Plant capacity: This is an important design factor in that according to the size effect law, the desalted water costs is reduced as plant capacity is increased, even though large capacity plants require high initial investment, larger sizes of treatment units, pumps, water storage tanks and water distribution systems. Generally, these effects are offset by the modularity of the system and economy of scale.
• Feed-water quality: it is obvious that the lower the salinity (TDS) of the feed-water, the lower would be the energy consumption of the system. Low TDS would also lead to high conversion rates and less dosing of antiscalant chemicals. Similarly, the pre-treatment of surface waters (e.g. tidal waters) will be more costly as compared to brackish ground water or water from beach-wells.
2.1.1. Cost evaluation
The cost economics of single purpose nuclear (or fossil fuelled) desalination plants can be evaluated and compared, using the well-known constant money, levelized cost methodology. This methodology is described in detail in IAEA-TECDOC-666 (1992) but some of the general economic principles can be recalled here briefly:
Generally, it is supposed that the implementation of the electricity generating plant (or the nuclear desalination plant, for example) takes place in two stages:
The first stage, construction, occupies “M” time periods to plan, construct, test, and start-up the electricity generating plant, (Figure 6). The second stage, operations, lasts for “N” time periods, referred to as the operating life of the project7.
7 web.mit.edu/1.149/www/lecture04/lec04notes.doc.
23

Time period: n = 1,2, ...,M n = 1, 2, ... N
Construction stage Operation stage
Figure 6. The two stage model for determining the real, levelized costs.
The construction stage: It is assumed that C(m) dollars are expended in time period “m”. A useful measure of construction expense is the “overnight capital cost”, the sum total of direct expenditures during the construction phase, i.e., without including interest charges on funds borrowed to build the plant. This quantity, denoted Iovernight, is just
Iovernight 0( )= C(m)
m=1
M
∑ .
It is referred to as the overnight cost because it can be thought of as the amount of money that would be required to build the plant if the construction could be done instantaneously, or “overnight”, i.e., without incurring any interest during construction. Note that in this calculation – and in the discussion to follow –no inflation will be assumed.
In most methodologies, the construction cost of a desalination plant, for example, is the sum of the direct and indirect costs:
Direct costs include:
• Land and site permit cost, which depend on the local site characteristics and plant ownership (public or private).
• Cost of production wells, which depends on plant capacity and well depth.
• Surface water intake structure cost, which also depends on plant capacity and local environmental regulations.
• Process equipment cost, including the cost of water treatment units, of the instrumentation and control systems, of the pre- and post-treatment systems and of the cleaning systems.
• Auxiliary equipment cost, which includes the cost of open water intakes, of wells and storage tanks, of generators, transformers, pumps, pipes, valves, electricity etc.
• Cost of building offices, control room, laboratories, workshops and other structures.
Indirect costs are mainly the costs of:
• Freight and insurance, which is typically 5% of the total direct costs.
• Construction overheads, which include labour costs, fringe benefits, field supervision, temporary facilities, construction equipment, small tools, contractor’s profits and miscellaneous expenses. Typically this cost is about 15% of the direct material and labour costs.
• Owner’s cost, representing the costs of land acquisition, engineering and design, contract administration, commissioning and legal fees etc.
• Contingency cost, representing from 4 to 10% of the total direct costs.
The capitalized construction cost, I, at the beginning of operation takes into account the accumulated interest during construction. It is understood that the construction is financed by a mixture of debt and
24

equity, and that the ratio of debt to equity remains constant during the construction period. It is assumed further that the required rate of return for both debt and equity is constant during this period. If the rate of return on debt is rb, the rate of return on equity is re, and the ratio of debt to total capital is f, then the capitalized cost of the debt component of the investment at the start of plant operation will be given by:
L(0) = fCm (1+ rb )M−m
m=1
M
∑
and the capitalized cost of the equity component by:
E(0) = (1− f) Cm
m=1
M
∑ (1+ re )M−m
The investment cost is the sum of construction costs and interest during construction.
Operation Phase: During the operation phase, the project will either make money or lose money. The outcome depends upon the balance of revenues and costs during this phase.
Revenue: The revenue, R(n), received by the owners of the generating plant in time period n is equal to the amount of electricity, Q(n), produced in that period times the price of the electricity, p(n), during that period:
(kWe/MWe)1000 K(MWe)CF(n) (hrs/day)24 (days/yr)365 hrs/yr) Q(n) (kWe ($/cent)10hr)s/kWep(n) (centhr/yr)Q(n) (kWe)R(n) ($/yr 2
××××=
××= −
...
In these equations K is the rated capacity (in MW(e)) of the plant and CF(n) is the capacity factor of the plant in time period n. For simplicity, we take the capacity factor as constant and hence:
Q(n) (kWe-hrs/yr) = CF x K(MW(e)) x 8,760 x 103
The revenue stream should cover the following:
• Fuel costs.
• Operations and maintenance (O&M) costs.
• Taxes.,
• Interest payments and principal repayments on the debt.
• Return on equity.
Fuel cost: The fuel cost in year n is expressed as
Cfuel(n) = Q(n) cfuel(n),
where cfuel (n) is the fuel (or fuel cycle) cost expressed in $/kW(e).hr in year n.
O&M cost: The O&M cost in year n is expressed as
CO&M (n) = Q(n) cO&M(n),
where CO&M(n) is the unit O&M cost expressed in $/kW(e).hr.
In reality O&M has both a fixed and a variable part. Fixed costs include mainly the insurance and amortizing costs. Insurance cost is about 0.5 % of the total investment costs.
25

Amortization compensates for the annual interest payments for direct and indirect costs and thus depends on the interest rate and life time of the plant. Amortization rate is typically 5 to 10%.
Variable costs, which are site and plant specific, include the cost of labour, energy, chemicals and maintenance.
In most methodologies fixed and variable parts are lumped into a single category for simplicity’s sake.
Interest and principal payments on the debt: It is assumed that the debt has a term of ND years and is serviced in equal annual instalments, q. The annual debt service payment q includes both an interest component and a partial retirement of the outstanding principal. We assume that the loan payment is made at the end of the year. Let the amount of principal outstanding at the beginning of year n be L(n). Thus
q = rbL(n) + L(n) - L(n+1).
The proportions of interest and principal repayments in the annual loan payment vary over the life of the loan.
The most useful parameter to assess the economics of a given single purpose system, comprising of an energy source and a desalination system is that of the life-time levelized unit cost of the desalted water produced, expressed in $/m3.
This levelized desalination cost is the ratio of the sum of all the annual expenses related to the production of water (or annual required revenue) and the total amount of water produced per year.
The methodology to determine the above values is similar to that used for the determination of energy(electricity) production cost. However, determining the water costs for dual purpose systems, with two products: water and electricity is relatively more complex since it requires an a priori knowledge of the allocation of benefits of at least one product to the other.
Several methodologies have thus been evolved to permit this allocation in a representative manner. These methodologies are discussed in detail in [11]. Only the most commonly used methodologies will, therefore, be briefly recalled here.
2.2. COST EVALUATION METHODS
2.2.1. The power credit method
A value for the generation amounts by the dual-purpose plant is the key point of this method. This value, that is, power credit, can be varied according to the principles of evaluating the power cost. In actual cases, power credit is calculated on the basis of the least-cost alternative, i.e. the least cost of producing the same amount of electricity in a power-only plant. In the following paragraph, it is shown that the amounts of power credit can be varied by the power unit cost to be adopted.
The power credit method of cost allocation first determines the cost of one product (e.g. heat or electricity) based on the cost of that product from an alternative method (an existing or imaginary single purpose plant for example). Using this value as an upper limit to the cost of the selected product, in the dual-purpose system, the cost of the second product is obtained by crediting the product with all the economic benefits of the first product.
In the single purpose plant, the levelized cost of energy is the discounted cost of all expenditures associated with the design, construction, operation, maintenance, fuel cycle costs divided by the discounted values of the quantities of energy produced.
Water cost is similarly obtained by charging to water all water plant investments (plus energy production costs) and dividing by total water production.
In the power credit method, the energy cost is set to be the cost obtained from an imaginary single purpose power plant, generating net energy E with total expenses, C.
One can thus determine the net levelized power cost, CkWh = C/E
26

One then calculate the amounts of desalted water (W) and the net saleable power E2 produced by the plant at a total expense C2. (E2 < E; C2>C).
Then the desalted water is credited by the net Saleable Power Cost = C2 - E2* CkWh
And the water cost is obtained by
Cwater = (C2 - E2* CkWh)/W.
2.2.2. Water credit method
Contrary to the power credit method, the principle of water credit is to evaluate a water value produced and to determine the cost of the power generation by difference. The water credit depends on the water cost, Cwater to be adopted:
Using the water cost of the optimum single-purpose desalination plant producing the same amount of water as the dual-purpose plant:
Water credit = Cwater x Ewater
The whole benefit of co-production is then assigned to the cost of electricity.
2.2.3. The exergy method
Apart from a few exceptions (e.g. China), a majority of the Member States is, or has been, studying dual-purpose (cogeneration) plants in which the electricity production dominates by far the water production. In such cases, the use of the power credit method would appear to be quite appropriate.
However, the power credit or other cost allocating methods implicitly contain the seeds of arbitrariness. These include:
• Difficulties in accurately determining equivalent cost of a single purpose plant.
• Distortion of either of the outputs by local market conditions (direct or hidden subventions, disproportional profits, arbitrary taxing conditions etc.)
• The very fact that the benefit of one product is arbitrarily allocated to the other, whereas ideally both the products should benefit from each other.
• The practical difficulty in extending the power (or water) credit methods to yet another third product (e.g. the benefits from the extraction of useful materials from the concentrated brine rejected by desalination plants; Section 4.5).
In the cost allocation methods for an integrated plant, the overall expenditure C0 can be expressed as a linear function of the annual electricity output, Ea (e.g. kWh) and the annual water production, W (e.g. m3/year). We thus have,
WCECC waE ×+×=0 (1)
27

Equation (1) is graphically represented by the Figure 7. The slope of the line is a direct function of the water to power ratio.
Figure 7. Allocation of overall expenditures in an integrated desalination system.
Obviously, if all the benefits of the combined production are assigned to the cost of water, without penalising electricity production (power credit method using generation cost of electricity from the imaginary single purpose plant), then the situation on the curve will be represented by the point A.
The point B can similarly be placed on the curve by supposing that all benefits from water go to electricity production. The points on the curve outside the segment AB will represent some form of subsidization of either water or electricity.
The real situation would be one corresponding to the point E, in which the combined benefits are allocated to both products in an equitable manner. This is the main objective of the exergy method.
In this method, the real maximum achievable energy (exergy) is calculated from the thermodynamic principles for each part of the integrated plant. Assessment is then done to determine the quality of energy and hence the useful work done by each product, which then enables the respective allocations in a more accurate manner.
Exergy principle has been used in the past for integrated desalination system cost evaluations [11]. It is currently being integrated in DEEP-3 by CEA, France.
2.3. TECHNO-ECONOMIC CONSIDERATIONS OF COGENERATION The selection of power plant and desalination plant combinations for cogeneration (simultaneous production of power and water) depends on several factors, of which the most important one is the water-to-power ratio (W/P), defined as the ratio of the total water production capacity (m3/day), and the MW(e) of the power produced.
The other factors include the desalination plant’s energy consumption, power plant’s specific fuel consumption, the effect of seasonal loads and the specific investment costs of the water and power plants.
Typical W/P ratios for various combinations are given in Table 10:
28

TABLE 10. TYPICAL W/P RATIOS FOR VARIOUS COMBINATIONS
Technology Water to power ratio (W/P)
Backpressure steam turbine + MED 1140
Backpressure steam turbine + MSF 800
Extraction steam turbine + MED 570
Extraction steam turbine + MSF 400
Gas turbine, with heat recovery steam generator + MED 670
Gas turbine, with heat recovery steam generator + MSF 500
Backpressure combined cycle + MED 400
Backpressure combined cycle + MSF 250
Extraction combined cycle + MED 330
Extraction combined cycle + MSF 210
RO (using electric power only) 2700 – 5000
The values of the W/P ratios given in Table 8 can also be roughly applied to nuclear desalination systems because most of the couplings are not unique to nuclear and only steam and electricity for a specific coupled desalination scheme need to be considered.
As Table 8 clearly shows, the largest possible values of W/P are obtained from backpressure turbine. The overall arrangement of the coupled system, however, also depends on the required operational flexibility and the net process efficiency.
The two main steam cycles considered nowadays for coupling with a nuclear reactor (or any other power plant) are the backpressure turbine and the extracting/condensing turbine.
In the backpressure scheme, steam is completely expanded in the turbine to a desired elevated backpressure (e.g. 0.34 bar for LT-MED and 3 bar for MSF) before being fed to a thermal desalination plant. This option requires relatively low investment and has an inherently higher efficiency. Since W/P is fixed once the design of the power plant is finalized, the load variations in both the power and water plants have to be carefully assessed and optimised for specific customer needs.
It follows that in the hybrid plant (e.g. MED/RO), the MED plant should be operated at the highest possible load to make use of the constantly available steam from the power plant. As power demands fluctuate, the RO plant load can be varied to increase overall power demand, to increase the steam flow to the MED plant and, thus, to improve overall economics of the nuclear desalination complex.
In the extracting /condensing steam turbine cycle the steam, needed for the thermal desalination plant, is extracted from extraction ports along the turbine. This configuration allows the turbine to operate continuously in order to supply steam to the thermal plant. However, the low-pressure end of the turbine (near exhaust) will be partially idled during periods of low power demand and reduced steam supply from the power plant. This turbine option allows for the variations of W/P as needed. However, it does require a larger capital investment due to additional condensing section of the turbine. In addition, the overall efficiency is decreased with high water production and low flow of steam to the low-pressure/condensing sections.
29

Yet another turbine coupling scheme includes the coupling of a PWR with a thermal desalination plant using a backpressure turbine and a low-pressure turbine in parallel, (Figure 8). In this arrangement, the conditions of the exhaust steam of the backpressure turbine (mass flow rate, temperature and pressure) are adjusted to the steam requirements of the thermal desalination plant. An increase in the performance ratio of the MED plant, for example, will decrease the size of the backpressure turbine, but will increase the size of the low-pressure condensing turbine.
Figure 8. Coupling scheme with backpressure and low-pressure turbines in parallel.
The choice of the turbine coupling to the desalination plant is indeed very site-specific and should be assessed in view of the real local W/P ratio and its potential variations with time. Past experience in the cogeneration operations leads to conclude that in general backpressure turbine scheme is more economical.
2.4. THE IAEA DESALINATION ECONOMIC EVALUATION PROGRAMME (DEEP)
2.4.1. Historical background DEEP is derived from desalination cost evaluation package developed in the eighties by General Atomics on behalf of the IAEA. This version, named "Co-generation and Desalination Economic Evaluation" Spreadsheet, CDEE) was used in the IAEA and other Member States’ feasibility studies for nuclear desalination. Subsequently, with its increasing popularity, a user-friendly version was issued by the Agency towards the end of 1998 under the name of DEEP. Through the next years the software was updated constantly within DEEP-1 family (versions 1.0, 1.1, 1.2 and working version 1.7). Both the user interface and model structure were further developed and in 2000 a new upgrade – first version from the DEEP-2 family was released. Its salient feature was the complete modularization of various cases. As the user group enlarged, new ideas as well as criticisms of the DEEP models appeared. Some of them were implemented gradually in different working versions (versions 2.0, 2.1, 2.2, 2.3, 2.4, 2.6). The four year period of continuous development culminated in the development of DEEP 3.0, released in August 2005.
2.4.2. General structure of DEEP application
DEEP package consists of several parts, which are implemented as EXCEL files.
30

The tool separates the performance and cost calculations called “case” on one side and the support for data input and change and output presentation on the other side. As a by-product, the interface between these two parts is defined so that the future development of the whole package may be performed by independent developers and new cases might be incorporated into DEEP. An example of file structure is given in Figure 7. DEEP provides a user-friendly interface when working with a single case, changing input data and browsing in the output sheets as well as when comparing variations with different input parameters. DEEP is particularly developed with a typical user, without much knowledge of the technical features of the models used for evaluation.
2.4.2.1. Case File The desalination technology performance and economic evaluation calculations are made inside an Excel file. This file contains all input values, all calculations and consequently all result values. It means that this file (Case File) represents a complete mathematical model of an examined case. The “Sample Case.xls" is provided as an example for beginners and is placed in the directory of C:\Deep\Cases. In this directory user defined (generated) cases will be stored later (default option). The user can group cases into projects. The names of these projects may be identical with names of DEEP project directories, e.g. C:\Deep\Cases\ Project Name 1, but at the moment the user friendly support for project feature is not yet implemented.
2.4.2.2. Comparative Presentation (CP) File The user can select several cases and a comparison table is made automatically based on the selected cases. This table is then stored as a usual EXCEL file within one worksheet. This sheet is named “CP" and it contains values from selected cases. The file “Sample CP.xls" is provided as an example for beginners and is placed in the directory of C:\Deep\CPs. Here will be primarily other Comparative Presentations (created by DEEP users) stored later. However, there are some new DEEP software features, which are convenient for upgrade (e.g. a possibility to add an opened case to the CP and a possibility to open more than one case at one moment – e.g. all ones from the CP), but this is a subject for future decision and planning.
Desalination plant models, data & formulas Definitions of groups (of cases) for comparison
Figure 9. General Architecture of DEEP.
31

2.4.2.3. Control File The third type of EXCEL files used in DEEP-3 package is a single copy of “DEEP-3.XLS" file stored in the directory of C:\Deep3. This file contains the user-friendly interface, which helps the user to work more comfortably. It helps the user to create and maintain Cases and Comparative Presentations. Both user types of EXCEL files - “Calc" and “CP" sheets are inside DEEP-3.XLS provided with set of predefined graphs, which are updated according values in selected cases. New cases are generated using the knowledge basis imbedded in the DEEP-3 package in the Templates directory. Using the New case and New case by modification commands the user can easily generate many cases which differ only in some input data values.
The main DEEP design principle was to keep all the EXCEL functions available for the user and to leave the calculation spreadsheet open for user changes. However, this openness is contradictory to the user friendliness. This fact poses quite large burden on DEEP developers and on advanced users who wish to make changes and improvements within a predefined Excel environment on their own – because they have to know each of even very subtle details In both Excel and VBA implementation.
DEEP and its subsequent versions are freely available from the IAEA, at the nuclear desalination website (www.iaea.org/nucleardesalination), under a license agreement. Its user manual provides all the details for installing and running DEEP cases.
2.4.3. Scope of DEEP
The DEEP main calculation sheet supports both nuclear and fossil power options, it considers heating and power plants as well as heat-only plants, distillation processes MSF and MED and membrane process reverse osmosis. Table 11 shows the options considered for energy sources. TABLE 11. THE VARIOUS ENERGY OPTIONS AVAILABLE IN DEEP
Energy source Description Plant type Nuclear Pressurised light water reactor
(PWR) Co-generation plant
Nuclear Pressurised heavy water reactor (PHWR)
Co-generation plant
Fossil - coal Superheated steam boiler (SSBC) Co-generation plant Fossil - oil/gas Superheated steam boiler ((SSBOG) Co-generation plant
Fossil Open cycle gas turbine (GT) Co-generation plant Fossil Combined cycle (CC) Co-generation plant Nuclear Heat only reactor: steam or hot
water, (HR) Heat-only plant
Fossil Boiler: steam or hot water, (B) Heat-only plant Nuclear Gas turbine modular helium reactor
(GT-MHR) Power plant
Fossil Diesel (D) Power plant Nuclear Small PWR (SPWR) Co-generation plant
The commercially established desalination processes included in DEEP are presented in Table 12:
32

TABLE 12. THE DESALINATION PROCESSES CONSIDERED IN DEEP
Process Description Distillation Multi-Effect Distillation (MED) Multi-Stage Flash (MSF) Membrane Stand-Alone Reverse Osmosis (SA-RO) Contiguous Reverse Osmosis (C-RO) Hybrid Multi-Effect Distillation with Reverse Osmosis
(MED/RO) Multi-Stage Flash with Reverse Osmosis (MSF/RO)
2.4.4. New developments in DEEP
The DEEP-3 version includes improved performance and cost models for both thermal and reverse osmosis (RO) systems, as well as an improved program structure and user interface, [12].
The thermal performance model changes include a revision of the Gain Output Ratio (GOR) calculation and its generalization to include thermal vapour compression effects in conjunction with Multi Effect Distillation (MED) or Multi-Stage Flashing (MSF) units. Since energy costs continue to represent an important fraction of seawater desalination costs, the lost shaft work model has been generalized to properly account for both backpressure and extraction systems. In addition, improved estimates of feed make-up and re-circulation flows in the new version allow a more accurate calculation of pumping power requirements.
For RO systems, changes include improved modelling of system recovery, feed pressure and permeate salinity, taking into account temperature, feed salinity and fouling correction factors. In order to be able to accommodate continuing design improvements in energy recovery systems, the energy recovery fraction is left to the designer as an input parameter.
2.4.4.1 Thermal performance model The flow chart for this model is shown in Fig. 10.
Figure 10. DEEP-3 thermal performance model.
A GOR Model
In the DEEP-3 model, the top brine temperature Ttbt is retained as a design parameter and as such, can be input by the user or alternatively, calculated given an input steam temperature as follows:
Ttbt = Tsteam - ΔT approach (1)
For the case of thermal vapour compression units coupled to MED or MSF systems, the GOR model is generalized as follows:
GOR Calculation
Flow/Pumping Power Calculations
Lost Shaft Work
GOR Calculation
Flow/Pumping Power Calculations
Lost Shaft Work
33

GORtvc = GOR(1+Rtvc) (2)
Where Rtvc is defined as the ratio of entrained vapour flow to motive steam flow, an input design parameter..
Once the GOR is known, the required steam flow could be calculated in a straightforward manner.
Given as input the salt concentration factor CF, the cooling seawater temperature gain ΔTc and the produced distillate flow Wd, estimates for reject brine flow Wb , make-up feed flow Wf and condenser cooling water flow Wc, could also be calculated as follows,
Wb = Wd / (CF-1) (3)
Wf = CF.Wb (4)
Wc= Qc / (CcΔTc) (5)
Where Qc refers to the final condenser heat load and Cc refers to the specific heat capacity of cooling water. Pumping powers can then be easily calculated.
While specific heat transfer areas could also be calculated in DEEP in a straightforward manner, the current approach where user input is expected for specific capital costs ($/m3/day) is considered adequate for the purposes of DEEP, and is therefore retained. The new version allows values for top brine temperature, steam temperature and GOR parameters to be specified by the user, or alternatively, calculated by DEEP.
B Lost Shaft Work Model
In previous versions of DEEP, the lost shaft work was only calculated for a backpressure configuration, and the lost shaft work for thermally- coupled units, was calculated as follows:
Qls = (Qcr/(1-η)).η (6)
Where Qcr refers to the condenser heat load,
η =ηlpt .(Tcm-Tc)/(Tcm + 273) (7)
Where, ηlpt refers to low pressure turbine isentropic efficiency, and Tc and Tcm refer to the condenser reference and modified temperatures in °C.
In order to properly account for steam extraction cases, equations (6) and (7) are replaced by the following equations:
For the backpressure case,
Qls = (Qst /(1-η)).η (8)
With Qst = Qcr
For the extraction case,
Qls = Qst.η (9)
With Qst = Wst.hfg Where hfg is the steam latent heat in J/Kg, assuming saturation conditions and η is redefined as,
η =ηlpt .(Tst-Tc)/(Tst + 273) (10)
Where Tst = Textracted steam in °C
34

Note that the cases involving available waste heat, such as gas cooled reactors correspond to a backpressure configuration with,
Tcm = Tc, and Qls = 0
Which implies free available heat and no lost shaft work.
2.4.4.2 RO performance model The flow chart for the Reverse Osmosis (RO) model is shown in Figure 11.
Figure 11. DEEP-3 RO performance model.
Here, again, the user can either specify the system recovery ratio, or have it estimated by DEEP, as follows:
R = 1 – C. Sf (11)
Where
Sf refers to the feed salinity in ppm and C is a constant defined as
C = 1.15E-3/Pmax (12)
Pmax refers to the maximum design pressure of the membrane in bars.
Note that as feed salinity becomes small, the recovery ratio approaches unity and as it approaches the numerical equivalent of maximum membrane pressure (in millibars), recovery goes to zero, as would be expected in practice.
For permeate salinity and feed pressure, the expressions given by Wilf [13] is used. They take into account the feed temperature and salinity correction factors and have been verified against commercial design code data.
The feed pressure Pf is calculated as follows:
Pf = Δpd + Posm + Δpl (13)
Where
Δpd = φd / φn. Δpn.ct.cs.cf (14)
And Posm is the average osmotic pressure across the system; Δpl is the corresponding pressure loss; Δpd and φd are the design net driving pressure and flux; Δpn and φn are the nominal net driving pressure and flux; and ct, cs and cf are correction factors related to temperature, salinity and fouling. Permeate salinity Sp on the other hand, is calculated as follows:
Recovery ratio estimate
Product flow & quality estimate
Feed flow & pressure estimate
Pumping power requirements
Recovery ratio estimate
Product flow & quality estimate
Feed flow & pressure estimate
Pumping power requirements
35

Sp = (1-rm). Sf. φn / φd. c΄r. c΄t (15)
Where Sf refers to feed salinity; and c΄r and c΄t are correction factors related to recovery and temperature. rm refers to the membrane salt reject fraction.
For the calculation of energy recovery, previous versions of DEEP considered only the Pelton wheel design. With the emergence of various new technologies such as pressure and work exchangers, and the design variations involved, the energy recovery fraction is introduced as an input design parameter, to properly account for pumping power savings.
2.5. OTHER METHODS OF DESALINATION COST EVALUATION DEEP employs the power credit method for desalination costs after an initial power cost calculation, based on the levelized cost methodology.
Two of the participating Member States (India and USA) have used their own methods, using standard mathematical relationships between the various parameters as well as verified semi-empirical correlations. They are essentially similar and summarised in Figures 12a and 12b:
.
Figure 12a. Logical sequence of BARC method.
Ir = Rate of interest; Dr = Rate of depreciation; Cap = Plant capacity, m3/day; Dyr = No. of days of operation in a year.
Interest, I = CC x Ir/100
Depreciation, D = CC x Dr/100
Fixed Cost, FC= (I+D)/ ACap
Annual Water Production, ACap = Cap x Dyr
Operating Cost, OC = (Annual Costs of ( power + chemicals + spares + cartridge & membrane replacement + labour)) / ACap
Water cost, WC = FC + OC
Capital Cost, CC
Operating Cost, OC = (Annual Costs of ( power + chemicals + spares + steam (in terms of power loss) + labour)) / ACap
36
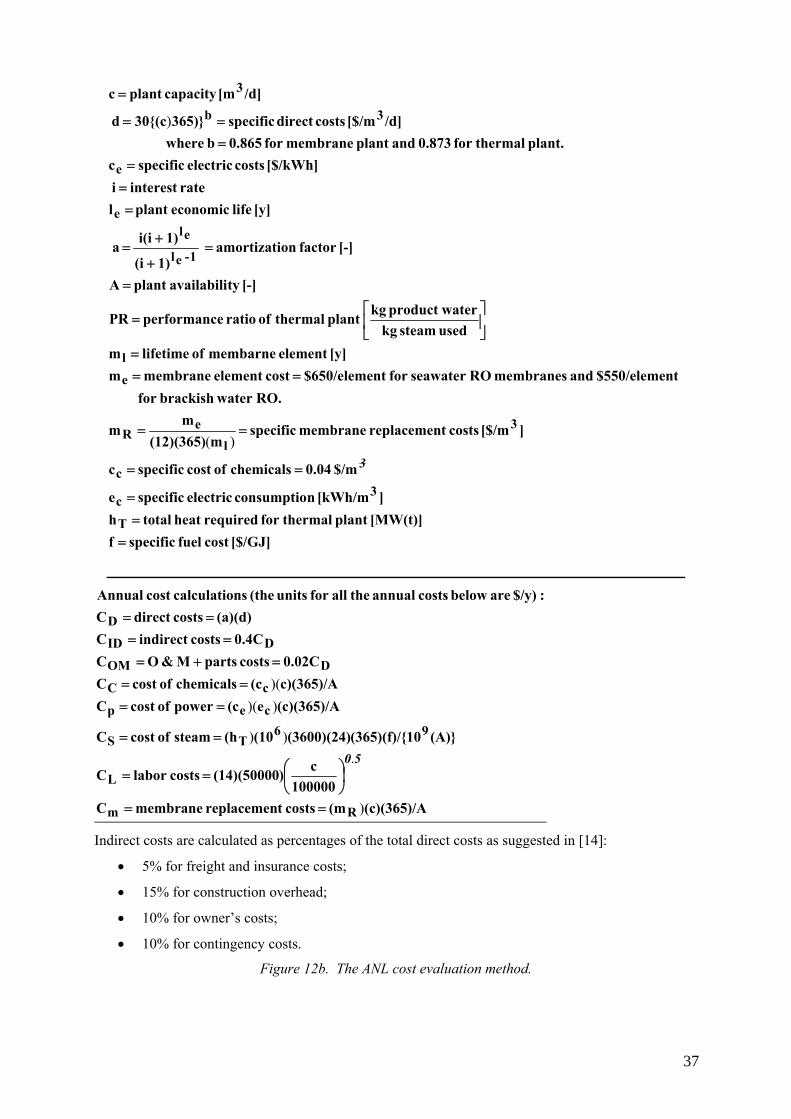
[$/GJ]cost fuel specific f[MW(t)]plant thermalfor requiredheat total h
][kWh/m nconsumptio electric specific e
$/m 0.04 chemicals ofcost specific c
][$/m costst replacemen membrane specific m(12)(365)
m m
RO.water brackishfor nt $550/eleme and membranes ROseawater for nt $650/eleme cost element membrane m
[y]element membarne of lifetime mused steam kgwaterproduct kgplant thermal of ratio eperformanc PR
[-] tyavailabiliplant A
[-]factor onamortizati 1)(i
1)i(i a
[y] life economicplant lrateinterest i
[$/kWh] costs electric specificcplant. thermalfor 0.873 andplant membranefor 0.865 b where
/d][$/m costsdirectspecific365)}30{(cd
/d][mcapacityplantc
T
3c
c
3l
eR
e
l
1-el
ele
e
3b
3
==
=
==
==
===
⎥⎦
⎤⎢⎣
⎡=
=
=+
+=
==
====
=
3)(
)
(c)(365)/A(m costst replacemen membrane C100000
c)(14)(50000 costslabor C
(A)}10(365)(f)/{(3600)(24)(10(h steam ofcost C
(c)(365)/Ae(c power ofcost Cc)(365)/A(c chemicals ofcost C0.02C costs parts M&O C
0.4C costsindirect C(a)(d) costsdirect C
:$/y) are below costs annual the allfor units (the nscalculatiocost Annual
Rm
L
96TS
cep
cC
DOM
DID
D
)
))
))()(
.
==
⎟⎠⎞
⎜⎝⎛==
==
==
===+=
====
50
Indirect costs are calculated as percentages of the total direct costs as suggested in [14]:
• 5% for freight and insurance costs;
• 15% for construction overhead;
• 10% for owner’s costs;
• 10% for contingency costs.
Figure 12b. The ANL cost evaluation method.
37

2.6. FURTHER DEVELOPMENTS In the context of CRP on economic evaluation, various participants have started working on some new developments, which are expected to be available for integration into future DEEP versions:
(1) This is the case, for example for CEA, currently in the process of finishing three developments:
• Elaboration of detailed correlations for main RO performance parameters such as the recovery ratio, feed pressure, permeate flux etc as functions of three variables: the feed temperature, the feed flow and the feed salinity. These correlations established initially for Filmtec SW30-HR-380 membranes will be generalised to other membranes and seawater compositions under the Indo-French collaboration agreement and experimentally verified on Indian RO installations.
• Development of an MED plant simulator (under a specific IAEA contract), based on the analytical treatment of thermal-hydraulic phenomena, utilising general energy and mass conservation laws. Thermodynamic parameters calculated by the simulator will then be input into DEEP for more precise calculations of desalination costs.
• Development of an economic method, based on the exergy principle, to remove some elements of arbitrary allocations in the power credit method.
(2) Egyptian and Syrian participants in the CRP have developed spread sheet software to estimate the desalted water transport costs, (see for example, Annex 8), which are expected to be included in future DEEP versions.
38

3. INSTITUTIONAL ASPECTS
3.1. THE DEPLOYMENT OF NUCLEAR ENERGY IN DEVELOPING COUNTRIES In addition to high capital requirements, and the requirement that importing countries adhere to the rigorous application of the non-proliferation regime, the main policy issues in deploying nuclear reactors or nuclear desalination systems are the following:
• Engagement and planning
For a large number of developing countries (DCs), nuclear energy remains, and will continue to do so for some time, a new and advanced technology. As such, its introduction would impose severe constraints on the local technical and industrial infrastructures.
Since a nuclear program necessitates high investment in capital, resources and manpower, it is essential that a concerned DC give a strong commitment to the pursuit of continued and intense efforts as regards the deployment of the nuclear program. The government should prepare long-term plans for nuclear energy and water development, as well as the associated financial and economic plans. An isolated nuclear reactor, without complete integration in the local energy policy can rapidly become an extremely dangerous and costly adventure.
• Safety considerations
In many countries with a new nuclear power program, the safety and regulatory aspects concerning the protection of the public and the environment are not fully understood by the government, designated operator and the industry.
For most governmental leaders, the only difference between the conventional fossil fuelled plant and the nuclear plant is the replacement of conventional heat source by a nuclear heat source. Tasks, such as the procedures for authorisation and inspection of a nuclear installation are thus delegated to “regional inspectors” of conventional power plants whereas the safety reports and procedures are only read and approved by some university professors.
This lack of understanding often leads to inadequate budget allocations to create a really independent safety authority with the consequent problems of incomplete procedures, absence of reference and control documents, absence on any quality assurance, defective components and industrial processes etc.
• Local grid characteristics
The safe and economic operation of a nuclear reactor requires an off site source of electrical energy with a sufficient capacity for the start-up and shutdown of the reactor. Similarly, the local grid must have stable characteristics and large enough capacity for distribution of the load.
In a number of DCs, the capacity of the grid always lags behind the demand. There are important load-fluctuations because of the absence or insufficiency of control equipment and protective systems.
Before considering the deployment of any nuclear plant, the DC and the exporting country/organisation must have satisfactory answers to the following:
What is the optimum size of the nuclear plant, compatible with the load of the system? (Generally, the reactor power should be about 10 % of the total grid capacity).
What are the required mitigation measures concerning the mutual interaction between the nuclear reactor and the dynamics of the electrical grid?
Is the regulation of nuclear activities adequately implemented?.
• Qualified manpower
The availability of qualified manpower in developing countries is a fundamental necessity for the safe operation and maintenance of the nuclear installation. Since no compromise in this respect is even thinkable, it is of primordial importance that the personnel acquire required competence through study and training.
39
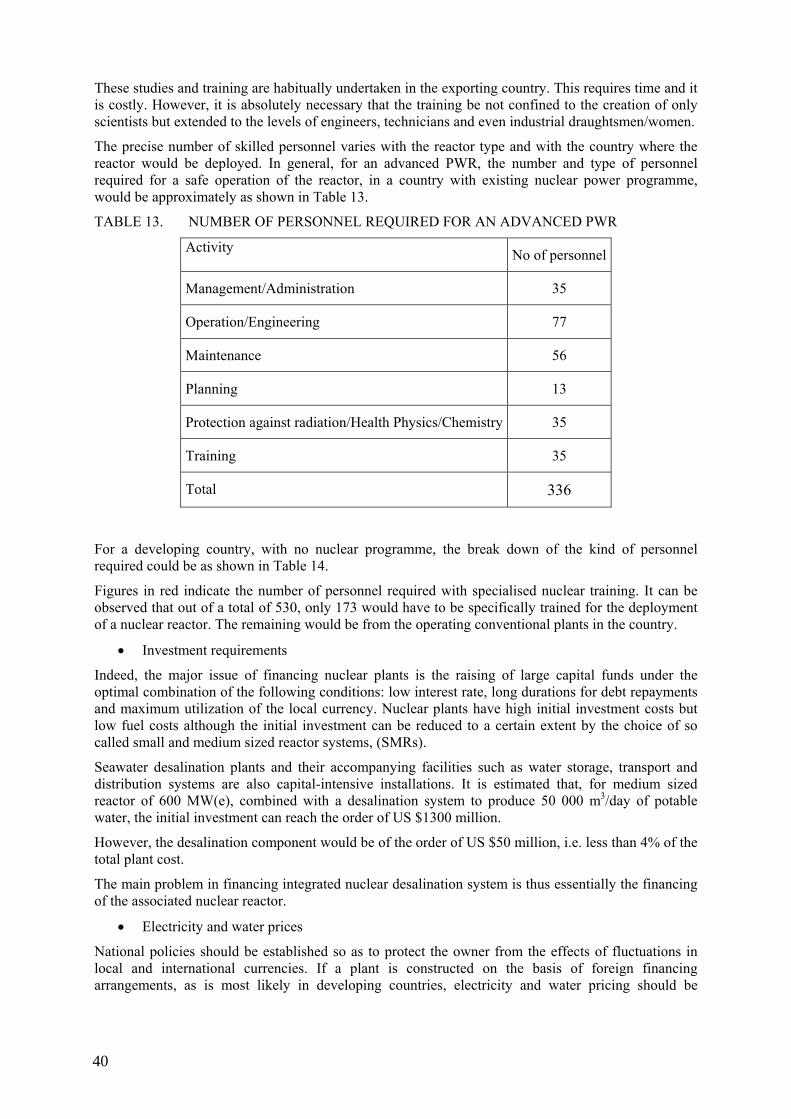
These studies and training are habitually undertaken in the exporting country. This requires time and it is costly. However, it is absolutely necessary that the training be not confined to the creation of only scientists but extended to the levels of engineers, technicians and even industrial draughtsmen/women.
The precise number of skilled personnel varies with the reactor type and with the country where the reactor would be deployed. In general, for an advanced PWR, the number and type of personnel required for a safe operation of the reactor, in a country with existing nuclear power programme, would be approximately as shown in Table 13.
TABLE 13. NUMBER OF PERSONNEL REQUIRED FOR AN ADVANCED PWR
Activity No of personnel
Management/Administration 35
Operation/Engineering 77
Maintenance 56
Planning 13
Protection against radiation/Health Physics/Chemistry 35
Training 35
Total 336
For a developing country, with no nuclear programme, the break down of the kind of personnel required could be as shown in Table 14.
Figures in red indicate the number of personnel required with specialised nuclear training. It can be observed that out of a total of 530, only 173 would have to be specifically trained for the deployment of a nuclear reactor. The remaining would be from the operating conventional plants in the country.
• Investment requirements
Indeed, the major issue of financing nuclear plants is the raising of large capital funds under the optimal combination of the following conditions: low interest rate, long durations for debt repayments and maximum utilization of the local currency. Nuclear plants have high initial investment costs but low fuel costs although the initial investment can be reduced to a certain extent by the choice of so called small and medium sized reactor systems, (SMRs).
Seawater desalination plants and their accompanying facilities such as water storage, transport and distribution systems are also capital-intensive installations. It is estimated that, for medium sized reactor of 600 MW(e), combined with a desalination system to produce 50 000 m3/day of potable water, the initial investment can reach the order of US $1300 million.
However, the desalination component would be of the order of US $50 million, i.e. less than 4% of the total plant cost.
The main problem in financing integrated nuclear desalination system is thus essentially the financing of the associated nuclear reactor.
• Electricity and water prices
National policies should be established so as to protect the owner from the effects of fluctuations in local and international currencies. If a plant is constructed on the basis of foreign financing arrangements, as is most likely in developing countries, electricity and water pricing should be
40

adjusted to compensate for the fluctuations in currencies used for financing the project. This will minimize the effects of fluctuations in the market prices.
TABLE 14. BREAKDOWN OF PERSONNEL AND THEIR FUNCTIONS FOR THE OPERATION AND MAINTENANCE OF A FIRST NUCLEAR REACTOR.
Staff designation Number Function High Management 1 Various corporate support Station Manager 1 Oversee entire plant operation
Planning 8 Plan, schedule, monitor and coordinate
Store (supply) 20 Material management, spare parts
Production manager 1 Operations & Maint. Fuelling and Chem.
Operations and maintenance 89+151 Operate and maintain plant equipment
Fuelling 28 Operate and maintain fuel handling
Chemistry 18 Sample, monitor, initiate action to maintain specifications
Technical Manager 1 Manage Tech. Unit; supp. Prod. + safety
Technical EC& I 33 Tech Eng specialists to elect. and inst control
Technical mechanical 31 Mechanical eng. For process and mech. systems
Tech specialists safety 14 Eng. For special safety systems
Engineering services 5 Tech. Eng. specialists for project management and contractual services
Nuclear safety manager and analysis 1+11
Maintain safety and licensing; carry out safety and spec. analyses
Regulatory affairs 3 Deal with reg. and licensing
Health physics 21 Define policy & develop procedures
HP lab 3 Perform all lab work for dose monitoring
Administration 40 Security 22
Training 20 Coordinate and provide training for all staff
QA 8 Support Station Manager in QA Total 530 Total with nuclear training 173 With specialized nuclear training
41

• Basic financing and contracting approaches
The magnitude of the investment and the constraints to financing underscore the need to explore financing for a nuclear desalination project from all possible sources, both local and foreign. Examples of international financing sources include:
• Public sector export credits.
• Supplier’s credits and financing arrangements through commercial banks, guaranteed by export credit guarantee agencies and by multilateral development and financing institutions.
• Bilateral financing sources.
• Private international markets for commercial loans and international bonds.
The financing of local costs is one of the most difficult problems for power projects in many countries. Domestic funds should be used to finance, as much as possible, the total project costs but in any event the local portion of these costs. Difficulties in financing local costs arise from shortages of utility and government funds and constraints in local capital markets, especially in developing countries. A well functioning domestic capital market is particularly important for organizing local financing.
3.2. FINANCING The deployment of nuclear energy in most emerging and developing countries (DCs) continues to be rather stagnant (except in China and India) for numerous and very complex reasons. Among these the most important one is the considerable difficulties that such countries encounter in finding adequate financing of the nuclear projects [3]. Two main factors appear to be the root cause of this problem:
• The relatively high investment cost of nuclear reactors and the associated uncertainties and risks [15].
• Relatively longer constructions lead times, which have varied in the past from 6 to 14 years in some countries. A construction lead-time of about 6 years is considered normal for a first of a kind reactor. Delays beyond this period are in particular related to the additional investment that a given country has to make: construction of roads and adequate transport, development of large enough ports to receive heavy material, development of infrastructures, preparation of the site including facilities for the personnel etc. For a construction period of 8 years and 7% discount rate these additional investments may represent from 30 to 40% of the total investment cost.
3.2.1. Financing arrangements
A nuclear desalination project is only viable if financing is assured. This might constitute a major constraint to countries poor in capital and financial resources or where many different investment requirements compete for the available resources. Because of the relatively large investment requirements of a nuclear desalination plant, its financing should be viewed within the framework of the country’s overall electricity and water supply and even within the country’s overall economy if it represents a sizeable addition.
If the buyer organization (or country) has difficulty in obtaining suitable financing on its own, it may request financed offers in the bid specifications. The reactor, power plant or desalination plant vendors might offer some partial financing to directly finance their supplies. The vendors might have access to their national export financing institutes, whose objective is to facilitate exports, and consequently may offer preferential terms. There is a common interest between the vendor and his national financing institute to promote the sale.
The financing arrangements have to be negotiated directly between the buyer and the financing institute. The vendor will usually provide assistance. This could be of fundamental importance for obtaining loans on the best possible terms. Financial institutes are usually reluctant to commit themselves before a supply contract is finalized between the buyer and the vendor. However, if the
42

acceptability of the bids is subject to being accompanied by a financing offer, the financial institute(s) might issue conditional letter(s) of intent.
3.2.2. Public-private partnerships
One option for the efficient implementation of a nuclear desalination project is to involve the private sector, either through inducting stand-alone projects, financed, constructed and operated by a private sector partner, or through some wider partnership with the private sector.
Tight budgets, lower aid availability, and other investment priorities mean that water projects must compete for scarce government financial resources. Therefore, private sector investment can provide a much-needed source of funding for the water sector. In addition, private sector-government partnerships can provide other benefits such as advanced technology, improved operational performance, and more efficient commercial operations.
There are various approaches to promote private sector participation in the water sector. These include service contracts, management contracts, operations and management services, leases, system-wide concessions, asset divestitures and Build-Own-Operate/Transfer (BOOT) structures for new infrastructure. In selecting the most appropriate approach, governments must assess their specific infrastructure and operations requirements, as well as an overall strategy for partnering with the private sector.
So far, the private sector has widely participated in desalination projects but not yet in nuclear power (or nuclear desalination) projects, because of their specific aspects needing the direct control and monitoring from governments. Suitable public private partnerships need then to be established for nuclear desalination projects, which allocate responsibilities between public and private sector, taking into account the specific characteristics of nuclear field.
3.2.3. Financing options
The financing of nuclear power projects in developing countries involves complex issues that need to be fully understood and dealt with by all the parties involved. Consideration should be given to the principal characteristics specific to NPPs, as well as to the overall complexities of such projects and how these complexities affect their financing. It is essential that every effort be made by all parties involved in the development of a NPP to reduce the uncertainties linked to such large investments and long project times, in order to improve the overall climate for the financing of these projects in developing countries.
The special circumstances for financing nuclear power projects in developing countries are: long construction times, large capital requirements on terms, (which are specific to nuclear projects), and the likelihood of cost overruns. In addition to these considerations, public acceptance of nuclear power has also become an important concern; particularly because of safety, waste disposal and non-proliferation issues.
Conventional options for financing power generation projects in developing countries have included financing through a utility’s own resources, national budgets, local commercial banks and foreign multilateral and bilateral sources, usually to cover foreign exchange costs. Most developing countries often lack foreign exchange and the ability to mobilize resources in their domestic capital markets. Industrialized countries able and willing to export components and services for power generation systems have made a number of arrangements to assist developing countries in financing their projects.
To supplement national financing schemes, multilateral financing institutions were created after World War II to assist developing countries in mobilizing financial resources for economic development. The World Bank Group is one such institution. The efforts of the World Bank have been supported by the establishment of regional development banks in Africa, Asia, Europe and Latin America, and of the European Bank for Reconstitution and Development. While multilateral sources have made a major contribution to financing development, they have not yet participated in the funding of nuclear power projects.
43

It is to be recalled here that current World Bank policy is not to finance any nuclear projects. There is thus need to prepare a clear and concise argumentation for such projects giving concrete proofs that the choice of the nuclear option is indeed a valid one and that all the associated risks and problems, as discussed above, are fully dealt with.
Successful financing arrangements depend on the thorough use of a full range of expertise and on learning from experience. If the national budget or a sponsor’s equity and cash flow can accommodate the implementation of a project, there will be no problem in financing the project. If a country launching a nuclear power project, or expanding it, is creditworthy, it can be helped through granting of export credits and can procure funds by international borrowing. If the capital market is relatively developed in the host country, local financing may be easier. The reality, however, has proved to be different.
In general, as long as the debt servicing by a given developing country is a cause of concern, lenders, exporters and the governments of developed countries will remain hesitant to finance nuclear power projects, owing to their high degree of uncertainty with respect to costs and schedules. In view of the need for more foreign exchange in most developing countries and the difficult situation in the international financing environment for lending to a developing country for a nuclear power project, additional approaches and complementary mechanisms must be explored. Developing countries are turning increasingly to more innovative financing options. These include non-recourse, or limited recourse, financing techniques for mobilizing additional external financial resources.
3.2.4. The financing mechanisms
The main financing schemes for large projects are: Project financing. Leasing. Build-operate-transfer (BOT).
The first two approaches will be illustrated by taking the example of the French-Tunisian project, TUNDESAL, for a nuclear desalination plant at La Skhira site in Tunisia [16]. The two approaches are based on the same principle: instead of financing by the local utility, the project sponsors will create an independent entity, called TUNDESAL company, which is responsible of project’s financing, construction, operation and maintenance. This principle is called “project finance”.
The second approach proposed is also based on the «project financing» principle, but integrates in addition the leasing mechanism: obtaining the necessary equipments without having to make the capital outlay when purchasing. Combining leasing and project financing offers project borrowers and issuers several attractive features:
First, leasing may provide a sponsor with off balance-sheet accounting treatment even if the sponsor has the majority ownership or management control of the project company. This allows sponsors more flexibility in structuring their operations as industry deregulation, rationalization, and evolution continues.
Second, leasing can provide significant earnings improvement for a project company (which translates into improved earnings for a sponsor if the project company’s earnings are consolidated). Earnings should continue to be of paramount importance in energy sector.
Third, leasing may provide a more efficient tax structure that would allow a sponsor to maximize the tax benefits associated with the ownership of the assets. This tax efficiency should translate into more economically attractive funding. Finally, leasing may provide an alternative source of financing, potentially reducing the sponsor’s required equity contribution to the project and lowering the aggregate funding cost by expanding the universe of potential investors.
The difference between the two schemes is the nature and the share of each financing source in the global investment needs.
Detailed calculations have led to the results summarized in Table 15.
44

TABLE 15. SURPLUS GENERATED FOR THE PROJECT’S SPONSORS (M$)
Year 1 2 3 4 5 6 7 8 9 10 11 12 13 14 15
Surplus 1 105 107 109 112 114 117 119 122 124 149 188 190 193 200 202
Surplus 2 137 140 142 145 148 151 153 156 158 177 199 202 205 211 141
The surplus 1 corresponds to the surplus generated through the first financing mechanism;
The surplus 2 corresponds to the surplus generated through the second financing mechanism.
Based on this table, the present value of sponsors’ future revenues, with 13% of rate of return is calculated. It should be noted that sponsors contribution is 20% of the total investment cost (204 M$) in the first approach and 10% in the second one (102 M$). A present value of 765 M$ is found with the first approach and 1040 M$ with the second one.
With leasing approach, there are annual tax benefits of about 8 M$ due to deduction of leasing charges (22 M$ per year) from operating revenues. In addition, with this scheme, 20% of financial needs were procured on equity basis against 40% in the first scheme. As equity capital generates higher costs than lease financing in our case, this also explains the advantage of using the last approach.
So far, no BOT approach has been used for nuclear projects.
45

4. NEW TECHNOLOGICAL DEVELOPMENTS AND COST REDUCTION STRATEGIES
New developments in nuclear desalination are numerous as many Member States have consistently progressed almost simultaneously in the three technical fields: the development of improved or new generation nuclear reactors, the improvements in desalination technologies and the adoption of many cost reduction strategies. These developments have been discussed in detail in the recent IAEA publication on the “Status of Nuclear Desalination in Member States”[3]. It is worthwhile to recall theme here briefly:
4.1. DEVELOPMENT OF IMPROVED OR NEW GENERATION NUCLEAR REACTORS
An interesting feature of this development is that many Member States, normally not considered as exporting countries, have begun to develop their own nuclear reactors. This is, for example, the case for Argentina, which is developing the CAREM reactor. CAREM is a small sized integral PWR .The construction of the prototype, providing 100 MW(th) (27 MW(e)) is to begin in 2007.
China is pursuing the development of the dedicated heat only reactor NHR-200 providing relatively low-temperature heat for an MED process, with some electricity production to meet the local electricity needs.
India is going along with a gradual but consistent evolutionary approach to develop its advanced PHWRs.
The republic of Korea continues with its programme to develop the System-integrated Modular Advanced ReacTor (SMART). SMART is a small sized (330 MW(th)) integral type PWR, containing all major primary components in a single pressurized vessel. It is foreseen for a nuclear desalination project designed to produce 40 000 m3/day of potable water at one of the Korean sites.
Among the other countries, several developments are in progress:
• Continuation of the R&D by ANSALDO (ITALY) and WESTINGHOUSE (USA) on the development of the medium sized PWR, the AP-600.
• Certification of the GT-MHR by General Atomics (USA) and continuation of further developments.
• Construction of the PBMR by PBMR PtY in South Africa.
• Development of the new generation HTR, the ANTARES reactor, by FRAMATOME, a joint subsidiary of SIEMENS (Germany) and AREVA (France), designed to respond to a multiplicity of non-electric applications such as hydrogen production, industrial heat applications and desalination.
• Russia has acquired considerable experience in designing of cogeneration plants and nuclear desalination complexes based on floating power units (FPU) with advanced marine light water reactors. Analogues of such reactors are successfully operating on Russian nuclear ships and are serviced by a specially established infrastructure. Presently, construction of a nuclear power plant based on FPU with KLT-40S reactors has been started in Severodvinsk, Arkhangelskaya Region, Russia, development of the reactor design for new icebreaker is continued.
One of the long-range tasks of Russian nuclear desalination projects is development of a FPU for nuclear desalination complexes based on an advanced reactor with inherent safety, capable for long-term operation without refueling at the site.
Main advantages of FPUs are. FPUs are manufactured and tested at ship-building factories, using industrial
technologies that allow to improve their quality and to reduce costs and construction term as compared with the shore-based power units.
46

FPU design meets the non-proliferation requirements because repairs, refueling, and
handling of radioactive waste and spent nuclear fuel are performed at specialized enterprises of the supplier simultaneously with FPU overhaul.
One FPU can be decommissioned and replaced with another one, with the shore-based infrastructure preserved.
FPUs are based on the closed fuel cycle coupled with the infrastructure and non-proliferation mechanisms that the supplier possesses.
FPUs can be easily disposed of at the specialized factories of the supplier.
4.2. ADVANCES IN DESALINATION TECHNOLOGIES Desalination technologies have, on the whole, shown continued progress over the past decades, [17]. Naturally, the basic motive behind continued innovation is the reduction of overall process costs. 4.2.1. Thermal processes The most notable progress in MED and MSF plants has been the increase in production capacity of the plants as shown in Figure 13. In the particular case of MSF plants, a recent improvement has been the condensate cooling, which leads to a higher heat recovery in the system and consequently the lower vapour consumption of the plants. This improvement also leads to the reduction of fouling in the upper, high temperature stages compared to “normal” operation.
Figure 13. Unit size growth of MSF and MED plants over the years. [17].
MED has known considerable innovations over the last 25 years in particular in the development of tube technology, evaporators with higher and higher efficiencies and a better understanding of the “tube wetness” phenomena.
MED, especially when it is combined with a vapour compression system (VC), has some inherent advantages over the MSF process, as shown in Table 16, where comparative data is given for a large sized, projected (340 650 m3/day) plant in one of the Gulf states.
47

TABLE 16. COMPARISON OF MSF AND MED PARAMETERS
Item MSF MED
Number of modules 5 12
Capacity/module (m3/day) 68 130 28 930
Vapour flow rate (t/h) 1860 1860
Vapour pressure (bar) 1,5 5
Thermal power consumption (MW(th))
42 17
Land surface area (m2) 127 X 385 110 X 250
Turn key cost (M$) 375 265
Other new developments in the thermal processes (mainly MED) can be summarised as follows, [17]:
• Choice of high performance materials, (e.g. carbon-steel in place of simple, painted steel), development of high heat transfer alloys for the tubes, increasing use of non-metallic evaporator materials.
• Improvement in corrosion resistance (e.g. utilization of anti-scaling organic products in place of conventional acid treatment).
• Improvements in availability and thermodynamic efficiencies, due to the incorporation of on-line cleaning procedures.
• Modular construction, with improvements in fabrication procedures, reducing construction lead times.
• Development of efficient and more precise process control systems and procedures.
4.2.2. Membrane based technologies The advances in membrane based technologies, in particular RO, have led to a dramatic reduction of desalination costs. Not surprisingly, RO systems are the most rapidly expanding ones in today’s desalination markets. Membrane based systems have become the corner stone of the strategies for water recycling and recuperation. Among the notable advances, one may cite:
• Increase of salt rejection efficiency (from 98 to 99.8 %). • Increase in permeate flux (86 %). • Enhanced chlorine tolerance. • Reduction of the costs of cleaning and pre-treatment thanks to ever increasing resistance
against fouling. • Development of longer life membranes.
4.2.2.1. Membrane based pre-treatment The investment and O&M costs represent more than 50% of a given desalination system. RO membranes are in general very sensitive to fouling by organic molecules and by solid particles in suspension. It is of crucial importance to eliminate these molecules before feeding the RO system in order to maintain the desired performances and to avoid irreversible damages to the RO membranes. In fact, the determining factor for the success of a RO system is the efficiency of its pre-treatment. An important recent innovation in RO pre-treatment is the increasing use of specific membranes in place of conventional chemical pre-treatment, which is relatively more costly:
48

• Use of MF membranes, which eliminate micron-size suspended particles and other organic matter and solutes.
• Use of UF membranes, which takeout odour, colour, volatile organic matter and dissolved/suspended species in the sub-micron, 0.1 micron to micron size range, not eliminated by MF.
• Use of NF membranes, which principally eliminate troublesome divalent (e.g. sulfate ions) and multivalent ions, as well as dissolved natural organic matter and thus allow raising the top brine temperature.
The integration of MF and/or UF pretreatment systems into desalination plants is has become normal practice in recent years.
4.2.2.2. Energy recovery devices The energy cost of a desalination system is a complex function of several parameters, including the choice of the process and the site-specific conditions. In general this cost is from 30 to 60 % of the total cost. It is for this reason that there is an increasing tendency to recover, at least partially, the energy used to pressurise the RO systems. Such systems can recover from 10 to 50 % of the energy needs of a seawater RO system. A Work Exchanger has already been installed on the Ashkelon Plant (Israel), producing 32 510 m3/day, with a permeate TDS of 300 mg/L (compared to the TDS of 40 700 mg/L for the seawater feed). Thanks to such a system, the specific consumption of the plant is only 3.9 kWh/m3.
4.3. COST REDUCTION STRATEGIES Energy cost represents a substantial fraction of the total desalination costs. Although desalination processes have been, and continue to be, considerably improved, there is a strong incentive to further reduce desalination costs. Several approaches are currently under investigation:
4.3.1. Utilization of waste heat from nuclear reactors
4.3.1.1. High temperature, gas cooled reactors Two of the most commonly used desalination processes are the multi-effect distillation (MED) and the reverse osmosis (RO). In both cases, part of the useful energy is diverted to produce the desalted water. If the desalting capacity is high, this energy loss could be very significant.
An alternative, providing virtually free heat to be used with the MED process, is based on the Utilization of gas-cooled, high temperature reactors.
Thus, for example, in the two such reactors currently being developed (the GT-MHR and the PBMR), circulating helium, which has to be compressed in two successive stages, cools the reactor core. For thermodynamic reasons, these compression stages require pre-cooling of the helium to about 26 °C through the use of the pre-cooler and intercooler helium-water heat exchangers.
Considerable thermal power (≈300 MW(th)) is thus dissipated in the pre-cooler and the intercooler. This thermal power is then evacuated to the heat sink.
Depending upon the specific designs, the temperature ranges of the water in these exchangers could be between 80 and 130°C. This is an ideal range for desalination with the MED plant, which can be coupled (Figure 14) between a mixer (of the flows from the pre-cooler and the intercooler) and the switch- cooling unit, evacuating the heat to the heat sink, (sea or river).
49

Figure 14. Principle of waste heat Utilization from a GT-MHR (or PBMR).
CEA, France has thus recently developed thermodynamic models [18] to determine the total amount of waste heat from the GT-MHR and the PBMR, which could be input to the MED plant without in anyway degrading the thermodynamic conditions on the reactor side yet at the same time respecting the specific site characteristics.
In the specific case shown in figure 14, the thermal powers, produced in the pre-cooler and the intercooler of the GT-MHR, are respectively 171.6 and 134.3 MW(th). If the fluids coming out of these two exchangers are mixed, one would expect a total thermal power of about 305.9 MW(th), which should be theoretically available for desalination with the MED plant.
In practice only a fraction of this power can be used. It was shown in [7] that, for safety reasons, it is essential to maintain a dynamic pressure barrier between the mixer and the MED process. This is achieved by interposing the intermediate circuit, comprising a heat exchanger and a Flash tank.
Results of calculation then show that, in this case, the total thermal power available for desalination is only 69.3 MW(th)/module for the GT-MHR, i.e. about 23% of the theoretical available thermal power.
Two modules of the GT-MHR would thus provide 573 MW(e) and 38 720 m3/day of desalted water. These are respectively 95 % of the required power and 81% of the required desalted water at the la Skhira site in Tunisia. A similar reasoning can be applied to the PBMR in which case the available heat for desalination would be about 22 %. In this case 5 modules of the PBMR would provide 575 MW(e) and 42604 m3/day of desalted water Certain economic parameters of the two reactors, as announced by their developers [19, 20] and presented in Table 17, were then input into the new DEEP-3 model to evaluate the desalination costs in Tunisian conditions. Similar calculations were performed for the PBMR and the 600 MW(e) gas turbine combined cycle plant, CC-600.
Generator
Turbine
ReactorRecuperator
Intercooler
HP Compressor
Precooler
Flash tank
Fresh water
Seawaterout
Blowdown
GT-MHR Reactor Unit Heat Transformer Unit
Intermediate Water Loop
Desalination Unit (MED)
Switch CoolingUnit
MED
LP Compressor
Seawaterin
Seawaterin
Seawaterout
128.3 °C
26 °C
26 °C
105.6 °C
Heat sink
50

TABLE 17. ECONOMIC PARAMETERS OF THE HTRs AND CC-600 (REFERENCE
YEAR 2006)
Parameters Units GT-MHR* PBMR* CC-600**
Net electrical power/module MW(e) 286.6 114.9 545.2
Net thermal power/module MW(th) 592.6 265.9 1069
Efficiency % 48.3 43.2 51
Availability % 91.2 91.2 90.3
Number of units at site 2 5 1
Construction lead time yrs 4 2 2
Plant life time yrs 40 40 25
Specific construction cost claimed by designer $/kW 1073 1650 525
Specific investment cost at 5% discount rate claimed by designer $/kW 1182 1733 551
Specific investment cost at 8% discount rate claimed by designer
$/kW 1251 1782 567
Specific investment cost at 10% discount rate $/kW 1298 1815 578
Fossil fuel price escalation rate %/year 2
kWh cost at 5% discount rate 10-2 $/kW.h 26.0 3.13 4.883
kWh cost at 8% discount rate 10-2 $/kW.h 30.5 3.75 4.954
kWh cost at 10% discount rate 10-2 $/kW.h 33.8 4.17 5.025 * As published or announced by the developers. ** Under Tunisian conditions, with gas price of 150 $/toe (20.62 $/bbl). The results obtained for desalination costs evaluations are presented in Table 18. TABLE 18. DESALINATION COSTS, AT 8% DISCOUNT RATE, BY GT-MHR + MED, PBMR
+ MED SYSTEMS, USING WASTE HEAT AND CC-600 + MED
Parameters Units GT-MHR PBMR CC-600*
Year of industrial operation 2020
No. of modules 2 5 1
Net electricity generation MW(e) 548 345 600
Discount rate % 8
Desalted water production m3/day 38 143 41 969 39 288
Spec. const. cost of desalination plant $/(m3/day) 1242 1242 1112
Specific investment cost of desalination plant $/(m3/day 1307 1307 1171
Desalted water cost $/m3 0.6271 0.7198 0.9450
* With gas price of 20.62 $/bbl (150 $/toe) and 2% annual escalation rate.
51

Detailed economic evaluations, undertaken in the context of the Tunisian site, show that the above coupling schemes lead to the lowest desalination costs. Thus for example, at 8 % discount rate and the rather low gas price of 150 $/toe (20.62 $/bbl), the desalination cost of the GT-MHR + MED system is 34 % lower than that by the gas turbine, combined cycle plant + MED. In the same conditions, this cost is 24 % lower for the PBMR + MED system.
4.3.1.2. Utilization of waste heat from the condensers of PWRs and CANDUs (the ROph process)
The net electrical efficiencies of the power conversion systems in most PWRs and CANDUs are of the order of 30 to 33%. This means that nearly two thirds of the net thermal power, produced in the reactors, is evacuated to the heat sink via the condensers. The temperature of the water from the condensers is too low (30 to 32°C) for a meaningful desalination with distillation processes. However, this relatively hot water can be fed to an innovative variant of the RO process, with preheating now known as the ROph process. In hybrid systems, it is also possible to use the cooling seawater return stream from the thermal desalination component as feed to the RO component.
It is known that the viscosity of the feed-water is inversely proportional to its temperature. Thus, as temperature increases, water viscosity decreases and RO membrane becomes more permeable, with a consequent increase in production, (Figure 15).
From the basic RO system equations, we know that, for a given membrane, the rate of water flow is proportional to net driving pressure differential across the membrane.
From a theoretical stand point, as temperature increases, osmotic pressure differential across the membrane, πΔ increases. If the hydraulic pressure differential, PΔ , is maintained at a constant value, the membrane’s net driving force, NDP (= PΔ – πΔ ) decreases. As a result, the specific power consumption of the RO system decreases with temperature. (Figure 16).
The net result of these two effects may then lead to some reduction in the water production cost with the ROph system. This reduction is site dependent and is a complex function of several parameters including feed TDS. According to theoretical calculations for each value of feed TDS, the maximum of recovery ratio is obtained at a specific temperature, (Figure 16).
CANDESAL first developed an advanced reverse osmosis (RO) desalination system that emphasizes a non-traditional approach to system design and operation [21]. Key features of this advanced approach to RO system design and operation are the use of “preheated” feed-water, advanced feed-water pre-treatment, advanced energy recovery systems, site-specific optimisation and automatic real-time plant management systems.
0.6
0.7
0.8
0.9
1
1.1
1.2
20 25 30 35 40 45 50
Temperature, C
Rel
ativ
e W
ater
Pro
duct
ion
62.1 bar (900 psi)
69 bar (1000 psi)
Figure 15. Normalized water production as a function of RO feed-water temperature and pressure.
52

Figure 16. Specific power consumption as a function of feed temperature and TDS.
The amount of feed-water preheating depends both on the ambient seawater temperature and the specifics of the nuclear reactor design. The only limitation is that the maximum temperature allowed by the RO membrane design limits must not be exceeded. Currently available RO membranes typically have a limit of about 45°C, although this is expected to increase as membrane performances continue to be improved by the manufacturers. The phenomena involved (e.g. concentration polarization, complex variation of recovery ratio etc.) need further experimental investigations. However, it is felt that cost savings are possible at all temperatures where waste heat can be used to preheat the feed-water but overall savings depend on a number of factors that are site-specific: the salinity of the feed-water, the size of the plant, the amount of preheat available, etc. An important consideration in ROph is that it can easily use the hot water from the main condensers of the PWR type of plants. The ROph process was first applied to the economic assessment of nuclear desalination systems in the EURODESAL project [7]. However, at that time, the method used was based on specific empirical formulae and could only be applied to nuclear power plants such as the CANDU and PWR, and for only one value of the seawater salinity (TDS). CEA thus investigated a new method for the mathematical treatment of the process, extending its application to all power producing plants and permitting the understanding of the key performance parameters (e.g. the recovery ratio, the total production, the product salinity, etc.) of the system as functions of operating variables such as the temperature (x), feed salinity (e) and the feed flow (m), [22]. The method was then applied to the specific site study for la Skhira, Tunisia. These correlations have not yet been integrated into the DEEP-3 software but as an illustration of ROph cost reduction, indicative figures, obtained with DEEP-2 and CEA correlations, are shown in Table 19 for 8% discount rate and two plants: the 600 MW(e) gas turbine, combined cycle plant (CC-600) with a low gas price of 20.62 $/bbl and the PWR-900. TABLE 19. DEEP-2 RESULTS, COMPARING THE WATER COSTS ($/m3) OF RO AND ROph SYSTEMS
CC-600 (20.62 $/bbl) PWR-900
RO 0.7503 0.6990
ROph 0.6474 0.6032
Δ(%)=(ROph-RO)/RO -13.7 -13.7
2
3
4
5
6
7
8
10 15 20 25 30 35 40 45
Feed temperature (°C)
Spec
ific
pow
er c
onsu
mpt
ion
(kW
he/m
3)
Feed TDS=30000 ppm
Feed TDS=35000 ppm
Feed TDS=40000 ppm
Feed TDS=45000 ppm
Feed TDS=50000 ppm
53

It can be observed that ROph can lead to a desalination cost reduction of about 14 % as compared to the desalination cost of a conventional RO system. This reduction is independent of the power source.
4.3.2. Waste heat utilization from Indian PHWRs
4.3.2.1. The research reactor CIRUS Nuclear research reactors produce significant quantities of waste heat. A scheme was thus developed at BARC (India) to integrate a desalination unit such that the technology of utilizing reactor waste heat for desalination of sea water by a LT-MED process can be demonstrated, [23]. This process is schematically shown in Figure 17.
The LTE unit was then coupled to the CIRUS reactor. The nuclear research reactor (CIRUS) has a capacity of 40 MW(th) using metallic natural uranium fuel, heavy water (D2O) moderator, demineralized light water coolant and seawater as the secondary coolant. An intermediate heat exchanger (IHE) has been incorporated between the nuclear reactor (CIRUS) and the desalination plant to ensure no radioactive contamination and high protection of desalted water.
The integrated system has since then been successfully operated and has clearly demonstrated the technical fesibility of the coupling to nuclear research reactor. The product water from the plant meets the make up water requirement of CIRUS.
The data from this plant will be useful for the design of larger size LT-MED seawater desalination plants for the production of demineralized water and process water. This type of plant is envisaged to be coupled to Advanced Heavy Water Reactor (AHWR) utilising low grade/waste heat from AHWR and produce 500 m3/day distilled quality water from seawater to meet the demineralized water makeup requirements of the reactor.
Table 20 summarizes the operating data of this plant, which could then be used for a larger sized plant utilizing waste heat.
Figure 17. LTE-MED system coupled to CIRUS reactor. .
54

TABLE 20. TYPICAL OPERATING DATA OF THE CIRUS REACTOR PROVIDING WASTE HEAT FOR DESALINATION
Parameter Unit Value Hot water flow rate litre/minute 1500 Hot water inlet/outlet temperatures °C 53.6/47.5 Seawater flow rate litre/minute 1200 Seawater TDS ppm 35 000 Seawater inlet/outlet temperatures °C 27.6/35.5 Vacuum in the evaporator mm Hg 700 Product water flow rate litre/minute 15.5 Product water conductivity µS/cm 7
4.3.2.2. Waste heat utilization from the 500 MW(e) PHWR In the 500 MW(e) Indian PHWR, the heavy-water moderator is cooled from 80 to 55 °C by process water, which in turn is cooled from 55 to 35 °C by seawater that enters at 32°C and comes out at 42°C. About 100 MW(th) is thus available as waste heat for seawater desalination.
The details have been worked out using 55°C process water temperature to avoid any changes in the moderator system. The coupling scheme is presented in Figure 18.
The nuclear desalination system produces about 1000 m3/day of desalted pure water, which is about 25% more than the total makeup demineralized (DM) water requirements of the 500 MW(e) PHWR.
It is considered more economical to use this water as make up DM water because:
• The thermal energy cost for the LT-MED plant is zero, since it only uses waste heat.
• Direct production of distilled water eliminates the need for demineralizers and regeneration chemicals.
• The raw water, otherwise used as feed for the DM plant, can be made available for other purposes e.g. drinking.
55

Figure 18. PHWR-500 coupling scheme, utilizing waste heat.
4.4. UTILIZATION OF HYBRID SYSTEMS A relatively new trend in cogeneration of power and water using desalination involves the coupling of a hybrid seawater desalination plant with a steam-producing power plant. A hybrid desalination plant consists of a combination of thermal and RO membrane plants. There are several advantages in a hybrid setup for a cogeneration plant:
• A shared and typically smaller seawater intake system.
• Utilization of higher feed-water temperature to the RO plant for improved performance.
• Possibility to blend RO and thermal plant product water to obtain a range of product water grades and the use of a single-stage RO plant.
• The ability to use seasonal surplus of idle power and diversify steam/power allocations.
• The potential to decrease fuel costs by using the less energy consuming RO plant.
• The ability to blend and dilute discharged concentrate with power plant cooling water.
• Combined seawater pre-treatment and product post-treatment systems.
Some of the savings in terms of costs could also be realised from several sources, including:
• Cheaper investment in feed-water intake and supply system.
55 oC
35 oC
Sea Water In 1700 kg/s, 32 oC
72.5 oC
49 oC
Heavy Water 972 kg/s
Process Water 1215 kg/s, 32 oC
Sea Water In 720 kg/s, 32 oC
Sea Water Out, 42 oC
55 oC
Feed 30 kg/s
Blow down 17.5 kg/s
49 oC
45 oC
Sea Water Out 42 oC
CONDENSE
45oC
Product Water 12.5 kg/s, 44.5 oC
1 1
2
3
4
1. Moderator heat exchanger 2. Process water heat exchange 3. Desalination Unit 4. Product water pump
Note: When the desalination unit is shut down, the sea waterrequired for the process water heat exchanger is 2430 kg/s at 32 oC
56

• Reduced cost of concentrate and cooling water discharge system.
• Reduced feed-water pre-treatment costs.
• Lower feed seawater pumping requirements.
Hybrid desalination systems are most appropriate for seawater desalination. In such a case, where purifying high seawater salt concentration can justify use of the more energy intensive thermal desalination systems rather than relying only on RO membrane systems, the economics of hybrid desalination systems can be attractive.
A commonly adopted design for a hybrid desalination plant coupled to a power plant is the so-called “classic scheme” (Fig. 19). In this scheme, the thermal plant’s heated coolant stream of seawater is fed (after de-aeration) into the RO plant. The advantages of the pre-heating of the feed into the RO plant are discussed later on.
Figure 19. Principle of a typical hybrid (MED/RO) plant coupled to a power source with backpressure steam turbine.
Two specific cases of hybrid systems, considered in India and the USA will be briefly presented here:
4.4.1. The Indian hybrid nuclear desalination plant
The advantages of hybrid desalination systems will be illustrated by a specific example: that of the hybrid MSF-RO system, coupled to the MAPS PHWR at Kalpakkam (India) as shown in Figure 20. [24, 25].
As one of the leading and oldest desalination processes, MSF is preferred due to its operational simplicity and proven performance. MSF is advantageous for large desalting capacities and high purity water, in particular where inexpensive thermal energy is available.
However, its installed cost and specific power consumption remain relatively high. Since the energy cost is high in India, an MSF system, with large GOR leading to lower water production costs, has been chosen.
57

Figure 20. Hybrid MSF-RO coupling to the PHWR at Kalpakkam (India).
Seawater desalination by RO has proved to be most economical as has been shown in the case studies from IAEA member States.
Because of the particular advantages of MSF and RO technologies, it is logical to consider that a hybrid MSF-RO system may lead to greater cost reductions in water costs.
The water costs from the Kalpakkam hybrid system are shown in Table 21.
It can be noted that the cost of desalted water depends on its quality. The product water quality from RO plant is about 350–500 ppm TDS and the water cost is 0.95 $/m3. The desalted water from MSF plant is of almost distilled quality (10 ppm TDS) and the water cost is higher (1.18 $/m3). The water from hybrid system is of 125–175 ppm quality and the water cost (1.10 $/m3) is in between RO and MSF. Hybrid system provides distilled quality water (10 ppm TDS) for the industries which require high quality, high value desalted water for their process requirement and better quality water for drinking purpose.
TABLE 21. COSTS OF DIFFERENT QUALITY WATERS IN THE HYBRID SYSTEM
Type of desalination process
Product quality (ppm)
Water cost ($/m3)
RO 350 - 500 0.95 MSF 10 1.18 Hybrid (MSF & RO) 125 - 175 1.10
58
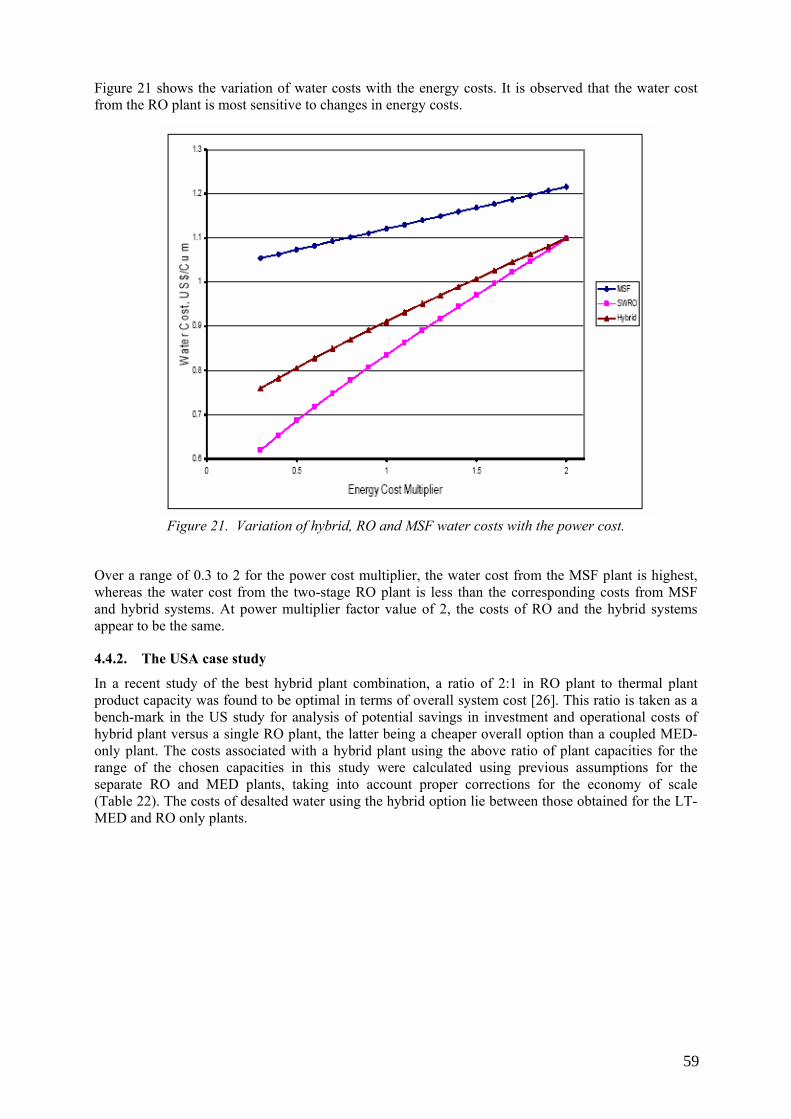
Figure 21 shows the variation of water costs with the energy costs. It is observed that the water cost from the RO plant is most sensitive to changes in energy costs.
Figure 21. Variation of hybrid, RO and MSF water costs with the power cost.
Over a range of 0.3 to 2 for the power cost multiplier, the water cost from the MSF plant is highest, whereas the water cost from the two-stage RO plant is less than the corresponding costs from MSF and hybrid systems. At power multiplier factor value of 2, the costs of RO and the hybrid systems appear to be the same.
4.4.2. The USA case study
In a recent study of the best hybrid plant combination, a ratio of 2:1 in RO plant to thermal plant product capacity was found to be optimal in terms of overall system cost [26]. This ratio is taken as a bench-mark in the US study for analysis of potential savings in investment and operational costs of hybrid plant versus a single RO plant, the latter being a cheaper overall option than a coupled MED-only plant. The costs associated with a hybrid plant using the above ratio of plant capacities for the range of the chosen capacities in this study were calculated using previous assumptions for the separate RO and MED plants, taking into account proper corrections for the economy of scale (Table 22). The costs of desalted water using the hybrid option lie between those obtained for the LT-MED and RO only plants.
59

TABLE 22. HYBRID RO/LT-MED (2:1) PLANT DESALINATION COSTS FOR A RANGE OF
PLANT PRODUCTION CAPACITIES.
Production capacity (m3/day): 100000 200000 300000
Initial capital investment ($): 1.105E+08 2.021E+08 2.872E+08
Annual costs ($/year):
Direct costs: 1.043E+07 1.908E+07 2.711E+07
Indirect costs: 4.173E+06 7.630E+06 1.084E+07
O&M (+spare parts): 2.086E+05 3.815E+05 5.422E+05
Membrane replacement: 3.226E+05 6.404E+05 9.630E+05
Chemicals: 1.622E+06 3.244E+06 4.867E+06
Power: 3.325E+06 6.635E+06 9.960E+06
Steam: 1.402E+06 2.846E+06 4.248E+06
Labor: 7.000E+05 9.899E+05 1.212E+06
Total annual costs: 2.219E+07 4.144E+07 5.975E+07
Unit product cost in terms of production ($/m3): 0.608 0.568 0.546
Unit product cost in terms of capacity ($/m3/day): 221.85 207.21 199.16
There are several sources of cost savings: supply and discharge of seawater and concentrate system, the advantages of pre-heating the feed to the RO plant, and blending of RO and MED plant product streams. Other minor cost savings result from reduction in water post-treatment needs and overall increase in plant reliability.
Savings in seawater supply and discharge systems
The reduced need in pumping water directly from the sea to the RO plant due to partial feed supply from the MED plant can reduce overall cost of the supply and discharge system by about 25% for a 2:1 ratio RO to MED product water capacity. The intake and discharge systems amount to about 7% for both thermal and RO plants’ total direct capital costs [27]. Thus, overall savings in capital costs, if all savings are credited to the RO plant requirements, amount to nearly 2% of overall direct annual costs, or some $2.7 million in initial capital investment (more than $350 000/year) for a 200 000 m3/day total capacity hybrid plant.
Savings due to preheating of feed seawater to RO plant
Pre-heating the feed to the RO by blending fresh seawater with warm cooling seawater discharge from the MED plant will allow for an increase in the overall flux through the membranes on one hand (by about 2–3% per 1oC), and an increase in product water (permeate) salinity (by about 1.25% per 1oC). Thus, careful attention must be given to the ratio of feed seawater blending to achieve desired product quality and to not exceed the known manufacturer set limit of 45oC for RO membrane performance. This 45oC temperature limit is especially significant during summer months, when inlet seawater temperature is expected to increase relative to the average year-round seawater temperature.
The cost savings due to a reduction in membrane surface area requirements (higher flux) and related RO plant infrastructure amount to about 10% of initial capital cost. The reduction in membrane
60

surface area can reduce the number of membranes required by over 10% and, thus, reduce overall membrane replacement costs by a similar amount.
Savings due to blending of MED and RO product water
By blending RO plant product water with MED plant product water, membrane longevity can be increased. Membrane replacement can be delayed by up to 7 years in some cases by allowing product water from the RO plant to have higher salinity due to the possibility of blending this poorer quality water with the high purity MED product water (<10 ppm TDS). Thus, the TDS concentration of product water from the RO plant can readily be allowed to exceed the acceptable 500 ppm limit. Increase in membrane longevity from 5 years (the expected lifetime) to 10 years can decrease membrane replacement costs in a 200 000 m3/day hybrid plant by as much as 50%. This, in turn, will decrease total annual costs by about 3%.
Summary of main cost reductions using the hybrid configuration
If all the cost savings due to the use of the hybrid thermal/RO plant configuration are credited to a the hybridized RO plant, the cost of water will be, on an average, 11% lower with the hybridized RO plant as compared to a stand-alone RO plant of the same capacity (see Table 23).
TABLE 23. WATER COST COMPARISON BETWEEN THE MED/RO HYBRID AND OTHER OPTIONS FOR A TOTAL PLANT CAPACITY OF 200000 m3/day (133000 m3/day RO + 67000 m3/day LT-MED).
Annual costs ($/Year) Hybrid RO+MED
Stand-alone RO (with savings*)
Hybrid (without savings)
Stand-alone RO (without savings)
Direct costs: 1.908E+07 1.109E+07 2.059E+07 1.261E+07
Indirect costs: 7.630E+06 4.437E+06 8.235E+06 5.042E+06
O&M (+parts): 3.815E+05 2.219E+05 4.118E+05 2.521E+05
Membrane replacement costs: 6.404E+05 6.404E+05 1.601E+06 1.601E+06
Chemicals: 3.244E+06 2.158E+06 3.244E+06 2.158E+06
Power costs: 6.635E+06 5.113E+06 6.635E+06 5.113E+06
Steam costs: 2.846E+06 N/A 2.846E+06 N/A
Labour costs: 9.899E+05 8.073E+05 9.899E+05 8.073E+05
Total annual costs ($/Year) 4.144E+07 2.447E+07 4.455E+07 2.758E+07
Unit product cost in terms of production ($/m3) 0.568 0.504 0.610 0.568
Unit product cost in terms of capacity ($/m3/day) 207.21 183.99 222.76 207.37
* “savings” refers to the savings in desalination costs due to hybridization.
Additional benefits of the hybrid option: discharge and multiple water products
Two benefits s are discussed here: the ability to combine the discharge from the desalination plant with that of the power plant and the ability to produce a range of water products.
61

Combined discharge — more than just a cost benefit
The concentrate discharge from the desalination plant can be blended with the discharge from the power plant in order to eliminate the need for capital investment in a separate discharge system. As was mentioned above, a discharge system can contribute up to 5% of the total initial investment costs of a desalination plant. If the total initial capital investment in a 100 000 m3/day capacity desalination plant is around $100 million, about $5 million will be the cost of the discharge system. However, as was discussed above, this additional cost is essentially eliminated by combining the power plant and water plant discharge streams. Moreover, the ability to dilute the desalination plant discharge also aids in alleviating some environmental concerns regarding the outlet temperature and composition of the concentrate. The concentrate, which can have a TDS concentration of more than double that of the feed stream (in seawater desalination) can be diluted by more than 70 times with the discharge from the power plant. Thus, the salt concentration of the combined discharge stream is essentially that of the feed-water, with no significant adverse effects on the environment [28].
Multiple water products
The hybrid plant allows for supply of multiple grades of water streams for multiple clients. The thermal plant can supply high purity (<10 ppm TDS) water, while the RO plant can supply water of potable quality (<500 ppm TDS). The blending of the streams can yield a range of water qualities for various industrial as well as agricultural applications. In the case of hydrogen production using steam electrolysis, high quality steam and water are needed, which can readily be supplied or augmented by the co-located thermal desalination plant component of the hybrid plant.
4.5. EXTRACTION OF VALUABLE MATERIALS AND MINIMIZATION OF BRINE DISCHARGE
Seawater usually contains sixty elements from the Periodic Table. The brine, rejected by a desalination unit, is a concentrate of all compounds contained by seawater. However, some of the elements are very scarce on land and/or are very expensive. There is thus a strong motivation for extracting these materials.
Current practice in countries using large-scale desalination is to reject brine back to the sea. Increasing ecological objections are now being voiced since this rejection may lead to a degradation of local fauna and flora unless the concentrated brine is rejected far from the cost, which would unnecessarily increase overall costs. Extraction of materials and subsequent brine conditioning for surface storage would therefore be also another advantage for these integrated desalination plants, making them more environmentally friendly.
Yet another advantage of this extraction will be the reduction of overall costs of the cogeneration nuclear desalination systems since the benefits of a third product would be added.
The methods of material extraction are still in preliminary stages of development but significant progress has been reported [29].
4.5.1. Selection of materials
Not all the materials contained in seawater are worth extracting unless there are specific motives (e.g. extraction of uranium). As an important first step, a short list of interesting materials was therefore established.
The selection criteria used for this list were:
• Economic criteria: current price, estimated evolution of the market, production cost and abundance on land.
• Physicochemical criteria: formulation of the element in seawater, concentration, reactivity.
• Technical criteria: evaluation of extracting methods from a complex aqueous system.
The resulting list is constituted by eight different elements (Table 20). The products would either allow large-scale production of useful materials such as fertilizers or the extraction, in lesser amounts,
62

of some rare materials with high added values and often used in high technologies. In Table 12, annual production calculations are based on the hypothesis of a plant equipped with reverse osmosis desalination system for the la Skhira site in Tunisia, producing about 168 000 m3 per day. The recovery ratio of this process equipment is supposed constant at 40% with an availability factor of 91%. The total seawater consumption of the plant is therefore 420 000 m3 of seawater per day.
It should be noted that most of the elements in Table 24 (e.g. Na, K, Rb, Cs) are from the same chemical family, the alkali metals. These elements have therefore similar properties. One can thus imagine their separation from the rest of the mixture by a common extraction process. Magnesium can also be assimilated to this family because it is an alkaline-earth with approaching properties.
TABLE 24. LIST OF VALUABLE ELEMENTS, WHICH COULD BE EXTRACTED FROM THE BRINE REJECTED BY A REVERSE OSMOSIS PLANT PRODUCING 168 000 m3/day
Element Seawater content (mg/L)
Available quantity (t/year)
Major use Selling price ($/kg)
Value (M$/year)
Na 1.05 104 1.5 106 Fertilizers 0,13 180 Mg 1.35 103 1.9 105 Alloys 2,8 525 K 3.8 102 5.3 104 Fertilizers 0,15 8 Rb 1.2 10-1 17 Laser 79 700 1300 P 7.0 10-2 10 Fertilizers 0.02 0.0
In 2.0 10-2 3 Metallic protection 300 0.9
Cs 5.0 10-4 0.07 Aeronautics 63 000 4 Ge 7.0 10-5 0.01 Electronics 1700 0.02
4.5.2. Principle of operation of the final method of extraction
After several other attempts, investigating the sequence of extractions, a final global process was established allowing the separation of each element one after another and finishing with sodium chloride.
In fact the global extraction protocol comprises two phases:
Phase 1: Preliminary evaporation to reduce work volumes. Addition of Alum to precipitate phosphates.
Addition of HCl to lower pH up to 3.
Extraction of caesium by the Calixarenes.
Extraction of indium (mixed with gallium) by a mixture of organic acids.
Phase 2: –Recovery of Rb on resins.
Complete evaporation (solar still or other).
Recovery and pulverisation of Carnallite crystals + precipitation of impurities.
Eventual Recycling of saturated liquid.
Chlorination of the solid: gaseous HCl current, 1 bar, 90°C.
Degassing of GeCl4.
63

These two phases are currently being refined to reduce further the extraction costs. Some of the reactions mentioned require further R&D for the comprehension of phenomena involved. Efforts are being made to concentrate the rejected brine by a combination of RO, Once-through MSF and MED processes.
The economic evaluation of the protocol described above is in progress but already it is evident that the addition of a third product to the nuclear desalination complex would only lead to further cost reductions of the overall system.
64

5. RESULTS AND DISCUSSION OF CASE STUDIES FROM MEMBER STATES As mentioned in Section 1.1, 10 countries are currently participating in the CRP entitled, Economic Research on, and Assessment of Selected Nuclear Desalination Projects and Case Studies. All have submitted final reports which are summarized as Annexes 1 to 10 in this TECDOC.
These site specific techno-economic studies are summarized in Table 25. Because of the importance of the researches undertaken, salient results from Annexes 1 to 9 are briefly discussed as follows.
TABLE 25: SUMMARY OF THE TECHNO-ECONOMIC SITE-SPECIFIC STUDIES IN MEMBER STATES
CRP Participating
Country Organization Site
Reactor(s) and/or fossil energy based
source
Desalination process(es)
Argentina National Atomic Energy Commission
Several sites in Latin America, in particular
Puerto Deseado
CAREM; gas turbine, combined cycle (CC) RO
China INET, Tsinghua University
Possibly a small or medium sized town
in Shandong provinceNHR-200 HT-VTE MED,
LT-HTE-MED
Egypt Nuclear Power Plants Authority
Generic feasibility study 1000 MW(e) PWR MSF, MED, RO
France CEA, Cadarache Atomic Centre La Skhira (Tunisia) 8
PWR-900, AP-600, GT-MHR, PBMR;
CC-600
MED, RO, ROph
India Bhabha Atomic Research Centre
Trombay and Kalpakkam
Cirus Research Reactor at Trombay,
MAPS PHWR at Kalpakkam
LT-MED, hybrid MSF-RO
Republic of Korea
Korea Atomic Energy Research Institute
Generic study for a coastal town SMART MED
Pakistan Pakistan Atomic Energy Commission
Karachi CANDU Reactor at Karachi (KANUPP) MED
Russian Federation
OKBM Engineering Generic study
Barge mounted concepts based on Kl-T40 and RITM reactors; GT-MHR
MED, RO
Syrian Arab Republic
Atomic Energy Commission of Syria
Al-Hamidiah PBMR MED, MED/VC, RO
USA Argonne National Laboratory
Coastal and inland sites PWR and fossil LT-MED, RO and
MED/RO hybrid
4. In the context of Franco-Tunisian study: the TUNDESAL project, carried out jointly with CNSTN, STEG and SONEDE of Tunisia.
65

As can be observed, all participants (except Argentina) have studied the MED or MED/VC systems. Egypt and India have also considered MSF. With the exception of China, Republic of Korea and Pakistan, all participants have also retained RO in their studies. Hybrid systems based on MSF/RO or MED/RO have been considered by India and the USA. (Section 4). France has also investigated the innovative variant of the RO system, with preheating of the feed-water (the ROph system).
Almost all the well known reactor types have been selected: PWRs of various power sizes, ranging from 125 MW(e) (CAREM) to 1000 MW(e) (French and American PWRs), the PHWR and the CANDU, the new generation high temperature reactors such as the GT-MHR and the PBMR, providing virtually free heat for desalination. (Section 4).
China has opted for the dedicated heat producing reactor, the NHR-200 coupled to both LT-MED and VT-MED.
Three countries have made comparisons of the performances of the nuclear desalination systems with the corresponding fossil fuelled systems, in particular the gas turbine combined cycle system, CC. China has compared the desalination costs of the NHR-200 based systems with the official water prices and the cost of steam from existing fossil fuelled systems.
5.1. SUMMARY OF THE SITE SPECIFIC CASE STUDIES The water production costs from a given nuclear (or fossil fuelled) desalination system are a complex function of several parameters, notably the power cost, the discount and interest rate, the water plant production capacity, the combined power and water plant availability and the water plant specific base cost.
As all these parameters have been specific to each study, it is difficult to arrive at general conclusions regarding a given power plant and desalination technology.
One may however, obtain a range of values for different combinations.
5.1.1. MSF based systems The corresponding cases studied are the 1000 MW(e) PWR +MSF by the NPPA for a site in Egypt and the 220 MW(e) PHWR +MSF for the Kalpakkam site by BARC (India).
Calculations have been made with DEEP-3 in the Egyptian study and with DEEP-3 and BARC’s own method in the Indian study.
The basic assumptions and the input data used in the two studies are summarised in Table 26.
The levelized power costs in the two cases are respectively 0.045 and 0.045 (and 0.04) $/kW(e).h
The water costs for the PWR + MSF system, producing 140 000 m3/day of desalted water, is 1.48 $/m3 at 8% discount rate.
That from the PHWR+ MSF system, producing 15 000 m3/day, is 1.28 $/m3 as calculated by DEEP-3 and 1.18 $/m3, as calculated by BARC’s own method.
66

TABLE 26. BASIC ASSUMPTIONS AND INPUT DATA USED IN THE EGYPTIAN AND
INDIAN STUDIES FOR MSF PLANTS, COUPLED TO NUCLEAR REACTORS.
Parameter NPPA (Egypt BARC (India)
DEEP-3 BARC’s own method
Cost reference date 1997 2005 2005
Interest/discount rate (%) 8 7 7
Plant capacity (m3/day) 50 000 to 150 000 15 000 15 000
Feed temperature (°C) 21 30 30
Feed TDS (ppm) 38 500 35 000 35 000
Specific construction cost of nuclear plant ($/kW(e))
1000 MW(e) PWR
2000
220 MW(e) PHWR
1700
220 MW(e) PHWR
1700
Levelized cost of electricity ($/kW.h) 0.045 0.045 0.04
Average specific cost of the water plant ($/m3/day) 1000 1435 1000
5.1.1.1. Sensitivity studies Both NPPA and BARC have performed detailed sensitivity studies for various parameters. Some of the variations are graphically illustrated in Figures 22 to 24.
Egypt India
Figure 22. Variation of water cost from an MSF plant in the Egyptian and Indian studies.
00.20.40.60.8
11.21.4
5 6 7 8Discount Rate (%)
Wat
er c
ost (
$/cu
m)
DEEP
67

Essentially the two figures show the same tendency. In the Egyptian case, water cost increases from about 1 to 1.8 $/m3 as discount rate is increased from 4 to 10 %. In the Indian case, the corresponding variation is from 1 to 1.3 $/m3 as discount rate is increased from 5 to 8 %
The water cost is significantly affected as the nuclear fuel cost (Egyptian case) or the power cost (Indian case) are increased. These variations are shown respectively in Figures 23 and 24.
Figure 23. Variation of MSF water cost as a function of specific fuel cost (Egyptian case).
Figure 24. Variation of MSF water cost as a function of power cost (Indian case).
5.1.2. MED, MED/VC based systems With the exception of Argentina, the MED system has been retained by all the other participants to the CRP. One country (Syrian Arab Republic) has used the variant with a mechanical vapour compression stage. China has coupled two such systems (HT-VTE-MED and LT-HTE-MED) to its dedicated, heat only reactor NHR-200.
Because of the large number of case studies, the spread in the input data and site conditions is much greater than for the MSF systems. Some representative site-specific parameters and input data are summarised in Table 27.
0
1
2
3
4
0.04 0.07 0.09 0.1 0.11Cost of power ($/kWh)
Wat
er c
ost (
$/cu
m)
DEEPBARC
Capacity: 15000cu m/day, Int: 5%Discount: 8%
68
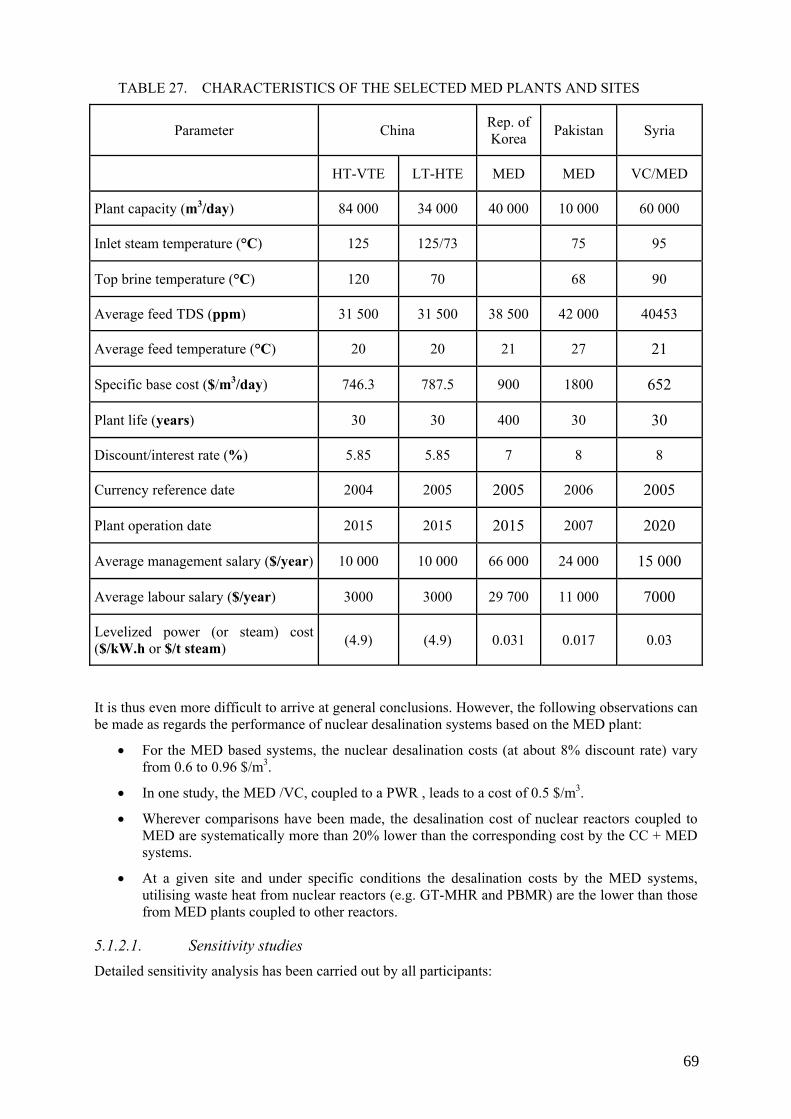
TABLE 27. CHARACTERISTICS OF THE SELECTED MED PLANTS AND SITES
Parameter China Rep. of Korea Pakistan Syria
HT-VTE LT-HTE MED MED VC/MED
Plant capacity (m3/day) 84 000 34 000 40 000 10 000 60 000
Inlet steam temperature (°C) 125 125/73 75 95
Top brine temperature (°C) 120 70 68 90
Average feed TDS (ppm) 31 500 31 500 38 500 42 000 40453
Average feed temperature (°C) 20 20 21 27 21
Specific base cost ($/m3/day) 746.3 787.5 900 1800 652
Plant life (years) 30 30 400 30 30
Discount/interest rate (%) 5.85 5.85 7 8 8
Currency reference date 2004 2005 2005 2006 2005
Plant operation date 2015 2015 2015 2007 2020
Average management salary ($/year) 10 000 10 000 66 000 24 000 15 000
Average labour salary ($/year) 3000 3000 29 700 11 000 7000
Levelized power (or steam) cost ($/kW.h or $/t steam) (4.9) (4.9) 0.031 0.017 0.03
It is thus even more difficult to arrive at general conclusions. However, the following observations can be made as regards the performance of nuclear desalination systems based on the MED plant:
• For the MED based systems, the nuclear desalination costs (at about 8% discount rate) vary from 0.6 to 0.96 $/m3.
• In one study, the MED /VC, coupled to a PWR , leads to a cost of 0.5 $/m3.
• Wherever comparisons have been made, the desalination cost of nuclear reactors coupled to MED are systematically more than 20% lower than the corresponding cost by the CC + MED systems.
• At a given site and under specific conditions the desalination costs by the MED systems, utilising waste heat from nuclear reactors (e.g. GT-MHR and PBMR) are the lower than those from MED plants coupled to other reactors.
5.1.2.1. Sensitivity studies Detailed sensitivity analysis has been carried out by all participants:
69

• Thus for example, for an MED plant coupled to a PHWR (Pakistan study), a ± 30% variation in discount rate leads to a variation of about 16 % in the water cost.
• However, a 30% variation in total plant production capacity leads to a reduction of only 0.3 % in water cost.
• The total integrated plant availability has a pronounced effect on the water costs. As shown in Figure 25, by increasing the total water plant availability from 52% to 84% (variation of 32%), the water cost reduces from 1.33 to 0.91 $/m3 (about to 32%).
0.8
0.84
0.88
0.92
0.96
1
1.04
1.08
1.12
1.16
1.2
1.24
1.28
1.32
1.36
1.4
0.5 0.54 0.58 0.62 0.66 0.7 0.74 0.78 0.82 0.86 0.9 0.94 0.98
Total Water Production Availability
Wat
er C
ost (
$/m
3)
Figure 25. Sensitivity of water cost to total water production availability (Pakistan).
• Water plant specific base costs have also an important effect on the MED water costs. Thus, in the Pakistani study when the specific base cost is increased by 30%, the water cost increases by 18% (see Figure 26). In the Chinese study, the same variation leads to an increase of about 8 to 9 % in the water costs from the LT-MED and HT-MED systems.
0,8
0,83
0,86
0,89
0,92
0,95
0,98
1,01
1,04
1,07
1,1
1,13
1,16
1,19
1200 1290 1380 1470 1560 1650 1740 1830 1920 2010 2100 2190 2280 2370
Water Plant Specific Base Cost ($/m3/day)
Wat
er C
ost (
$/m
3)
Figure 26. Sensitivity of water cost to water plant specific base costs (Pakistan).
70

• When the plant life time is decreased from 30 years to 20 years (US study), the water costs are increased by about 9%.
5.1.3. RO nuclear desalination systems
The input data and site characteristics, as used in the case studies, are presented in Table 28.
TABLE 28. CHARACTERISTICS OF SELECTED SEAWATER RO PLANTS AND SITES
Parameter Argentina Egypt France Syria USA
Plant capacity (m3/day) 48 000 140 000 48 000 180 000 60 000
Average feed TDS (ppm) 34 000 38 500 38 500 38 500 27 500
Average feed temperature (°C) 15 21 21 21 25
Specific base cost ($/m3/day) 900 800 900 800 900 to 1100
Plant life (years) 20 30 25 20 20
Discount/interest rate (%) 6 8 8 8 7
Currency reference date 2005 1998 2006 2005 2005
Plant operation date 2011 2005 2020 2020 2010
Average management salary ($/year) 66 000 6 000 20 000* 15 000 -
Average labour salary ($/year)
Average salary ($/year) 29 700 2400 7000* 7000
50 000
Levelized power cost ($/kW.h) 0.038 0.045 0.037 0.03 0.03
* Under conditions at la Skhira, Tunisia.
Analysis of the detailed results presented in Annexes 1, 3, 4, 5, 8 and 9, shows that:
• For the RO based systems, desalination costs vary from 0.5 to 0.94 $/m3.
• In all cases where the nuclear desalination costs are compared with those from the CC plant + RO, it is observed that the nuclear desalination costs are much lower.
5.1.3.1. Sensitivity studies As for MSF and MED systems, desalination costs by RO are also sensitive to variations in key variables such as the interest and discount rates, the power consumption, the power cost, the plant availability and the specific base cost:
• Thus for example, when the discount rate is varied from 6 to 10% in the Argentina study or from 5 to 9% in the US study, the water costs are increased respectively by 26 % and 21%.
• Similarly, when the power cost is doubled from 0.04 to 0.08 $/kW.h (US study), the water cost is increased from 0.0545 to 0.651 $/m3.
71

• An increase in the power plant availability from 60% to 90% (Egyptian study) leads to a decrease in water cost from 0.81 to 0.65 $/m3. Similarly, when the total plant availability is increased from 70% to 90 % (US study), the water cost is reduced by 9%.
5.2. HYBRID SYSTEMS See Section 4 for the results on hybrid systems.
5.3. FLOATING COGENERATION PLANTS In the Russian study (Annexe 8), floating nuclear desalination complexes, based on the Utilization of the KLT-40 and RITM reactors , derived from Russian ice-breaker nuclear plants, have been proposed for desalination with MED and RO systems.
The main component of the floating nuclear desalination complex is a completely independent floating power unit with two KLT-40 (and/or RITM-200) plants, equipment and systems, which are designed to supply heat and power to coastal sites.
The technical characteristics of such systems are presented in Table 29.
TABLE 29. TECHNICAL CHARACTERISTICS OF FPU OF FLOATING COGENERATION PLANT WITH KLT-40С AND RITM-200.
Characteristics Value
RP type KLT-40С RITM-200
Number of units 2 1
FPU thermal power, (MW) 2×150 210
TGP maximum electric power, (MW), including:
- cogeneration turbine
- backpressure turbine
- condensing turbine
2×35.0
-
2×38.5
-
26.0
55.0
Electric power output to TGP grid, (MW), including:
- cogeneration turbine with the extraction of 62.5 (Gcal/h) from the turbine
- backpressure turbine with the extraction of 125 (Gcal/h) from the condenser
- condensing turbine
2×20.5
-
2×36.0
-
22.5
51.5
Desalination cost evaluations have been made with the two reactors coupled to MED and RO. These values are then compared to those obtained from coal fired plants. Results, as obtained by DEEP-3 and OKBM’s own method, called TEO-Invest are presented in Table 30.
72

TABLE 30. DESALINATION COSTS WITH KLT-40 AND RITM-200 FLOATING NUCLEAR
DESALINATION SYSTEMS.
KLT-40S RITM-200 Characteristics
MED RO MED RO
Output plant capacity to water, (m3/day) 100 000 100 000 100 000 100 000
Electric power output to the grid, (MW) 2×18.2 2×27.2 18.5 35.5
Quality of produced water, (ppm) 25 320 25 320
Specific capital costs PU, ($/kW) 3450 3450 3450 3450
Specific capital costs DP, (($/(m3/day)) 2300 1320 2300 1320
Prime cost of electric power (cent/kW⋅h)
- As per IAEA DEEP-3
- As per TEO-INVEST
4.58
4.64
4.58
4.64
4.08
4.15
3.81
3.85
Prime cost of desalinated water ($/m3)
- As per IAEA DEEP-3
- As per TEO-INVEST
0.878
0.890
0.809
0.800
0.791
0.830
0.724
0.735
TABLE 31. COMPARISON OF POWER AND DESALINATION COSTS FOR RITM-200 AND COAL FIRED PLANTS COUPLED TO MED AT DISCOUNT RATE OF 5% AND COAL PRICE OF 40 $/BBL (200 $/T)
Parameter RITM-200 Coal-based co-generation plant
Desalination plant capacity (m3/day)
100 000 100 000
Specific capital cost of power plant ($/kW(e))
3450 1800
Specific capital cost of MED plant ($/m3/day)
2300 2300
Power costs (cents/kW.h) 6.05 13.2
Water costs ($/m3) 1.317 1.942
These tables show that the desalination costs by the two floating nuclear desalination plants are comparable. Compared to a coal fired plant, these costs are about 32% lower.
73

5.4. TRANSPORT COSTS Not all coastal sites are close to the population centres in need of water . Furthermore, it is likely that a nuclear desalination complex be situated away from such population centres. The real cost of desalted water must, therefore, include the cost of transportation.
In the context of the CRP, two case studies on transport costs have been made: the one from Syrian Arab Republic has already been included in Annex 9 (see Section A10.7). The other has been reported by the NPPA, Egypt [30].
The main assumptions used in the calculations are as follows:.
The pipe cost in the Egyptian study, based on the Egyptian market values, was 160 $/m for a pipe diameter of one meter.
In the Syrian study, the pipe costs were derived for several pipe diameters as shown in Figure 29 (Figure 10 in Annex 9).
Figure 29. Pipe costs as a function of pipe diameter (Syrian study).
The profiles of the transport systems considered in the two studies are shown in Figures 30 and 31.
Figure 30. Profile of the transport system in the Egyptian study [29].
74

Figure 31. Profile of the transport system in the Syrian study (Annex 9).
5.4.1. Method of calculation
Referring to figure 30, point 1 represents the water production point and point 2 the consumption point.
Applying energy equation between points (1) and (2) yields
Z1 + P1/γ + V12/2g + Hp - H loss = Z2 + P2/ γ + V2
2/2g
Where,
Z potential energy
P/γ fluid energy
V2/2g kinetic energy
HP pump head
H loss total head loss in the system (pipes, valves and coupling)
Head losses in pipes can be found by using Darcy's Equation [30].
H loss =ƒ (L/D). (v2/2g)
Where:
ƒ friction factor
L length of the pipe
D pipe inside diameter
V average fluid velocity
g acceleration of gravity
Losses in valves and fittings can be calculated from:
H loss = K V2/2g
Where, K is the constant of proportional and called the K factor of the valve and fittings.
The above hydraulic model can then be solved with the help of the well known software, the Engineering Equation solver.
5.4.2. Results and discussion
The total cost of transport ($/m3/km) for the two studies for discount rates of 6, 8 and 10 % are presented in Table 32, along with some other economic results.
75

TABLE 32. TRANSPORT COSTS FOR THE EGYPTIAN AND SYRIAN SITES
Egyptian study Syrian study
Discount rate (%)
Capital cost ($/m3/km)
O&M costs ($/m3/km)
Fuel cost ($/m3/km)
Total costs ($/m3/km)
Total cost*
($/m3/km)
6 0.00105 0.000424 0.000835 0.00105 0.00183
8 0.00128 0.000424 0.000835 0.00128 0.0024
10 0.00152 0.000424 0.000835 0.00152 0.00298
* calculated from Table 12, Annexe 8, by dividing the cost by a pipe length of 231.7 km
Obviously, because of the site-specific conditions, the two costs do not agree but they permit to obtain a range of the transport costs which should be added to the desalted water production costs.
5.5. GENERAL CONCLUSIONS FROM THE CASE STUDIES Further harmonization in the case studies was made possible by the availability of DEEP-3 files from three studies (Argentina, Egypt and France). To get a general idea of water costs in these three countries, calculations were made with the following main assumptions:
• Currency reference year = 2006
• Initial year of operation = 2020
• Interest rate= discount rate = 8%
• Power plant life time = 40 years
• Feed-water salinity = 38 500 ppm
• Feed temperature = 21°C
• Water plant life time = 25 years
• Water plant construction lead time = 16 months
• Water plant nominal capacity = 48 000 m3/day
• Optional unit size = 12 000 m3/day
• Base unit cost = 900 $/ m3
Results for PWRs, coupled to RO and MED systems are shown in Table 30
TABLE 30. HOMOGENISED DEEP-3 CALCULATIONS
Water cost ($/m3) Country PWR + RO PWR + MED Argentina 0.738 - Egypt 0.727 0.886 France 0.611 0.887
These results show that:
• PWR + RO costs vary from 0.611 to 0.738 $/m3, depending upon the power costs of the PWR.
• At least in two cases, the PWR + MED costs are nearly the same, about 0.88 $/m3.
76

• With identical economic hypotheses, used for three cases, DEEP-3 results show that PWRs, coupled to RO would lead to a desalination cost of 0.6 to 0.74 $/m3, depending upon the PWR power costs.. Corresponding cost for MED would be about 0.88 $/m3.
• Under these conditions, desalted water cost from RO is from 16 to 31% lower than from the MED plant
77

6. CONCLUSIONS
6.1. MAIN CONCLUSIONS This TECDOC summarizes the site-specific studies of nuclear desalination systems, undertaken by nine Member States participating in the IAEA CRP entitled, Economic Research on, and Assessment of, Selected Nuclear Desalination Projects and Case Studies.
The main objectives of the CRP were to: (1) investigate the economic competitiveness of the nuclear desalination systems under specific conditions of selected sites in member States, (2) to identify innovative methods and techniques leading to further reduction in the cost of nuclear desalination systems and (3) to refine, update and validate economic evaluation methods and tools for desalination cost evaluations.
The contributions to the CRP, presented as annexes to this TECDOC, have clearly shown that in all three respects, the CRP has achieved its objectives:
• Results of calculation have shown that nuclear desalination systems are not only technically feasible but economically attractive options in varying site conditions and with a variety of nuclear reactor concepts.
• The cost of desalination by nuclear options, as compared to the most economical fossil fuelled based option, the gas turbine combined cycle plant (CC), could be in some cases 30 to 60% lower, depending upon the gas prices used. The overall conclusion is that nuclear options will be competitive as long as gas prices remain above 150 $/toe and discount rates are below 10%.
• Through numerous discussions during the CRP meetings and the studies carried out by the participating Member States, the software package DEEP (version 3) has been considerably improved.
• The results of the CRP demonstrate that the methodology used in the DEEP software may become an international and consistent approach for desalination cost evaluations of both fossil and nuclear energy based systems. However, more work is required to benchmark and validate DEEP results.
• Several approaches have been proposed and studied in participating countries to reduce the cost of nuclear desalination. The first of these is the use of waste heat from nuclear reactors for desalination. Thus for example, the waste heat rejected by the PWRs to the heat sink through their condensers can be profitably used to preheat the feed-water for RO systems (the ROph process) resulting in from 7 to 15% cost reductions as compared to traditional RO systems. Similarly, the waste heat from the pre-cooler and intercooler exchangers of the new generation HTRs, such as the GT-MHR and the PBMR, can lead to drastic cost reductions in MED systems coupled to such reactors. A third approach to cost reduction would be the use of hybrid thermal/RO systems leading to a considerably enhanced flexibility of the combined system to meet the varying water demands and in which the overall cost of the system is significantly lower. Yet another approach to increase the overall efficiency of the desalination systems would be to extract strategic and valuable materials from the concentrated brine rejected by the desalination plants. This would simultaneously render nuclear desalination systems relatively more environmentally friendly since no discharges would be made directly to the sea.
• Nuclear desalination costs are strongly influenced by such parameters as the interest and discount rates, the total plant availability, the power costs, the specific water plant base costs etc. In general, it can be stated that RO costs would be in the range of 0.5 to 0.9 $/m3. Desalination costs from thermal systems such as the MED would be slightly higher being in the range of 0.6 to 0.96 $/m3. It should be recalled that the product water salinity by thermal desalination plants is much lower (about 30 ppm) as compared to 300 to 500 ppm from RO
78

plants. The real choice of one over the other would thus be a complex problem, depending upon the specific industrial, agricultural and potable water needs of the countries.
• The water transport costs are an essential part of the global picture. Judging from the results of two reported studies it can be stated that they would be in the range of 0.1 to 0.2 cents/m3/km. These costs should be added to the above production costs to obtain the real cost of desalted water.
The foremost challenge facing nuclear desalination is that the countries suffering from scarcity of water are, generally speaking, not the holders of nuclear technology and of the infrastructure for product water distribution. The utilization of nuclear energy in those countries will require infrastructure building and other institutional arrangements for financing, liability, safeguards, security. It will also require preparation for the fuel cycle including upstream and downstream. The concept of multi-national or international fuel cycle centres, as is proposed by the IAEA, could be used to assure a supply of nuclear material to legitimate would-be users with the control of sensitive parts of the nuclear fuel cycle.
6.2. COUNTRY SPECIFIC CONCLUSIONS
6.2.1. Argentina (CAREM +RO system for the Porto Deseado site)
• Nuclear desalination is a possible solution to Latin America’s ongoing water scarcity. The use of nuclear energy for fresh water as well as energy production is, from an economic point of view, a more competitive option than other energy sources using fossil fuels.
• CAREM NPP, coupled to RO is considered an attractive, economic and technically feasible option, as well as a safe and reliable alternative for fresh water production from seawater and energy production in Puerto Deseado, Argentina, and other cities dealing with problems derived from fresh water and energy scarcity, which represent a barrier to their development. In this regard, this option has other advantages related to greenhouse gases emission, reliability due to its high load factor and others due to its innovative design compared to other fossil fuel energy based systems such as the CC + RO.
6.2.2. China (NHR-200 + MED systems for some costal locations)
• Water cost produced by integrated NHR-200 desalination plant may be about 0.75 $/m3 for NHR200 + HT-VTE-MED and 0.79 $/m3 for NHR200 + LT-HTE-MED respectively.
• The capital cost, electricity consumption cost of the MED water plant and nuclear fuel cost have leading effect for further reduction in water production cost of the desalination plant using NHR reactor coupled with MED process.
• It is indicated in the case study, by comparison of the steam costs produced by NHR, oil-fired boiler and gas-fired boiler, that the steam cost produced by NHR-200 has good economic competitiveness.
6.2.3. Egypt (PWR-1000 + MSF, MED and RO for a coastal site)
• The water cost (at 8% discount rate) with the MSF plant is highest, 1.48 $/m3, compared to 0.89 and 0.65$/m3 with the MED and RO plants.
• The sensitivity analysis has shown that all sensitivity parameters are affecting the water production costs. The variation of the discount rate and water availability has the largest impact on the unit production cost.
• Water transport cost, in Egyptian conditions, is about 0.253 cents/m3/km
• The results of the case study clearly indicate the economic interest of nuclear desalination systems for the Egyptian site.
79

6.2.4. France and Tunisia (PWR, GT-MHR and PBMR + MED, RO, for the la Skhira site in
Tunisia)
• Power and desalination costs were obtained with four nuclear reactors (PWR-900, AP-600, GT-MHR and PBMR) and compared to the gas turbine, combined cycle plant, CC-600. All these energy sources were coupled to MED and RO desalination processes, operating in the co-generation mode.
• In all conditions, the four nuclear options lead to much lower power and desalination costs as compared to those by the CC-600 plant, provided the gas prices remain above 150 $/toe. Thus for example, at 8 % discount rate and a gas price of 60 $/bbl:
The MED desalination cost by the PWRs such as the PWR-900 and the AP-600 are respectively 46 and 42 % lower than the corresponding cost by the CC-600 plant.
The lowest costs with the MED plants are obtained by the GT-MHR and the PBMR, utilising virtually free waste heat. Compared to the cost by the CC-600 + MED system (at gas price of 60$/bbl), these reactors coupled to MED lead to desalination costs which are respectively 62 % and 56 % lower.
Compared to the CC-600 + RO system, the corresponding desalination costs by the PWR-900 + RO and AP-600 + RO are respectively 31 and 29 % lower.
• With all the energy sources, desalination costs with the RO process are lower than the corresponding costs with the MED plant.
6.2.5. India (PHWR + hybrid MSF/RO, for the Kalpakkam site demonstration plant)
• Expertise is available in India for the design of large size MSF and RO plants for seawater desalination and LT-MED technology for utilization of low grade and waste heat for producing pure water from saline water.
• Cost of desalted water is a strong function of specific energy consumption and power tariff. It is more evident in the case of RO. Power tariff being a local constant, water cost can be brought down mainly by reducing the energy consumption. In the case of MSF, low grade/ waste heat utilization or minimizing the power loss due to coupling would help in achieving lower cost of production.
• In the case of RO, higher flux membranes and more efficient energy recovery systems would reduce the specific energy consumption. Scale–up has got a stronger influence on water cost of MSF, compared to that of RO. The water cost in MSF is 24% higher than that in RO however it produces better quality water. Permeate water quality from RO deteriorates with time leading to replacement of membrane. In a hybrid system, it is possible to maintain the drinking water quality for a long time by adding the distillate from the MSF in desired proportion, thereby extending the effective life of membranes.
6.2.6. The Republic of Korea (SMART + MED, for a demonstration plant)
• The SMART reactor, coupled with MED process, has been considered as the most probable alternative for nuclear desalination in the Republic of Korea. However, since there is no practical experience in the construction of small-sized advanced reactors, it is difficult to obtain reliable data for reactor construction as well as coupling part (e.g. intermediate loop) for SMART.
• In the meantime, it is expected that the economic competitiveness of SMART would be highly improved through the continuous R&D activities and learning effect.
• Water cost for the SMART + MED system, producing 40 000 m3/day is 0.63 $/m3 at 7% discount rate.
80

• Taking into consideration the uncertainties in the major parameters, the sensitivity analysis was performed with respect to the parameters such as interest rate, electricity cost, plant availability, nuclear fuel cycle cost, and capital costs.
• In the sensitivity analysis, discount rate was identified to have the greatest impact on the water cost. The economics of the nuclear desalination by using SMART appeared to be promising.
6.2.7. Pakistan (existing CANDU reactor, KANUPP + MED, for Karachi region)
• Discount/interest rate plays an important role in the economics of a desalination project. With a 30 % decrease in interest/discount rate, water cost decreases to about 16 %.
• For small size plants the effect of capacity on the water cost is not appreciable. However, for large size plants (> 100 000 m3/day) an appreciable reduction in water cost with the increase in capacity is observed.
• Combined water and power plant availability factor is another important parameter which appreciably affects the water cost. With a 30 % increase in availability factor the water cost decreases to about 18 %.
• Water plant base cost also appreciably affects the water cost. With a 30 % decrease in water plant base cost the water cost decreases to about 18 %.
• Average management salary has no significant effect on the water cost.
• The use of nuclear heat to produce potable water from seawater is an attractive option for oil price even below 45 $/barrel.
6.2.8. Russian Federation (KLT-40S, RITM-200, GT-MHR + MED, RO for a coastal site)
Floating nuclear power desalination complex (FNDC) with the KLT-40S reactors, coupled with
MED, has been considered as the most probable option for nuclear desalination in Russia.
Cost of desalinated water produced by fossil-fuel desalination complexes was evaluated, and
competitiveness of FNDC based on KLT-40S and RITM-200 was determined and compared with
fossil-fuel analogs.
Both of nuclear options lead to lower power and desalination cost as compared to fossil fuelled
systems under the following conditions:
if oil cost more than 90-120 $/t (for oil cogeneration plant, specific capital costs equal 650-1300 $/kW in prices as of 2006);
if coal cost more than 60-80 $/t (for coal cogeneration plant, specific capital costs equal 1000-1400 $/kW in prices as of 2006).
6.2.9. Syrian Arab Republic (PBMR + MED/VC, RO, for Damascus region)
• Water cost for PBMR +MED/VC system is 0.52 $/m3, compared to 0.61 $/m3 when the power cost from the PBMR is replaced by that from a local, fossil fuelled system.
• Water cost for PBMR +RO system is 0.63 $/m3, compared to 0.67 $/m3 when the power cost from the PBMR is replaced by that from a local, fossil fuelled system.
• Water transport cost, at 8% discount rate, is about 0.185 cents/m3/km.
• The total potable water cost (including water transport cost and desalination cost) would be in the range of 0.85 $/m3 to 1.40 $/m3.
81

6.2.10. USA (PWR + MED, RO, and hybrid MED/RO)
• The preliminary feasibility of cogeneration of water and power using a nuclear reactor as an energy source has been demonstrated by the study. The specific implementation of the discussed cogeneration options is to be evaluated in detail for its economic and technical feasibility as a follow-up step to this current analysis, which does indicate that nuclear desalination can readily be considered as a competitive alternative to conventional, fossil fuel-powered cogeneration plants
• In addition to providing a range of water products of various qualities and operational flexibility, the hybrid RO/LT-MED plant option offers water costs that are very close to those of the stand-alone RO seawater plant.
• The overall energy consumption for the hybrid plant (on the basis of total equivalent MW(e) and assuming a 30% power plant thermal efficiency) is, on average, 60% lower than for the stand-alone LT-MED plant. Thus, savings in energy costs are the main contributor to the lower overall product water costs of the hybrid plant.
• The main advantage of a nuclear power plant coupled to a desalination plant over a fossil-fuel fired plant is the low fuel cycle cost in the former. This is the main reason for the low steam costs when supplied to an MED or a hybrid membrane/thermal desalination plant. On the other hand, some additional capital investment may be needed for a nuclear cogeneration plant due to the required isolation loop coupling a thermal or a hybrid plant to the power plant, which is not needed for a coupled fossil fuel-fired plant.
• The safety and environmental considerations of a nuclear desalination complex do not pose significant economic or health risks. Some provisions need to be made in order ensure that when the desalination plant as a heat sink is shut down or operated in partial load, there will be a backup heat sink available to accept rejected heat from the power plant and prevent power plant shutdown.
• There is a need to perform a detailed socio-economic study that will assess the true amount of water to be produced by desalination methods.
6.3. FUTURE INVESTIGATIONS Organisations from Member States participating in the CRP identified several possible areas of research and investigations to be pursued in the future:
• Further assessment of the possible benefits of cogeneration of water and electricity to the nuclear installation.
• Continued development and validation of DEEP-3 models through benchmarking and comparison with the actual costs and technical characteristics of operating installations.
• Comprehensive studies of socio-economic and environmental aspects related to both nuclear energy and desalination.
• Pursuit of nuclear desalination cost reduction strategies through innovations.
• Establishment of links between water and energy production and hydrogen production.
82

REFERENCES
[1] INTERNATIONAL ATOMIC ENERGY AGENCY, Optimization of the Coupling of Nuclear Reactors and Desalination Systems, IAEA-TECDOC-1444, IAEA, Vienna (2005).
[2] J. MARGAT, Water for the People of the Mediterranean: Situation and Perspectives, MAP Technical Report Series No 158, UN Programme for the Environment/Action Plan for the Mediterranean (UNEP/MAP), Athens (2004).
[3] INTERNATIONAL ATOMIC ENERGY AGENCY, Status of Nuclear Desalination in the IAEA Member States, IAEA-TECDOC-1542, IAEA, Vienna (2006).
[4] J. L. MEERGANZ VON MEDEAZZA, Direct and Socially-Induced Environmental Impacts of Desalination, Desalination, 185, 1483–1496 (2005).
[5] J.J. SADHWANI, et al, Case Studies on Environmental Impact of Seawater Desalination, Desalination, 185, 1427–1434 (2005).
[6] UNEP- MEDITERRANEAN ACTION PLAN MED POL, Seawater Desalination in the Mediterranean: Assessments and Guide Lines, MAP Technical Reports Series No 139,: UN Programme for the Environment/Action Plan for the Mediterranean (UNEP/MAP), Athens (2003).
[7] S. NISAN, et al, Seawater Desalination with Nuclear and Other Energy Sources; The EURODESAL project, Nuclear Engineering & Design, 221, 251–275 (2003).
[8] C.ALESSANDRONI et al, Safety Aspects of Nuclear Desalination with Innovative Systems; the EURODESAL Project, Embedded International Topical Meeting, ANS Annual Meeting, 9–13 June 2002, Hollywood, Florida, USA.
[9] A. NAVIGLIO, et al, Preliminary Safety Assessment of the Coupling of a GT-MHR with a Desalination Plant, EURODESAL, D2.1 Final Report, June 2002, 5th Framework Program, European Commission, Brussels (Belgium).
[10] T. YOUNOS, The Economics of Desalination, Journal of Contemporary Water Research and Education, 132, 39–45 (2005).
[11] INTERNATIONAL ATOMIC ENERGY AGENCY, Thermodynamic and Economic Evaluation of Co-production Plants for Electricity and Potable Water, IAEA-TECDOC-942, IAEA, Vienna (1992).
[12] M. METHNANI, Recent Model Developments for the Desalination Economic Evaluation Program DEEP, International Desalination Association Congress, Singapore (2005).
[13] M. WILF, Evaluation of DEEP software (RO section), Consultancy report (2004) (Available from I. Khamis, NPTDS, IAEA, Vienna).
[14] H.M. ETTOUNEY et al, Evaluating the Economics of Desalination, Chemical Engineering Progress, December (2002).
[15] N. BOUZGUENDA et al, Financing of Nuclear Desalination projects in Developing Countries, European Desalination Society, EUROMED 2006 Conference, Montpellier, France (2006).
[16] S. NISAN, et al, Inter-Regional Collaborative Nuclear Desalination Studies by France and Tunisia, Int. J. Nuclear Desalination, Vol 1,No. 3, 308–324 (2004).
[17] T. M. PANKRATZ, Advances in Desalination Technologies, Nuclear Desalination: Challenges and Options; IAEA-WONUC International Conference: Nuclear Desalination- Challenges and Options, Marrakech, Morocco (2001).
[18] S. DARDOUR, et al, Utilization of Waste Heat from GT-MHR and PBMR Type of Reactors for Nuclear Desalination, European Desalination Society, EUROMED 2006 Conference, Montpellier, France (2006).
[19] INTERNATIONAL ATOMIC ENERGY AGENCY, Current Status and Future Development of Modular High Temperature Gas Cooled Reactor Technology, IAEA-TECDOC-1198, IAEA, Vienna (2001).
[20] PBMR Pty Company, website: http://www.pbmr.com. [21] J.R. HUMPHRIES, et al, An Advanced Reverse Osmosis Technology for Applications in
Nuclear Installations, Embedded International Topical Meeting, ANS Annual Meeting, 9–13 June 2002, Hollywood, Florida, USA.
83

[22] S. NISAN, et al, A New Method for the Treatment of a Reverse Osmosis Process with
Preheating of the Feed-water, Desalination, 182, 485–49 (2005). [23] P.K. TEWARI, et al, LTE Desalination Utilizing Waste Heat from a Nuclear Research
Reactor, Desalination, 150, 45–49 (2002). [24] S.T. PANICKER, et al, Influence of Feed Quality on Seawater Reverse Osmosis Performance,
Int. J. Nuclear Desalination, 2 (2006). [25] P.K. TEWARI, Nuclear Energy for Water Security, Atoms for Peace: An International
Journal, 1, 199–205 (2006). [26] THE MIDDLE EAST DESALINATION RESEARCH CENTRE AND ADAM TECHNICAL
AND ECONOMIC SERVICES, LTD, (ISRAEL), Hybrid Desalination Systems-Effective Integration of Membrane, Thermal Desalination and Power Technology, Report No, 97-AS-008a (2001).
[27] N.M. WADE, Desalination Plant Development and Cost Update, Desalination, 136, 3–12 (2001).
[28] R. EINAV et al, Environmental Aspects of a Desalination Plant in Ashkelon, Desalination, 136, 79 (2001).
[29] J. Le DIRACH, et al, Extraction of Strategic Materials from the Concentrated Brine Rejected by Integrated Nuclear Desalination Systems, Desalination, 182, 451-462 (2005).
[30] A.A. EL DESSOKY et al, Water Transport System Package, CRP Report IAEA, (2005). (Available from I. Khamis, NPTDS, IAEA).
[31] United Nations Environment Programme/Mediterranean Action Plan, UNEP/MAP/MED POL: Seawater Desalination in the Mediterranean: Assessment and Guidelines, MAP Technical Reports Series No. 139, UNEP/MAP, Athens (2003).
[32] INTERNATIONA ATOMIC ENERGY AGENCY, Safety Aspects of Nuclear Plants Coupled with Seawater Desalination Units, IAEA-TECDOC-1235, IAEA, Vienna (2001).
84

ABBREVIATIONS
AP-600 Advanced Pressurized Water Reactor, 600 MW(e)
bbl Barrel of oil (or equivalent barrel of oil)
BWR Boiling Water Reactor
CC Combined cycle
CC-600 A combined cycle plant producing 600 MW(e)
CRP Coordinated research project
DC Developing countries
DEEP Desalination economic evaluation program
GHG Green house gas(es)
GOR Gain output ratio
GT-MHR Gas turbine, modular helium cooled reactor
HP High pressure
HTR High temperature reactor
HT-VTE High temperature, vertical tube evaporator (MED system)
INDAG International nuclear desalination advisory group, IAEA
LP Low pressure
LTE Low-temperature evaporator (MED system)
LT-HTE Low-temperature, horizontal tube evaporator (MED system)
LMFR Liquid metal cooled fast reactor
MAPS Madras atomic power station (India)
MED Multi-effect distillation desalination process
MF Micro filtration
MHTGR Modular, high temperature, gas-cooled Reactor
MPa Mega Pascal
MSF Multi-stage flash desalination process
MW(e) Mega watt electric
MW(th) Mega watt thermal
85

NDDP Nuclear desalination demonstration plant (Project)
NF Nano filtration
NHR Nuclear heat producing reactor
NHR-200 NHR, producing 200 MW(th)
O&M Operation and maintenance
PBMR Pebble-bed modular reactor
PHWR Pressurized heavy water reactor
PV or PVsc Solar photo-voltaic system
PWR Pressurized water reactor
RO Reverse osmosis desalination process
ROph Reverse osmosis, with preheating of the feed-water
SMR Small and medium sized reactor
TDS Total dissolved solids
t/h Tonne/hour
UF Ultra filtration
WEC Wind energy converter
86

ANNEXES: CRP CASE STUDIES BY PARTICIPATING MEMBER STATES


ANNEX 1 ARGENTINA
ASSESSMENT OF NUCLEAR DESALINATION PROJECTS IN ARGENTINA AND LATIN AMERICA S. M. Gómez de Soler, L. B. Ramilo, A. Castellano, N. Coppari, C. Cabrera Atomic Energy National Commission, Argentina
ABSTRACT This case study presents the results of the power and desalination cost evaluations for the Porto Deseado site in Argentina. However, the evaluation has included regional studies for plant localization, selection of an appropriate desalination technology and its preliminary engineering. A sensitivity study has also been carried out to determine how the water specific cost is affected by different economic variables. The nuclear desalination system investigated is based on the CAREM integrated PWR, currently under development by CNEA, coupled to the RO process. It is concluded that:
The CAREM NPP + RO system leads to a desalination cost (at 6% discount rate and 60$/bbl gas price), which is 28% lower than the water cost from the equivalent Gas Turbine, Combined Cycle Plant (CCGT) coupled to RO.
The water costs are among 0.63 and 0.92 U$S/m3/d, according to electricity cost, interest rate and water plant capacity.
If the cost of the fossil fuel is more than 18 U$S/BOE, the cost of the water using as energy source to CAREM NPP is lower than the one using the CCGT.
CAREM NPP, coupled to a Desalination Plant with Reverse Osmosis (RO) is thus considered an attractive, economic and technically feasible option, as well as a safe and reliable alternative for fresh water production from seawater and energy production in Puerto Deseado, Argentina, and other cities.
A1.1. INTRODUCTION The availability of plenty of good quality water resources is essential for human life. From a global perspective, if human population and industrialization keep growing, there will be a scarcity of fresh water sources for sure. By the year 2025, 1.8 billion people will be living in regions or countries suffering from total lack of water and, moreover, two thirds of the world’s population will be facing problems related to high or moderate water scarcity. Considering that 97 percent of the earth’s water is saltwater from the oceans, seawater desalination is a promising option for supplying drinking water.
All the water desalination technologies currently used around the world require energy such as heat or electricity. Therefore, nuclear energy for both electricity and fresh water production becomes attractive. In addition, this option is technically feasible and it is also a safe alternative to fossil fuel power plants, which emit greenhouse gases. Furthermore, Argentina is developing a small nuclear power plant called CAREM, which we believe can be used as an energy source for water desalination.
Latin America, and particularly Argentina, has an extensive coastal area with populations lacking fresh water, representing an important restriction for its socioeconomic development [1-3]. Figure 1 shows some of these regions.
89

Figure 1. Latin-American regions facing water scarcity.
A1.2. OBJECTIVES It has been the objective of this study to make an evaluation of cost comparison between nuclear energy (CAREM NPP) and fossil fuel energy (particularly natural gas combined cycle or CC) for a selected desalination process. This evaluation has included regional studies for plant localization, selection of an appropriate desalination technology and its preliminary engineering. A sensitivity study has also been carried out to determine how the water specific cost is affected by different economic variables.
A1.3. ASSUMPTIONS A1.3.1. SITE A region on the central coast of the Argentinean Patagonia was selected for this evaluation. It includes the coasts of Rio Negro and Chubut Provinces and the northern coast of Santa Cruz Province. The representative sites in this region are four cities: San Antonio Oeste (Río Negro Province); Puerto Madryn (Chubut Province); Comodoro Rivadavia (Chubut Province) and Puerto Deseado (Santa Cruz Province). The data studied for these cities has proven that: there is no aquiferous underground with fresh water, rainfalls are insufficient, there is no surface fresh water (rivers, lakes), fresh water is transported from big distances, local climate is called "Arid Patagonic" and electric energy is provided by the Patagonic Interconnected System (regional), with a 132 kW electric transmission line. The offer is of 774MW where 2/3 come from hydro power plants and 1/3 from thermal power plants [1,2,3].
Particularly, the results of the study show that Puerto Deseado has a severe scarcity of water. However, it has many possibilities for industrial growth. Regarding the energy supply, Puerto Deseado is connected to the Patagonic Interconnected System with an electric line of 132 kW from Pico Truncado to Puerto Deseado. This city is situated at the end of this line. In order to increase the reliability of electric supply, it would be very important that the city had its own power plant.
Industrial activities, based on fishing, such as fish processing and cold-storage, and other activities, such as trade and tourism, represent the most important income of the province and a surplus of electricity would mean a way of development. Recent data reveal that the installation of a desalination plant and a power plant in Puerto Deseado may be an appropriate solution for the fresh water scarcity problem in the area. The relevant parameters of Puerto Deseado have been collected to carry out the evaluation [1,2]. Figure 2 shows the localization of Puerto Deseado in Argentina.
Islands of the Caribbean Sea
Coastal area of Venezuela
Dry-Pacific hydrographic system
The central coast of Argentinian Patagonia
90

Figure 2. Puerto Deseado localization.
A1.3.2. DESALINATION TECHNOLOGY AND PLANT SPECIFICATIONS
Different desalination technologies have been considered in order to compare the advantages and disadvantages for each of them, [1,2,4,5] These and other characteristics are important for planning and studying the site conditions:
RO was thus retained as the most appropriate technology for the case study because:
• RO allows using modular units making the plants more flexible. This characteristic is important for the selected site. As Puerto Deseado is a small city, the operation startup of the facility will be possible with only one module. In case of demand increase, it can be covered by adding subsequent modules.
• RO has high recovery rate, high availability, low energy consumption, simple operation and needs little supervision.
• Developments in materials’ technology, facility operations and process control for RO processes have helped the improvement of the efficiency and decrease of production costs.
• RO has a very flexible relation between power and water production. This characteristic interconnection represents an advantage when considering the production of potable water and energy.
• Argentina has previous experience in operating small RO units.
Estimations of the plant processing capacity has been based on two types of consumption. First, the amount of drinking water needed by the existing local population, and second the expected amount of water needed in case more industries would settle around the city if there was more water available for these economic activities. Furthermore, estimations of population and industry growth up to year 2030 have been taken into account for possible future water demands. Therefore, considering the modular characteristic of the RO technology plant and the estimations for human and industrial annual water requirements, a capacity of 12 000 m3/day of freshwater production is suggested during the initial period, reaching up to 48 000 m3/day depending on the demand as population and industry grow [1].
As regards the parameters determined for the process, previous studies about operating parameters and the site’s parameters led us to the results as shown in Table 1. Figure 3 shows a block diagram of the principal operations and processes involved.
Puerto Deseado on the central coast of
Argentinian Patagonia
91

Seawater intake and final fresh water composition is shown in Table 2. As separation of salt from water is almost complete, salinity level is comparatively low (<250 ppm), suitable for human consumption or industrial use. Table 3 shows the amounts of chemical reagents (kg/year) involved in the different circuits held in the plant. The estimated electrical energy consumption for the production is 3.8 kW.h/m3.
Figure 3 shows a simplified flow diagram of the plant.
Figure 3. Desalination plant block diagram.
TABLE 1. TECHNICAL PARAMETERS OF THE DESALINATION PLANT
Design parameters Value
Seawater intake TDS,(mg/L) 34 000
Seawater intake, (m3/day) 26,600
Brine TDS , (mg/L) 62 000
Brine, (m3/day) 14 600
Fresh water, (m3/day) 12 000
Produced water salinity, (mg/L) 250
Recovery ratio (%) 40–50
Temperature of feeding water, (ºC) 15
Feed seawater source Beach wells
92

TABLE 2. CHARACTERISTIC WATER COMPOSITIONS
Ions (mg/L) Feed-water Permeate
K+ 399 2.1
Na- 10,784 51
Mg2+ 1,284 1.6
Ca2+ 412 0.5
Sr2+ 8 0.1
HCO3- 5,604 34.8
CO32- 160 0.002
Cl- 16,200 62.5
F- 6.8 0.02
SO42- 2,712 4.25
SiO2 0.4 0
TDS 34 000 156.9
pH 8.1 6.4
Figure 4. RO plant flow diagram.
93

TABLE 3. CONSUMPTION OF CHEMICAL REAGENTS
Products Value (103 kg/year)
Pre-treatment
Ferric chloride, 100% 113.3
Polymer, 100% 4.8
Sodium bisulphite, 100% 9.7
RO
Sulphuric acid, 98% 135.6
Cleaning RO – CIP
Sodium tri-polyphosphate, 100% 4.0
Sodium phosphate,100% 4.0
EDTA, 100% 4.0
Hydrochloric acid, 36% 4.0
Sodium hydroxide, 50% 0.8
Post-treatment
Sulphuric acid, 98% 78.0
Limestone, 100% 78.0
Lime, 100% 72.0
Sodium hypo-chlorite, 12.5% 37.3
Figure 5. CAREM reactor pressure vessel and primary system.
94

Figure 6. Containment and safety systems. 1- First shut-down system; 2- Second shut-down system; 3-Residual heat removal system; 4- Safety injection
system; 5- Suppression pool; 6- Containment; 7- Pressure relief system; A- reactor core; B- Steam generator; C- Secondary containment building
As regards the facility costs, the RO equipment investment will be of 13 100 000$ for a unit producing 12 000 m3/day, [1]. It includes transportation to the site, transportation insurance and harbor taxes. Again, regarding the production costs, cartridge filters replacement cost is estimated to be 0.0139 $/m3, membranes cost about 0.05 $/m3 and spare parts cost about 0.0256 $/m3. These costs were calculated taking into account the above mentioned amounts of reagents consumed in local prices.
A1.3.3. ENERGY SOURCES For this comparative evaluation, two alternatives have been selected as energy sources. The first one is the nuclear option using a CAREM reactor as the CNEA is reaching the completion of the development of this kind of nuclear power station (CAREM NPP). The second alternative is the fossil fuel option gas turbine combined cycle (CC), a large majority of which comprises Argentina’s electric power plants.
A1.3.3.1 Nuclear power plant
The CAREM [2, 6] design is based on an integrated light water reactor with enriched uranium fuel. It is an indirect cycle reactor with some distinctive features simplifying the design and also contributing to a higher safety level. The main design characteristics are: Integrated primary cooling system, primary cooling by natural circulation for lower power module and assisted circulation for high power, self-pressurized and passive safety systems. Figure 5 shows the Reactor Pressure Vessel - Primary System and Figure 6 the Containment and Safety Systems.
In short, the decision for this kind of reactor as the source of energy was based on its design advantages and because it is an Argentinean development. Being an innovative nuclear power plant, its important advantages are:
95
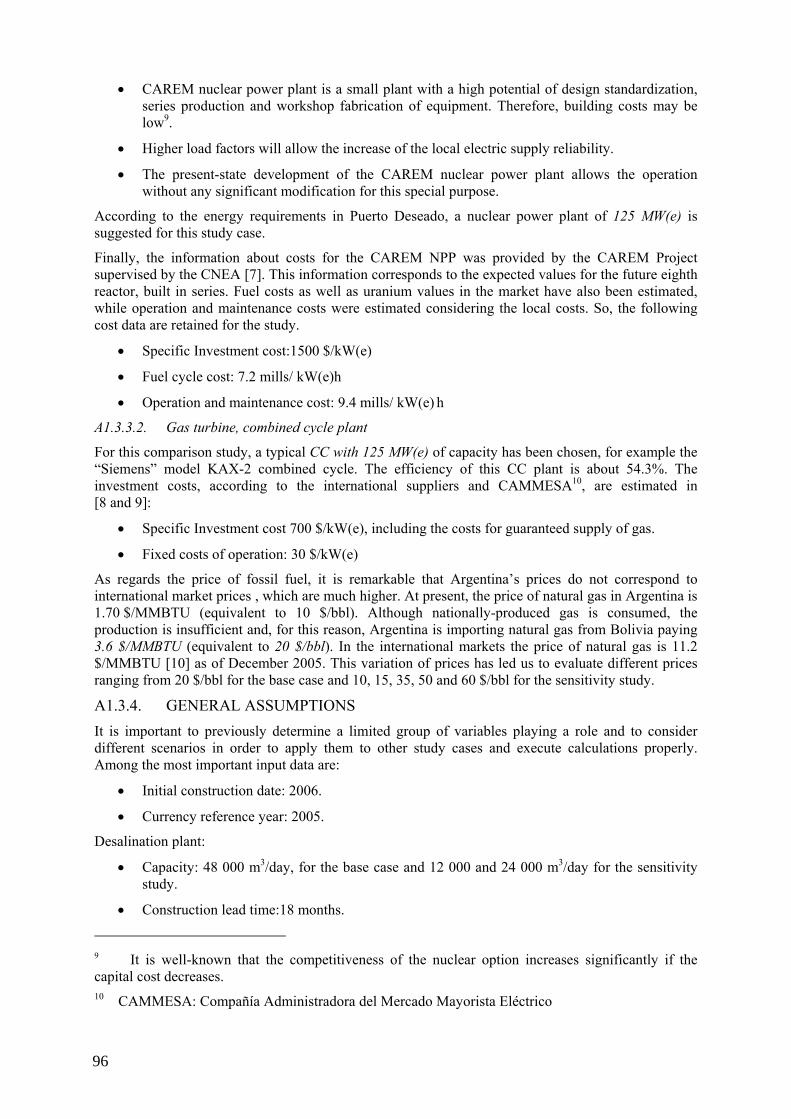
• CAREM nuclear power plant is a small plant with a high potential of design standardization, series production and workshop fabrication of equipment. Therefore, building costs may be low9.
• Higher load factors will allow the increase of the local electric supply reliability.
• The present-state development of the CAREM nuclear power plant allows the operation without any significant modification for this special purpose.
According to the energy requirements in Puerto Deseado, a nuclear power plant of 125 MW(e) is suggested for this study case.
Finally, the information about costs for the CAREM NPP was provided by the CAREM Project supervised by the CNEA [7]. This information corresponds to the expected values for the future eighth reactor, built in series. Fuel costs as well as uranium values in the market have also been estimated, while operation and maintenance costs were estimated considering the local costs. So, the following cost data are retained for the study.
• Specific Investment cost:1500 $/kW(e)
• Fuel cycle cost: 7.2 mills/ kW(e)h
• Operation and maintenance cost: 9.4 mills/ kW(e) h
A1.3.3.2. Gas turbine, combined cycle plant
For this comparison study, a typical CC with 125 MW(e) of capacity has been chosen, for example the “Siemens” model KAX-2 combined cycle. The efficiency of this CC plant is about 54.3%. The investment costs, according to the international suppliers and CAMMESA10, are estimated in [8 and 9]:
• Specific Investment cost 700 $/kW(e), including the costs for guaranteed supply of gas.
• Fixed costs of operation: 30 $/kW(e)
As regards the price of fossil fuel, it is remarkable that Argentina’s prices do not correspond to international market prices , which are much higher. At present, the price of natural gas in Argentina is 1.70 $/MMBTU (equivalent to 10 $/bbl). Although nationally-produced gas is consumed, the production is insufficient and, for this reason, Argentina is importing natural gas from Bolivia paying 3.6 $/MMBTU (equivalent to 20 $/bbl). In the international markets the price of natural gas is 11.2 $/MMBTU [10] as of December 2005. This variation of prices has led us to evaluate different prices ranging from 20 $/bbl for the base case and 10, 15, 35, 50 and 60 $/bbl for the sensitivity study.
A1.3.4. GENERAL ASSUMPTIONS It is important to previously determine a limited group of variables playing a role and to consider different scenarios in order to apply them to other study cases and execute calculations properly. Among the most important input data are:
• Initial construction date: 2006.
• Currency reference year: 2005.
Desalination plant:
• Capacity: 48 000 m3/day, for the base case and 12 000 and 24 000 m3/day for the sensitivity study.
• Construction lead time:18 months.
9 It is well-known that the competitiveness of the nuclear option increases significantly if the capital cost decreases. 10 CAMMESA: Compañía Administradora del Mercado Mayorista Eléctrico
96

• Lifetime: 20 years
• Availability: 90%
Feed-water
• Seawater salinity (TDS):34 000 ppm.
• Feed-water temperature: 15ºC
Energy plant:
• Construction lead time: CC: 36 months NPP: 60 months
• Lifetime: CC: 25years NPP: 40 years
• Availability: CC: 95% NPP: 90%
• Site-specific inlet air temperature: 12ºC
• Purchased electricity cost: 0.026 $/kW.h
• Fuel annual real escalation: Fossil fuel: 2%/year Nuclear: 0%/year
• Discount rate: 6%, for the base case and 8% and 10 % for the sensitivity studies.
• Interest rate: 6%, for the base case and 8% and 10 % for the sensitivity studies.
This preliminary evaluation excludes financing costs except interest during construction as well as local taxes. This is to facilitate the use of the results in different economic contexts and different countries.
A1.4. METHOD OF CALCULATION A1.4.1. POWER PLANT Calculations have been carried out by two methodologies: the DEEP-3 code and the method of chemical plant projects economic evaluation (IPEE). This method is regularly used by the Process Engineering Group (CNEA) for economic evaluations of chemical plants.
Power plant total construction costs
Calculations for construction costs have been based on each plant specific investment (in $/kW(e)) as described in sections 3.3.1 and 3.3.2. These values correspond to the so-called direct investments (equipment, equipment installation, instrumentation and installed controls, installed piping, installed electrical system, buildings including services, installed service facilities) and indirect investments (engineering and supervision, construction expense, contractor’s fee, contingency). Since these investments have been calculated without considering the characteristics of a particular site, other costs directly related to the location should be added. (yard improvements, land). The site total investment was obtained with the specific investment cost and the power plant capacity. IDC calculations were based on this total value, considering the interest/discount rate and the construction period with its investment schedule.
Energy production costs:
Annual production costs have been calculated by adding the fixed and variable operation and maintenance costs, insurance and fuel costs and annual capital fixed charges.
The annual fuel cost has been calculated by considering each power plant’s fuel consumption, respective fuel prices and applying a 2% annual real escalation to the fossil fuel plant, obtaining the levelized cost which includes the difference between the operation start-up year and the project reference year as well as the discount rate.
The annual capital fixed charge has been calculated by each plant’s total construction total cost, the estimated lifetime and the discount rate for each plant.
97

In the particular case for a nuclear power plant, the annual levelized decommissioning cost has been added to the costs described above.
A1.4.2. DESALINATION PLANT Calculations have also been carried out by both methodologies: the DEEP code and the IPEE method.
Starting from the equipment investment cost, where transportation costs are included as described in section A1.3.2, other capital direct costs have been calculated:
• Purchased-equipment installation.
• Instrumentation and control (installed).
• Piping (installed).
• Electrical (installed)
• Buildings (including services)
• Yard improvements and land
• Service facilities (installed).
• In-outfall cost (considering a 7% of interest for equipment investment).
Total direct costs have been obtained by adding the amount of equipment investment to the costs detailed previously. Indirect costs have been obtained from costs related to:
• Engineering and supervision.
• Constructive expense
• Contractor’s fee.
• Contingency.
• Start up costs.
.Total fixed-capital investment has been calculated by adding the direct costs and the indirect ones.
IDC have been calculated by the total fixed-capital investment, the construction period with its respective investment schedule and the interest rate. Total construction costs have been calculated by adding the construction period interests and the total fixed capital investment.
The annual water production has also been calculated and, together with the total construction costs, the specific investment cost was determined.
Costs for different production capacity desalination equipments (for example 24 000 and 48 000 m3/day) have been obtained by scaling up. This is in order to evaluate the different costs, as some equipments have to be duplicated to reach the capacity, others just have to increase their size and others already have a surplus for production.
Desalinated water production costs
Annual production costs have been obtained by adding the following:
• Management and administration labor costs.
• Operation, maintenance and laboratory labor costs.
• Annual insurance costs.
• Laboratory charges.
• Chemical reagents costs.
• Maintenance and spare parts costs.
• Safety and protection costs.
98

• Plant-overhead cost.
• Utilities’ costs.
• Levelized annual water plant fixed charge.
The corresponding costs have been calculated by considering the local prices in Argentina. The first two items have been calculated for personnel with average wages. The chemical reagents costs, transportation to Puerto Deseado and amounts have been calculated on local prices as indicated in section A1.3.2. Safety, protection and plant-overhead costs have also been estimated. Maintenance and spare parts costs have been calculated as cartridge filters and membrane replacement as indicated in section A1.3.2, while an additional cost should be calculated for other spare parts.
The most important cost to be estimated among the utilities is the energy total cost. The energy production cost has been calculated as described above, while the energy consumption has been calculated by considering the amount of energy involved in the desalination process and a small amount for other activities taking place in the plant and other utilities. Levelized annual water plant fixed charge has been calculated on total construction costs, discount rates and estimated lifetime for the plant.
Finally, the water cost (in $ /m3) has been calculated with the water production costs per year and the estimated water production per year.
A1.5. RESULTS AND DISCUSSION A1.5.1. BASE CASE The results are displayed separately for power plants in Table 4 and for desalination plant in Table 5.
The results show a great similarity between both calculation methods for energy and desalted water production costs. Although in some cases there are differences among the partial values, the final results are almost the same since the differences in the values of energy and water costs are within the calculation error, [11]. The cost of water decreases if a CAREM NPP is used as the source of energy instead of a CC plant, although the difference between them is minima. However, the differences in the energy production cost are slightly higher (≈7%), thus favoring the nuclear option. Section A1.5.2 discusses a sensitivity study analyzing the variables influencing the cost of energy and water production.
TABLE 4. CALCULATION OF POWER COSTS BY DEEP-3 AND IPEE MODELS
Parameter CC plant CAREM NPP
Input parameters DEEP IPEE DEEP IPEE
Electric power (MW(e)) 125 125 125 125
Purchased electricity cost ($/kW(e).h) 0.026 0.026 0.026 0.026
Specific capital investment ($/kW(e)) 700 700 1500 1500
Fossil fuel cost ($/bbl) 20 20 --- ---
Nuclear fuel cost ($/MW(e).h) --- --- 7.2 7.2
Interest and discount rates (%) 6 6 6 6
Thermal efficiency (%) 54 54 29 29
Operating availability (%) 95 95 90 90
99
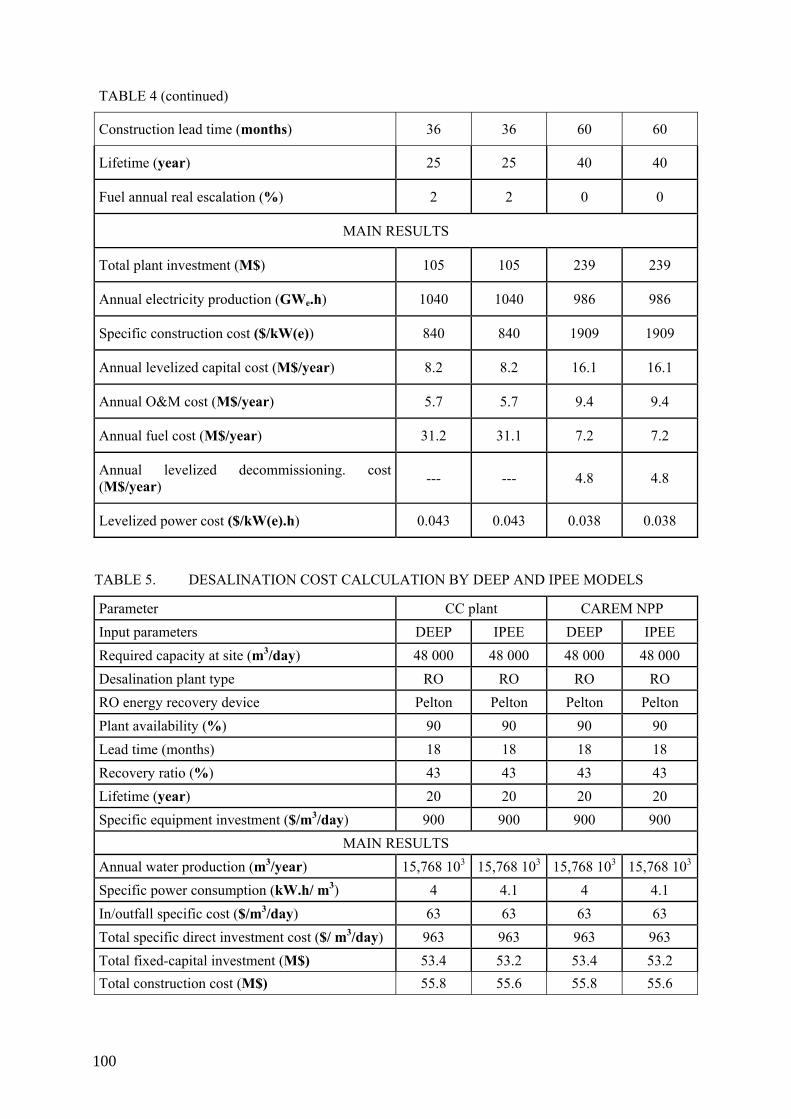
TABLE 4 (continued)
Construction lead time (months) 36 36 60 60
Lifetime (year) 25 25 40 40
Fuel annual real escalation (%) 2 2 0 0
MAIN RESULTS
Total plant investment (M$) 105 105 239 239
Annual electricity production (GWe.h) 1040 1040 986 986
Specific construction cost ($/kW(e)) 840 840 1909 1909
Annual levelized capital cost (M$/year) 8.2 8.2 16.1 16.1
Annual O&M cost (M$/year) 5.7 5.7 9.4 9.4
Annual fuel cost (M$/year) 31.2 31.1 7.2 7.2
Annual levelized decommissioning. cost (M$/year) --- --- 4.8 4.8
Levelized power cost ($/kW(e).h) 0.043 0.043 0.038 0.038
TABLE 5. DESALINATION COST CALCULATION BY DEEP AND IPEE MODELS
Parameter CC plant CAREM NPP Input parameters DEEP IPEE DEEP IPEE Required capacity at site (m3/day) 48 000 48 000 48 000 48 000 Desalination plant type RO RO RO RO RO energy recovery device Pelton Pelton Pelton Pelton Plant availability (%) 90 90 90 90 Lead time (months) 18 18 18 18 Recovery ratio (%) 43 43 43 43 Lifetime (year) 20 20 20 20 Specific equipment investment ($/m3/day) 900 900 900 900
MAIN RESULTS Annual water production (m3/year) 15,768 103 15,768 103 15,768 103 15,768 103
Specific power consumption (kW.h/ m3) 4 4.1 4 4.1 In/outfall specific cost ($/m3/day) 63 63 63 63 Total specific direct investment cost ($/ m3/day) 963 963 963 963 Total fixed-capital investment (M$) 53.4 53.2 53.4 53.2 Total construction cost (M$) 55.8 55.6 55.8 55.6
100

TABLE 5. (Continued) Specific construction cost ($/m3/day) 1162 1158 1162 1158 Annual levelized fixed charge (M$/year) 4.9 4.8 4.9 4.8 Management and administration cost (M$/year). 0.13 0.12 0.13 0.12 Operation, maintenance and laboratory labor costs (M$/year) 0.50 0.29 0.50 0.29
Annual insurance costs (M$/year) 0.53 0.46 0.53 0.46 Laboratory charges (M$/year) --- 0.064 --- 0.064 Chemical reagents costs (M$/year) 0.63 0.85 0.63 0.85 Maintenance and spare parts costs (M$/year) 1.42 1.53 1.42 1.53 Safety and protection costs (M$/year) --- 0.029 --- 0.029 Plant-overhead cost (M$/year) --- 0.040 --- 0.040 O&M costs (M$/year) 3.2 3.4 3.2 3.4 Annual utilities’ cost–electric power cost (M$/year) 2.8 2.8 2.3 2.4
Total annual required revenue (M$/year) 10.9 11.0 10.4 10.7 Total water cost ($/ m3) 0.69 0.70 0.66 0.68
A1.5.2. SENSITIVITY STUDIES Sensitivity studies on cost response to variations in the main factors have been conducted. Calculations have been made using both the DEEP code and the IPEE method.
Firstly, fossil fuel costs influence have been analyzed. As previously mentioned, this is a variable which has changed strongly lately. However, in Argentina it remains far below the international values despite the recent raises and the expectations of price increases related to import contracts with Bolivia in the near future. The results for the different fossil fuel prices are shown in Table 6. Figures 7 and 8 display the costs for the electric power and desalted water depending on the fossil fuel cost. The electric power and the desalted water costs using a CAREM NPP in the base case are also included. As observed, considering the fossil fuel price of about 18$/bbl, the cost of product water is observed to be lower than the one using a CC plant as energy source.
TABLE 6. POWER AND WATER COSTS FOR DIFFERENT FOSSIL FUEL PRICES
Fossil fuel costs ($/bbl) 10 15 20 35 50 60
Fossil fuel costs ($/MMBTU) 1.8 2.7 3.6 6.3 8.9 10.7
Power costs with CC
By DEEP ($/kW(e).h)
By IPEE ($/kW(e).h)
0.028
0.028
0.036
0.036
0.043
0.043
0.066
0.065
0.088
0.088
0.103
0.102
Water costs with CC
By DEEP ($/m3)
By IPEE ($/m3)
0.63
0.63
0.65
0.67
0.69
0.70
0.77
0.79
0.86
0.88
0.92
0.95
101
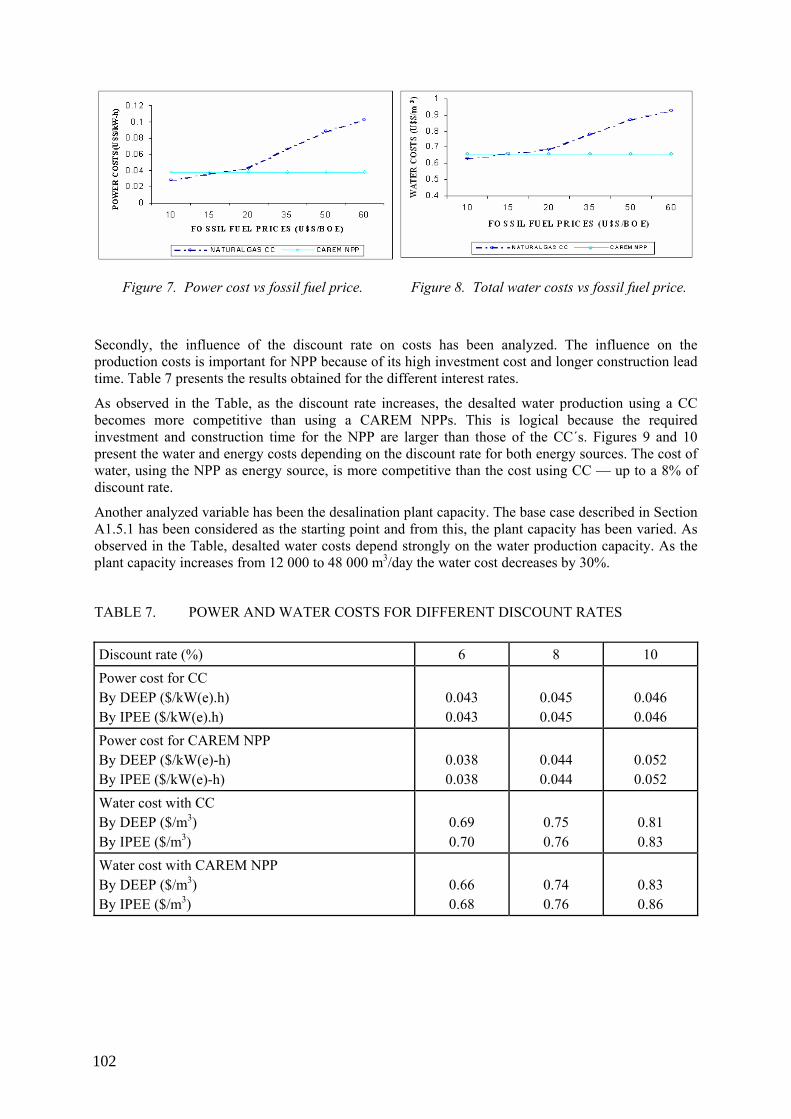
Figure 7. Power cost vs fossil fuel price. Figure 8. Total water costs vs fossil fuel price.
Secondly, the influence of the discount rate on costs has been analyzed. The influence on the production costs is important for NPP because of its high investment cost and longer construction lead time. Table 7 presents the results obtained for the different interest rates.
As observed in the Table, as the discount rate increases, the desalted water production using a CC becomes more competitive than using a CAREM NPPs. This is logical because the required investment and construction time for the NPP are larger than those of the CC´s. Figures 9 and 10 present the water and energy costs depending on the discount rate for both energy sources. The cost of water, using the NPP as energy source, is more competitive than the cost using CC — up to a 8% of discount rate.
Another analyzed variable has been the desalination plant capacity. The base case described in Section A1.5.1 has been considered as the starting point and from this, the plant capacity has been varied. As observed in the Table, desalted water costs depend strongly on the water production capacity. As the plant capacity increases from 12 000 to 48 000 m3/day the water cost decreases by 30%.
TABLE 7. POWER AND WATER COSTS FOR DIFFERENT DISCOUNT RATES
Discount rate (%) 6 8 10 Power cost for CC By DEEP ($/kW(e).h) By IPEE ($/kW(e).h)
0.043 0.043
0.045 0.045
0.046 0.046
Power cost for CAREM NPP By DEEP ($/kW(e)-h) By IPEE ($/kW(e)-h)
0.038 0.038
0.044 0.044
0.052 0.052
Water cost with CC By DEEP ($/m3) By IPEE ($/m3)
0.69 0.70
0.75 0.76
0.81 0.83
Water cost with CAREM NPP By DEEP ($/m3) By IPEE ($/m3)
0.66 0.68
0.74 0.76
0.83 0.86
102

Figure 9. Power cost vs discount rate.
Figure 10. Water costs vs discount rate.
TABLE 8. DESALINATION COST AS A FUNCTION OF DESALTING CAPACITY
Water plant capacity (m3/day) 12 000 24 000 48 000
Water cost with CC
By DEEP ($/m3)
By IPEE ($/m3)
0.90
0.90
0.79
0.79
0.69
0.70
Water cost with CAREM NPP
By DEEP ($/m3)
By IPEE ($/m3)
0.88
0.87
0.76
0.76
0.66
0.68
A1.6. CONCLUSION Nuclear desalination is a possible solution to Latin America’s ongoing water scarcity. The use of nuclear energy for fresh water as well as energy production is, from an economic point of view, a more competitive option than other energy sources using fossil fuels. Thus, the calculations have proved that, based on the international prices of fossil fuels, energy and water production costs utilizing a CAREM NPP fall below the costs compared to the ones utilizing a natural gas CC. Even in cases like Argentina, where gas price (10 $/bbl) is far below the international market values, the costs of water produced by both energy sources are quite similar.
The various sensitivity studies have proved that desalted water production coupled with a CAREM NPP happen to be competitive as fossil fuel prices rise up to 18 $/bbl, though this is still much lower the current international prices (60 $/bbl). The analysis of one of the variables, the discount rate, has shown that the value around which water production using a CAREM NPP becomes competitive is 8%. This value is compatible with international discount rates for large projects and services.. Obviously, water production cost decreases as the desalination plant's capacity increases.
Finally, the CAREM NPP and RO is considered an attractive, economic and technically feasible option, as well as a safe and reliable alternative for fresh water production from sea water and energy production in Puerto Deseado, Argentina, and other cities dealing with problems derived from fresh water and energy scarcity which represent a barrier to their development. In this regard, this option has other advantages related to greenhouse gases emission, reliability due to its high load factor and others due to its innovative design compared to other fossil fuel energy sources like natural gas CC.
0,020,025
0,030,035
0,040,045
0,050,055
0,06
6 8 10INTERES RATE %
POW
ER C
OST
S U
$S/k
W.h
NATURAL GAS CC CAREM NPP
0,500
0,550
0,600
0,650
0,700
0,750
0,800
0,850
6 8 10INTEREST RATE %
WA
TER
CO
STS
(U$S
/m3 )
NATURAL GAS CC CAREM NPP
103

• A small NPP, such as CAREM, coupled to a RO plant appears to be a good option for water
and energy production.
• Compared to the CC plant coupled to RO, the CAREM + RO system leads to a desalination cost (at 6% discount rate and 60$/bbl gas price), which is 28% lower
• The close agreement between the results obtained by DEEP and IPEE calculation methods is indeed very remarkable. All of results fall within the calculation method's error (less than 3%), and this stresses the reliability of the actualized version of calculation DEEP-3code.
REFERENCES [1] S.M. GÓMEZ DE SOLER, et al, IAEA CRP on: Economic Research on, and Assessment of,
Selected Nuclear Desalination Projects and Case Studies in Argentina and Latin America, Second Year Status Report, CNEA.C.RCN.IAV.010, March (2004).
[2] S.M. GÓMEZ DE SOLER, et al, Nuclear Desalination: A Possible Solution to Latin American Region's Ongoing Water Scarcity, International Conference on Innovative Technologies for Nuclear Fuel Cycles and Nuclear Power, IAEA, Vienna, June (2003).
[3] S.M. GÓMEZ DE SOLER et al, Nuclear Desalination, Science and Technlogy Day for Bringing Knowledge to the Community, La Plata, Buenos Aires, Argentina, November (2003), (in Spanish).
[4] L.B. RAMILO, et al, Water Desalination Technologies, XXIXth Scientific Meeting of the Argentinian Nuclear Technology Association, Buenos Aires, November (2002), (in Spanish).
[5] L.B. RAMILO et al, Water Desalination Technologies, review of the National Atomic Energy Commission,. N° 9/10, June (2003), (in Spanish).
[6] D. DELMASTRO, et al, CAREM: Advanced Argentinian Reactor, Symposium on Nuclear Energy: Challenge and Realities in Latin America, Buenos Aires (2001).
[7] JUAN BERGALLO, Bariloche Atomic Centre, National Atomic Energy Commission, Personal communication, June (2003).
[8] CAMESSA Company Report, Medium and Long Term Risks Evaluation for the Period 2004-2007, December (2003), (in Spanish).
[9] SIEMENS web site, http://www.industrial-turbines.siemens.com/en/gasturbine/combined/kax100/technicaldata.
[10] INO web site, http://www.ino.com. [11] M. S. PETERS, et al, Plant Design and Economics for Chemical Engineers. McGraw-Hill Inc.
Fourth Edition (1991).
In short it can be stated that:
104

ANNEX 2
CHINA
NUCLEAR SEAWATER DESALINATION BY USING THE NUCLEAR HEATING REACTOR, NHR-200 S.R. Wu, W. Zheng, Y. Zhang1
1Institute of Nuclear and New Energy Technology, Tshinghua University, China
ABSTRACT Economic research on, and assessment of, desalination project using nuclear heating reactor coupled with MED process was performed in this study. The investigated integrated nuclear desalination plant utilises the two proven technologies: NHR and MED process. Two coupling schemes (NHR+ LT-HTE-ME and NHR + HT-VTE-MED) were selected for the economic analysis. With reactor power of 200 MW(th), the desalination plants could respectively provide 120 000 or 160 000 m
3/d of potable water.
The updated software DEEP-3 is selected as the methodology to be used for the calculation of both power cost and water production cost in the case study. A sensitivity study, on most important parameters has been performed. Comparisons with alternate processes (reference steam prices from an oil fired boiler and reference water prices in Beijing city) have also been made. Results show that:
Water cost produced by integrated NHR-200 desalination plant may be about 0.75 $/m3 for NHR200 + HT-VTE-MED and 0.79 $/m3 for NHR200 + LT -MED respectively.
It is indicated in the case study, by comparison of the steam costs produced by NHR, oil-fired boiler and gas-fired boiler, that the steam cost produced by NHR-200 has good economic competitiveness
It is indicated that water cost produced by an integrated NHR-nuclear desalination plant is still relatively higher. If considering the high quality of the produced water, it could be reasonably acceptable
Investigations are being made to further reduce the desalted water costs.
A2.1 INTRODUCTION Some coastal locations and islands with small or medium population in China, have severe lack of both water and electricity. At the same time environment related questions regarding the use of fossil fuelled plants have led to deep concerns. It is for these reasons that China is considering the deployment of small or medium sized integrated nuclear desalination plants for such regions.
The design of the selected integrated nuclear desalination plant comprises the coupling of two proven technologies: NHR-200 and MED process. The NHR-200 (Fig. 1) is being developed by the Institute of Nuclear Energy Technology (INET) of China. It is considered a suitable thermal energy source for use in potable water production due to its intrinsic, passive safety features and its appropriate design parameters (Table 1) for coupling with distillation processes such as the MED.
105

Figure 1. The structure of NHR-200 reactor.
TABLE 1. MAIN DESIGN PARAMETERS OF NHR-200
Operation mode Heat only Reactor power, (MW(th)) 200 Core inlet/outlet temperatures, (°C) 155/212 Pressure at the primary circuit, (MPa) 2.5 secondary circuit inlet/outlet temperatures, (°C) 135/165 Pressure at the secondary circuit, (MPa) 3.0 Outlet steam temperature of the motive steam generator, (°C) 126 Outlet steam pressure of the motive steam generator, (MPa) 0.24 Flow rate of motive steam supplied from NHR to the MED process, (t/h) 328
Figure 2. Coupling of the NHR-200 to the VTE-MED plant.
106

Figure 3. Coupling scheme of NHR-200 with LT-HT-MED desalination process.
Two coupling schemes (NHR-200+ LT-HTE-MED and NHR-200 + HT-VTE-MED) were selected for the comparative analysis (Figures 2 and 3). The design parameters of these two coupling schemes are presented in Table 2. With the reactor power of 200 MW(th), the desalination plants could provide 120 000 to 160 000 m
3/day of potable water. The project is recommended as a demonstration and
training facility of nuclear desalination in China.
In order to achieve the optimum technical, economical and safety objectives, a research project entitled, “Optimisation of System of Seawater Desalination with Nuclear Heating Reactor” was planed and executed at INET. This was also one of the subjects of the Coordinated Research Project of IAEA: “Optimisation of the Coupling of Nuclear Reactors and Desalination ”
There are no technical impediments to the use of the pressurized nuclear heating reactors (NHR-200) as an energy source for seawater desalination. The economical competitiveness of the NHR-200 desalination plant is the key point, which decision makers in China are paying good deal of attention to. Therefore, The research work should reasonably be focused on economic research on and assessment of the integrated nuclear desalination project.
TABLE 2. MAIN DESIGN PARAMETERS OF THE SELECTED DESALINATION PROCESSES
Water plant: HT-VTE-MED LT-HTE-MED Inlet steam temperature in MED process, (°C) 125 125/73 Top brine temperature, (°C) 120 70
Installed unit capacity, (m3/day) 84,000 30,000
Number of units 2 4
Number of effects 30 14,
With heat pump
GOR 21.5 15
107

A2.2. OBJECTIVES The ultimate goal of the investigation is to demonstrate the economic feasibility and competitiveness, under Chinese conditions, of the integrated seawater desalination plant with NHR-200, coupled to selected MED desalination processes. They are expected to provide high quality potable water to a medium sized town in China (possibly in Shandon province of China) under safe and stable conditions.
The particular objectives of the research are:
• To evaluate economic interest and to investigate the competitiveness of nuclear desalination using NHR-200, coupled with selected desalination process for the site of Shandon.
• To identify the main factors, which may have leading effect on further reduction in water production cost of the desalination plant using the NHR-200.
A2.3 ASSUMPTIONS Parameters of seawater at the site of Yan Tai city:
Average PH value of the seawater: 8.18;
Average total dissolved solid (TDS): 31500 ppm;
Yearly average temperature of the cooling seawater: 20.0 °C;
The following outage rate for both nuclear heating reactor and MED process are chosen:
Planed outage rate for the heating reactor: 0.041;
Unplanned outage rate for heating reactor: 0.03;
Planed outage rate for the MED process: 0.041;
Unplanned outage for the MED process: 0.05;
The heating reactor is designed as the single-dedicated heat source to the MED process. Therefore, the planed refuelling of the reactor, maintenance and repairing of the integrated desalination plant will be arranged in a unified program. The planed outage period for the MED process is covered by the planed outage period for the heating reactor.
Therefore, total availability for the integrated desalination plant is 0.86.
Discount and Interest rates: The long-term loan interest rate for China YUAN (RMB) is 5.85%. The discount rate is taken as the same value as the interest rate. Nuclear reactor:
• Specific construction cost of the nuclear heating reactor: 264.0 $/kW(th). • Construction lead-time of the nuclear heating reactor: 40 month. • Nuclear fuel cost of the nuclear heating reactor NHR-200: 2.59 $/MW(th).h. • 3.7 Decommissioning cost of the nuclear heating reactor: 0.33 $/MW(th).h.
Water plants: • For the selected HT-VTE-MED process, specific base cost = 746.32 $/m3/day. • For the selected LT-HTE-MED process, specific base cost = 787.5 $/m3/day. • Construction lead time of the water plant: 24 months. • In/outfall specific base cost = specific base cost ×7%
Plants economic life: • 60 years for the nuclear heating reactor • 30 years for MED desalination plant.
108
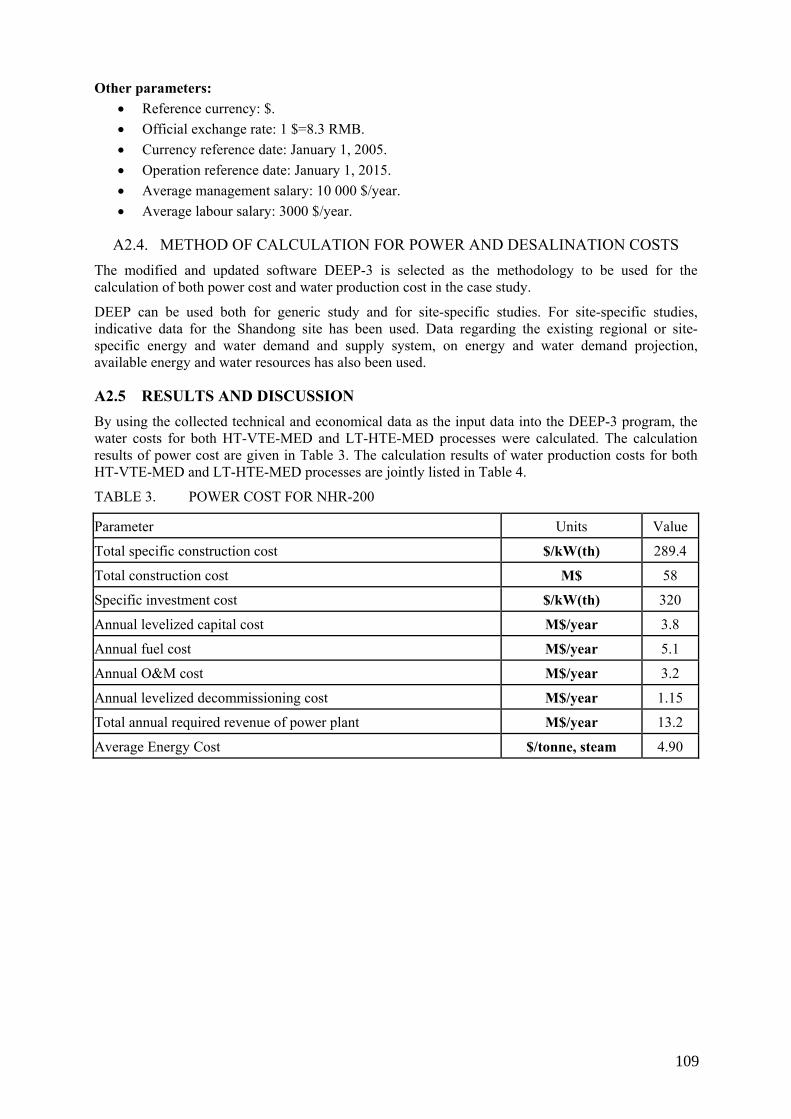
Other parameters: • Reference currency: $. • Official exchange rate: 1 $=8.3 RMB. • Currency reference date: January 1, 2005. • Operation reference date: January 1, 2015. • Average management salary: 10 000 $/year. • Average labour salary: 3000 $/year.
A2.4. METHOD OF CALCULATION FOR POWER AND DESALINATION COSTS The modified and updated software DEEP-3 is selected as the methodology to be used for the calculation of both power cost and water production cost in the case study.
DEEP can be used both for generic study and for site-specific studies. For site-specific studies, indicative data for the Shandong site has been used. Data regarding the existing regional or site-specific energy and water demand and supply system, on energy and water demand projection, available energy and water resources has also been used.
A2.5 RESULTS AND DISCUSSION By using the collected technical and economical data as the input data into the DEEP-3 program, the water costs for both HT-VTE-MED and LT-HTE-MED processes were calculated. The calculation results of power cost are given in Table 3. The calculation results of water production costs for both HT-VTE-MED and LT-HTE-MED processes are jointly listed in Table 4.
TABLE 3. POWER COST FOR NHR-200
Parameter Units Value
Total specific construction cost $/kW(th) 289.4
Total construction cost M$ 58
Specific investment cost $/kW(th) 320
Annual levelized capital cost M$/year 3.8
Annual fuel cost M$/year 5.1
Annual O&M cost M$/year 3.2
Annual levelized decommissioning cost M$/year 1.15
Total annual required revenue of power plant M$/year 13.2
Average Energy Cost $/tonne, steam 4.90
109

TABLE 4. WATER PRODUCTION COSTS
Parameter Units HT-VTE-
MED LT-HTE-
MED
Installed water production capacity m3/day 168 000 120 000
Annual average water production m3/year 52 372 859 38 697 300
Total construction cost M$ 145.37 106.17
Total investment M$ 149.5 112.3
Specific investment cost $/(m3/day) 890 936.0
Annual water plant fixed charge M$/year 10.6 8.0
Annual water plant heat cost (heat plant) M$/year 13.2 13.2
Annual purchased electric power cost M$/year 10.6 5.60
Annual water plant O&M cost M$/year 4.9 3.6
Total annual required revenue M$/year 39.40 30.40
Total water cost $/m3 0.75 0.79
According to the above results for the nominal design condition, the energy cost breakdown of the NHR-200 is shown in Figure 4. The definitions of the cost items and their values are given in Table 5
3 8%
2 4 %
0% 9%2 9% 1
2
3
4
5
Figure 4. Distribution of various energy costs in NHR-200.
TABLE 5. ENERGY COST ($/tonne, steam) BREAK DOWN OF NHR-200
Levelized capital cost. 1.41 28.78%
Nuclear fuel cost. 1.89 38.57%
O&M cost 1.19 24.29%
Consumed electric power cost (for heat only plants).
0.0 0.0
Decommissioning cost. 0.43 8.36%
Total energy cost. 4.90 100%
Breakdowns of the water production cost of the NHR+VTE-MED plant and the NHR-200 + HTE-MED plant for the nominal design condition are shown in Figures 5 and 6 respectively. Definitions and calculated values of the respective cost items are presented in Tables 6 and 7.
110
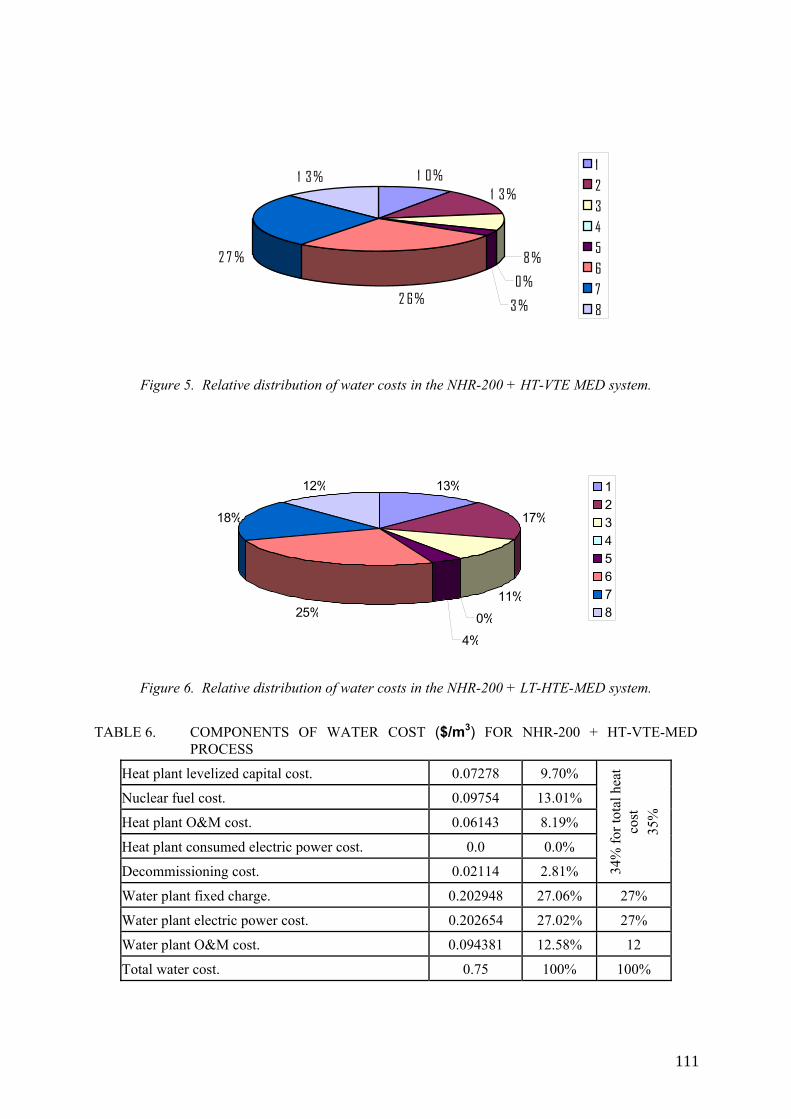
1 0%1 3%
8%
0%
3%2 6%
2 7 %
1 3%12345678
Figure 5. Relative distribution of water costs in the NHR-200 + HT-VTE MED system.
13%
17%
11%0%
4%
25%
18%
12% 12345678
Figure 6. Relative distribution of water costs in the NHR-200 + LT-HTE-MED system.
TABLE 6. COMPONENTS OF WATER COST ($/m3) FOR NHR-200 + HT-VTE-MED
PROCESS
Heat plant levelized capital cost. 0.07278 9.70%
Nuclear fuel cost. 0.09754 13.01%
Heat plant O&M cost. 0.06143 8.19%
Heat plant consumed electric power cost. 0.0 0.0%
Decommissioning cost. 0.02114 2.81% 34%
for t
otal
hea
t co
st
35%
Water plant fixed charge. 0.202948 27.06% 27%
Water plant electric power cost. 0.202654 27.02% 27%
Water plant O&M cost. 0.094381 12.58% 12
Total water cost. 0.75 100% 100%
111

TABLE 7. COMPONENTS OF WATER COST ($/m3)FOR NHR-200 + LT-HTE-MED
Heat plant levelized capital cost. 0.1001 12.67%
Nuclear fuel cost. 0.1343 17.0%
Heat plant O&M cost. 0.0843 10.67%
Heat plant consumed electric power cost. 0.0 0.0%
Decommissioning cost. 0.02891 3.66% 44.0
% fo
r tot
al h
eat c
ost
48%
Water plant fixed charge. 0.206386 26.32% 26%
Water plant electric power cost. 0.143881 18.42% 18%
Water plant O&M cost. 0.094151 11.84% 12%
Total water cost. 0.79 100% 100%
A2.6. SENSITIVITY ANALYSIS Interest rate/ discount rate, purchased electricity cost, specific construction cost of NHR power plant, integrated NHR+MED plant availability and specific base cost of MED water plant were selected as the sensitivity parameters for water cost analysis. Results of the sensitivity analysis on water production cost for NHR+VTE-MED and NHR+HTE-MED are listed in Table 8. Water cost vs. some sensitive parameters are also graphically illustrated in Figures 7 to 9.
TABLE 8. RESULTS OF SENSITIVITY ANALYSIS ON WATER PRODUCTION COST FOR NHR-200 + VTE-MED AND NHR-200 + HTE-MED
Sensitivity parameters*
Fluctuated Percent of sensitivity parameters
Value of Sensitivity parameters
Water cost for
NHR+VTE-MED, ($/m3)
Percent of water cost fluctuation
(%)
Water cost for
NHR+HTE-MED ($/m3)
Percent of water cost fluctuation
(%)
i/ir -30 % 4.06 % 0.69 -8.0 0.71 -10.13 i/ir -20 % 4.64 % 0.71 -5.3 0.74 -6.33 i/ir Indicated 5.0 % 0.72 -4.0 0.76 -3.80 i/ir -10 % 5.22 % 0.73 -2.66 0.76 -3.80 i/ir ±0 % 5.8 % 0.75 ±0.0 0.79 ± 0.0 i/ir +10 % 6.38 % 0.77 +2..66 0.81 +2.53 i/ir +20 % 6.96 % 0.80 +6.6 0.84 +6.33 i/ir +30 % 7.54 % 0.82 +9.33 0.87 +10.13 i/ir Indicated 8.0 % 0.84 +12.0 0.89 +12.66 Cpe -30% 0.042 0.69 -8.0 0.74 -6.33 Cpe -20% 0.048 0.71 -5.33 0.76 -3.80 Cpe -10% 0.054 0.73 -2.66 0.77 -2.53 Cpe ±0 % 0.06 0.75 ± 0.0 0.79 ± 0.0
112

TABLE 8. (Continued) Cpe +10 % 0.066 0.77 +2..66 0.80 +1.27 Cpe +20 % 0.072 0.79 +5.33 0.82 +3.80 Cpe +30 % 0.078 0.81 +8.0 0.83 +5.06 Apd -30% 0.602 1.04 +38.67 1.12 +41.77 Apd -20% 0.688 0.92 +22.67 0.99 +25.32 Apd, -10% 0.774 0.83 +10.67 0.89 +12.66 Apd ±0 % 0.86 0.75 ± 0.0 0.79 ± 0.0 Apd +10 % 0.946 0.69 - 8.0 0.74 -6.33 Apd +20 % --- -- --- --- --- Apd +30 % --- -- --- --- --- Ce -30% 184.8 0.72 - 4.0 0.75 -5.06 Ce -20% 211.2 0.73 -2.67 0.76 -3.80 Ce -10% 237.6 0.74 -1.33 0.77 -2.53 Ce ±0 % 264.0 0.75 ± 0.0 0.79 ± 0.0 Ce +10 % 290.4 0.76 +1.33 0.80 +1.27 Ce +20 % 316.8 0.77 +2.67 0.81 +2.53 Ce +30 % 343.2 0.78 +4.0 0.83 +5.06
490.0 0.69 -8.0 Cds -30%
501.2 0.72 -8.86 560.0 0.71 -5.33
Cds -20% 568.0 0.74 -6.33 630.0 0.73 -2.67
Cds -10% 644.4 0.76 -3.80 700.0 0.75 ± 0.0
Cds ±0 % 716.0 0.79 ± 0.0 770.0 0.77 +2.67
Cds +10 % 787.6 0.81 +2.53 840.0 0.80 +6.67
Cds +20 % 859.2 0.83 +5.06 910.0 0.82 +9.33
Cds +30 % 930.8 0.85 +7.59
i/ir Interest rate/ discount rate, (%); Cpe: Purchased electricity cost, ($/kWh(e)); Ce: Specific construction cost of NHR power plant, ($/kw(t)); Apd: Integrated NHR+MED Plant
availability, (%); Cds: Specific base cost of MED water plant, ($/m3/day).
113

Figure 7. Water cost vs.discount rate.
Figure 8. Water cost vs. construction cost of energy plant.
00,10,20,30,40,50,60,70,80,9
1
Discount rate
Wat
er c
ost $
/m3
NHR+VTEMEDNHR+HTEMED
NHR+VTEMED 0,69 0,71 0,72 0,73 0,75 0,77 0,8 0,82 0,84
NHR+HTEMED 0,71 0,74 0,76 0,76 0,79 0,81 0,84 0,87 0,89
4,06%
4,64%
5,00%
5,22%
5,80%
6,38%
6,96%
7,54%
8,00%
Water Production Cost vs. Construction Cost of Energy Plant
0.660.680.7
0.720.740.760.780.8
0.820.84
Construction cost of energy plant, $/kWh.h
Wat
er c
ost,
$/m
3
NHR+VTEMEDNHR+HTEMED
NHR+VTEMED 0.72 0.73 0.74 0.75 0.76 0.77 0.78NHR+HTEMED 0.75 0.76 0.77 0.79 0.8 0.81 0.83
185 211 238 264 290 317 343
114

Figure 9. Water cost vs. Construction cost of VTEMED plant.
A2.7 COMPARISON WITH ALTERNATE PROCESSES A2.7.1. REFERENCE STEAM PRICES
Three cases have been chosen to show the economic interest of the NHR-200. These are:
(1) The steam price for the industry, using the gas fired boiler. This price was, the basic reference price, as issued in 2004, about 14.6 $/t of steam.
(2) The price of low-pressure steam produced by an oil fired boiler. Values are given in Table 9 for different oil prices:
TABLE 9. STEAM COST FROM AN OIL-FIRED BOILER IN CHINESE CONDITIONS
Oil price ($/tonne) Heat cost (RMB Y/GJ) Steam cost ($/tonne)
100 33.4 8.8
115.4 37.3 9.81
154.22 47 12.36
It can be clearly seen that in each case the steam cost of 4.9 $/t from the NHR-200 is economically more attractive.
A2.7.2. REFERENCE WATER PRICES IN BEIJING CITY
Two scenarios are considered:
(1) Water prices in Beijing city, issued in 2004, are listed in Table 10:
Water Production Cost vs.Construction Cost of VTEMED Plant
0.6
0.65
0.7
0.75
0.8
0.85
Construction cost of VTEMED plant $/m3/d
Wat
er c
ost,
$/m
3
NHR+VTEMED
NHR+VTEMED 0.69 0.71 0.73 0.75 0.77 0.8 0.82
490 560 630 700 770 840 910
115

TABLE 10. BEIJING CITY REFERENCE WATER PRICES
Uses Price, (RMB Y/m3) Price ($/m3)
For residents in cities 3.7 0.446
For Administrative Department 5.4 0.651
For Industries and commerce 5.6 0.675
For car cleaning and pure water production
41.5 5.0
(2) Reference water cost of a planed water transfer engineering project (WTE) from yellow river to the East of Shandong Province
A water transfer project from the Yellow River to the East of Shandong Province, including Yan Tai city, has been planed, as a measure of urgently-needed water supply. The drawing-up water capacity from Yellow River is planed to be 200 Million m3/year with flow rate of 30 m3/s. The period for water supply is planed to be about 75 days/year. The maximum capacity of water supply should reach 2.6 Million m3/day. The total water transfer line is more than 480 km long with 7 pumping stations and with more than 160 km of open channel. The total elevation head is about 320 m.
Water cost at different positions along the transfer channel was estimated in the feasibility study on the planed water transfer. At the Yan Tai water distribution station, the estimated water cost is about 2.7 RMBY/m3 (0.33 $/m3).
As mentioned above, there exist more than 160 km of open channel on the water transfer line. Therefore, contamination on water must be avoided on the transfer way. It is thus necessary to include the additional cost for water treatment. This cost is estimated to be about 1.0 RMBY/ m3. Therefore, the total water cost would reach 3.7 RMBY/m3 (0.45 $/m3) at entrance to the municipal water grid of Yan Tai city.
Results of comparison with water produce by NHR-200 +MED systems are presented in Table 11.
TABLE 11. COMPARISON OF WATER COSTS BETWEEN THE WATER TRANSFER ENGINEERING (WTE) AND THE SEA WATER DESALINATION PROCESS WITH NHR-200 NUCLEAR REACTOR
Item WTE NHR+MED
Capacity of Water supply
2.6 Million m3/day 160 000 m3/day
Quantity of Water supply
Very large quantity of water. relatively large quantity
Water Quality General standard for citizens’ daily use
High quality, can be used for industry and high Technology
Water cost 0.45 $/ m3 0.75-0.79 $/ m3
Period for water supply
Seasonal, As urgent water supply
Almost continuous water supply
116

It is observed that WTE may provide very large quantity of water with general standard quality for citizens’ daily use. The water cost is relatively low.
The nuclear seawater desalination process can also provide rather large quantity of water, with high quality, which can be used for supply with high quality drinking water and for High-Tech Industry. The water cost is also reasonably acceptable.
A2.8 CONCLUSIONS Water cost produced by integrated NHR-200 desalination plant may be about 0.75 $/m3 for NHR200 + HT-VTE-MED and 0.79 $/m3 for NHR200 + LT-HTE-MED respectively.
The capital cost, electricity consumption cost of the MED water plant and nuclear fuel cost have leading effect for further reduction in water production cost of the desalination plant using NHR reactor coupled with MED process.
It is indicated in the case study, by comparison of the steam costs produced by NHR, oil-fired boiler and gas-fired boiler, that the steam cost produced by NHR-200 has good economic competitiveness.
It is indicated, by comparison of the water costs produced by NHR desalination plant, and water transfer engineering and present water market price in China, that water cost produced by an integrated NHR-nuclear desalination plant is relatively higher. However, if one considers the high quality of product water, the cost could be still be acceptable.
It is proposed to continue further research in order to further decrease the water production cost and thus improve the economic competitiveness of NHR-200 based desalination systems.
117


ANNEX 3 EGYPT
ECONOMIC ASSESSMENT OF 1000 MW(e) PWR POWER PLANT COUPLED TO MSF, MED AND RO DESALINATION PLANTS A.H. El Desoky, M. Abdel Rouf, M.R. Badawi
Nuclear Power Plants Authority, Egypt
ABSTRACT One of the important tasks of Nuclear Power Plants Authority (NPPA) is how to explore the possibility of employing a nuclear seawater desalination plant in Egypt. The NPPA thus undertook the implementation of an economic feasibility study of an integrated nuclear desalination system for an assumed Egyptian site. This work presents a detailed economic analysis of a 1000 MWe PWR, coupled to seawater desalination processes, MSF, MED and RO, each producing 140 000 m3/day of fresh water. The results of the performed case study concluded that the water cost (at 8% discount rate) with the MSF plant is highest, 1.48 $/m3, compared to 0.89 and 0.65$/m3 with the MED and RO plants. The sensitivity analysis has shown that all sensitivity parameters influence the water production costs. The variation of the discount rate and water availability has the largest impact on the unit production cost. The results of the case study clearly indicate the economic interest of nuclear desalination systems for the Egyptian site. Also, the water transport system has been developed to evaluate the technical and economical assessment of the desalted water transport system. The program results indicated that the total cost ($/m3/km) of water transport depends on the discount rate, the energy price, water capacity and the elevation of the pipe from reference level.
A3.1. INTRODUCTION One of the important tasks of Nuclear Power Plants Authority (NPPA) is how to explore the possibility of employing a nuclear seawater desalination plant in Egypt. It is for this reason that NPPA undertook an economic feasibility study for an assumed Egyptian site. It is expected that the integrated nuclear desalination plant would supply needed water and electrical energy without any adverse environmental effects.
A3.2. OBJECTIVES This work presents a detailed economic analysis of a 1000 MW(e) PWR, coupled to seawater desalination processes, MSF, MED and RO, each producing 140 000 m3/day of fresh water The objectives of the economic evaluation is to help the decision-maker to eventually implement an integrated nuclear desalination plant, generating both electricity and potable water.
A3.3. ASSUMPTIONS This study is based on the Masachussets Institute of Technology (MIT) report “The future of Nuclear Energy” 2003. The MIT considers a 1000 MW(e) PWR, with overnight cost of 2000 $/kW(e), plant lifetime of 40 years, and heat rate of 10 400 BTU/kWh. In our study, the economic assessment of nuclear desalination with this reactor takes into account the desalination plant capacity range between 50,000 and 150 000 m3 /day. The cost estimates and economic evaluation of the MSF, MED and RO processes was based on a constant money basis. The capital investment, operating & maintenance (O&M), and fuel cost, and the other anticipated costs, including owner’s cost, are included in this evaluation. The levelized discounted production cost of water (in $/m3) was obtained with the help of DEEP-3 software, developed by the IAEA.
The main assumptions used in DEEP calculations are presented in Table 1.
119

TABLE 1. CALCULATION HYPOTHESES FOR THE MSF, MED AND RO PLANTS
Parameter MSF plant MED Plant RO plant Cost reference date 1997 1998 1998 Interest /discount rate, (%) 8 8 8 Economic plant life time, (Years) 30 30 30 Initial year of operation 2005 2005 2005 Construction period, (years) 2 2 2 Currency $ $ $ Seawater salinity, (ppm) 38500 38500 38500 Seawater temperature (°C) 21 21 21 Water plant base unit cost ($/m3/day) 1000 900 800
A3.4. METHOD OF CALCULATIONS The DEEP-3 method of calculations is followed for the economic evaluation of power/desalination co-generation plants: the levelized electricity cost is used to calculate the energy cost of the water plant by multiplying the sum of lost electricity generation and the water plant electricity used by the electricity generation cost of the base power plant.
The assessment method takes into account the mid year payment method for computation of the interest during construction (IDC).
The present worth technique based on constant money terms is used to calculate the levelized water cost, where the present worth of all revenues received from selling desalted water are just equal to the present worth of all expenditure. The levelized water production cost is assumed to be constant through the lifetime of water plant and is calculated by dividing the annual required revenues attributable to water production by the annual water production.
The annual required revenue of the desalination plants are calculated by summing levelized annual capital cost and O&M cost of the water plant as well as the electricity cost, which is calculated from the electricity used of the RO plant either by the direct connection with the PWR plant or electricity purchased from the network.
A3.3. RESULTS AND DISCUSSIONS The economic assessment is carried out for MSF, MED and RO seawater desalination plant. The overall total unit production costs for these plants are respectively: 1.48, 0.89 and 0.65 $/m3 (Table 2).
The most important parameters that are taken when the sensitivity analysis is performed, are the discount rate, interest rate, purchased electricity price, specific nuclear fuel cost, water plant availability, power plant availability, and water plant specific base cost.. Therefore, the levelized water costs are based on the sensitivity analysis for the different discount rates and interest rates ranging from 4% to 10% are shown in Figures 1a to 1c.
120

Figure 1a. Water cost as a function of discount rate; MSF plant.
Figures 1b and 1c. Water cost as a function of the discount rate for MED and RO plants.
121

TABLE 2. WATER PRODUCTION COSTS FOR MSF, MED AND RO PLANTS
Water plant Parameters
Units MSF MED RO
Capital Investment costs Overnight water plant cost M$ 198.85 159.84 117.5 Owner’s cost M$ 9.94 7.99 5.88 Contingency cost M$ 20.88 16.78 12.35 Total construction cost M$ 229.67 184.62 135.71 Interest during construction M$ 9 7.3 5.3 Total capital investment cost M$ 238.7 191.9 141 Water fuel cost (power plant & backup heat source) Total heat to water plant MW(th) 591.2 261.5 NA Lost shaft work MW 45 22.4 NA Lost electricity production MW(e) 43.1 20.1 NA Combined power/water plant load factor 0.73 0.7 NA Annual water plant heat cost (power plant) M$/a 26.7 8.9 NA Backup heat source size MW(th) 591 261.5 NA Backup heat source load factor 0.15 0.15 NA Fossil fuel price for backup heat source at startup $/bbl 60 60 NA Annual fuel cost of backup heat source M$/a 9.5 6.8 NA Annual fuel cost (power plant & backup heat source M$/a 36.3 15.7 NA Water plant electric power cost Total dist. water plant power use (incl. interm. Loop) MW(e) 18 8.5 26
Annual water plant electric power cost M$/a 7 2.7 8.1 Annual water plant Purchased electric power cost M$/a 0.6 0.2 2.1 Water plant tota electric power cost per m3 M$/a 7.6 2.9 10.2 Operating and Maintenance Cost Water plant O&M management cost M$/a 0.02 0.06 0.2 Water plant O&M labor cost M$/a 0.09 0.02 0.77 Water plant annual materials cost M$/a 3.77 4.12 6.62 Water plant annual insurance cost M$/a 0.99 0.81 0.68 Total 'Water plant annual O&M cost M$/a 4.87 5 8.3 Economic Evaluation Annual Water plant investment cost M$/a 21.2 17 12.5 Annual Fuel cost (power plant & backup heat source M$/a 36.3 15.7 NA
Annual Water plant electric power cost per m3 M$/a 7.6 2.9 10.2 Total Annual 'Water plant O&M cost per m3 M$/a 4.87 5 8.3 Total water cost per m3 $/m3 1.48 0.89 0.65
122

Thus one observes that for the RO plant, the levelized water cost is increased gradually and linearly from 0.55 to 0.708 $/m3. This variation is 1.04 to 1.71 $/m3 for the MSF plant and 0.65 to 1.13 $/m3 for the MED plant.
Figures 2 indicate the variation of the water costs ($/m3) as interest rate is varied from 4 to 10 %: from 1.42 to 1.51 for the MSF plant, from 0.86 to 0.91 for the MED plant and from 0.653 to 0.661 for the RO plant.
Figure 2a. MSF water cost as function of interest rate.
MED RO
Figures 2b and 2c. MED and RO water costs as functions of the interest rate.
The purchased electricity cost has a significance effect on the levelized water cost as shown in Figures 3.
123
Figure 3a. Water cost as a function of the electricity cost for the MSF plant.

MED RO
Figures 3b and 3c. Water cost as a function of the electricity cost for MED and RO plants
.
Other sensitivity studies are presented in figures 4 to 8:
MED RO Figure 4. Variation of water cost with specific nuclear fuel cost.
124

MSF MED Figure 5. Variation of water cost with fossil fuel price.
Figure 6a. MSF plant water cost vs plant availability.
MED RO
Figures 6b and 6c. MED and RO plants water cost vs plants’ availability.
125

Figure 7a. MSF water cost vs power plant availability.
MED RO
Figure 7b and 7c. MED and RO water cost vs power plant availability.
Figure 8a. MSF water costs vs MSF plant specific base costs.
126

MED RO
Figure 8b and 8c. MED and RO water cost vs water plants’ specific base cost.
It is interesting to note that the the levelized water costs decrease as the power and water plant availabilities are increased with respect to the water plant availability ranging from 0.60 to 0.90. thus, for the RO case, the levelized water cost decreases from 0.81 to 0.67 $/m3. Similarly, when the power plant availability is increased from 0.60 to 0.90 the levelized water cost (for the RO plant) decreases from 0.67 to 0.65 $/m3. Similar conclusions can be made for the MSF and MED plants..
A3.7. CONCLUSIONS The results of the performed case study for a 1000 MW(e) PWR, coupled to MSF, MED and RO plants each of 140 000 m3/day capacity, leads to the following conclusions:
• The water cost (at 8% discount rate) with the MSF plant is highest, 1.48 $/m3, compared to 0.89 and 0.65$/m3 with the MED and RO plants.
• The sensitivity analysis has shown that all sensitivity parameters are affecting the water production costs. The variation of the discount rate and water availability has the largest impact on the unit production cost.
The results of the case study clearly indicate the economic interest of nuclear desalination systems for the Egyptian site.
BIBLIOGRAPHY [1] LI TIAN et al, Economic Analysis of 2-200 MW Nuclear Heating Reactor For Seawater
Desalination by Multi-effect Distillation (MED), Desalination, 152, 223-228 (2002). [2] INTERNATIONAL ATOMIC ENERGY AGENCY, DESALINATION ECONOMIC
EVALUATION PROGRAM (DEEP), User’s Manual, Computer Manual Series No. 14, IAEA, Vienna (2000).
[3] INTERNATIONAL ATOMIC ENERGY AGENCY, Economic Evaluation of Bids for Nuclear Power Plant, Technical Report Series No. 396, IAEA, Vienna (1999).
127

ANNEX 4 FRANCE
ECONOMIC EVALUATION OF NUCLEAR DESALINATION SYSTEMS S. Nisan
CEA/CEN Cadarache, F-13108, Saint Paul-lez-Durance, France
ABSTRACT This study presents the results of the economic evaluation of divers integrated nuclear desalination systems, using reactors such as the PWRs and the HTRs, (providing virtually free heat from their intercooler and pre-cooler helium-water exchangers) and the desalination processes, MED and RO. Results are also compared with the cheapest of fossil fuelled system, the gas turbine combined cycle plant, CC-600. All results are for a selected site in Tunisia, retained in the context of joint French-Tunisian collaboration. It is observed that in all conditions, the nuclear options lead to much lower power and desalination costs as compared to those by the CC-600 plant, provided the gas prices remain ≥ 150 $/toe.
A4.1. INTRODUCTION From a technical and economical standpoint, seawater desalination as an alternative source of potable water has become particularly attractive due to continuous innovations in the relevant technologies leading to a very significant reduction of desalination costs.
Desalination is an energy intensive process. Over the long term, desalination with fossil energy sources would not be compatible with sustainable development: fossil fuels reserves are finite and must be conserved for other essential uses whereas demands for desalted water would continue to increase.
Furthermore, the combustion of fossil fuels would produce large amounts of greenhouse gases and toxic emissions as is shown in Section 1.3.3. in the main text. A sustainable, non-polluting, solution to energy and water shortages could thus only be provided by integrated nuclear desalination systems.
However, there are still doubts regarding the competitiveness of nuclear systems as opposed to fossil energy based systems, especially in the context of developing countries.
Desalination related research at the French Atomic Energy Commission (CEA), with particular emphasis on the use of nuclear energy, is being carried out under CEA’s own programmes (as part of the CEA Nuclear Energy Directorate’s DESAL project) as well as in the frame of CEA’s various international collaborations.
The basic motivation for this research and development is to propose a choice of technical options, based on the use of nuclear energy, which could be sustainable and at the same time economically viable.
It is in this context that CEA coordinated the EURODESAL project, carried out under the EU Commission’s fifth Framework Programme [1]. The project started in February 2001 as a concerted action and ended in September 2002.
At about the same time, CEA and the National Centre for Nuclear Sciences and Technologies (CNSTN) from Tunisia signed a collaboration agreement under the International Atomic Energy Agency’s inter-regional technical collaboration programme INT/4/134. Under this agreement, which came to be known as the TUNDESAL project, a study was undertaken to investigate the technical and economical feasibility of an integrated nuclear desalination system at la Skhira site, between the towns of Sfax and Gabès in Tunisia [2]. The TUNDESAL project was formally presented to the Tunisian authorities at a closure ceremony held in March 2005.
128

The economic calculations presented at this occasion were based on the Utilization of the DEEP-2 software, initially developed by the IAEA [3] and further improved by the CEA [4].
IAEA has since then issued the new, DEEP-3 version of the software with a number of improvements in both MED and RO models. [5].
This paper thus presents the results of new economic calculations for the TUNDESAL project, carried out with DEEP-3.
A4.2. COUPLING OF NUCLEAR REACTORS TO DESALINATION PROCESSES A4.2.1. COUPLING WITH PWR TYPE OF REACTORS EURODESAL was the first EU study, which reported exhaustive evaluation results with two nuclear reactors of the PWR type: the French PWR-900 (as reference base case) and the innovative reactor AP-600. The coupling schemes, thus elaborated, were later adapted for the La Skhira site, studied in the TUNDESAL project.
These reactors were coupled to desalination processes: MED, RO and an innovative variant of the RO process with preheating of the feed-water (the ROph process). Recall that the coupling of the RO process requires only an electrical connection. For the ROph process, the feed-water can be preheated in the reactor condenser.
Typical coupling schemes of the PWR + MED and PWR + ROph processes are shown in Figure 1.
In the PWR+MED coupling scheme, the vapour extracted from one (or more) turbine stage(s) is fed to a heat exchanger (which may be similar to the condenser) where the incoming water temperature is raised to an appropriate level (70 to 90 °C). The hot water then passes through a flash tank where it is partially evaporated. This vapour then serves as the heating fluid in the first effect of the MED plant.
Figure 1. Principle of coupling of a PWR type of reactor to MED and/or ROph plants.
1: Reactor core, 2: Pressuriser; 3: Steam generator; 4: High pressure turbine; 5: Intermediate steam heater; 6: Low-pressure turbine, 7: Generator, 8: Main condenser, 9: Pre-heaters, 10: De-aerator; 11: Seawater heater;12: Flash tank, 13: MED plant, 14: MED output condenser, 15: Prefilter, 16: Chlorified water tank, 17: Ultra-filtration membrane, 18: RO membrane, 19: desalted water tank, 20: Fresh water out, 21: Brine out-fall
Alternate PWR+MED coupling schemes were also studied under the TUNDESAL project, with a view to optimise both water and electricity production. These included the extraction of steam from one of the bypass lines to the pre-heaters (9), the coupling via the main condenser (8) (which had to be connected at a turbine point providing steam at 60°C, at least). It was however observed that all these alternates led to a considerable reduction of the plant electrical power. It was for this reason that in all further studies only the conventional coupling scheme was retained.
129

Some results of thermodynamic calculations for PWR-900 + MED system are given in Table 1. These results are also valid for the AP-600 type of reactor. In all calculations, an initial extracted vapour temperature of 90 °C was assumed. The temperature at the inlet of the MED plant would then be about 70 °C.
Table 1 also includes the electric power lost (the Lost Shaft Power) because of the vapour bleeding for the MED plant. This plant is assumed to be modular with a unit size of 12 000 m3/day.
TABLE 1. WATER PRODUCTION IN THE CONVENTIONAL MED COUPLING TO A PWR (TUNDESAL)
Production Capacity
(m3/day)
Thermal Power Used
(MW(th))
Initial Vapour Flow Rate
(Kg/s)
Lost Shaft Power
(MW(e))
48 000 89,3 42 11,3
150 000 278,9 132 35,2
216 000 401,6 190 50,7
240 000 446,4 211 56,3
A4.2.2. UTILIZATION OF WASTE HEAT FROM THE GT-MHR (OR PBMR) A great advantage of the GT-MHR (and/or PBMR) is that their designs allow the Utilization of waste heat from their intercooler and pre-cooler exchangers at ideal temperatures for desalination (80 to 100°C). Because this heat is sent to the heat sink anyway, it is considered virtually free for desalination. This principle was used in both EURODESAL and TUNDESAL projects.
In order to couple a GT-MHR to the MED, it is thus sufficient to bypass the hot water flow through the switch-cooling unit to the heat sink and send a fraction of hot water to the intermediate circuit. Because the MED plant acts as a second heat sink, the bypassing of hot water has no effect on the electrical efficiency of the GT-MHR. Such a coupling is shown in Figure 12, section 4.3.1.1. of the main text. With minor modifications, it is equally valid for the PBMR.
Heat is transferred from the pre-cooler (170.5 MW) and the intercooler (131.5 MW) through two water loops in parallel. At the Pre-cooler output, depending upon the exact configuration used, water could reach a temperature of about 120°C, while at the intercooler output a temperature of about 96°C may be obtained. From a simple heat balance, the two flow rates are thus quite similar and to simplify matters, a mixing temperature of about 106°C can be assumed.
The main components of the coupling were modelled and its thermodynamic characteristics were determined in the same way as that for the PWR + MED coupling for different values of the mixing temperature, ranging from 80 to 100°C. Modelling details for the GT-MHR + MED and PBMR + MED systems, utilising the waste heat, are given in [6].
The waste heat provided by the GT-MHR (or the PBMR) is indeed virtually free but its total amount available for desalination is determined by the thermodynamic conditions of the whole system, in particular the required temperature of helium before each compression stage. This temperature (which should be as low as possible) is directly linked to the input seawater temperature at a given site.
Thermodynamic calculations [6] show that the fraction of the total thermal power, actually available for MED desalination, with the PBMR and the GT-MHR, is respectively about 23 and 22 % of the total thermal power dissipated in the pre-cooler and the intercooler exchangers. The amount of desalted water produced is thus relatively limited but is sufficient to supply potable water to a town of medium size.
130

A4.3. ECONOMIC EVALUATION A salient feature of the TUNDESAL project is the exhaustive economic analysis of desalination costs for four nuclear reactors (PWR-900, AP-600, PBMR and GT-MHR), two fossil fuel sources, each producing 600 MW(e): 1-the gas turbine, combined cycle, CC-600, and 2- the simple gas or oil fired boiler, TV600. These power sources were coupled to the MED, RO and the ROph desalination processes. Since in the previous study [2] it was clearly shown that the TV600 option was the most expensive one in all conditions, it was not considered for the new calculations with DEEP-3.
The choice of these power sources is not arbitrary. The 34 units of the French PWR 900 MW(e) reactor are, at the moment producing electricity at relatively very low costs and as such should be considered as a reference base case.
AP-600 [7] has been studied in detail by ANSALDO (in collaboration with Westinghouse), which was one of the partners of the EURODESAL consortium. Similarly, an international consortium involving GENERAL ATOMICS, MINATOM, and FUJI ELECTRIC has been working together on the design of the GT-MHR [8]. PBMR [9] is expected to be constructed in South Africa. There are various CC-600 plants, which are particularly competitive in Tunisian conditions.
It should be noted that the AP-600, GT-MHR and PBMR are in the category of medium and small sized reactors (SMR). The deployment of such SMRs is very flexible and appears to be particularly suitable for cogeneration of electricity and water in countries with relatively weaker or non-interconnected electricity grids.
The technical approach used in the economic evaluation consisted of two steps:
• Calculation of the construction, O&M and fuel (or fuel cycle) costs for the PWR-900, AP-600 and CC-600 with the help of the SEMER code developed by CEA [10]. Economic parameters for the GT-MHR and the PBMR were those announced by their respective developers [11-12].
• Input of the relevant results in DEEP-3 for detailed power and desalination cost calculation
A4.3.1. POWER COST CALCULATIONS A4.3.1.1. Calculation hypotheses
The basic hypotheses used in these calculations are presented in Table 2. All costs are given in 2006 US $.
It is important to note that for the CC-600 plant, the fuel costs obviously depend upon the gas prices.
In Tunisia, taking into account the existing gas reserves and the fractions that are taken out from the pipelines transiting the Tunisian territory, the gas prices are considered equivalent to the heavy oil with high sulphur content. The reference price considered is 150 $/toe (or 20.62 $/ equivalent oil bbl).
This reference reflects the conditions before the dramatic increases in oil and gas prices. It is clear that future gas prices would be certainly much higher even in Tunisia. This is the reason we have also made calculations with gas prices of 40 and 60 $/bbl.
To compare the power plants in similar conditions, we have considered the nth of a kind nuclear power plants. Evidently for a first of a kind plant the costs would be 20 to 30 % higher.
Nuclear power plants are evaluated in European conditions knowing that countries like Tunisia will import them from outside. This is unfavourable for nuclear power plants since the fossil fuelled plants such as the CC-600 could be constructed locally with much lower salaries.
131

TABLE 2. MAIN HYPOTHESES USED FOR POWER COST CALCULATIONS
Parameters Units Power plants PWR-900 AP-600 GT-MHR PBMR CC-600
Currency reference year
2006
Interest/discount rate % 5, 8 and 10
Net electrical power MW(e) 951 610 286.2 114.9 545
Net thermal power MW(th) 2 727 2 000 592.6 266 1 069
Number of units on site - 1 1 2 5 1
Efficiency % 33 33 48.3 43.2 51 Plant availability % 91,2 91,2 91.2 91.2 90,3
Construction lead time years 5 4 4 2 2
Plant life time years 40 40 40 40 25 Salaries $/month 4761 4761 4761 4761 1 625 Fossil fuel prices $/bbl 20.62, 40
and 60 Fossil fuel escalation rate %/year N/A N/A N/A N/A 2
Nuclear fuel cycle costs (for 5 ; 8 and 10% discount rates)
$/MW.h 6,48 ; 6,48 and 6,54
6,48 ; 6,48 and 6,54
5
5
N/A
A4.3.1.2 Results of power cost calculations
The power production costs of the CC-600 plant are given in Table 3. Those for the nuclear reactors are presented in Table 4.
These tables clearly show that:
For gas price ≥ 20.62/bbl (150 $/toe), all nuclear options lead to much lower kWh cost. Thus for example, at 8% discount rate and a gas price of 40 $/bbl for the CC-600, the kWh cost of the PWR-900 is 56 % lower. Under the same conditions, that of the AP-600 is 49% lower.
If the economic performances of the GT-MHR and the PBMR, as announced by their respective developers, are indeed true than the GT-MHR would lead to the lowest kWh costs of all options considered. The kWh cost of the PBMR would be comparable to the large sized PWR-900.
132

TABLE 3. ELECTRICITY PRODUCTION COSTS BY A GAS TURBINE, COMBINED CYCLE
PLANT, CC-600
Parameters Units
Annual electricity production GW.h/year 4744
Gas price at start up $/bbl 20.62 40 60
Discount rate % 5 8 10 5 8 10 5 8 10
Specific construction cost $/kW(e) 525 525 525 525 525 525 525 525 525
Specific investment cost $/kW(e) 551 567 578 551 567 578 551 567 578
KWh costs (in 10-2 $/kW.h)
Investment 0.495 0.672 0.805 0.495 0.672 0.805 0.495 0.672 0.805
O&M 0.36 0.36 0.36 0.36 0.36 0.36 0.36 0.36 0.36
Fuel 4.028 3.922 3.861 7.814 7.609 7.489 11.721 11.414 11.234
Total 4.883 4.964 5.025 8.669 8.641 8.654 12.576 12.445 12.398
TABLE 4. ELECTRICITY PRODUCTION COSTS OF SELECTED NUCLEAR REACTORS
Parameters Units PWR-900 AP-600 GT-MHR* PBMR**
Annual electricity production
GW.h 7598 4873 2714
Net electrical power
MW(e) 1 X 951 1 X 610 2 X 286.2 5 X 114.9
Discount rate % 5 8 10 5 8 10 5 8 10 5 8 10
Specific construction cost
$/kW(e) 1763 1763 1763 2194 2194 2194 1073 1073 1073 1650 1650 1650
Specific investment cost
$/kW(e) 1992 2137 2237 2419 2559 2655 1182 1251 1298 1733 1782 1815
kW.h costs (in 10-2 $/kW.h)
Investment 1.453 2.243 2.864 1.765 2.686 3.398 1.56 2.01 2.34 2.31 2.92 3.37
O&M 0.872 0.882 0.901 1.10 1.10 1.10 0.3 0.3 0.3 0.3 0.3 0.3
Fuel cost 0.648 0.648 0.654 0.648 0.648 0.654 0.74 0.74 0.74 0.5 0.5 0.5
Total 2.973 3.773 4.419 3.51 4.43 5.15 2.60 3.05 3.38 3.11 3.72 4.17* According to its developers [8] ; kWh cost, as estimated by DEEP-3, includes additional site related construction cost and the dismantling cost (= 0,7% of the construction cost) ** According to PBMR company [9] ; kWh cost, as estimated by DEEP-3, includes additional site related construction cost and the dismantling cost (= 0,7 % of the construction cost)
133

A4.3.2. RESULTS OF DESALINATION COST CALCULATIONS A4.3.2.1 Calculation hypotheses
The desalination costs were obtained from the DEEP-3 code for various combinations of power plants and desalination processes as shown in Table 5. It should be noted that the ROph process has not been included here since the appropriate models as developed in [13], have not yet been incorporated in DEEP-3
TABLE 5. CALCULATED INTEGRATED DESALINATION SYSTEMS
Desalination process
Energy source
MED RO
PWR-900 X X
AP-600 X X
GT-MHR X
PBMR X
CC-600 X X
Furthermore, the combinations such as the GT-MHR +RO and the PBMR +RO are not calculated because we believe that the main interest of these two reactors lies in the Utilization of waste heat. The costs with the RO process, which only requires electricity, would be in direct proportion to the electricity costs of these reactors compared to the other two PWRs.
There are at present no models in the DEEP-3 code for the Utilization of waste heat from the GT-MHR and the PBMR. These models were separately developed at CEA [6] and then used in DEEP-3 as follows:
Adaptation of a nuclear reactor model from DEEP-2.2 to calculate the power costs of the GT-MHR and the PBMR from the economic data provided by [10,11].
Calculation, as presented in [6], of the total amount of waste heat that can be transferred to a MED plant coupled to these two reactors through an intermediate circuit.
Input of these values of the total heat in the adapted DEEP-2.2/DEEP-3 models to obtain the desalination costs. Because the waste heat is evacuated to the heat sink in any case, it was assumed that the heat cost in the models was zero.
The main hypotheses of the desalination costs calculations are given below:
Average seawater temperature = 21 °C.
Average seawater salinity = 38371 ppm.
Other principle hypotheses regarding the desalination plants are summarised in Table 6:
134

TABLE 6. ASSUMED CHARACTERISTICS OF THE DESALINATION PLANTS
Desalination process Parameters Units
MED RO
Currency reference year 2006
Interest/discount rate % 5, 8, 10
Base module capacity m3/day 12 000 12 000
Nominal production capacity m3/day 48000 48000
Specific construction cost $/m3/day 900 900
Average salaries (Tunisian conditions)
Management
Labour – technical staff
$/year
20 000
7 000
Availability % 0.91 0.91
Desalination plant construction lead time months 16 16
A4.3.2.2. Desalination cost results
The results of desalination cost calculations are presented in Table 7 for the PWR-900 plant, in Table 8 for the CC-600 plant, in Table 9 for the AP-600 plant and in Table 10 for the two gas cooled HTRs:
TABLE 7. DESALINATION COSTS BY THE PWR-900 REACTOR
Parameters Units MED RO
Discount/interest rate % 5 8 10 5 8 10
Average daily production m3/day 39703 43676
Specific construction cost of the desalination plant $/m3 1252 1252 1252 1112 1112 1112
Specific investment cost of the desalination plant $/m3 1293 1318 1334 1149 1171 1185
Desalted water cost $/m3 0.7064 0.8877 1.0272 0.5003 0.6106 0.6941
135

TAB
LE 8
. D
ESA
LIN
ATI
ON
CO
ST F
OR
TH
E C
C-6
00 S
YST
EM C
OU
PLED
TO
MED
AN
D R
O P
RO
CES
SES.
Para
met
ers
Uni
ts
MED
R
O
Gas
Pric
e
$/to
e 15
0 29
1 43
6 15
0 29
1 43
6
Gas
Pric
e
$/bb
l 20
.62
40
60
20.6
2 40
60
Dis
coun
t rat
e
%
5 10
5
10
5 10
5
10
5 10
5
10
Prod
uctio
n m
3 /day
39
289
4367
6
Spec
. pla
nt c
onst
cos
t $/
(m3 /d
ay)
1112
11
12
1112
11
12
1112
11
12
1112
11
12
1112
11
12
1112
11
12
Spec
ific
desa
linat
ion
plan
t inv
estm
ent c
ost
$/(m
3 /day
)11
49
1185
11
49
1185
11
49
1185
11
49
1185
11
49
1185
11
49
1185
Des
alte
d w
ater
cos
t $/
m3
0.84
41.
021
1.19
61.
3589
1.
5593
1.70
70.
5616
0.71
370.
6811
0.82
830,
8044
0.
9465
TAB
LE 9
. D
ESA
LIN
ATI
ON
CO
ST W
ITH
TH
E A
P-60
0 R
EAC
TOR
Para
met
ers
Uni
ts
MED
R
O
Dis
coun
t/int
eres
t rat
e %
5
8 10
5
8 10
Ave
rage
dai
ly p
rodu
ctio
n m
3 /day
39
703
4367
6
Spec
ific
cons
truct
ion
cost
of t
he d
esal
inat
ion
plan
t $/
(m3 /d
ay)
1252
12
52
1252
11
12
1112
11
12
Spec
ific
inve
stm
ent c
ost o
f the
des
alin
atio
n pl
ant
$/(m
3 /day
) 12
93
1318
13
34
1149
11
71
1185
Des
alte
d w
ater
cos
t $/
m3
0.75
79
0.95
08
1.09
71
0.51
75
0.63
164
0.71
75
136

TABLE 10. DESALINATION COST WITH THE GT-MHR + MED AND PBMR + MED
SYSTEMS, UTILIZING WASTE HEAT
Parameters Units GT-MHR* PBMR**
Discount/interest rate % 5 8 10 5 8 10
Average daily production m3/day 38720 42604
Specific construction cost of the desalination plant $/(m3/day) 1242 1242 1242 1242 1242 1242
Specific investment cost of the desalination plant $/(m3/day) 1283 1307 1323 1283 1307 1323
Desalted water cost $/m3 0.5067 0,6271 0.7167 0.5773 0.7198 0.8257
* providing 2 X 69.3 MW(th) of waste heat to the MED plant ** providing 5 X 30.5 MW(th) of waste heat to the MED plant
A4.3.2.2. Discussion
For purposes of the comparison of desalination costs by all the power sources considered, the results are summarised in Table 11 for 8 % discount rate and gas price of 60 $/bbl for the CC-600 plant, which reflects the current gas price in the world markets. The figures in parentheses give the differences (in %) as compared to the desalination cost of the CC-600 as reference. These differences are calculated for a given process as:
Δ = 100 X [desalination cost (reactor- CC-600)/ desalination cost CC-600].
TABLE 11. COMPARISON OF DESALINATION COSTS OF NUCLEAR REACTORS WITH THAT OF CC-600 PLANT (60$/bbl) AT 8 % DISCOUNT RATE
CC-600 PWR-900 AP-600 GT-MHR PBMR
Parameters Units
MED RO MED RO MED RO MED* MED*
Average daily production m3/day 39289 43676 39703 43676 39289 39289 38720 42604
Specific Construction cost of the desalination plant
$/(m3/day) 1112 1112 1252 1112 1252 1112 1242 1242
Specific investment cost of the desalination plant
$/(m3/day) 1171 1171 1318 1171 1318 1171 1307 1307
Desalted water cost $/m3 1.6415 0.8851 0.8877 0.6106 0.9508 0.63164 0,6271 0.7198
Δ % - - (- 46) (- 31) (- 42) (- 29) (- 62) (- 56)
* utilizing waste heat
137

This table shows that:
• Compared to the CC-600, the construction costs of the integrated MED plants with nuclear reactors is slightly higher because of the necessity of including the cost of the intermediate circuit between the reactors and the desalination plant.
• The MED desalination cost by the PWRs such as the PWR-900 and the AP-600 are respectively 46 and 42 % lower than the corresponding cost by the CC-600 plant.
• The lowest costs with the MED plants are obtained by the GT-MHR and the PBMR, utilising virtually free waste heat. Compared to the cost by the CC-600 +MED system, these reactors, coupled to MED give desalination costs which are respectively 62 % and 56 % lower.
• Even compared to the PWR-900 + MED system, GT-MHR + MED system leads to 29 % lower cost. Compared to the corresponding AP-600 based system, this cost is 34 % lower.
• Compared to the PWR+ MED system, the cost of PBMR + MED system is 19 % lower.
• Compared to the AP-600 + MED system, this cost is 24% lower.
• Compared to the CC-600 + RO system, the corresponding desalination costs by the PWR-900 + RO and AP-600 + RO are respectively 31 and 29 % lower.
For all energy sources considered, the desalination costs with RO are lower than with MED.
A4.5. CONCLUSIONS IAEA has recently issued a new, corrected version of the desalination costs evaluation code DEEP. This work was, therefore, undertaken to up date the previous economic evaluations reported in [2, 4], and made with the older versions of DEEP.
CEA has, in addition, developed its own models to evaluate the economics of gas cooled reactors, such as the GT-MHR and the PBMR, whose concepts allow the Utilization of waste heat from their pre-cooler and intercooler exchangers.
Power and desalination costs were obtained with four nuclear reactors (PWR-900, AP-600, GT-MHR and PBMR) and compared to the gas turbine, combined cycle plant, CC-600. All these energy sources were coupled to MED and RO desalination processes, operating in the co-generation mode.
Analysis of the results obtained shows that:
• In all conditions, the four nuclear options lead to much lower power and desalination costs as compared to those by the CC-600 plant, provided the gas prices remain ≥ 150 $/toe.
• With all the energy sources, desalination costs with the RO process are lower than the corresponding costs with the MED plant. However, the permeate salinity with the RO process is of the order of 200 ppm (acceptable with the WHO drinking water standard) where as MED produces water with only 25 ppm residual salinity. The choice between the two processes is thus dependent on local industrial and potable (and/or irrigation) water requirements
REFERENCES [1] S. NISAN, et al, Seawater Desalination with Nuclear and Other Energy Sources, Nuclear
Engineering & Design, 221, 251-275 (2003). [2] S. NISAN, et al, Inter-Regional Collaborative Nuclear Desalination Studies by France and
Tunisia, Int. J. Nuclear Desalination, Vol 1, 308-324, N°3 (2004). [3] P. GOWIN, et al, Nuclear Desalination, IAEA Activities and Economic Evaluation for Southern
Europe, Desalination 126, 301 (1999). [4] S. NISAN, et al, Evaluation of Desalination Costs with DEEP, Int. J. Nuclear Desalination, Vol
1, 298-307, N°3 (2004).
138

[5] M. METHNANI, “Recent model developments for the Desalination Economic Evaluation
Program DEEP”, International Desalination Association, International Conference, Singapore (2005).
[6] S. DARDOUR, et al, Utilization of Waste Heat from the GT-MHR and the PBMR for Seawater Desalination, European Desalination Society, EUROMED 2006 Conference, Montpellier, (France), May (2006).
[7] INTERNATIONAL ATOMIC ENERGY AGENCY, AP-600 Reactor System Description and Development Status, IAEA-TECDOC-881, IAEA, Vienna (1996).
[8] INTERNATIONAL ATOMIC ENERGY AGENCY, Current Status and Future Development of Modular High Temperature Gas Cooled Reactor Technology, IAEA-TECDOC-1198, IAEA, Vienna (2001).
[9] PBMR (Pty) Ltd, PBMR website http://www.pbmr.com/. [10] S.NISAN, et al, SEMER: A Simple Code for the Economic Evaluation of Nuclear and Fossil
Energy Based Power Production Systems, Nuclear Engineering & Design, 221, 301-313 (2003). [11] M. P. LABAR The Gas Turbine-Modular Helium Reactor: A Promising Option for Near Term
Deployment, General Atomics, GA-A23952, April 2002, Website General Atomics, http://www.ga.com/gtmhr/images/ANS.pdf.
[12] D. NICHOLLS, (Private communication to the IAEA, NPTDS, February 2005). [13] S. NISAN, et al, A New Method for the Treatment of Reverse Osmosis Process, with
Preheating of the Feed-water, Desalination, 182, 483-495 (2005).
139


ANNEX 5 INDIA
ECONOMIC ASSESSMENT OF HYBRID NUCLEAR DESALINATION DEMONSTRATION PROJECT P.K. Tewari, V.K. Srivastava, S. Prabhakar, S.T. Panicker, A.K. Adak, G. Kishore
Bhabha Atomic Research Centre, Mumbai, India
ABSTRACT The technical and economic assessment of hybrid nuclear desalination project (Kalpakkam) has been discussed. The impact of pre-heat RO on the techno-economics of water production has been investigated with the help of design softwares and experimental studies. All the seawater membranes, considered for study, exhibited increase in water flux and reduction in solute rejection at higher temperatures. At higher temperature, operating at higher pressure is found to be more economical than operating at constant recovery. Studies were conducted on the usability of MSF reject streams as feed to RO and RO reject stream as feed to MSF. Based on the optimization studies on hybridization, it has been noted that, better quality drinking water at reasonable cost can be produced by combining RO and MSF in 1:2 ratio and by using the MSF coolant return water as feed to RO. Economic evaluation of integrated membrane system for seawater desalination has been carried out. Economic assessment on capacity scaling-up benefits of MSF and RO plants has been presented. Scale-up benefits in RO is marginal as it is modular in nature. Cost benefits due to scale-up are significant in the case of MSF. As energy cost constitutes a major fraction in MSF water cost, utilizing low grade heat or waste heat will reduce the production cost substantially. Experimental studies on nuclear desalination by using waste heat from the nuclear research reactor (CIRUS) for sea water desalination has been presented.
A5.1. INTRODUCTION Desalination technology is a proven option to augment the water resources in the water scarcity areas. As a part of the programme, for improving the quality of life of large Indian population by systematic induction of nuclear energy, Bhabha Atomic Research Centre (BARC) has been engaged in R&D on desalination since 1970s to develop indigenous technologies for providing freshwater from seawater in water scarce areas.
Over a period of time BARC has successfully developed desalination technologies based on Multi-Stage Flash (MSF) evaporation, Reverse Osmosis (RO) and Low Temperature Evaporation (LTE). Based on these technologies, a number of desalination plants have been successfully demonstrated.
From the feedback of decades of operational experience of MSF and RO plants at Trombay, BARC has undertaken establishment of the Nuclear Desalination Demonstration Project (NDDP) at Kalpakkam, Tamil Nadu. The NDDP consists of a Hybrid MSF-RO desalination plant of 6300 m3/day capacity (4500 m3/day MSF and 1800 m3/day SWRO) coupled to 2 x 170 MW(e) PHWRs at the Madras Atomic Power Station (MAPS), Kalpakkam.
The requirements of seawater, steam and electrical power for the desalination plants are met from MAPS-I and MAPS-II.. The hybrid plant has provision for redundancy, utilization of streams from one to other and production of two qualities of products for their best utilization.
The seawater reverse osmosis (SWRO) plant which is already commissioned, operates at relatively lower pressure (51.5 bar during first year and 54 bar during third year) to save energy, employs lesser pre-treatment (because of relatively clean feed-water from MAPS outflow) and aims for longer membrane life resulting in lower water cost. The MSF plant, which is in advanced stage of completion, is designed for higher top brine temperature with Gain Output Ratio (GOR) of 9 and utilizes less pumping power (being of long tube design). Figure 1 gives the schematic diagram of 6300 m3/day MSF-RO desalination plant of NDDP coupled to MAPS.
141

A5.2. DESCRIPTION OF THE NDDP-HYBRID SYSTEM The hybrid nuclear desalination plant is integrated to a PHWR of 2X170 MW(e). The hybrid plant has provision for redundancy, sharing of seawater and production of two qualities of products for drinking and industrial purposes. The concept of hybridization is shown in Figure 1.
The desalination plant can meet the fresh water needs of around 45 000 persons at 140 litres per capita per day. There is a provision of augmentation of product water capacity by blending the low TDS product of MSF plant with product of SWRO plant. This will then serve the need of larger population.
The main objective of the project is to demonstrate the indigenous capability of design, fabrication, installation, testing, commissioning and operation of Nuclear Desalination Plants and to generate data for large size future plants of similar type. A part of MSF product water will be used as makeup water for power plant and remaining water of MSF will be mixed with RO plant product water.
Figure 1. Schematic diagram of the hybrid system.
A5.2.1. THE PHWR, MAPS The MAPS reactors are pressurized heavy water reactors that produce 170 MW(e)/unit. The basic design parameters are presented in Table 1. The reactor is described in detail in [1].
142

TABLE 1. THE BASIC DESIGN PARAMETERS OF MAPS
ITEM Value or description
Net Electrical Output 170 (MW(e))
Moderator D2O, Pressure: 7.5 (kg/cm2)
Temperature: 44 °C(in), 65 °C(out)
Primary Heat Transport System D2O, Pressure: 87 (kg/cm2)
Temperature: 249 °C(in), 293 °C(out)
Secondary Heat Transport System H2O/Steam, Steam Pressure: 40 (kg/cm2),
Temperature: 253.3 °C, 0.28% wet Exhaust Steam from High Pressure (HP) Turbine Pressure: 6 (kg/cm2), 11.2 % wet
Inlet Steam to Low-pressure Turbine Pressure: 5.7 (kg/cm2), Temperature: 233.3 °C
Condenser Coolant : Sea water,
Temperature: 30 °C(in), 40 °C(out) Steam Pressure Inlet to Condenser 0.087 (kg/cm2)
A5.2.2. THE MULTISTAGE FLASH (MSF) PLANT The major contribution to desalination capacity comes from MSF plant. As one of the leading desalination process, it is preferred due to its operational simplicity and proven performance. MSF is advantageous in large capacity where thermal energy in the form of low pressure steam is available. It has a distinct advantage where high purity water is required.
Two major arrangements are used in MSF, the brine recirculation system and once through system. In the recirculation type, the makeup feed is mixed with recycle brine and preheated in the heat recovery section of MSF. The recirculation type requires lesser amount of pre-treated feed seawater compared to once through system and thus has lower chemical cost.
A MSF plant designed for high Gain Output Ratio (GOR) requires less steam thereby reducing the energy consumption. This, in turn, reduces the energy cost of MSF plant. However, it requires a larger number of flashing stages.
The top brine temperature in MSF plant is restricted to 121°C to avoid calcium sulphate scaling. The temperature rise of the brine across the brine-heater is fixed on the basis of optimization of water production cost with respect to Gain Output Ratio (GOR) and number of flashing stages. Steam consumption increases with temperature rise across the brine-heater.
The GOR in terms of brine-heater temperature rise and flash range is given as:
1/R = ((T1 – T4)/(T1 – T2))(1 + (Cp(T1 – T2)/2λ))
where
Cp = Specific heat of the brine = Latent heat of vaporization of the brine
T1 = Top brine temperature
T2 = Blow down temperature
T4 = Brine temperature at brine heat inlet
R = Gain output ratio
143

As (T1 – T4) increases, the heat input requirement per unit of water production increases and the GOR decreases.
As the energy cost is high in India, a high GOR desalination plant giving lower water production cost is preferred. Hence, MSF desalination section of NDDP (Kalpakkam) is designed for GOR of 9, compared to conventional MSF plant operating in Gulf countries.
Efforts have been further directed to bring down energy cost due to pumping power requirement by choosing long tube design instead of cross tube design. The PHWR generates high pressure steam at 240°C at a pressure of 40 bar. The steam tapping required for the desalination plant brine heater is made from the cold reheat lines after the HP turbines exhaust with adequate moisture separation. The small quantity of high pressure steam required for steam jet ejectors is made available using HP steam at 40 Kg/cm2. The technical specification of 4500 m3/day MSF plant which is a high GOR MSF section of 6300 m3/day hybrid MSF-RO plant of NDDP (Kalpakkam) is given in Table 2.
TABLE 2. TECHNICAL SPECIFICATIONS OF 4500 m3/day MSF PLANT
Parameters Value
General
Production
Recycle flow
Sea water flow in reject module
Feed sea water to de-aerator
Blow-down flow
Steam flow to brine heater
GOR
Feed sea water salinity
Blow-down salinity
Average product salinity
No. of heat recovery stages
No. of heat reject stages
187.5 (m3/hr)
1454.9 (m3/hr)
1160.9 (m3/hr)
375.0 m3/hr
187.5 (m3/hr)
20 833.3 (kg/hr)
9
36 000 (ppm)
70 000 (ppm)
20 (ppm)
36
3
Tubes
Tube material
Tube OD
Tube Thickness
Tube sheet material
90:10 Cu-Ni Alloy
19.0 mm
1.245 mm
90:10 Cu-Ni Alloy
Temperatures
Brine temp. rise in brine heater
Sea water temperature.
Blow-down temperature.
Top brine temperature(TBT)
Brine temperature. in to brine heater
Brine temp. entering to reject module
Steam temp. entering to brine heater
8.2 (oC)
30.0 (oC)
40.0 (oC)
121.0 (oC)
112.8 (oC)
47.8 (oC
126.0 (oC)
144

The MSF plant needs about 21 t/h dry saturated steam at 2.8 kg/cm2 for the brine heater and 0.5 t/h dry saturated steam at 8 kg/cm2 for the steam jet ejectors. Source of steam for both the brine heater and the ejectors is the nuclear power plant (NPP). To avoid ingress of radioactivity through the steam to the desalination system, isolation heat exchangers (IHE) are provided in between the NPP and the desalination plant. α, β and tritium levels in the water streams are regularly monitored.
A5.2.3. THE REVERSE OSMOSIS (RO) PLANT The RO plant consists of (1) pre-treatment section, (2) RO section and (3) permeate post treatment section. The pre-treatment section includes chemically aided clarifier, sand filter, activated carbon filter and micron filter. The RO section constitutes high pressure pump, energy recovery system and membrane modules. A lime stone column followed by an alkali addition system completes the post treatment. The main features of the RO plant are given in Table 3.
TABLE 3. MAIN FEATURES OF THE RO PLANT
Features Specification
Capacity 1800 (m3/day)
Type of module 8040, spiral wound
Recovery 35 %
Solute Rejection 98.5 %
A5.3. COUPLING OF DESALINATION PLANT WITH NUCLEAR POWER STATION, KALPAKKAM
The NDDP hybrid plant is coupled with MAPS I & II for the required thermal and for electrical energies and also for the intake sea water requirements of the plant. It is ensured that the product water is free from any contamination under normal and anticipated operational failure occurrences. At the same time it should meet the national and international (WHO ) drinking water standards.
Figure 2. Coupling of the desalination plant to nuclear reactor by an Isolation loop.
Reactor
Loop
Isolation Heat Exchanger Brine Heater
Desalination
Plant Loop Isolation
Loop
145

The general coupling of a desalination plant to nuclear reactor by an intermediate loop is shown in Figure 2. The possible combination of H-L-H11 configuration or L-H-L configuration were considered for safety analysis of the system. The H-L-H configuration, which is nothing but the pressure reversal existing in the brine heater, has been adapted. It is the most effective design solution as any loss of integrity in the barrier would cause a leak of water towards the intermediate loop. Figure 3 shows the schematic coupling arrangements of NDDP, Kalpakkam with the two units of the nuclear power reactor MAPS.
Figure. 3. Coupling arrangement of NDDP, Kalpakkam, with MAPS.
A5.4. ECONOMIC ANALYSIS BY USING DEEP-3 CODE A.5.4.1. OBJECTIVES The objective of this report is to study the technical and economic analysis of a hybrid nuclear desalination project. Hybrid desalination plant in NDDP (Kalpakkam) consists of MSF and RO. Cost of water from RO is more sensitive to seawater characteristics. This requires careful specifications of input seawater to carry out the cost effective design. In order to meet this objective, monthly analysis of seawater samples was carried out. Based on the analytical information, it is possible to arrive at an optimum design for a given site-specific location. The extreme data could be useful in predicting the cost implication at off design conditions.
The RO plant utilizes the cooling seawater reject from MSF plant as feed. Hence, the performance analysis of the studies carried out for seawater RO at elevated temperature has been analysed with an objective to enhance the performance of hybrid desalination plant, coupled to a nuclear reactor and its impact on cost economics.
11 H: High pressure; L: low-pressure
146

A5.4.2. COST EVALUATION OF MSF PRODUCT WATER: Cost of water for MSF plant has been calculated using DEEP-3 and BARC’s own method. The water cost by DEEP-3 is $ 1.28/m3, whereas, the cost by BARC method is $ 1.18/m3 for the 15000 m3/day plant. Basic input data and desalted water cost are given in Table 4.
TABLE 4. BASIC INPUT DATA FOR COST CALCULATIONS
Parameters DEEP 3.0 BARC
Plant capacity (m3/day) 15 000 15 000
Base cost ($/ m3/day) 1435 1000
Feed TDS (ppm) 35 000 35 000
Feed Temperature.( 0C) 30 30
GOR 9.0 9.0
Interest Rate (%) 7.0 7.0
Discount Rate (%)
Amortization Factor (%)
7.0
8.0
8.6 (@7.0% int.)
Plant Life (years) 25 25
Plant availability (%) 90 90
Levelized Power cost ($/ kWh)
Purchased Elect. Cost ($/ kWh) 0.045
0.04
Local average salary
Manager $/year/person.(4 in total.)
Labour $/year/person.(10 in total.)
9300
2700
9300
2700
Product Cost ($/m3) 1.28 1.18
1$ = Indian Rupees 45
A.5.4.2.1. Sensitivity Analysis for MSF Plant Using DEEP 3.0 and BARC Method:
Sensitivity analysis with respect to plant capacity, temperature, power consumption, cost of power, interest rate and discount rate has been performed.
The basic assumptions and input data for the sensitivity analysis are:
Initial construction date: 2005
Initial year of operation: 2006
Unit size: 15 000 m3/day
Plant life: 25 years
Capacity scale up factor: 0.6 ( from 4500 m3/day to 15 000 m3/day )
147

Capacities considered: 15 000, 75 000, 150 000, 225 000 and 300 000 m3/day
Interest rates: 4, 5, 6, 7 and 8 %
Discount rate: 5, 6, 7 and 8 %
Energy cost: $ 0.04, $ 0.07, $ 0.09, $ 0.1, and $ 0.11/kW.h
DEEP calculation
Specific cost of Nuclear Plant 1700 $/kW
Average Specific cost of Desalination Plant 1435 $/m3/day
Management Salary 9300 $/year/person (Number of persons: 4)
Labour Salary 2700 $/year/person (Number of persons: 10)
Levelized Power cost = 0.045 $/kW.h with a 220MW(e) PHWR
The results are presented in Table 5
TABLE 5. SPECIFIC INVESTMENT COST (FROM DEEP-3) AS A FUNCTION OF DESALTING CAPACITY
Capacity (m3/day) 15 000 75 000 225 000 300 000
Specific investment cost ($/m3/day) 1435 1435 1471 1471
BARC calculation method
Maximum capacity of a single unit = 25 000 m3/day. Performance ratio=9.0
Amortization cost is calculated based on the amortization factor = i(1+i)n/{(1+i)n-1}
i= rate of interest
Management Salary 9300 $/year/person (number of persons: 4)
Labour Salary 2700 $/year/person (Number of persons: 10)
Results are presented in Table 6.
TABLE 6. SPECIFIC INVESTMENT COST (FROM BARC’s METHOD) AS A FUNCTION OF DESALTING CAPACITY
The variation of water cost with plant capacity is also illustrated in Figure 4. It is noted that the water cost calculated by DEEP is higher than BARC cost because the base cost considered in DEEP is higher than the BARC cost as shown in the Figure.
Capacity (m3/day) 4500 15 000 75 000 225 000 300 000
Specific investment cost ($/m3/day)
1609.38 994.28 810.5 810.5 810.5
148

Figure. 4. Variation of water cost with capacity of the plant.
The variation of water cost with power cost is shown in Figure.5. It implies that desalted water cost is a strong function of power cost.
Figure 5. Variation of water cost with power cost.
Figure 6 shows the variation of water cost with interest rate. The same variation with the discount rate is shown in Figure 7. BARC cost is not given because the interest rate is used to calculate the amortization factor
1
1.08
1.16
1.24
1.32
1.4
15000 75000 150000 225000 300000
Capacity of Plant (cu m/day)
Wat
er C
ost (
$/cu
m)
DEEPBARC
Int: 5%, Discount: 8%, Levelized Power cost: 0.045$/kWh
0
1
2
3
4
0.04 0.07 0.09 0.1 0.11Cost of power ($/kWh)
Wat
er c
ost (
$/cu
m)
DEEPBARC
Capacity: 15000cu m/day, Int: 5%Discount: 8%
149

Figure 6. Variation of water cost with interest rate.
Figure 7. Variation of water cost with discount rate.
A.5.4.2.2. Cost Evaluation of RO plant using DEEP 3.0 and BARC Method:
Cost of water for 1800 m3/day seawater RO plant has been calculated using DEEP 3 and BARC method. The water cost by DEEP 3 is $ 0.94/m3 whereas, the cost by BARC method is $ 0.95/m3.
The basic input data are:
Plant Capacity : 1800 m3/day
Base cost: $ 1177 /m3/day ( Including intake and outfall)
Feed TDS : 35 000 ppm
Water Recovery : 35%
Energy Recovery : 30 %
Temp. : 300C
Membrane life : 5 years
Unit cost of RO element : $ 1333
00.20.40.60.8
11.21.4
5 6 7 8Discount Rate (%)
Wat
er c
ost (
$/cu
m)
DEEP
11.21.41.61.8
22.2
4 5 6 7 8
% Interest
Wat
er c
ost (
$/cu
m)
DEEPBARC
Capacity: 15000cu m/day, Levelized Power cost: 0.045$/kWh, Discount: 8%
150

No. of elements and manpower requirement calculated by DEEP.
Local average salary at $ 9300/year for managers and $ 2700/year for other staff.
Specific cost of 1800 m3/day RO plant (NDDP) : $ 1100/ m3/day
Interest rate : 7 %
Plant life : 25 years
Energy cost : $ 0.07/kW.h
Plant availability : 90 %
Total power consumption is 5.1 kW.h/m3 (4.5 kW.h/m3 for RO and 0.6 kW.h/m3 for pre-treatment )
BARC’s method:
Results are presented in Table 6.
TABLE 6. RO DESALINATION COSTS BY BARC’S METHOD
A.5.4.3. SENSITIVITY ANALYSIS FOR RO PLANT USING DEEP-3:
Sensitivity analysis with respect to plant capacity, temperature, power consumption, cost of power, interest rate and discount rate has been carried out.
The basic assumptions and input data are the same as mentioned above. Other assumptions are:
Capacities considered : 15 000, 75 000, 150 000, 225 000 and 300 000 m3/day
Interest rates : 4, 5, 6, 7 and 8 %
Discount rate : 5, 6,7 and 8 %
Energy cost : 0.04$, 0.07$, 0.09$, 0.1$, and 0.11 $/kW.h
Seawater temperature : 28 0C to 40 0C
Plant availability : 90 %
Period of construction (lead time): 24 months ( for all capacities)
Calculated total power consumption is 5.1 kW.h/m3 (4.5 kW.h/m3 for RO and 0.6 kW.h/m3 for pre-treatment ) and is constant for all capacities. ( The design flux remains the same, only membrane area linearly increases and pressure also remains the same).
Parameter Value
Capital Cost 2 118 600 ($)
Interest 148 302 ($/year)
Depreciation 148 302 ($/year)
Fixed cost 0.39 ($/m3)
Power, chemicals, spares, membrane replacement & Labour 0.56 ($/m3)
Water Cost 0.95 ($/m3))
151
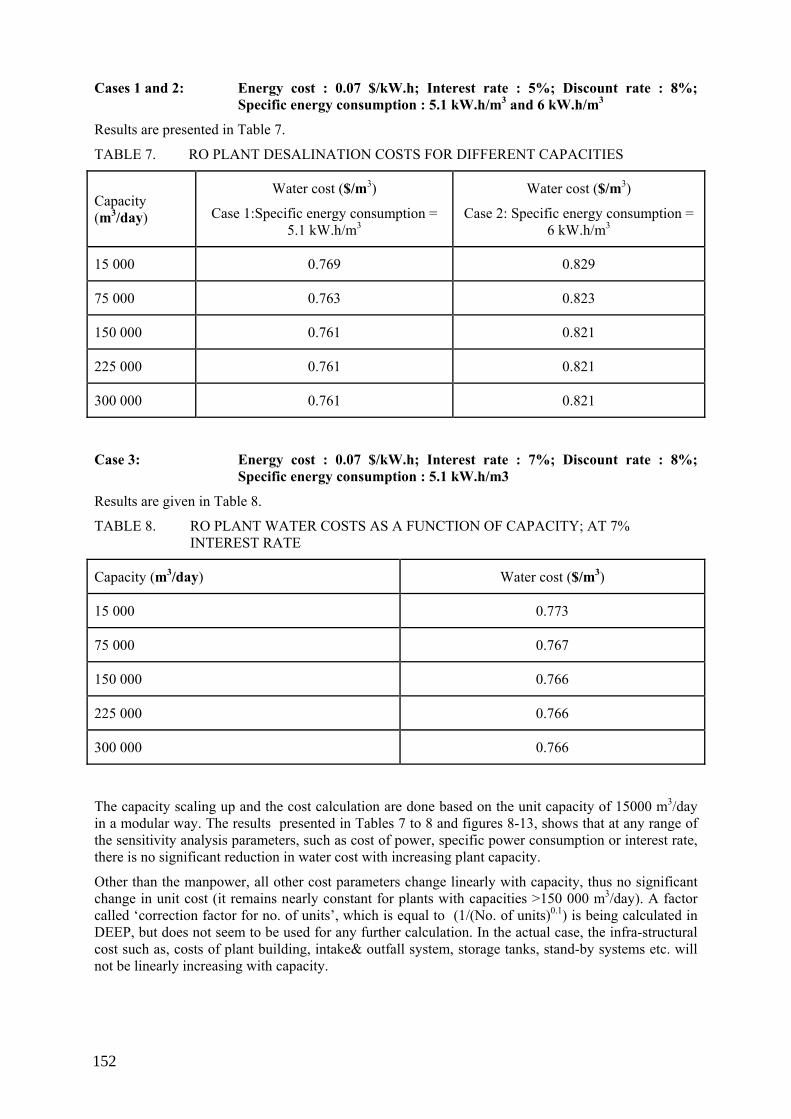
Cases 1 and 2: Energy cost : 0.07 $/kW.h; Interest rate : 5%; Discount rate : 8%;
Specific energy consumption : 5.1 kW.h/m3 and 6 kW.h/m3
Results are presented in Table 7.
TABLE 7. RO PLANT DESALINATION COSTS FOR DIFFERENT CAPACITIES
Capacity (m3/day)
Water cost ($/m3)
Case 1:Specific energy consumption = 5.1 kW.h/m3
Water cost ($/m3)
Case 2: Specific energy consumption = 6 kW.h/m3
15 000 0.769 0.829
75 000 0.763 0.823
150 000 0.761 0.821
225 000 0.761 0.821
300 000 0.761 0.821
Case 3: Energy cost : 0.07 $/kW.h; Interest rate : 7%; Discount rate : 8%; Specific energy consumption : 5.1 kW.h/m3
Results are given in Table 8.
TABLE 8. RO PLANT WATER COSTS AS A FUNCTION OF CAPACITY; AT 7% INTEREST RATE
Capacity (m3/day) Water cost ($/m3)
15 000 0.773
75 000 0.767
150 000 0.766
225 000 0.766
300 000 0.766
The capacity scaling up and the cost calculation are done based on the unit capacity of 15000 m3/day in a modular way. The results presented in Tables 7 to 8 and figures 8-13, shows that at any range of the sensitivity analysis parameters, such as cost of power, specific power consumption or interest rate, there is no significant reduction in water cost with increasing plant capacity.
Other than the manpower, all other cost parameters change linearly with capacity, thus no significant change in unit cost (it remains nearly constant for plants with capacities >150 000 m3/day). A factor called ‘correction factor for no. of units’, which is equal to (1/(No. of units)0.1) is being calculated in DEEP, but does not seem to be used for any further calculation. In the actual case, the infra-structural cost such as, costs of plant building, intake& outfall system, storage tanks, stand-by systems etc. will not be linearly increasing with capacity.
152

Figure 8: Variation of water cost with specific power consumption,
0,4
0,6
0,8
1
1,2
4 4,5 5 5,5 6 6,5 7 7,5 8 8,5Specific Energy Consumption (kW.h/m3)
Wat
er C
ost (
$/m
3)
Capacity : 15000 m3/day; Interest : 5%Dicsount : 8%; Power Cost : $ 0.07/ kwh
Figure 8 shows that for a 30% variation of specific power consumption, increase in water cost is by around 14%.
Figure 9. Variation of water cost with power cost.
0,4
0,6
0,8
1
1,2
0,04 0,06 0,08 0,1 0,12Cost of Power ($/kW.h)
Wat
er C
ost (
$/m
3)
Capacity : 15000 m3/day; Interest : 5%; Dicsount : 8%;
Sp. Energy Consumption : 5.1 kwh/m3
According to Figure 9, the average change in water cost is by 13%, for a 30% variation in cost of power.
153

Figure 9: Varaiation of water cost with interest rate
0,4
0,5
0,6
0,7
0,8
0,9
1
1,1
1,2
3 4 5 6 7 8 9% Interest
Wat
er C
ost (
$/m
3)
Capacity : 15000 m3/day; Dicsount : 8%Sp. Energy Consumption : 5.1 kwh/m3Power Cost : $ 0.07/ kwh
Figure 10 shows that the effect of variation in interest rate is negligible on water cost.
0,4
0,5
0,6
0,7
0,8
0,9
1
1,1
1,2
4 4,5 5 5,5 6 6,5 7 7,5 8 8,5Discount rate (%)t
Wat
er C
ost (
$/m
3)
Capacity : 15000 m3/day; Interest: 5%Sp. Energy Consumption : 5.1 kwh/m3Power Cost : $ 0.07 / kwh
As is seen in Figure 11, the average variation of water cost with a 30% change in discount rate is around 5%.
Figure 10: Variation of water cost with interest rate.
Figure 10. Variation of water cost with discount rate.
154

0,4
0,6
0,8
1
1,2
20 25 30 35 40 45Seawater Temperature (0C)
Wat
er C
ost (
$/m
3)Capacity : 15000 m3/day; Interest: 5%; Discount : 8%Power Cost : $ 0.07 / kwh
Figure 12. Variation of water cost with feed water temperature.
In DEEP-3, a constant recovery system is considered and the effect of temperature is only on pressure and not on the membrane area and the variation of pressure with temperature is marginal. Thus, the water cost remains almost constant as seen in Fig 12. But, the values calculated using Film Tech RO design software ‘ROSA’, indicate significant variation in pressure with temperature as shown in Fig. 13. Correspondingly, the water cost also is varying.
Fig. 6. REDUCTION OF PRESSURE WITH TEMPERATURE
40
45
50
55
60
25 30 35 40
Temperature (0C)
Pres
sure
(bar
)
ROSADEEP 3
Figure 13. Reduction of pressure with temperature.
155

A5.5. HYBRID SYSTEM (MSF-RO) Table 9 shows the cost of production of different water quality at NDDP.
TABLE 9. COST OF DIFFERENT QUALITY WATER IN HYBRID SYSTEM
Type of desalination process
Product quality
(ppm)
Water cost
($/m3)
RO 350 to 500 0.95
MSF 10 1.18
Hybrid (MSF & RO) 125 to 175 1.10
It can be noted that the cost of desalted water depends on its quality. The product water quality from RO plant is about 350 to 500 ppm TDS and the water cost is $ 0.95 $/m3. The desalted water from MSF plant is of almost distilled quality (10 ppm TDS) and the water cost is higher ($ 1.18 $/m3). This water can be utilised by the industries which require high quality, high value desalted water for their process requirement and better quality water for drinking purpose. The water from hybrid system is of 125 to 175 ppm quality and the water cost (1.10 $/ m3) is in between RO and MSF.
A5.6. CONCLUSION Many coastal regions of India already face water scarcity and there exists great potential for seawater desalination. Rapid industrialisation in these area requiring pure water is already projected. The requirement of desalted water in such urban areas is estimated to be in the range of 100 – 200 million litres per day (MLD), where high purity water is required by the industries and potable water is required by the local population for domestic use. The hybrid desalination technology, therefore, appears to be most appropriate for such regions.
Energy is one of the major input for processing water and nuclear energy is going to be an important source of power. Nuclear plants and desalination plants are seen as cogeneration projects in the future. The vision is that every nuclear plant produces hydrogen, electricity and water for meeting the future challenges.
Expertise is available in India for the design of large size MSF and RO plants for seawater desalination and LT-MED technology for utilization of low grade and waste heat for producing pure water from saline water.
Cost of desalted water is a strong function of specific energy consumption and power tariff. It is more evident in the case of RO. Power tariff being a local constant, water cost can be brought down mainly by reducing the energy consumption. In the case of MSF, low grade/ waste heat utilization or minimizing the power loss due to coupling would help in achieving lower cost of production.
In the case of RO, higher flux membranes and more efficient energy recovery systems would reduce the specific energy consumption. Scale–up has got a stronger influence on water cost of MSF, compared to that of RO. The water cost in MSF is 24% higher than that in RO however it produces better quality water. Permeate water quality from RO deteriorates with time leading to replacement of membrane. In a hybrid system, it is possible to maintain the drinking water quality for a long time by adding the distillate from the MSF in desired proportion, thereby extending the effective life of membranes.
The experience in implementing the NDDP at Kalpakkam gives considerable confidence in designing, installing, testing and commissioning the coupling schemes of nuclear desalination plant.
156

ANNEX 6 REPUBLIC OF KOREA
ECONOMIC EVALUATION OF NUCLEAR DESALINATION BY USING SMART M.K. Lee, S.S. Kim Korea Atomic Energy Research Institute, Republic of Korea
ABSTRACT The Republic of Korea has been developing SMART(System-integrated Modular Advanced ReacTor), which is an integral type pressurized water reactor with a capacity of 330MW (th), and it is being developed for the dual production of electricity and water. This study deals with the economic assessment of the SMART-MED alternative, which is expected to become the most economical option in SMART desalination. The DEEP computer model developed by IAEA is used to calculate the electricity and water costs. The SMART-MED with 40 000 m3/day resulted in the rather low water cost of 0.63 US $/m3 and an electricity cost of 0.031 US $/kW(e).h. Sensitivity analysis is also carried out with respect to several major variables such as a capital cost, an interest/discount rates, an electricity cost, a plant availability factor, and a nuclear fuel cycle cost. Among these sensitivity variables an interest rate is analyzed to be the most influential factor on the SMART-MED economics, which is followed by the availability factor. In conclusion, SMART-MED project is evaluated to become a promising and competitive business if the reasonable financing would be set forth beforehand.
A6.1. INTRODUCTION During the last couple of decades, Korea has achieved dramatic economic development without facing water shortage problems. However, manufacturing sectors, which consume large amount of water, have been expanded greatly. Korea was thus recently classified as one of the water scarce countries by the U.N. and asked to make a proper preparation for possible water shortage in the coming future.
Korea has been developing SMART (System-integrated Modular Advanced ReacTor), which is an integral type pressurized water reactor with a thermal capacity of 330 MW, and it is being developed for the dual application of electricity generation and seawater desalination. SMART Pilot Plant Construction Project has already been launched in order to demonstrate the technology adopted in SMART design following completion of the basic design.
This study deals with the economic assessment of nuclear desalination using SMART. The IAEA Desalination Economic Evaluation Programme (DEEP) was used to calculate the costs of electricity generated and water produced. MED is considered as the only water production desalination process to be coupled with SMART because of its excellent prospects for economic advantage and technological development. The target water production capacity is 40 000 m3/day to meet the requirement of both electricity and water supply for a population of approximately 100 000. Sensitivity analysis has also been carried out with respect to several major parameters such as capital costs, interest/discount rates, electricity cost, plant availability and nuclear fuel cycle cost.
The methodology for the economic assessment of SMART coupled with the MED process is also reviewed.
A6.2. ECONOMICS OF THE DUAL PURPOSE PLANT Dual purpose plant producing electricity and water based on distillation process has the economic advantages over two single purpose plant of electricity and water. However, dual purpose plant also has some disadvantages for the joint operations in several aspects.
A6.2.1. ECONOMIC ADVANTAGES OF DUAL PURPOSE PLANT First, there is a fuel saving in the dual purpose desalination plant, since all or part of the condensation heat from the turbine exhaust serves as a heat source for the desalination plant instead of being wasted.
157

Second, construction of dual purpose plant leads to saving in the total investment due to economies of scale. Land requirement and site preparation costs are reduced. Similarly, some ancillary equipment is used in common.
Third, due to joint operation of common facilities, less staff is needed in a dual-purpose plant than in two single-purpose plants for the same outputs.
A6.2.2. ECONOMIC DISADVANTAGES OF DUAL PURPOSE PLANT First, the operation of dual purpose plant is not flexible. The best performance of the combined production of water and electricity is realized once the dual purpose plant is operating under its rated conditions. The variation in the water to electricity ratio is allowed in most designs, but it causes loss of efficiency or extra investment.
Second, site selection of a dual-purpose plant is complicated in order to satisfy both power and water transportation requirements.
Third, availability factor of a dual-purpose plant is lower than those of two separate plants. Outage occurred in one plant inevitably influences the operation of the other plant, because the two plants are coupled.
Lastly, there may be base load penalty in the operation of dual purpose plants. It is likely that the desalination section with its storage facility will be designed for base load operation. In order for the desalination section to do base load operation, the power section should operate as a base load. However, the base load operation of the alternative power only plant may not be the case. This results in extra cost to the electric system.
A6.2.3 INPUT DATA The general input data for the economic evaluation of SMART are shown in the Table 1. The input values for the discount rate and interest rate are in real term and they follow the guideline given by the Korean government.
TABLE 1. GENERAL INPUT DATA FOR THE ECONOMIC ANALYSIS
Item Unit Value
Discount and interest rate %/year 7
Basic date of cost reference/initial year of operation Year 2005/2015
Plant economic lifetime Years 40
Average annual seawater temperature °C 21
Seawater total dissolved solids ppm 38 500
Purchased electricity cost $/MWh 0.07
For the energy plant, the specific input data (for one unit) economic analysis are given in Table 2.
158

TABLE 2. THE COST AND PERFORMANCE INPUT DATA FOR A PWR TYPE PLANT
Specific construction cost $/kW(e) 1714
Construction lead time Months 36
Specific O&M cost, including decommissioning and waste management costs
$/MWh 5.59
Specific nuclear fuel cost $/MWh 8
Reference power plant unit net output MW(e) 100
Auxiliary load/availability factors % 5.3/90
Reference net thermal efficiency % 30.3
Main steam temperature °C 286
For the distillation plant, the specific input data used are given in Table 3.
TABLE 3. THE COST AND PERFORMANCE INPUT DATA FOR THE MED PLANT
Reference unit size for cost m3/day 24 000
Base unit cost $/(m3/day) 900
Optional in/outfall specific base cost $/(m3/day) 71
Optional intermediate loop cost $/(m3/day) 85
Construction lead time Months 12
Average management salary $/year 66 000
Average Labour salary $/year 29 700
Annual water plant O&M cost M$/year 1.96
Required water plant capacity m3/day 40 000
Cooling water temperature °C 21
Water plant operating availability % 96
Water plant specific power use(MED only) kWh/m3 1.1
MED plant condenser range °C 5
A6.2.4. ELECTRICITY GENERATION COST OF A SINGLE-PURPOSE POWER PLANT
The cost and performance calculation of SMART as a single-purpose power plant, as well as a dual purpose plant are shown in Table 4. As can be observed, the levelized electricity generation cost is 0.031 $/kWh. The largest part of the total generation cost is the annual capital charge of 58%, followed by the fuel cost of 24%, and the annual O&M cost of 18%.
159

TABLE 4. THE PERFORMANCE AND COST RESULTS FOR SMART
Specific investment cost(incl. IDC) $/kW(e) 1855
Levelized fixed charge rate % 7.5
Total annual required revenue M$/year 24.9
Levelized annual capital cost M$/year 14.2 (58%)
Levelized annual O&M cost M$/year 4.4 (18%)
Levelized annual fuel cost M$/year 6.3 (24%)
Annual electricity production GW.h 806
Levelized electricity generation cost $/kW.h 0.031
A6.2.5. WATER PRODUCTION COST OF DESALINATION PLANT The water production cost was calculated to be 0.63 $/m3. Details are shown in Table 5.
Fixed charge is the largest item, accounting for 50.2% of the total annual expenses, and it is followed by heat cost, accounting for 17.7% of total annual expenses. The value of heat cost is dependent on the levelized power cost of SMART because desalination plant is coupled with power plant.
TABLE 5. THE RESULTS OF THE PERFORMANCE AND COST CALCULATIONS FOR DISTILLATION PLANT
Water plant specific base cost(overnight cost) $/(m3/day) 1056
Specific investment cost $/(m3/day) 1261
Annual water plant fixed charge M$/year 4.0 (50.2%)
Annual water plant heat cost M$/year 1.4(17.7%)
Annual water plant electricity power cost M$/year 0.6(7.5%)
Water plant annual O&M cost M$/year 1.96(24.6%)
Total annual expense M$/year 7.96
Installed water plant capacity m3/day 42 000
Total(combined) water production availability % 86
Annual water production m3/year 12 618 342
Average daily water production m3/day 34 571
Levelized water cost $/m3 0.63
A6.2.6. SENSITIVITY ANALYSIS Sensitivity analysis was carried out with respect to several parameters such as discount rate, electricity cost, plant availability, and capital costs. The values of each parameter in the sensitivity analysis are shown in Table 6.
160

TABLE 6. THE PARAMETERS AND THEIR VALUES IN THE SENSITIVITY ANALYSIS
Lower value Basic value Higher values
Interest rate/discount rate(%) 5 7 8 10
Electricity costs/fuel cycle costs($/MWh) 0.06/6 0.07/8 0.09/10
Power Plant availability (%) 85 90 95
PWR($/kW(e)) 1543 1714 1885 2057 2228 Capital costs power and water plants MED ($/m3/day) 810 900 990 1080 1170
Results of the sensitivity analysis are presented in Table 7:
TABLE 7. THE RESULTS OF SENSITIVITY ANALYSIS
Variables Values Power cost($/kWh) Water cost($/m3)
5 0.027 0.54
7 0.031 0.63
8 0.033 0.68 Interest rate/Discount rate (%/year)
10 0.038 0.79
0.06 0.031 0.63
0.07 0.031 0.63 Electricity cost ($/kWh)
0.09 0.031 0.63
6 0.029 0.62
8 0.031 0.63 Nuclear Fuel Cycle Cost ($/MWh)
10 0.033 0.64
85 0.032 0.66
90 0.031 0.63 Power Plant Availability (%)
95 0.030 0.61
1543 / 810 0.029 0.59
1714 / 900 0.031 0.63
1885 / 990 0.033 0.67
2057 / 1080 0.034 0.70
Capital costs ($/kW(e)) /($/m3)
2228 / 1170 0.036 0.74
161

Some of the results are also graphically illustrated in Figure 1.
Figure 1. Graphical illustration of the sensitivity analysis.
In case of capital costs, those of power plant and desalination plant are supposed to be changed simultaneously by 10% from the capital costs in a base case. In the above Figure, the point with yellow background shows the result of a base case. The sensitivity analysis shows that the electricity generation costs are in the range from 0.027 to 0.038 $/kWh, and that water costs are in the range from 0.54 to 0.79 $/m3. Among the parameters to which variations was given in the sensitivity analysis, discount rate was identified to have the greatest impact on the economics of nuclear desalination. The possible explanation can be found in the fact that variations of discount rates have direct impacts not only on the power plant but also on the water plant at the same time. The capital costs of energy/water plants and the availability of power plant also appeared to have a great impact on the economics of nuclear desalination. It is worth noting that availability of power plant has a great impact on the water cost because it influences the combined availability of the dual purpose plant.
A6.3. CONCLUSION The SMART reactor, coupled with MED process, has been considered as the most probable alternative for nuclear desalination in Korea. However, since there is no practical experience in the construction of small-sized advanced reactors, it is difficult to obtain reliable data for reactor construction as well as coupling part (e.g. intermediate loop) for SMART. In the meantime, it is expected that the economic competitiveness of SMART would be highly improved through the continuous R&D activities and learning effect. Taking into consideration the uncertainties in the major parameters, the sensitivity analysis was performed with respect to the parameters such as interest rate, electricity cost, plant availability, nuclear fuel cycle cost, and capital costs.
In the sensitivity analysis, discount rate was identified to have the greatest impact on the water cost. The economics of the nuclear desalination by using SMART appeared to be promising.
This observation is based not only on the state of the art technology associated with SMART but also on the economic parameters considered in this study.
IR:5%
IR:10%
IR:7%
NFC:10NFC:6IR:7%
NFC:8AF:90%
CAP:0(Base)
AF:95%
AF:85%
CAP:+30%
CAP:+20%
CAP:+10%
CAP:-10%
0.5
0.55
0.6
0.65
0.7
0.75
0.8
0.025 0.03 0.035 0.04
Electricity price($/kWh)
Wate
r price($
/m3)
Interest rate NFC cost A.F Capital cost
162

ANNEX 7
PAKISTAN
COUPLING THE KARACHI NUCLEAR POWER PLANT (PHWR; 137 MW(E)) TO A THERMAL SEAWATER DESALINATION PLANT (MED TYPE) K Mahmood, M.A. Samee
PAEC, Islamabad, Pakistan
ABSTRACT This study summarizes our results on the utilization of an existing CANDU type nuclear reactor operating near the major city of Karachi as the energy source for desalination with an MED process, producing about 1600 m3/day of desalted water. Techno-economic studies have also been carried out and the sensitivity of water costs investigated as functions of discount and interest rates, water plant capacity, total water production availability, water plant base cost and water plant average management salaries. It is shown that: • Discount/interest rate plays an important role in the economics of a desalination project. With a 30 %
decrease in interest/discount rate, water cost decreases to about 16 %. • For small size plants the effect of capacity on the water cost is not appreciable. However, for large size
plants (> 100 000 m3/day) an appreciable reduction in water cost with the increase in capacity is expected. • Combined water and power plant availability factor is another important parameter which appreciably
affects the water cost. With a 30 % increase in availability factor the water cost decreases to about 18 %. • Water plant base cost also appreciably affects the water cost. With a 30 % decrease in water plant base cost
the water cost decreases to about 18 %. • Management salaries have no significant influence on water costs
A7.1. INTRODUCTION The demand and supply gap of potable water in Karachi, one of the major cities of Pakistan, was 1.07 Mm3/day in 2001. Current water consumption in Karachi (14 million population) is below 132 litres per person per day, which is less than half of 265 litres per person per day recommended by United Nation as the minimum quantity needed for urban communities in the developing countries.
The population growth rate (5 % per annum) of Karachi reveals that by the year 2010 and 2020 it will need 4.546 Mm3/day and 7.728 Mm3/day of potable water respectively. According to “Karachi Water and Sewerage board”, the current demand of water is 3.73 Mm3/day taking into account the losses. Present and future water demands in Karachi are shown in Table 1.
TABLE 1. PRESENT AND FUTURE WATER DEMAND IN KARACHI
Year Estimated population (million) Demand (Mm3/day) 2005 14 3.73 2010 18 4.55 to 5.91 2020 29 7.73 to 11.4
The total straight length of seashore of Pakistan is 990 km and with actual contour measurement it comes out to be 1046 km, of which 670 km is in Balochistan and remaining 320 km lies in Sindh. The major towns along the seashore of Balochistan are Gawader, Pasni, Turbat and Giwani.
The coastal regions of Sindh and Balochistan are witnessing rapid urban and industrial growth, so that a concerted effort is required to produce potable water from Arabian Sea as well as from the high salinity wells in the Southern regions. There is therefore a flourishing future for desalination industry in these areas.
Presently the installed capacity of desalination plants in Pakistan is shown in Table 2.
163

TABLE 2. DESALINATION PLANTS INSTALLED CAPACITY IN PAKISTAN
Type of Plant Total Number Total capacity (Mm3/day)
Brackish Water RO 75 54.6 MED 4 5.5 VC 2 0.91
The list of desalination projects, which are either in feasibility stage, under construction or under serious consideration, and the status of each project is presented in Table 3.
TABLE 3. NEW DESALINATION PROJECTS
Project Capacity (m3/day) Process Status Karachi Port Trust 95 000 SWRO Under construction Karachi City Govt. 2 X 95 000 SWRO Agreement signed Defense Housing Authority Karachi 14 000 MED + RO Contract signed
KANUPP-I 1600 (Nuclear Desalination
Demonstration Project) MED
Under Construction
KANUPP-II, III 2 X 95 000 MED + RO Under serious consideration
Defense Housing Authority Karachi 11 000 (Not finalized yet) Feasibility study is
in progress KWSB 75 000 (Not finalized yet) EOI Invited
Sindh Govt. (Not finalized yet) Wind Power integrated desalination plant
Feasibility study is in progress
A7.2. OBJECTIVES The main purpose of this case study is to identify and quantify the factors which have important effects on the cost of product water. The following factors are considered for the sensitivity analysis.
• Discount rate / Interest rate
• Water plant capacity
• Total water production availability
• Water plant base cost
• Average management salaries
A7.3. ASSUMPTIONS For this study, Karachi Nuclear Power plant (PHWR,137 MW(e)) is assumed to be coupled with an MED plant of 10 000 m3/day capacity, with a GOR 6 and 8 effects. The “DEEP” (Beta version 3.0) is used to analyze the desalination cost. The base values of different parameters are shown in Table 4. For sensitivity analysis a variation of ± 30 % in the base values is considered.
164

TABLE 4. BASE VALUE OF DIFFERENT PARAMETERS FOR SENSITIVITY ANALYSIS
Parameter Base Value Discount/Interest rate 8.0 (%) Water plant capacity 10 000 (m3/day) Total water production availability 0.75 Water plant base cost 1800 ($/m3/day) Operation and maintenance personnel salaries 35 000 ($/a) Oil Price 65 ($/bbl)
It should be noted that the water plant base cost is determined from the actual cost of Nuclear Desalination Demonstration plant of 1600 m3/day capacity, which is under construction at Karachi Nuclear Power Plant (KANUPP). It does not include the Intermediate Coupling Loop (ICL) cost, seawater supply cost and the cost of other auxiliaries. However these costs are included in the case study.
The following other assumptions were made for the analysis:
• Specific construction cost of power plant is taken as zero because the nuclear power plant (KANUPP) already exists since 1972.
• Remaining life time of energy plant is taken as 10 years.
• Water plant cost contingency factor is assumed as zero.
• Water plant owner’s cost is assumed as zero.
• Interest during construction is taken as zero.
• Cost of seawater intake, power supply circuit, makeup water circuit, product water storage tank etc. are included in ICL cost.
• No back up heat source is considered, so purchased electricity cost is not valid in this case study.
• MED plant is to be manufactured locally.
• Import duties, taxes etc are considered as 5 %.
To compare the water cost from nuclear as energy source with water cost from fossil fuel as energy source, an existing fossil steam turbine power plant of 137 MW(e), running with furnace oil as fuel is assumed. MED plant main parameters and the capacity are considered the same as in nuclear energy option. Other base parameters are assumed to be the same as those given in Table 4.
A7.4. RESULTS AND DISCUSSIONS A7.4.1. DISCOUNT RATE AND INTEREST RATE Discount and interest rates have more pronounced effect on water cost. It was found that by increasing the discount rate 30 % the water cost increases 17 %. Similarly by decreasing the discount and interest rate 30 % the water cost decreases 16 % as shown in Table 5. The graphical representation of this variation is shown in Figure 1.
165

TABLE 5. SENSITIVITY OF LEVELIZED WATER COST TO DISCOUNT AND INTEREST
RATES
Discount Rate(%/a) Water cost ($/m3) 10.4 1.16 9.92 1.13 9.44 1.09 8.96 1.06 8.48 1.02 8.00 0.99 7.52 0.96 7.04 0.93 6.56 0.89 6.08 0.86 5.60 0.83
0.8
0.9
1
1.1
1.2
5 5.5 6 6.5 7 7.5 8 8.5 9 9.5 10 10.5 11 11.5
Discount & Interest Rates(%/a)
Wat
er C
ost($
/m3)
Figure 1. Sensitivity of water cost to discount and interest rates.
A7.4.2. WATER PLANT CAPACITY Water cost decreases with the increase in water plant capacity, and vice versa as shown in Table 6, and presented graphically in Figure 2. Increasing the water plant capacity by 30%, the water cost decreases by 0.30 %. Similarly by decreasing the water plant capacity by 30 %, the water cost increases by 0.50 %.
166

TABLE 6. SENSITIVITY OF LEVELIZED WATER COST TO WATER PLANT CAPACITY
Water Plant Capacity (m3/day) Water cost ($/m3)
13000 0.987
11800 0.988
10600 0.989
10000 0.99
9400 0.991
8800 0.992
8200 0.993
7600 0.994
7000 0.995
0.98
0.982
0.984
0.986
0.988
0.99
0.992
0.994
0.996
0.998
1
6800 7200 7600 8000 8400 8800 9200 9600 10000 10400 10800 11200 11600 12000 12400 12800 13200 13600 14000
Water Plant Capacity (m3/d)
Wat
er C
ost (
$/m
3)
Figure 2. Sensitivity of water cost to water plant capacity.
.
A7.4.3. TOTAL WATER PRODUCTION AVAILABILITY Total water production availability has a pronounced influence on the water cost. Increasing the water production availability by 30 % the water cost decreases by 18 %. Similarly by decreasing the water production availability by 30 % the water cost increases by 34%. This variation is tabulated in Table 7, and is shown graphically in Figure 3.
167

TABLE 7. SENSITIVITY OF LEVELIZED WATER COST TO TOTAL WATER
PRODUCTION AVAILABILITY
Total Water Production Availability Water cost ($/m3) 0.98 0.81 0.93 0.84 0.88 0.88 0.84 0.91 0.79 0.95 0.75 0.99 0.70 1.04 0.66 1.09 0.62 1.15 0.57 1.23 0.52 1.33
0.8
0.84
0.88
0.92
0.96
1
1.04
1.08
1.12
1.16
1.2
1.24
1.28
1.32
1.36
1.4
0.5 0.54 0.58 0.62 0.66 0.7 0.74 0.78 0.82 0.86 0.9 0.94 0.98
Total Water Production Availability
Wat
er C
ost (
$/m
3)
Figure 3. Sensitivity of water cost to total water production availability.
A7.4.4. WATER PLANT SPECIFIC BASE COST Water plant specific base cost also has an important effect on the water cost. Table 8 shows that by increasing the water plant base cost 30 % the water cost increases 18 %. Similarly by decreasing the water plant base cost 30 % the water cost decreases 18 %. This variation is shown graphically in Figure 4.
168

TABLE 8. SENSITIVITY OF LEVELIZED WATER COST TO WATER PLANT SPECIFIC BASE
COST Water Plant Base Cost ($/m3/day) Water cost ($/m3)
2340 1.17 2232 1.13 2124 1.09 2016 1.06 1908 1.02 1800 0.99 1692 0.95 1584 0.92 1476 0.88 1368 0.85 1260 0.81
0.8
0.83
0.86
0.89
0.92
0.95
0.98
1.01
1.04
1.07
1.1
1.13
1.16
1.19
1200 1290 1380 1470 1560 1650 1740 1830 1920 2010 2100 2190 2280 2370
Water Plant Specific Base Cost ($/m3/d)
Wat
er C
ost (
$/m
3)
Figure 4. Sensitivity of water cost to water plant specific base cost.
A7.4.5. AVERAGE MANAGEMENT SALARY The variation in average management salary has no significant effect on the water cost as shown in Table 9. There is only an increase of 0.40 % in water cost for a 30 % increase in salaries; similarly the decrease in water cost is 0.40 % for 30 % decrease in salaries. The graphical representation of this variation is shown in Figure 5.
169
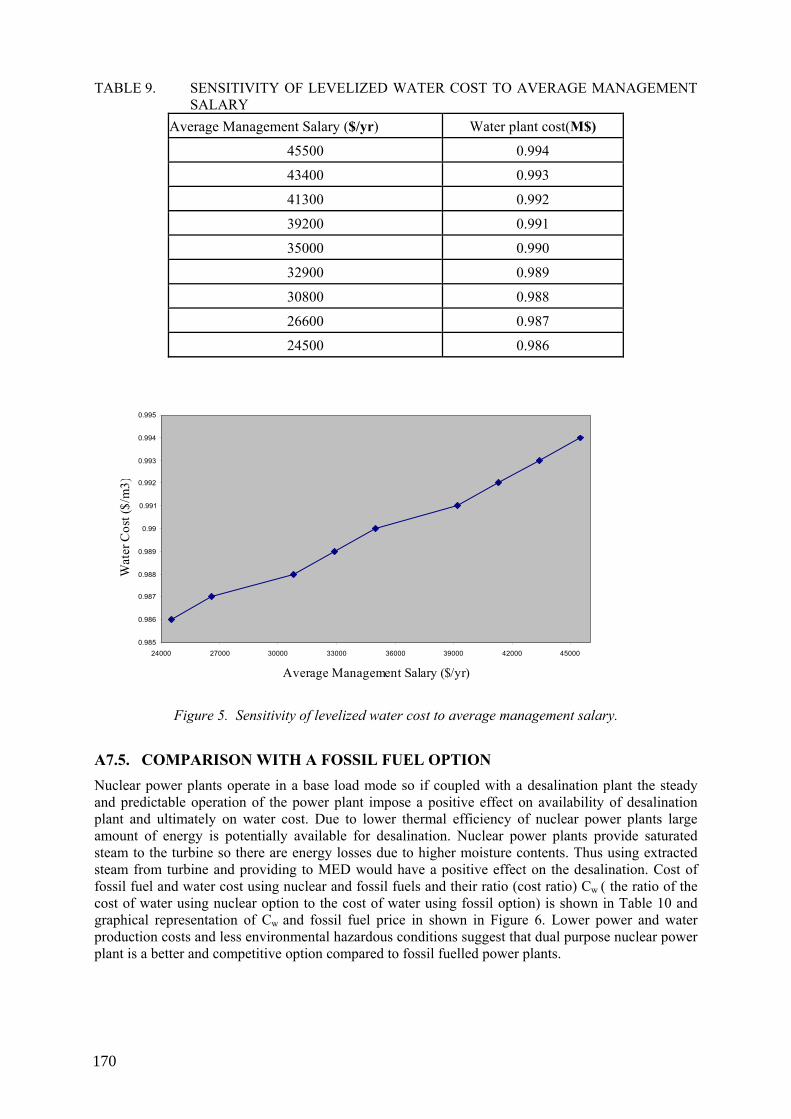
TABLE 9. SENSITIVITY OF LEVELIZED WATER COST TO AVERAGE MANAGEMENT
SALARY Average Management Salary ($/yr) Water plant cost(M$)
45500 0.994
43400 0.993
41300 0.992
39200 0.991
35000 0.990
32900 0.989
30800 0.988
26600 0.987
24500 0.986
0.985
0.986
0.987
0.988
0.989
0.99
0.991
0.992
0.993
0.994
0.995
24000 27000 30000 33000 36000 39000 42000 45000
Average Management Salary ($/yr)
Wat
er C
ost (
$/m
3)
Figure 5. Sensitivity of levelized water cost to average management salary.
A7.5. COMPARISON WITH A FOSSIL FUEL OPTION Nuclear power plants operate in a base load mode so if coupled with a desalination plant the steady and predictable operation of the power plant impose a positive effect on availability of desalination plant and ultimately on water cost. Due to lower thermal efficiency of nuclear power plants large amount of energy is potentially available for desalination. Nuclear power plants provide saturated steam to the turbine so there are energy losses due to higher moisture contents. Thus using extracted steam from turbine and providing to MED would have a positive effect on the desalination. Cost of fossil fuel and water cost using nuclear and fossil fuels and their ratio (cost ratio) Cw ( the ratio of the cost of water using nuclear option to the cost of water using fossil option) is shown in Table 10 and graphical representation of Cw and fossil fuel price in shown in Figure 6. Lower power and water production costs and less environmental hazardous conditions suggest that dual purpose nuclear power plant is a better and competitive option compared to fossil fuelled power plants.
170

TABLE 10. COMPARISON OF NUCLEAR AND FOSSIL FUEL OPTION
0,45
0,49
0,53
0,57
0,61
0,65
0,69
45 50 55 60 65 70 75 80 85 90
Fossil Fuel Cost ($/bbl)
Cw
Figure 6. Graphical representation of nuclear to fossil fuel cost ratio.
A7.6. CONCLUSIONS • DEEP is very useful tool for an initial assessment and to provide a preliminary indication about
the feasibility of a desalination project. • Discount/interest rate plays an important role in the economics of a desalination project. With a
30 % decrease in interest/discount rate, water cost decreases to about 16 %. • For small size plants the effect of capacity on the water cost is not appreciable. However, for large
size plants (> 100 000 m3/day) an appreciable reduction in water cost with the increase in capacity is expected.
• Combined water and power plant availability factor is another important parameter which appreciably affects the water cost. With a 30 % increase in availability factor the water cost decreases to about 18 %.
• Water plant base cost also appreciably affects the water cost. With a 30 % decrease in water plant base cost the water cost decreases to about 18 %.
• Average management salary has no significant effect on the water cost. • The use of nuclear heat to produce potable water from seawater is an attractive option for oil price
even below 45 $/bbl.
Fossil Fuel Cost ($/bbl)Water cost (Fossil) ($/m3)Water cost (Nuclear) ($/m3) Cw (Nuclear/Fossil)84.5 2.09 0.99 0.47 80.6 2.03 0.99 0.49 76.7 1.97 0.99 0.50 72.8 1.91 0.99 0.52 68.9 1.85 0.99 0.54 65.0 1.79 0.99 0.55 61.1 1.73 0.99 0.57 57.2 1.67 0.99 0.59 53.3 1.61 0.99 0.61 49.4 1.55 0.99 0.64 45.5 1.49 0.99 0.66
171


ANNEX 8 RUSSIAN FEDERATION
ECONOMIC EVALUATION OF NUCLEAR POWER AND DESALINATION COMPLEXES
V.I. Polunichev, S.A. Fateev, L.V. Gureeva OKB Mechanical Engineering, Russian Federation
ABSTRACT This study summarizes our extensive investigations aiming to realize three objectives:
• Search for technical solutions to enhance technical and economical performances, commercial attractiveness and competitive strength of the floating nuclear desalination complexes (FNDC) based on nuclear reactors such as KLT-40S, RITM-200 and on-shore systems based on the GT-MHR, all coupled to distillation and reverse osmosis desalination plants.
• Adaptation and update of IAEA program DEEP-3 and Russian program TEO-INVEST to evaluate economic efficiency of above nuclear desalination systems.
• Determination of innovative trends that lead to further safety enhancing and reduction of nuclear desalination costs; solution of non-proliferation issues.
The cost of desalinated water produced by fossil-fuel desalination complexes was also evaluated, and the competitiveness of KLT-40S and RITM-200 Floating Power Units was determined by comparison with the costs of fossil-fuel analogs. Both the nuclear options lead to lower power and desalination cost as compared by the fossil fuelled based systems under the following conditions:
• If fuel oil prices are higher than 90 to 120 $/t (for fuel oil cogeneration plant, specific capital costs equal 650-1300 $/kW in prices as of 2006);
• If coal costs prices are higher than 60 to 80 $/t (for coal cogeneration plant, specific capital costs equal to 1000 to 1400 $/kW, in prices as of 2006).
A8.1. INTRODUCTION This report presents the results of activities performed by OKBM (Russia) under the nuclear desalination program in 2005–2006. General purpose of the program was further development of Conceptual Designs of Russian nuclear desalination complexes (NDC) using small and medium power reactors and various desalination plants. Specific purposes were as follows:
• Search for technical solutions to enhance technical and economical performances, commercial attractiveness and competitive strength of the floating nuclear desalination complexes (FNDC) based on nuclear reactors such as KLT-40S, RITM-200 and on-shore systems based on the GT-MHR (international project), all coupled to distillation and reverse osmosis desalination plants.
• Adaptation and update of IAEA program (DEEP-3) [1] and Russian program (TEO-INVEST) [2] to evaluate economic efficiency of above nuclear desalination systems.
• Determination of innovative trends that lead to further safety enhancing and reduction of nuclear desalination costs; solution of non-proliferation issues.
Russian researchers analyzed many coupling schemes of reactors and desalination plants, which have various structure and equipment parameters. Sensitivity of NDC economic indices to variation of important performance parameters was also studied.
We believe that the factors, determining the future of nuclear desalination would be economic efficiency, safety and non-proliferation. Non-proliferation issues can be solved by using FNDC with long-term core life (period between reloading ≥ 10 years). This allows reloading fuel in parallel with repair in the country of FNDC Supplier (for example, in the Russian Federation).
The demand for small and medium power reactors will increase since they meet regional needs for potable water and electric power and require smaller capital costs. Presently the activities are underway to enhance safety and competitiveness of small and medium power reactors.
173

This case study presents the main results of techno-economic investigations of FNDCs of the PWR type such as KLT-40S and RITM-200, coupled to various desalination plants. The GT-MHR is considered as a ground based system, which could be used in the near future.
A8.2. FLOATING NUCLEAR DESALINATION COMPLEXES. A8.2.1. DESIGN OF FLOATING NUCLEAR DESALINATION COMPLEXES The floating nuclear desalination complex structure includes the following components: a FPU, desalination plant, hydraulic engineering installations, and coastal infrastructure.
The main component of the floating nuclear desalination complex is a completely independent floating power unit with two KLT-40S reactor plants and associated equipment and systems. These are intended for heat and power generation and supply. The FPU is a non-self-propelled ship towed to the destination, where it is placed and unfastened at mooring (hydraulic engineering) installations. The coastal infrastructure includes administrative buildings and transport and power supply systems. The floating power units with such reactors as KLT-40S and RITM-200 have been adopted as power sources for FNDCs. Desalination plants can be placed on the barge or on shore.
These reactors are schematically presented in Figures 1 and 2 [3, 4].
Figure 1. KLT-40S reactor plant. Figure 2. RITM-200 reactor plant. 1 – reactor
2 – primary circuit circulation pump 3 – containment 4 – condensation system for containment pressure decrease 5 – high-pressure gas cylinders 6 – steam generator 7 – metal-water shielding tank
1 – feed water piping 2 – steam line 3 – biological shielding flooring 4 – double-shutoff feed water valve 5 – double-shutoff steam valve 6 – containment
7 – reactor 8 – electric heater 9 – biological shielding 10 – metal-water shielding tank 11 – water storage tank
In all cases floating design of power unit on the basis of proven ship reactors is defensible and preferable for desalination.
174

The main advantages of the floating nuclear desalination complexes on the basis of the floating power units (FPU) are as follows:
• Construction and “turn-key” acceptance of the floating power unit at a specialized ship-building enterprise, ensuring a rigid monitoring of the quality of the activities to be performed at all stages of the technological cycle of construction, testing.
• Reduction of the construction lead time, down to 4 to 5 years. • 20 to 30% reduction of the financial costs for the FNDC construction, compared to the
ground based plants of similar power. • Possibility for FPU delivery to the place of operation in the assembled form and for the
return to the specialized enterprise for repair activities and decommissioning. • Simplification of seismic protection. • Solution of nonproliferation issue by excluding the refueling at the location.
The technical characteristics for floating desalination complexes are given in Table 1 [5].
TABLE 1. MAIN CHARACTERISTICS OF KLT-40S AND RITM-200 REACTOR PLANT
Characteristics KLT-40S RITM-200 Reactor type Pressurized water reactor Reactor block arrangement Modular Integral Primary coolant circulation Forced Rated thermal power, (MW) 150 210 Rated steam-generating capacity, (t/h) 240 340 Primary circuit parameters:
- pressure, (MPa) - temperature, (°С)
12.7 317
12.7 317
Secondary steam parameters: - pressure, (MPa) - temperature, (°С)
3.8 290
3.8 290
Feed water temperature, (°С) 170 170 Power consumption for house load, % of Nnom < 6 < 5 Dimensions of reactor with containment, (m) 7×7×11 ∅7×12 Radioactive waste and spent fuel storage dimensions, (m) 7×7×9 −
Project status Final Design Conceptual Design
KLT-40S, which is developed by OKBM, is an advanced transportation reactor plant of KLT-40-type, which has made a good showing during long-term failure-free operation at nuclear ice-breakers under severe conditions of Far North. Operating time of plants of such type, used at currently operating nuclear ice-breakers, exceeds 275 reactor-years.
KLT-40S is a two-loop plant with a pressurized water reactor, which is connected with the coil-type steam generator and circulating pumps of the primary circuit by means of coaxial nozzles.
Structure of the steam generating unit is given in Figure 1.
RITM-200 reactor plant has inherent safety feature determined by such design solutions as:
• Arrangement of primary circuit main equipment, including the pressurizer, in a single reactor vessel.
• Removal of large-diameter “pipe-in-pipe” nozzles.
175

• Minimization of quantity, length and diameter values of primary non-isolated pipelines. • Minimization of diameter values of contracting devices in reactor nozzles.
The required safety level is achieved with minimum simplified safety systems as compared with modular reactor.
Operational costs are reduced due to decrease of house loads power consumption and organic fuel reserves for backup and emergency power supply sources, parallel performance of reactor core reloading and plant overhaul, absence of limitations at implementation of NPP control concept “reactor driven by the turbine” with minimum steam relief at high maneuvering rate.
Capital costs are reduced due to considerable decrease of plant mass as compared with modular reactor plants, reduction of equipment range and scope of installation activities under conditions of a shipbuilding plant, etc.
The reactor core is characterized by increased overall dimensions, low fuel rating and enrichments that improve reactor core operational reliability.
The adopted design solutions allow manufacturing accessories and the entire integral reactor assembly at production facilities of a machine building plant, including railway transportation.
The plant construction period, including its installation, is reduced. This is caused by reduction of equipment range and elimination of labor-intensive installation activities at the construction plant.
Basic technical characteristics of the floating power units on the basis of KLT-40S and RITM-200 are presented in Table 2 [5, 6].
TABLE 2. BASIC TECHNICAL CHARACTERISTICS OF FPU OF FLOATING COGENERATION PLANT WITH KLT-40S AND RITM-200.
Characteristics Value Reactor type KLT-40S RITM-200 Number of units 2 1 FPU thermal power, (MW) 2×150 210 TGP maximum electric power, (MW), including:
- cogeneration turbine - backpressure turbine - condensing turbine
2×35.0 -
2×38.5
- 26.0 55.0
Electric power output to TGP grid, (MW), including: - cogeneration turbine with the extraction of 62.5 (Gcal/h)
from the turbine - backpressure turbine with the extraction of 125 (Gcal/h)
from the condenser - condensing turbine
2×20.5 -
2×36.0
-
22.5
51.5
The FPU with two KLT-40S units and the FPU with one RITM-200 unit, are presented in Figures 3 and 4.
176

Figure 3. Two-reactor FPU with KLT-40S reactor.
Fig. 4. One-reactor FPU with RITM-200 reactor.
Three optimal coupling schemes of floating power unit on the basis of two KLT-40S units with MED and RO plants have been studied:
• Variant 1 is a power desalination complex using steam extraction from cogeneration turbine for MED (2 x 62.5 Gcal/h).
• Variant 2 is a power desalination complex using steam extraction from backpressure turbine for MED (125 Gcal/h).
• Variant 3 is a power desalination complex with RO without preheating.
Figures 5, 6 and 7 give the schematic diagrams of desalination complexes by variants 1, 2 and 3, respectively.
177
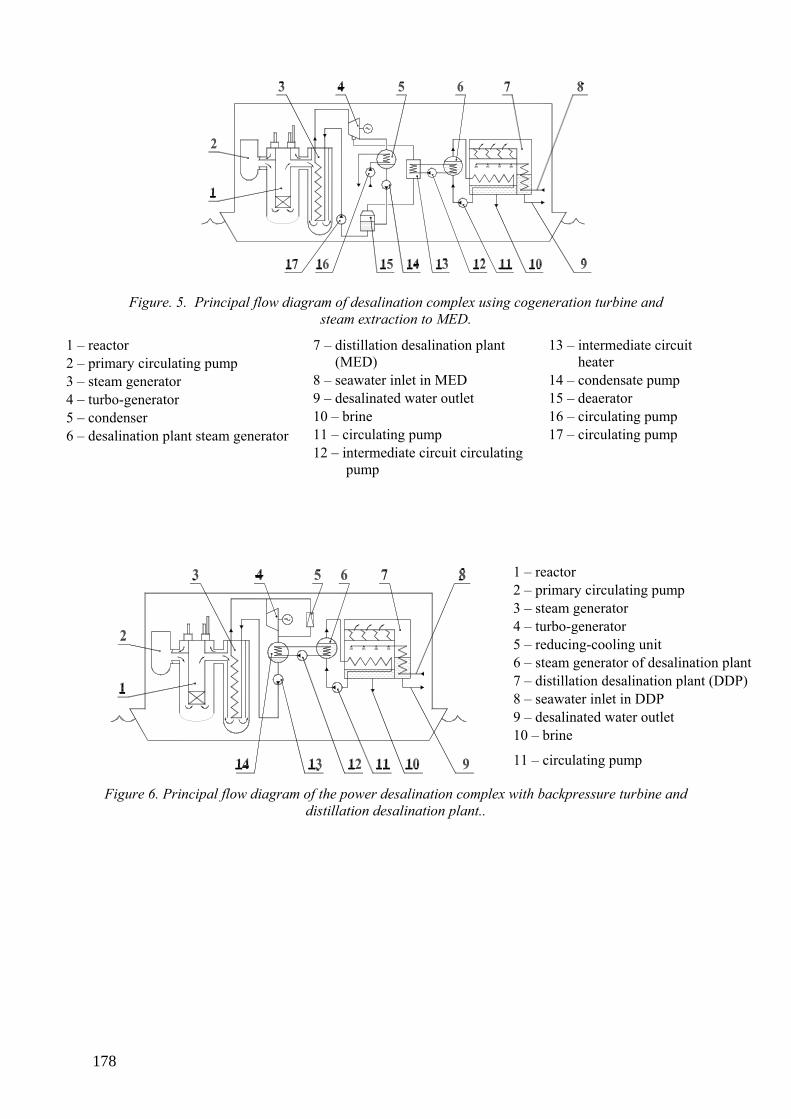
Figure. 5. Principal flow diagram of desalination complex using cogeneration turbine and steam extraction to MED.
1 – reactor 2 – primary circulating pump 3 – steam generator 4 – turbo-generator 5 – condenser 6 – desalination plant steam generator
7 – distillation desalination plant (MED) 8 – seawater inlet in MED 9 – desalinated water outlet 10 – brine 11 – circulating pump 12 – intermediate circuit circulating pump
13 – intermediate circuit heater 14 – condensate pump 15 – deaerator 16 – circulating pump 17 – circulating pump
Figure 6. Principal flow diagram of the power desalination complex with backpressure turbine and
distillation desalination plant..
1 – reactor 2 – primary circulating pump 3 – steam generator 4 – turbo-generator 5 – reducing-cooling unit 6 – steam generator of desalination plant7 – distillation desalination plant (DDP)8 – seawater inlet in DDP 9 – desalinated water outlet 10 – brine
11 – circulating pump
178

Figure 7. Principal flow diagram of the power desalination complex with condensing turbine, reverse
osmosis system without heating of seawater.
1 – reactor
2 – primary circuit circulating pump
3 – steam generator
4 – turbo-generator
5 – condenser
6 – prefilter
7 – medium-pressure pump
8 – recycle pump
9 – ultra-filtration membranes
10 – energy recovery system
11 – high pressure pump
12 – R.O. membranes
13 –brine discharge
14 – potable water storage tank
15 – potable water discharge pump
16 – chemical additions injection system
17 – ultra-filtration tank
18 – seawater supply pump
19 – condensate pump
20 – circulating pump
During operation of KLT-40S double-circuit power plant in nuclear desalination complex, an intermediate circuit is used to prevent radioactive contamination. Pressure in this circuit is higher than in steam sampling points and points of attachment with MED. The intermediate circuit has two heat exchangers, pump, pressurizer and piping.
Parameters of steam extracted from turbine and intermediate circuit depend on interface diagram of the circuit with MED. An appropriate variant is selected taking into account the following provisions:
Rational boiling temperature of seawater in first stage of evaporation; Structural simplicity of interface diagram; Possibility for implementation without additional research.
According to the techno-economic analyses in Russian conditions, the optimal boiling temperature of seawater in the first stage varies from 85 to 95 °C. At these temperatures the effectiveness of domestic de-scalants is high enough with low corrosion rate.
As for structural simplicity, the Russian MED designers propose the variant of heat transfer from intermediate circuit to MED through horizontal-pipe film evaporator-steam generator (Figure 9).
This diagram at the accepted temperature of seawater boiling in first stage can be realized at coolant parameters in reverse line of the intermediate circuit, which is no less than 90 °С.
179

Figure 9: Schematic interface diagram of intermediate circuit and DP.
In addition, other, more perspective interface diagrams were reviewed: with mechanical compressors, three-phase jet compressors of water steam, which allow decreasing the temperature of return water in intermediate circuit down to 60–70°С. Unfortunately, the domestic industry does not manufacture the above mentioned compressors. Their development would thus require specific research and development.
For the implementation of a proposed coupling, there is a sufficient scope of technical knowledge and experience.
Schematic coupling diagrams of RITM-200 with MED and RO are similar.
A8.3. RESULTS OF TECHNO-ECONOMIC ANALYSIS OF FLOATING NUCLEAR DESALINATION COMPLEXES.
A8.3.1. THE BASIC INDICES.
The result of the techno-economic analysis was the prime cost of desalinated water and electricity produced by a floating nuclear desalination complex based on KLT-40S or integral RITM-200 reactor, coupled to MED or RO systems. Calculations were made by two methodologies (IAEA and Russian). The boundary tariffs for desalinated water and electricity produced by floating nuclear desalination complex were determined, as well as their payback term, profit and project profitability coefficients.
Comparative calculations were made by considering several variants and taking into account the following conditions:
• Identical conditions for the location site (design temperature of the condenser cooling water, 32 °C, sea water salt content, 41000 ppm).
• Identical conditions and methods of capital and operational costs calculation (absolute and specific ones).
• Maximum achievable plant capacity factor. • Equal (for all the variants) rates for electric energy supplied to external power grid as
well as to desalination plants. • Standard values of characteristics for equipment of desalination plants, steam-turbine
plants, reactor plants and shore structures.
Basic techno-economic indicators for desalination complexes with KLT-40S and RITM-200 are given in Tables 3 to 6.
180

TABLE 3. BASIC TECHNO-ECONOMIC INDICATORS OF DESALINATION COMPLEXES
WITH KLT-40S AND RITM-200. (DISCOUNT RATE OF 0 %).
KLT-40S RITM-200 Characteristics
MED RO MED RO
Output plant capacity to water, (m3/day) 100000 100000 100000 100000
Electric power output to the grid, (MW) 2×18.2 2×27.2 18.5 35.5
Quality of produced water, (ppm) 25 320 25 320
Specific capital costs PU, ($/kW) 3450 3450 3450 3450
Specific capital costs DP, ($/m3/day) 2300 1320 2300 1320
Prime cost of electric power (cent/kW⋅h)
- As per IAEA DEEP-3
- As per TEO-INVEST
4.58
4.64
4.58
4.64
4.08
4.15
3.81
3.85
Prime cost of desalinated water ($/m3)
- IAEA DEEP-3
- TEO-INVEST
0.878
0.890
0.809
0.800
0.791
0.830
0.724
0.735
TABLE 4. TECHNO-ECONOMIC INDICATORS FOR DESALINATION COMPLEXES WITH RITM-200 RT AND COAL FIRED COGENERATION PLANTS (WITH COAL COST OF 50 $/t), AS CALCULATED BY DEEP-3.
RITM-200 Coal-based cogeneration plants Characteristics
NDC with MED, 100 000 m3/day
Discount rate, (%) 5 8 10 5 8 10
Specific capital costs PU, ($/kW) 3450 3450 3450 2000 2000 2000
Specific capital costs MED, ($/m3/day) 2300 2300 2300 2300 2300 2300
Discounted prime cost of electric power as per IAEA DEEP-3, (cent/kW⋅h) 6.05 7.57 8.66 6.06 6.90 7.51
Discounted prime cost of desalinated water as per IAEA DEEP-3, ($/m3) 1.316 1.720 2.011 1.317 1.662 1.910
181

TABLE 5. TECHNO-ECONOMIC INDICATORS FOR DESALINATION COMPLEXES WITH COAL FIRED COGENERATION PLANTS (AT THE WORLD COALPRICES), AS CALCULATED BY DEEP-3.
Coal-based cogeneration plants Characteristics
NDC with MED, 100 000 m3/day
Discounting rate, (%) 5 5 5 5 5 5
Cost of fossil fuel, ($/bbl)
(20 $/bbl = 100 $/t coal) 10 10 10 20 40 60
Specific capital costs TPS, ($/kW) 1620 1800 2160 1800 1800 1800
Specific capital costs MED, ($/m3/day) 2300 2300 2300 2300 2300 2300
Discounted prime cost of electric power as per IAEA DEEP-3, (cent/kW⋅h) 5.86 6.06 6.46 8.44 13.2 17.9
Discounted prime cost of desalinated water as per IAEA DEEP-3, ($/m3) 1.300 1.317 1.351 1.525 1.942 2.359
TABLE 6. TECHNO-ECONOMIC INDICATORS FOR RITM-200 BASED DESALINATION SYSETM (AT THE WORLD PRICES FOR NUCLEAR FUEL), AS CALCULATED BY DEEP-3.
RITM-200 Characteristics
NDC with MED, 100 000 m3/day
Discounting rate, (%) 5 5 5 5 5 5
Specific cost of nuclear fuel, (cent/kW⋅h) 0.88 0.88 0.88 1.55 2.33 3.49
Specific capital costs FPU, ($/kW) 3100 3450 4150 3450 3450 3450
Specific capital costs MED, ($/m3/day) 2300 2300 2300 2300 2300 2300
Discounted prime cost of electric power as per IAEA DEEP-3, (cent/kW⋅h) 5.70 6.05 6.74 6.69 7.44 8.57
Discounted prime cost of desalinated water as per IAEA DEEP-3, ($/m3) 1.285 1.316 1.377 1.372 1.438 1.536
182

1,5
2,0
2,5
3,0
3,5
4,0
4,5
5,0
5,5
6,0
6,5
7,0
7,5
40 50 60 70 80 90 100 110 120 130 140 150 160
$/t ($/thousand cubic meters)
Prim
e co
st, c
ent/k
W*h
Coal cogeneration plant (1000 $/kW) Coal cogeneration plant (1400 $/kW) Fuel oil cogeneration plant (1300 $/kW) Fuel oil cogeneration plant (650 $/kW) Diesel power plant (1000 $/kW) Diesel power plant (1300 $/kW) Gas cogeneration plant (420 $/kW) Gas cogeneration plant (850 $/kW) Gas steam generation plant (420 $/kW) Gas steam generation plant (850 $/kW) NPP with KLT-40S RP NPP with RITM-200 RP
Figure 10. Dependence of prime cost of electric power (0 % discount rate) for desalination complex for various power sources.
A8.3.2. SENSITIVITY ANALYSIS.
To evaluate the influence of capital expenses for construction, cost of nuclear fuel, FPDU output and core power reserve on cost of desalinated water, a sensitivity analysis was performed.
Figure 11 presents prime cost of desalinated water produced by FNDC with KLT-40S with MED and RO as a function of plant capacity factor.
Figure11. Prime cost of desalinated water produced by FNDC with MED and RO as a function of plant capacity factor (0 % discount rate).
Prime cost of desalinated water as a function of floating desalination plant with FNDP and RO
0.80
0.90
1.00
1.10
1.20
1.30
1.40
1.50
40000 60000 80000 100000
FNDC output, m3/day
Cos
t of d
esal
inat
edw
ater
, $/m
3
FNDC with DDP FNDC with RO
183

Figure 12 shows prime cost of desalinated water produced by FNDC with KLT-40S as a function of reactor core life capital costs of floating power unit.
Figure 12. Prime cost of desalinated water produced by FNDC as a function of core power life and capital construction costs for a floating power unit with KLT-40S. (0 % discount rate).
A8.3.3. COMPETITIVENESS OF NUCLEAR DESALINATION COMPLEXES AS COMPARED TO FOSSIL-FUEL BASED DESALINATION COMPLEXES.
Results of calculations by DEEP-3 code are described below.
A floating nuclear desalination complex was compared with a power desalination complex using fuel oil and coal under comparable conditions: equal electric power of desalination complex, equal plant capacity factor, and the same desalination method.
The criterion of competitiveness was the prime cost of desalinated water.
The comparison showed that a FNDC with KLT-40S can compete with fossil-fuel desalination complex in the following conditions (without account of the charges for ecological damage):
• if fuel oil prices are higher than 90 to120 $/t (for fuel oil cogeneration plant, specific capital costs equal 650-1300 $/kW in prices as of 2006);
• if coal costs prices are higher than 60 to 80 $/t (for coal cogeneration plant, specific capital costs equal 1000-1400 $/kW in prices as of 2006).
Results of calculations by the Russian TEO-INVEST method are described below.
It follows from the comparison that if world market prices for natural gas exceed $120-150 per thousands cubic meters, FNDC with KLT-40S and RITM-200 RPs offer essential advantages over steam-gas plants in terms of the prime cost of generated electricity, which automatically becomes an advantage in the prime cost of desalinated water, other conditions being equal (with assumption that the FPU and nuclear fuel are supplied by Russian companies at prices lower than world level).
If we take into account environmental factors, advantages of FNDC over fossil-fuel desalination complexes become even more obvious.
A8.4. SHORE-BASED NUCLEAR POWER DESALINATION SYSTEM This system is based on the use of the GT-MHR reactor, which is being developed by an international consortium.
The characteristics of the GT-MHR, as used in our study, are given in Table 7 [7].
Influence of FPU specific construction costs on prime cost of desalinated water
0,70
0,75
0,80
0,85
0,90
0,95
1,00
2500 3000 3500 4000 4500 5000
FPU specific construction costs, $/кV
Cos
t of d
esal
inat
edw
ater
, $/m
3
DDP RO
Influence of core power life on prime costof desalinated water
0.78
0.80
0.82
0.84
0.86
0.88
0.90
1.5 2.5 3.5 4.5Core power life , MW *h *106
Cos
t of d
esal
inat
edw
ater
, $/m
3
DDP RO
184

TABLE 7. GT-MHR REACTOR PLANT MAIN CHARACTERISTICS.
Characteristics GT-MHR
Reactor type High-temperature thermal neutron reactor with gas coolant (He), moderator – graphite
Reactor type and arrangement Single-circuit, modular
Energy conversion cycle Brayton cycle with primary gas turbine
Rated thermal power of the reactor, (MW) 600
Primary coolant temperature, (°С):
- inlet
- outlet
488
850
Power consumption for house load, % of Nnom < 3
Project status international project
Coupling schemes for GT-MHR with MED and RO system in nuclear desalination complexes are shown in Fig. 13.
1 2 3 4
5
6
7 8 9
10111213141516
17
18
19
20
21
1
6
5
2 3 4
1618 15 14
7 8
19
17 13 12 11
9
10
1 - Reactor2 - Generator3 - Turbine4 - Compressors5 - Recuperator6 - Precooler7 - Medium pressure pump
8 - High pressure pump9 - RO membranes10 - Product water11 - Enerdy recovery system12 - Brine outfall13 - Ultra-filtration membranes14 - Prefilter
15 - Pump16 - Seawater outfall17 - Seawater intake18 - Seawater pump19 - Pump20 - Heat exchanger21 - Intercooler
Principial flow diagram of the complex with GT-MHR and RO system
1 - Reactor2 - Generator3 - Turbine4 - Compressor5 - Recuperator6 - Precooler7 - Steam generator
8 - Distillation desalination plant9 - Seawater inlet10 - Product water11 - Brine outfall12 - Pump13 - Intermediate circuit pump14 - Compressor
15 - Seawater16 - Seawater pump17 - Pump18 - Heat exchanger19 - Intercooler
Principial flow digram of the complex with GT-MHR and thermal desalination
475°С
850°С
562°С
180°С
267°С
175°С95°С
94°С
108°С
28°С
850°С 110°С
130°С
26°С
510°С
490°С
62°С
20°С
20°С
62°С78°С
181°С
78°С
150°С
Figure 13. GT-MHR coupling with desalination plants.
185

A8.4.1. RESULTS OF TECHNO-ECONOMIC EVALUATION The main result of the techno-economic analysis was the prime cost of desalinated water and electricity produced by a ground-level atomic nuclear desalination system based on the GT-MHR, coupled to MED or RO system. Calculations were made by the Russian methodology.
Main techno-economic indicators of a nuclear desalination complex with a GT-MHR are shown in Table 8.
TABLE 8. MAIN CALCULATED TECHNO-ECONOMIC INDICATORS OF A NUCLEAR DESALINATION COMPLEX WITH A GT-MHR.
GT-MHR Characteristics
MED RO
Maximum capacity, (m3/day) 100 000 100 000
Electric output, MW 275 255
Quality of produced water, (ppm) 25 320
Specific capital costs PU, ($/kW) 1265 1265
Specific capital costs DP, ($/m3/day) 2300 1320
Prime cost of generated electricity at disc. rate=0 and 5 %, (cent/kW⋅h)
TEO-INVEST method
1.90/2.85
1.90/2.85
Prime cost of desalinated water at disc. rate=0 and 5 %, ($/m3)
TEO-INVEST method
0.500/0.771
0.570/0.900
A8.5. CONCLUSION Techno-economic evaluation of floating nuclear desalination complexes, based on KLT-40S, RITM-200, and ground-based GT-MHR reactor plants, coupled to MED and RO desalination processes, has been made.
Advanced options were selected for coupling reactor plants with distillation and reverse osmosis desalination plants.
When using the identical values of the input data, the results obtained by DEEP-3 and the Russian TEO-INVEST codes are very similar, since the differences in values of main parameters does not exceed 5 to 10%.
The cost of desalinated water produced by fossil-fuel desalination complexes was also evaluated, and the competitiveness of KLT-40S and RITM-200 FPUs was determined by comparison with the costs of fossil-fuel analogs.
Both the nuclear options lead to lower power and desalination cost as compared by the fossil fuelled based systems under the following conditions:
• If fuel oil prices are higher than 90 to 120 $/t (for fuel oil cogeneration plant, specific capital costs equal 650-1300 $/kW in prices as of 2006);
• If coal costs prices are higher than 60 to 80 $/t (for coal cogeneration plant, specific capital costs equal to 1000 to 1400 $/kW, in prices as of 2006).
186

A floating power desalination complex with the KLT-40S reactors, coupled to MED, has been considered as the most probable option for nuclear desalination in Russia. It is estimated that such complexes would cost 20 to 30% lower than the conventional ground based nuclear systems.
Russia has many years of practical experience in the construction and operation such type of reactors. Presently, a nuclear icebreaker is being tested in S-Petersburg.
Construction of demonstration nuclear power cogeneration plant based on FPU with KLT-40S reactors has been started in Severodvinsk city. It is planned to put the plant into operation in 2010.
Series of FN cogeneration plants are planned in future.
The feasibility study of the RITM-200 type plant for new icebreaker is also in progress.
REFERENCES [1] INTERNATIONAL ATOMIC ENERGY AGENCY, Desalination Economic Evaluation
Program (DEEP), Computer Manual Series No 14, IAEA, Vienna (2000). [2] A.D.TSVIRKUN, et al, TEO INVEST – Effective Tool for the Financial and Economic
Analysis of the Investment Projects. Information Science, Mechanical Engineering No 3 (1996).
[3] V. BELIAEV et al, Basic Safety Principles of KLT-40C Reactor Plants, in Small Power and Heat Generation Systems on the Basis of Propulsion and Innovative Reactor Technologies, IAEA-TECDOC-1172, IAEA, Vienna (2000).
[4] S.A. FATEEV, et al, Optimization of Floating Power Desalination Complex with KLT-40S. Connection Schemes and their Economical Estimations, International Seminar: Small Power Reactors and Prospects, OKBM, Moscow (2001).
[5] I.E. SHAMANIN, et al, Conceptual Design of the Floating Nuclear Desalination Complex, International Seminar: The Water World – 2003, Obninsk (2003).
[6] V.I. POLUNICHEV, et al, State of Activity on the Development of Energy Desalination Complexes in Russia. Analysis of Existing Economical Data, Working Meeting on Desalting, Vienna, 15–18 July (2002).
[7] S.A. FATEEV, et al, Nuclear Desalination Complexes based on Light Water and Gas-Cooled Reactors, IAEA-WONUC International Conference for Nuclear Desalination: Challenges and Options, Marrakech, Morocco, October 16–18 (2002).
187


ANNEX 9
SYRIAN ARAB REPUBLIC
NUCLEAR DESALINATION IN SYRIA S. Suleiman, I. Khamis, J. Momjian, A. Meree
Atomic Energy Commission of Syria, Damascus, Syrian Arab Republic
ABSTRACT This study has included the water situation in Damascus area as well as the energy situation in Syria. In addition, analysis of water transport cost has been carried out. Water desalination technologies both RO and MED with (MVC) coupled to the PBMR reactor were preformed with the economic evaluation of the water desalination cost. Sensitivity analysis of the most effected parameters was studied showing the variations in the cost.
A9.1. INTRODUCTION Syria is situated in semi arid area. This is in particular the case for Damascus area. The water resources of the country are considered very limited and its population grows rapidly. Therefore, urgent solutions, such as nuclear desalination, need to be considered.
In this case study water resources were reviewed together with the water shortages., The results clearly show that Damascus will need potable water desperately by year 2020.
The case study for nuclear desalination is preformed with the PBMR, coupled to RO, MED and MED/VC processes.
Desalination cost evaluation has been performed and sensitivity analyses were made for the most important parameters such as the interest and discount rates, power cost and plant availability.
Damascus is more than 200 km away from seaside; therefore water transport has also been analyzed in this work. For the study, Al-Hamediah site was selected. It is foreseen for the eventual deployment of a nuclear desalination plant.
A9.2. ANALYSIS OF WATER AND POWER NEEDS FOR THE DAMASCUS AREA A9.2.1. WATER RESSOURCES Rain and snow constitute the main resources of water intake in the Damascus basin with an average water flow estimated to be about 1300 Mm3/year. The rate of evaporation of water in this basin is 44%. Hence, the rest, which is equivalent to 850 Mm3/year, reaches the rivers and valleys to feed the underground water. Only 60% of this share (550 Mm3/year) is consumed for the purposes of drinking, irrigation, and in industry. The main two rivers; Barada and Al A-awage are seasonal and thus run only occasionally in this area.
The underground water reserves are an important resource to balance the deficit in water demands. However, such resources are not fed regularly and due to the intensive exploitation, their level has decreased dramatically. Therefore, the use of water in a careful way and the search for alternative resources are considered a more sustainable option. [1].
A9.2.2. WATER SHORTAGE AND DESALINATION PLANT CAPACITY The population growth rate in the 1990s in Damascus city was estimated to be about 2.7% and is expected to be 2.16 % by 2010. With optimistic estimation it will be about 2% by 2020, and this will lead to estimation for the population growth rate for the years 2030 and 2040 to be 1.7%. While the personal share of potable water has increased from 62.5 l/person/day in 1970 to 163 l/person/day in 2000, this share is expected to develop to 200 l/person/day in 2010, 220 l/person/day in 2020, 240 l/person/day in 2030 and 250 l/person/day in 2040. To this should be added the specific needs of the rural area of Damascus. Its population growth rate is about 5% and it is not expected to decrease to
189

less than 4.5%. However, the personal share of potable water is about 125 l/person/day [2]. Thus the extrapolated water demand in the Damascus area could be as shown in Table 1.
TABLE 1. TOTAL WATER DEMANDS AND SHORTAGES IN THE DEMASCUS AREA
Year Water demand
(1000 * m3/day)
Water shortage (1000 * m3/day)
2000 625.03 -5.106
2010 916.65 286.514
2020 1291.75 661.614
2030 1797.03 1166.894
2040 2448.92 1818.784
A9.2.3. ENERGY SUPPLY AND DEMAND Table 2 shows the evolution of electricity demands from 1999 to 2030, [3,4].
TABLE 2. EVOLUTION OF FINAL ELECTRICITY DEMAND
Because of very limited oil reserves, the choice of energy source as made by the Syrian government has been up till now the gas turbine combined cycle plants. This trend is likely to continue in the years to come. However, gas reserves are also limited. They are expected to last for at most 30 years. It is for this reason that the nuclear option, along with nuclear desalination has to be studied since it could take an important share of the future energy market in Syria.
A9.3. THE AL-HAMEDIAH SITE Al-Hamediah site is near Al-Hamediah town to the north. The distance from the site to the Lebanese border is about 10 km, and from the site to Tartous city is about 19 km. The selected site has the advantage of being situated in front of the lowest mountain area part of the costal region, close to the inland where potable water is most needed. Hence, some distance and pumping power for water transportation would be saved. The costal region in general has hard lands for water transporting “it is not flat”.
A9.3.1. GENERAL DESCRIPTION OF THE SEAWATER The seawater temperature on the surface has a distinct annual course, the minimum being in February (about 16 °C) and the maximum in August -September (about 28 °C). The water salinity during the year varies from 38000 to 41000 ppm and the pH is between 7.2 and 7.7. Water salinity decreases from time to time during the year. The highest decrease in salinity occurs during December to March. Table 3 shows the chemical analysis of the seawater in the site.
Year 1999 2005 2010 2015 2020 2025 2030
Electricity Consumption (GW(e).h) 16768 23 117 31 589 42 473 56 985 76 634 104 017
190

TABLE 3. CHEMICAL ANALYSIS OF SEAWATER IN THE SELECTED SITE
F- Cl- Br- NO3- PO4---
SO4-- Li+ Na+ K+ Mg++ Ca++
11.83 21200
±1500
380 ±25
<0.1 <0.25 2136 <0.05 11860 ±1000
370 1151
±100
497 ±125
NH4+ TDS PH
<0.02 40453 7.715
The climate of the seaside in Syria is related to the Mediterranean type of subtropical zone. The distinguishing feature of the climate is dry, warm in summer and soft in winter, and rich in precipitation. The following are the most noticeable common characteristics of the seaside in Syria [4]:
• Air temperature: the average air temperature is about 19.5 °C, the absolute maximum reaches 41.0 °C in Al-Hamediah, and the absolute minimum reaches 1.0°C.
• Air humidity: the yearly average humidity changes from 60 to 74 % in Al-Hamediah.
• Atmospheric pressure: the monthly average values are 1018 mbar in January, and the lowest one is 1007 mbar in July.
• Precipitation: Observations over many years have shown that precipitation in the costal area ranges between 840–880 mm a year. The site lies in a semi humid zone, while Damascus lies in very arid zone
A9.4. DESALINATION PLANTS FOR THE CASE STUDY As it was shown above, the expected water shortage for Damascus was found to be 286 514 m3/day in the year 2010 and 661 614 m3/day in the year 2020. Expecting that almost half of that amount is to be covered by desalination, we would assume for our case study that the plant capacity will be about 300 000 m3/day, and the rest of water needs will be covered by other resources such as: local springs, dumps to collect rainwater, and offshore springs. The MED plant size is chosen to be 60 000 m3/day. Reasons for selecting MED instead of MSF are: the low specific consumption of the former process, its lower heat transfer area and higher GOR.
The selected RO plant size would be 180 000 m3/day.
A9.4.1. THE MED PLANT This process has the following features:
• The concentration of the evaporated brine increases from the first effect to the last.
• Absence of intermediate pumps.
• The entire feed is heated to the boiling temperature in the first effect.
• The high concentration brine is generated in the low temperature effects.
The other characteristics of the plant as retained for the case study are presented in Table 4.
Using the assumed data in Table 4 and software which we developed for MED plants [5], one can get some characteristic features of the plant such as heat transfer area of the evaporators. This feature is essential in the cost calculation which leads to the evaporators cost as shown in Figure 1. Then by
191

adding the Accessories, Civil works cost, Water intake and discharge cost and land cost. Table 5 shows the calculated capital cost of various components.
TABLE 4. CHARACTERISTICS OF THE MED PLANT
Parameter Units Value Maximum water plant capacity m3/day 60 000
Seawater flow rate m3/day 120 000 Number of units 3 Number of effects 29 The gain output ratio, GOR 21 The hot steam temperature °C 121 The condensing temperature °C 32 The average temperature difference per effect °C 3
020000400006000080000100000120000140000160000180000200000
evaporators cost $
135791113151719212325272931
n
Figure 1. Evaporator costs.
TABLE 5. COSTS OF VARIOUS MED PLANT COMPONENTS
Evaporators cost ($) 4 977 254 Accessories ($) 1 508 259 Civil works cost ($) 100 000 Water intake and discharge cost ($) 25 000 Land cost ($) 100 000 Total instruction cost 6710513 Annual O&M cost ($/year) 301973 Energy consumption Electric power: (kW(e).h/m3) Thermal power: (kW(th)/m3)
2.1
47.5
192

A9.4.2. THE MED/VC PLANT The use of mechanical method for vapour production and heat transfer can result in a highly efficient desalination system. This system operates at temperatures less than atmospheric boiling point. This mechanical process is commonly associated with MED plants to enhance the efficiency of the applied mechanical energy.
A typical vapour-compression multiple-effect system is shown in Figure 2. The advantages of this type of system include a lower energy demand than high-temperature distillation, less corrosion due to possible use of thermoplastic materials, and lower operational temperatures [6, 7, 8].
Figure 2. Process diagram of MED/VC plant.
A single MED/VC unit, with 3-6 effects, has a production capacity close to 5000 m3/day. Therefore, 12 units add up to make a MED/VC plant with capacity of 60 000 m3/day. The MVC plant unit is assumed to operate in the following conditions:
• Top Brine temperature, (TBT) in the 1st effect = 90 °C.
• Last effect temperature = 70 °C.
• Heating steam temperature = 95 °C.
• Sea water salinity =38500 ppm.
Using the MVC soft ware [5] then enabled us to see the changes of the performance ratio (PR) with the number of effects and TBT with different values, as shown in Figures 3 and 4. The general characteristics of the plant are presented in the Tables 6 and 7.
193

0
5
10
15
20
25
01234567
N of effects
PR
TBT = 90 C°
Figure 3. Number of effect versus performance ratio.
17.8
18
18.2
18.4
18.6
18.8
19
19.2
19.4
19.6
19.8
020406080100120
TBT [C°] PR
Number of effects N=6
Figure 4. TBT with PR for N=6.
TABLE 6. MED/VC GENERAL CHARACTERISTICS
Feed flow rate
(m3/day)
Vapour compressor
power (kW)
Compressor power consumption (kWh/m3)
Specific evaporator heat transfer area
(m2/m3day)
Performance Ratio
10000 2177.7 10.45 2.498 19.25
194

TABLE 7. DETAILED DESCRIPTION OF EACH MED/VC EFFECT
Effect number
Distillate formed by
boiling
(kg/s)
Distillate formed by flashing (kg/s)
Brine TDS
(ppm)
Boiling point elevation
(°C)
Evaporator Heat transfer area
(m2)
1 9.367 0 41891 1.28 1857.2
2 9.324 0.586 46197 1.362 2103.6
3 9.282 0.519 51425 1.469 2114.1
4 9.240 0.454 57906 1.598 2125.3
5 9.199 0.391 66154 1.759 2137.1
6 9.158 0.331 77008 1.964 2149.9
Table 8 shows the costs of various MED/VC components.
TABLE 8. VARIOUS COSTS FOR EACH MED/VC UNIT
Evaporator cost ($) 10 25 806
Accessories ($) 300 000
Civil works cost ($) 20 000
Water intake and discharge cost ($) 7 000
Compressor cost ($) 500 000 Land cost ($) 100 000
Total capital cost ($) 1 452 806
Annual O&M cost ($/year) 65 376
Energy consumption Electric power. (kW(e).h/m3) Thermal power (kW(th).h/m3)
12.5
-
A9.4.3. THE RO PLANT RO plant had a shared part of water production of 180 000 m3/day. Using the RO designer software ROSA, which was developed by the Dow Chemical Company and choosing the membrane from the Filmtec Company, one can obtain the required technical data [9] as shown in Table 9. Table 10 gives the various RO plant water costs.
195

TABLE 9. THE MEMBRANE UNIT PARAMETERS
Feed Membrane type
Feed-water TDS
Brine TDS in1st array
Brine TDS in 2nd array
Product TDS
No. of
Membrane elements
12000 m3/day
SW-30 HR-380
40 000 ppm
59 528 ppm 66 423 ppm 480 ppm 1129
High pressure pump
Type power Flux input pressure Output pressure Pressure dif Materials
Central fugal
2750 kW 1250 m3/h 5 bar 67 bar 62 bar Stainless steel
TABLE 10. RO PLANT VARIOUS COSTS
Parameter Units Value
Reference unit size for cost m3 15000
Number of units 12
Base unit cost m3/day 800
Incremental in/outfall specific cost $/(m3/day 56
Water plant specific cost $/(m3/day 856
Water plant total construction cost M$ 177.96
Annual materials cost M$/year 7.79
Annual insurance cost M$/year 0.89
Water plant O&M cost M$/year 9.81
Pumping power ( HP + seawater and booster pump) MW(e) 50
Specific power consumption kWeh/m3 6.72
Electricity cost $/ kW(e).h 0.03
196

A9.5. THE PBMR For our case study, we retained the PBMR, expected to be constructed soon in South Africa. Some of its design characteristics are as follows:
• The 250 MW(th) reactor size uses the dynamic annular core concept to generate approximately 115 MW(e) through an intermediate helium to helium heat exchanger. The unique feature of the design is that the balance of plant is to be modularized in small size units to be factory built and site assembled. The layout of the balance of plant is in horizontal components that would be replaced rather than repaired. The PBMR is an on-line refuelling plant. Since this plant has an intermediate heat exchanger, it can be directly used for many process heat applications such as thermal desalination. Figure 5 shows the PBMR coupled to MED desalination plant.
• The key economic assumptions that have gone into Eskom's estimate for the PBMR are:
o The plant life time is 40 years.
o The assumed availability is 95 per cent (8300 kWh per year).
• Construction costs are estimated by ESKOM 1000 $/kW(e) based on bids received for construction, MIT conservative estimate is 2 000 $/kW(e) with no bid information and US target is 1200 $/kW(e).
• Costs of Power are estimated by ESKOM to be 0.018 $/kW.h. Exelon estimates approximately 0.03 $/kW.h and MIT value is 0.033 $/kW.h.
Figure 5. PBMR coupling to a thermal desalination plant.
197
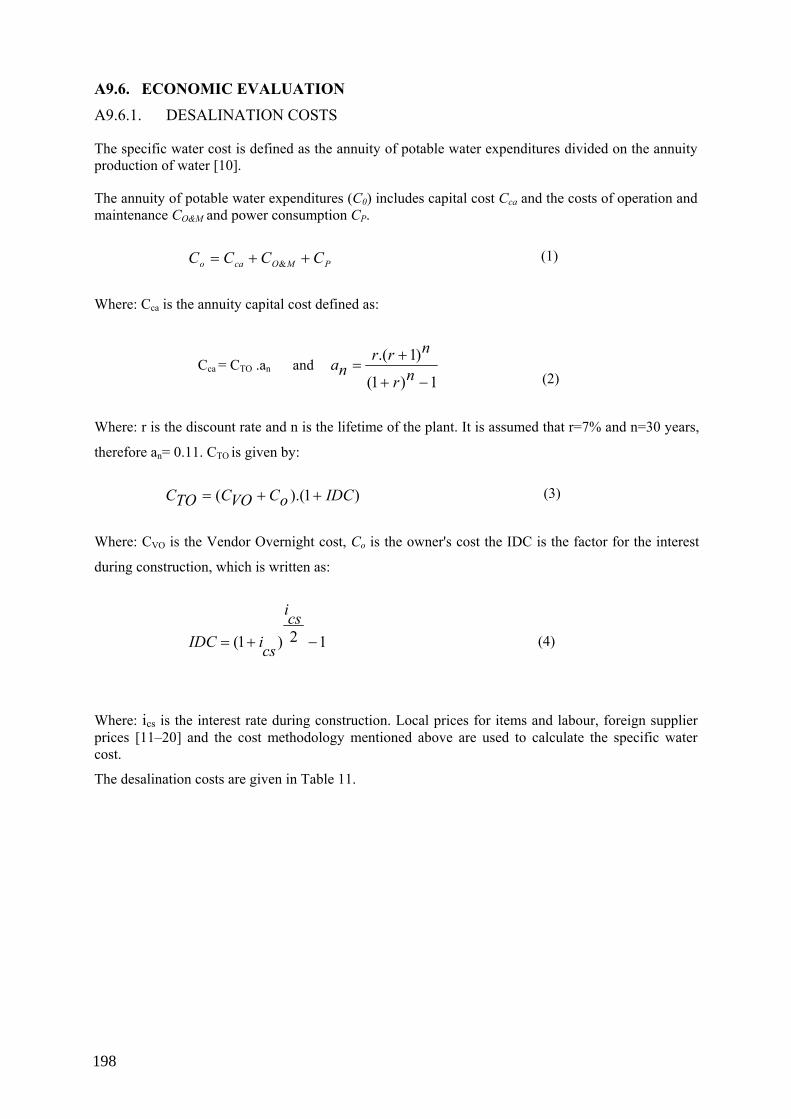
A9.6. ECONOMIC EVALUATION A9.6.1. DESALINATION COSTS
The specific water cost is defined as the annuity of potable water expenditures divided on the annuity production of water [10].
The annuity of potable water expenditures (C0) includes capital cost Cca and the costs of operation and maintenance CO&M and power consumption CP.
PMOcao CCCC ++= & (1)
Where: Cca is the annuity capital cost defined as:
Cca = CTO .an and 1)1(
)1.(
−+
+= nr
nrrna
(2)
Where: r is the discount rate and n is the lifetime of the plant. It is assumed that r=7% and n=30 years,
therefore an= 0.11. CTO is given by:
)1).(( IDCoCVOCTOC ++= (3)
Where: CVO is the Vendor Overnight cost, Co is the owner's cost the IDC is the factor for the interest
during construction, which is written as:
12)1( −+=csi
csiIDC
(4)
Where: ics is the interest rate during construction. Local prices for items and labour, foreign supplier prices [11–20] and the cost methodology mentioned above are used to calculate the specific water cost.
The desalination costs are given in Table 11.
198

TABLE 11. COST EVALUATION FOR THE DESALINATION PLANTS
Parameter Units Value
RO Water plant total construction cost M$ 177.96
RO Water plant O&M cost M$/year 9.81
Pumping power (HP + seawater and booster pump)
MW(e) 50
Specific power consumption (and cost)
kWeh/m3
($/m3) 6.72 0.2
MVC total construction cost M$ 17.43
MVC Annual O&M cost $/year 784 512
Energy consumption for the VC Electric power. Thermal power)
kWeh/m3
kW(th)/m3
(10.5)
-
MED total construction cost M$ 20.13
MED annual O&M cost $/year 905 919
Energy consumption for MED elec. (kWeh/M3) thermal (kW(th)/M3)
kWeh/m3
kW(th)/m3
2.1
47.5
Power cost $/kWeh 0.03
A9.6.2. SENSITIVITY ANALYSIS Some parameters have very strong effects on the cost of desalted water production such as interest rate, power cost, plant availability etc.:
• As for the interest and discount rates, it is well known that they vary from year to year and from country to country for instance the interest rate in Syria at this time is 8.5% and it has changed over the last 3 years many times. Therefore three values have been chosen to carry out the analyses on: 6%, 8% and 10% interest and discount rates. Keeping other parameters as constant default. Figure 6 shows the water cost versus interest/discount rate.
• As for the power cost, it depends on the type of the power plant and the country. In this case PBMR was chosen to be a power source for the desalination plant, and there are three different estimates of the kW(e).h cost: by ESKOM = 0.018 $/kW(e).h; by Exelon = 0.03 $/kW(e).h; and by the MIT = 0.033 $/kW(e).h. It should be noted that local electricity cost is 0.04 $/kW(e).h. The sensitivity analyses have been performed using these values as shown in Figure 7.
• Plant availability is essential in the water production cost, and it varies from plant type to another. Four values were chosen to carry out the analyses: 80%, 85%, 90% and 95%, as shown in Figure 8.
199

00.10.20.30.4
0.50.60.70.8
0.06 0.08 0.1
interest rate
wat
er c
ost
ROMEEMVC
Figure 6. Water cost vs interest rate.
water cost vs power cost with 8% interest rate
00.10.20.30.40.50.60.70.80.9
0.018 ESKOM
0.03 EXELON
0.033 MIT
0.04 Local power
price
power cost $/kweh
wat
er c
ost $
/M3
ROMEEMVC
Figure 7. Water cost vs power cost at 8% interest rate.
200
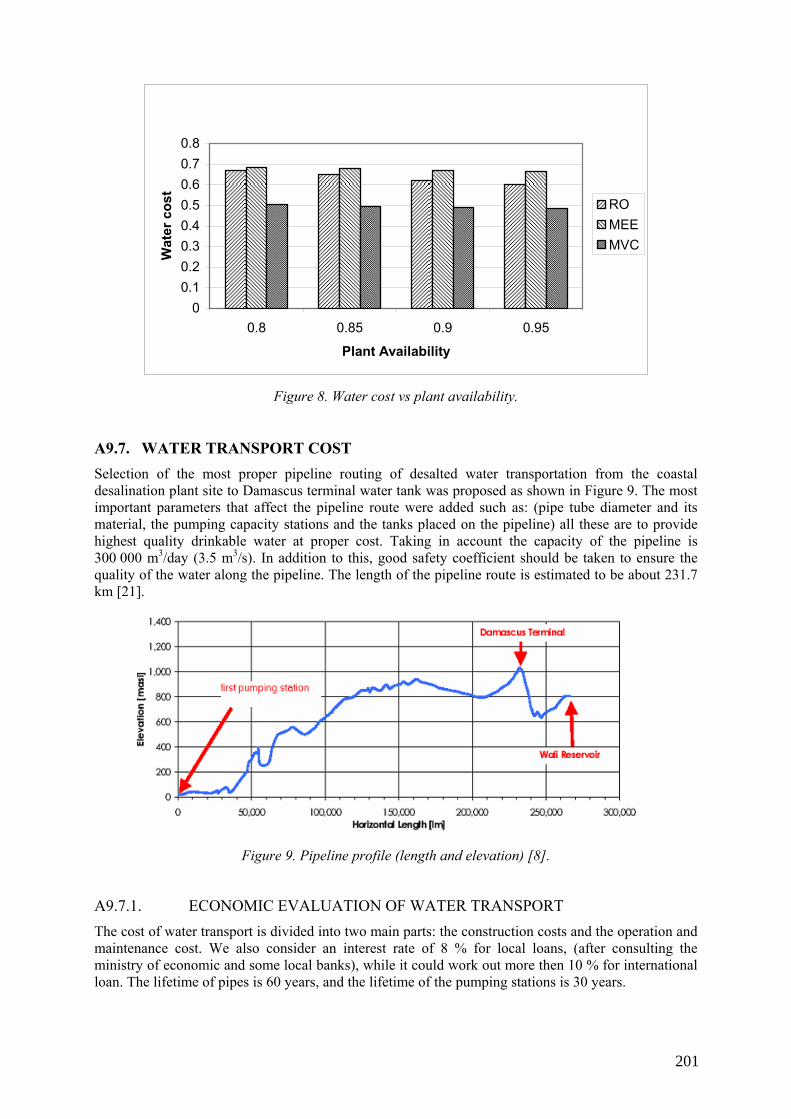
00.10.20.30.40.50.60.70.8
0.8 0.85 0.9 0.95
Plant Availability
Wat
er c
ost
ROMEEMVC
Figure 8. Water cost vs plant availability.
A9.7. WATER TRANSPORT COST Selection of the most proper pipeline routing of desalted water transportation from the coastal desalination plant site to Damascus terminal water tank was proposed as shown in Figure 9. The most important parameters that affect the pipeline route were added such as: (pipe tube diameter and its material, the pumping capacity stations and the tanks placed on the pipeline) all these are to provide highest quality drinkable water at proper cost. Taking in account the capacity of the pipeline is 300 000 m3/day (3.5 m3/s). In addition to this, good safety coefficient should be taken to ensure the quality of the water along the pipeline. The length of the pipeline route is estimated to be about 231.7 km [21].
Figure 9. Pipeline profile (length and elevation) [8].
A9.7.1. ECONOMIC EVALUATION OF WATER TRANSPORT The cost of water transport is divided into two main parts: the construction costs and the operation and maintenance cost. We also consider an interest rate of 8 % for local loans, (after consulting the ministry of economic and some local banks), while it could work out more then 10 % for international loan. The lifetime of pipes is 60 years, and the lifetime of the pumping stations is 30 years.
201

The construction cost is divided into:
• Construction cost of the pipes and tanks: the construction cost of pipes is calculated usually according to diameter of the pipe, it is equal to 672 M$ for the selected pipes diameter 1800 mm as shown in Figure 10 [21, 22]. These costs were prepared by local project for the housing ministry.
• The construction cost of the pumping station: it is related directly to the power of the pumping station as show in Figure 11 [21, 23]. We conclude that the construction cost of the selected pumping station is 80 M$.
• The operation and maintenance cost: they are related to power cost, spare parts, local labour and maintenance. The most effective parameter here is the power cost, where we have two prices for the power cost the official rate 3.9 ct/kWh "which is used for service project" and the actual rate 6.5 ct/kWh [21]. We would also consider running hours to be 21 hours a day because of maintenance and outage.
Figure 10. The construction cost of pipe according the pipes diameter.
Figure 11. The cost of pumping station according the power.
Table 12 shows the construction cost, O&M cost and the levelized water transport cost. Figure 12 shows the effect of interest rate on the cost.
202

TABLE 12. THE COST EVALUATION OF WATER TRANSPORT
Annual Total Construction Costs
(M$/year)
Tube diameter
(mm)
Power consumption
(kW)
Annual O & M costs
(M$/year) Interest rate
10 % Interest rate 8 %
Interest rate 6 %
1800 50600 15 75.81 60.95 46.63
Levelized cost ($/m3) 0.69 0.556 0.425
00.20.40.60.8
0.06 0.08 0.1interest rate
wat
er tr
ansp
ort c
ost
Figure 12. Water transport cost versus interest rate.
A9.8. CONCLUSION This work has shown the importance of nuclear desalination to cover the shortage of potable water to the Area of Damascus, through the analysis of the nuclear desalination cost that were carried out. And water transport cost was conducted as well. Therefore we can conclude that potable water cost (including water transport cost and desalination cost) would be in the range of 0.85 $/m3 to 1.40 $/m3.
REFERENCES [1] The Water Status in Syria, Proceedings of the International Water Day Meeting, Syrian
Engineering Society, Damascus, April (2002). [2] Proceedings of the Ninth Scientific Engineering Week, Syrian Engineering Society, Damascus
(1998). [3] HAINOUN, et al, Energy and Nuclear Power Planning Study for Syria (covering the period
1999–2030), AECS-NE/FRSR 316, November (2004). [4] Statistical Abstract, General Bureau of Statistics, year 53, Damascus, Syrian Arab Republic
(2000). [5] S. SULEIMAN, et al, Modelling and Designing a VC Desalination Plant and Programming
the Model, AECS – NE\RSS 651, January (2006). [6] HISHAM EL-DESSOUKY, et al, Steady-State Analysis of Multiple Effect Desalination
Process, Chem. Eng. Technology, Vol 21, N° 5 (1998). [7] FRANK KREITH, The CRC Handbook of Thermal Engineering. CRC Press, London (2000). [8] HISHAM EL-DESSOUKY, et al, Multiple Effect Evaporation-Vapor Compression
Desalination Processes, Trans IChemE, Vol 78, part A, May (2000).
203

[9] ROSA 4.0, Dow Chemical Company and Filmtec Software Package. (Available from:
http://www.dow.com/liquidseps/news/20020607b.htm). [10] INTERNATIONAL ATOMIC ENERGY AGENCY, Thermodynamic and Economic
Evaluation of Coproduction Plants for Electricity and Potable water, IAEA-TECDOC-942, IAEA, Vienna (1997).
[11] INTERNATIONAL ATOMIC ENERGY AGENCY, DEEP 2.2 Software, IAEA, Vienna (2002).
[12] Economic and Technical Assessment of Desalination Technology in Australia, 17 July (2002), www.epg.com.au.
[13] Trans Texas Water Program South-East Area, Desalination Report, February, 20 (1998). (Available from: www.coastal.ca.gov/desalrpt).
[14] HISHAM ETTOUNY, Evaluating the Economics of Desalination, December (2002), www.cia.gov/publication.
[15] M.A. DARWISH et al, Energy Consumptions and Cost of Different Desalting Systems, Desalination, Vol 64, 83-96 (1987).
[16] D.H. HELLMAN, Saving Energy and Cost in Seawater Desalination with Speed Controlled Pumps, Desalination, Vol 139, 1-12 (1999).
[17] J. LANDERS, Long Beach Seeks to Cut Costs of Desalination, Civil Engineering, Vol 73. N° 1, 28-30 (2003).
[18] Z. ZIMERMAN, Development of Large Capacity High Efficiency Mechanical Vapour Compression ( MVC) Units, Desalination, Vol 96, 51-58 .(1994).
[19] J. M. VEZA, Mechanical Vapor Compression Desalination Plants : Case Study, Desalination, Vol. 101, 1- 10 (1995).
[20] O.J. MORIN , Desalting Plant Cost Update 2000, Proceedings of the IDA World Congress of Desalination and Water Reuse. San Diego,. COA, Vol 3 341-359 (1999).
[21] Damascus Water Supply from coastal Area, IBG, DHN: Pipeline Route Alternatives Analyses, Document Number 1714-PL-RE 001, Damascus (2002).
[22] J.P. TULLIS, Hydraulics of Pipelines, Pumps, Valves, Cavitations and Transients .John Wiley & Sons, New York, (1993).
[23] R.L.DAUGHARTY et al, Fluid Mechanics with Engineering Applications . Mc Graw – Hill Books Company., New York (1965).
204

ANNEX 10 UNITED STATES OF AMERICA
DESALINATION USING NUCLEAR ENERGY R.S. Faibish
Argonne National Laboratory, United States of America
ABSTRACT The economics and technological aspects of water and power cogeneration using nuclear energy and various types of desalination systems were examined in detail. It was demonstrated that for the cogeneration of water and power using nuclear energy the use of a hybrid desalination system composed of thermal and membrane desalination systems for seawater desalination (i.e., a coastal site) is an attractive option; especially for utilizing off-peak power of nuclear power plants. The membrane desalination system was shown to be the desalination plant of choice for an inland site, where brackish water is available for the production of freshwater. The unit product cost of the desalted water was calculated to be in the range of $0.26-0.69 per m3 of product water for a range of water plant capacities (100000-300000 m3/d). The total required thermal power for the same range of capacities using a hybrid or a stand alone thermal desalination plant was in the range of 90-800 MW(t), and the total required electrical power ranged from 2.8 to 30 MW(e). It was also shown that safety issues in the coupling of water and nuclear power plants as well as environmental discharges of waste water streams are not of significant concern, though a more site-specific detailed investigation is needed to identify unique effects, if any.
A10.1. INTRODUCTION The need for freshwater, high purity water, and other grades of water for various domestic, industrial, and agricultural applications is ever increasing in the U.S. Population growth and continuous economic and technological growth are the main drivers for the increased demand in water. Indeed, it is predicted that more than 60 billion additional cubic meters of water will be needed in the U.S. for municipal and light industrial uses by the year 2020. Considering a more distant horizon, it is predicted, for example, that the U.S. will require an additional 11-19 L/day per capita of water supplied for the generation of hydrogen should the transportation sector be based mainly on hydrogen-powered vehicles in the future. Cogeneration of water and power could offer a major portion of the additional water needed in addition to providing much needed energy for maintaining sustainable development and growth.
In a cogeneration dual-purpose plant, some or all of the high-pressure steam produced by the power plant is expanded in a turbine, while the remainder of the steam and electricity is being supplied to a desalination plant for the co-production of a variety of water products (e.g., potable, high-purity makeup water, industrial grade, and other types). The main advantage, from a thermodynamic point of view, is that the water plant can act as the “cold sink” of the power plant. It is important to note that the steam supplied by the power plant to a thermal desalination plant is not entirely cost free. The steam needed by the desalination plant is usually at pressures between 0.3 and 3 bars. However, steam generated by the power plant can be expanded in a turbine to pressures much below 0.3 bars. Thus, each unit mass of steam in a cogeneration plant will produce less electricity, but the heat will be better utilized.
This portion of the overall study examines cogeneration of power and water using the energy from the nuclear plant, both electrical and thermal. Two potential plant sites were: one coastal site and the other an inland site. The coastal site clearly calls for examining the economic feasibility of seawater desalination coupled to the power plant. The inland site, on the other hand, provides access to brackish water sources for brackish water desalination. Each option is analyzed and assessed for the proper technology mix and overall economics. The study presents an assessment of techno-economic considerations relevant to the cogeneration of power and water using a nuclear power plant. The
205

general approach to analyses presented here is also applicable to other power and water plant coupling possibilities such as with fossil fuel-fired power plants. In fact, some discussion is dedicated to the comparison between conventional cogeneration plants and nuclear ones. The various possible coupling schemes and the potential safety and environmental issues concerning nuclear desalination plants are also discussed.
A10.2. CHOICE OF DESALINATION TECHNOLOGY The desalination systems of choice in this study are the membrane RO and LT-MED (low temperature MED, with steam supply at 0.4 bar and 70oC) systems and a combination (or hybrid) of the two. The choice was based mainly on investment and operational costs, where energy requirements and costs are of paramount importance. Capital investment and energy requirements (and hence costs) are typically the lowest for RO membrane and MED plants (Table 1).
TABLE 1. AVERAGE SPECIFIC DIRECT CAPITAL COSTS (INCLUDING INTAKE AND OUTFALL STRUCTURES) AND ENERGY CONSUMPTION FOR THE RO, LT-MED AND MSF PROCESSES.
Process Average specific direct capital cost ($/m3/day)
Average equivalent energyconsumption of a large
unit***
(kW.h(e)/m3)
RO 900-1100* 3-5
MED 1000-1200 15-40**
MSF 1200-1500 17-55**
* Excluding membrane costs. **Approximately 70-90% of this total equivalent energy is in the form of thermal energy, depending on the size of the plant. *** >50 000 m3/day
Actual heat consumption of the thermal plants is naturally equivalent to the amount of steam needed for the thermal desalination process. The amount of steam needed for thermal processes is obtained from the desired performance ratio of the thermal desalination plant, or PR, which is the ratio of mass of water produced to mass of required heating steam. For MED plants, for example, the amount of steam required is approximately equal to N-1, where N is the number of MED effects. The heat required for the MED process per mass of freshwater produced is, on average, lower than the heat required for the less efficient MSF process (see the equivalent energy requirements in Table 1). This results from the fact that a given MED system can achieve a higher PR than a MSF system with an identical heat transfer area and the same temperature difference between the heat source and the cooling water stream.
For desalting seawater, two systems are examined: a RO desalination plant and a hybrid LTMED/RO plant., discussed in section 4.4 of the main text. For brackish, inland, desalination only a RO plant is considered. The choice of one system over another is based on process economics and initial investment.
206

A10.2.1. THE RO PLANT OPTION The RO plant option for the coastal and inland sites in this study offers a plant that consumes the least amount of energy per freshwater produced (see Table 1). This low energy consumption is made even lower by the use of an energy recovery turbine (ERT) through which the concentrate stream is fed and some of the overall process pumping energy is recovered. The layout of a typical RO membrane plant is given in Figure 1. Seawater RO plant is the system of choice for the potential coastal Texas site, whereas brackish water RO plant is the natural choice for the in-land site (where surface and/or saline groundwater are available).
A10.2.1.1 . Seawater RO plant opt ion
Seawater RO is examined for the coastal site. A typical large-scale RO system is composed of several sub-units known as trains. A typical RO seawater large train size is in the range of 10 000 to 20 000 m3/day product capacity. In this current study, the train size was chosen as 14 000 m3/day, based on common-day design experience [1]. A train of this size will contain a total of 1344 membrane elements (modules) housed in 168, 8-element pressure vessels. This design was recently chosen for the Tampa Bay cogeneration project in Florida. The required system feed pressure and, hence, power consumption was calculated using the commonly used membrane process design software from Hydranautics. (www.membranes.com). The software was used to calculate required system pressure, resultant product salinity, and power consumption (with and without ERT) using specific input parameters (see Tables 2 and 3).
TABLE 2. GENERAL SEAWATER RO PLANT OPERATING CONDITIONS
Parameter Units Value
Total plant capacity m3/day 100 000 to 300 000
Feed seawater concentration (TDS) ppm 20 000 to 35 000
Feed seawater temperature °C 15 to 40
Recovery ratio % 50
TABLE 3. SEAWATER RO PLANT PERFORMANCE RESULTS FOR A 14 000 m3/day CAPACITY
Feed temperature
15 °C 25 °C 35°C
Feed salinity = 20 000 (ppm) Feed pressure (bars) Product salinity (ppm)
43.2
178
39.7
248
37.8
339
Feed salinity = 27 500 (ppm) Feed pressure (bars) Product salinity (ppm)
54.9
249
51.6
347
49.9
474
Feed salinity = 35 000 (ppm) Feed pressure (bars) Product salinity (ppm)
67.4
320
64.2
447
62.7
612
207

TABLE 4. POWER REQUIREMENTS FOR A 14 000 m3/day CAPACITY SEAWATER RO
PLANT
Feed temperature
Power consumption (kW.h/m3) 15 °C 25 °C 35°C
Feed salinity = 20 000 (ppm)
With ERT
Without ERT
1.94
2.92
1.81
2.71
1.69
2.54
Feed salinity = 27 500 (ppm)
With ERT
Without ERT
2.46
3.71
2.37
3.54
2.22
3.35
Feed salinity = 35 000 (ppm)
With ERT
Without ERT
3.02
4.56
2.96
4.43
2.78
4.21
It can be seen from the RO plant performance results that product salinity increases with feed-water temperature, which is expected due to increased salt diffusion through the membranes with increasing temperature (Figure. 1). On the other hand, power consumption decreases with increasing feed-water temperature due to decreased feed-water viscosity, which, in turn, leads to lower pumping requirements (Figure 2). The operational cost savings due to the effects of higher operating temperatures are quantified in the section dealing with the hybrid desalination option (Section 4.4.2. in the main text).
Figure 1. Permeate salinity with varying feed-water temperature for an RO system with feed salinity of 20000 ppm TDS. Recovery = 50%, RO train product capacity = 14000 m3/day.
208

Figure 2. Feed pressure with varying feed-water temperature for an RO system with feed salinity of 20 000 ppm TDS. Recovery = 50%, RO train product capacity = 14 000 m3/day.
Typical drinking water guidelines call for a maximum of potable water TDS concentration of 500 ppm. It is most likely that seawater salinity near the coastal region considered here is less than 30 000 ppm because of the presence of various rivers with low salinity water flowing into the water intake area, near the coast. This was also the case in Tampa Bay, where seawater TDS concentration was in the range of 14 000 to 31 000 ppm. Using the Hydranautics software for RO design, permeate concentration product water for the expected feed-water concentration was calculated to be below 500 ppm for all cases except one (i.e., 612 ppm TDS), where feed temperature and TDS concentration were the highest (see Table 3).
The inclusion of an energy recovery turbine (ERT) at the outlet of the RO system is standard practice. Cost savings by doing so are a direct result of the significant reduction in required feed pressure (more than 30%) per set of operating conditions (see Table 4). Power costs amount to about 25-33% of the total annual costs of the desalination plant. Thus, all analyses given here will include the ERT effect.
An analysis of annual cost components of large (100 000-300 000 m3/day) freshwater-producing seawater RO plants based on a set of general, default input data shows a decrease in overall cost per unit production with plant size due to economy of scale (Table 6).
TABLE 5. DEFAULT INPUT DATA FOR SEAWATER RO PLANT COST CALCULATIONS.
Seawater feed temperature (oC) 25
Feed-water salinity (ppm) 27500
Recovery ratio (%) 50 Cost of electricity ($/kW.h) 0.04*
Interest/discount rate (%) 7
Plant economic life (years) 20.00
Amortization factor 0.09
Plant availability (%) 90
Specific electric consumption (kWh/m3) 2.37* Specific chemical cost ($/m3) 0.04
Membrane cost ($/element) 650
Longevity of membrane elements (years) 5
Specific labor costs ($/worker/year) 50 000
* It is estimated that the cost of electricity produced by the AP1000 reactor plant would be even lower than this value and in the range of $0.03-0.35 per kWh
209

TABLE 6. SEAWATER RO PLANT DESALINATION COSTS FOR A RANGE OF
PLANT PRODUCTION CAPACITIES.
Production capacity (m3/day) 100 000 200 000 300 000 Initial capital investment ($) 1.044E+08 1.901E+08 2.699E+08 Annual costs ($/year) Direct costs 9.850E+06 1.794E+07 2.548E+07 Indirect costs 3.940E+06 7.176E+06 1.019E+07 O&M (+ spare parts) 1.970E+05 3.588E+.05 5.095E+05 Membrane replacement 1.204E+06 2.407E+06 3.611E+06 Chemicals 1.622E+06 3.244E+065 4.867E+06 Power 3.845E+06 7.689E+06 1.153E+07 Labour 7.000E+05 9.899E+05 1.212E+06 Total annual costs 2.136E+07 3.981E+07 5.740E+ Water cost ($/m3) 0.585 0.545 0.524 Water costs ($/m3/day) 213.58 199.03 191.34
A10.2.1 .2 . Sensitivity analysis
The above cost results are particularly sensitive to variations in variables such as interest rate, power consumption, cost of electricity, plant availability, and plant economic life. For the following sensitivity analysis, a plant capacity of 200 000 m3/day was assumed with all other variables held constant (see Table 5). The amortization factor cannot be held constant since, by definition, it varies with interest rate and plant economic life.
Results of the sensitivity analysis are presented in Table 7:
This table shows that there is a strong dependence of product cost on interest rate and power consumption values (variation of 22% and 25%, respectively, over the range of values). A weaker dependence is seen for the cost of electricity (a 19% variation), and the weakest dependence is seen for plant availability and economic life (12% and 15% variation over the range of values, respectively). Thus, careful attention should be given to the choice of the above parameters when final process optimisation is performed.
210

TABLE 7. RESULTS OF THE SENSITIVITY STUDY FOR THE SEAWATER RO PLANT
(PRODUCTION CAPACITY = 200 000 m3/day).
Annual costs ($/year) Production cost ($/m3)
3.60E+07 0.493
3.98E+07 0.545
5
7 Interest rate (%)
9 4.39E+07 0.601
3.98E+07 0.545
4.37E+07 0.598
0.04
0.06 Electricity cost ($/kW.h))
0.08 4.75E+07 0.651
3.86E+07 0.529
4.35E+07 0.596
2
3.5Power consumption (kW.h/m3)
54.83E+07 0.662
4.36E+07 0.598
4.15E+07 0.568
70 Plant availability (%) 80
90 3.98E+07 0.545
3.98E+07 0.545
3.61E+07 0.494
20
Plant economic life time (years) 30
40 3.46E+07 0.0.474
A10.2.2. THE LT-MED PLANT The LT-MED plant offers a high performance ratio (PR) and a low operating temperature, requiring only low-grade steam as the main driving force for the thermal evaporative desalination process. The largest available unit size of a MED system is around 20 000 m3/day of freshwater production capacity, which is smaller than the largest available MSF units (around 50 000 m3/day capacity). However, a 20 000 m3/day MED plant with a PR of 10, using 0.34 bar steam with a direct capital investment of around $1200/m3/day is a more efficient and a more cost effective choice than the a MSF plant with the same capacity and PR, an initial capital investment of more than $1400/m3/day, and higher grade steam requirement (3 bar and 109oC).
Similar to the RO plant, analysis of annual cost components and unit product cost for a range of product freshwater capacities was also made for the LT-MED plant option. MED plant performance is relatively independent of changes in feed-water salinity. The PR and the top brine temperature have the greatest effect on plant performance and economics. In the case of LT-MED, top brine temperature
211

is kept as constant, which reflects common practice of utilizing low-grade heating steam with a typical temperature of 70oC (see Table 8).
TABLE 8. INPUT DATA FOR LT-MED PLANT COST CALCULATIONS.
Seawater feed temperature (oC) 25
Feed-water salinity (ppm) 27 500
Performance ratio 10
Cost of electricity ($/kW.h) 0.04
Interest rate (%) 7
Plant economic life (years) 20
Amortization factor 0.09
Plant availability (%) 90
Specific electric consumption (kWh/m3) 1.40*
Specific chemical cost ($/m3) 0.04
Fuel cost ($/GJ) 0.45**
Specific stem requirements (kg/m3 of product water) 100
specific labour costs ($/worker/year) 50 000
* based on the largest available LT-MED unit of 20 000 m3/day product capacity. ** based on typical nuclear fuel costs. This is much lower than coal-fired and gas-fired plants with fuel costs in the range of $1.2 to 3.5/GJ.
The total annual cost and unit product cost for the LT-MED plant are naturally higher than those for the RO plant due to higher capital investment costs and the additional significant cost of the low-grade steam (see Table 9).
TABLE 9. LT-MED PLANT DESALINATION COSTS FOR A RANGE OF PLANT CAPACITIES
Production capacity (m3/day) 100 000 200 000 300 000 Initial capital investment ($) 1.200E+08 2.197E+08 3.130E+08 Annual costs ($/year) Direct costs 1.132E+07 2.074E+07 2.954E+07 Indirect costs 4.529E+06 8.295E+06 1.182E+07 O&M (+ spare parts) 2.265E+05 4.147E+05 5.909E+05 Membrane replacement 1.204E+06 2.407E+06 3.611E+06 Chemicals 1.622E+06 3.244E+06 4.867E+06
Power cost 2.271E+06 4.542E+06 6.813E+06
Steam cost 4.248E+06 8.497E+06 1.275E+07 Labour 7.000E+05 9.899E+05 1.212E+06 Total annual costs 2.492E+07 4.672E+07 6.759E+07 Water cost ($/m3) 0.683 0.640 0.617 Water costs ($/m3/day) 249.20 233.60 225.30
212

A10.2.2.2 . Sensitivity analysis
The variables examined in the sensitivity analysis include the same variables, which were examined for the RO plant option. However, in addition to those variables, the cost of fuel is of particular importance because the cost of steam is highly dependent on the cost of fuel, which is used to produce the necessary heat energy for steam generation.
The trends in interest rate, cost of electricity, power consumption, plant availability, and plan economic life are similar (as expected) to those of RO plant cost variations (Table 10)
TABLE 10. RESULTS OF A SENSITIVITY ANALYSIS FOR THE SEAWATER LT-MED PLANT, (200 000 m3/day)
4.6728E+07 0.640
4.445E+07 0.609
20
Plant economic life time (years) 30
40 4.271E+07 0.585
A10.2.3. THE BRACKISH WATER RO OPTION A brackish water RO treatment plant is a common solution to in-land brackish water (e.g., saline surface and/or groundwater) desalination. One typical design consists of two stages (i.e., concentrate from the first stage feeds into the second stage) for better overall recovery, pumping requirements, and permeate quality (see Fig. 3 and Table 11). Capital costs and operating pressure (hence energy requirements) are significantly less than those for seawater RO desalination plants (compare Tables 6 and 12). Since the operating pressures are much lower (around 25% that of typical operating pressures for seawater RO), energy recovery is not commonly practiced in brackish water treatment plants.
Figure 3 . A 2-stage brackish water RO membrane plant.
213

TABLE 11. GENERAL BRACKISH WATER RO PLANT OPERATING CONDITIONS
Parameter Units Value
Total plant capacity m3/day 100 000 to 300 000
Feed seawater concentration (TDS) ppm 2500
Feed seawater temperature °C 15 to 40
Recovery ratio % 85
In addition, and unlike the seawater RO plants, an increase in operating temperature for brackish water with low salinity feed-water does not contribute to a significant improvement in membrane performance and process costs and may even enhance scaling and fouling of the membrane elements. Thus, a design temperature should be chosen, and membrane plant operating parameters should be optimised accordingly. In this study a typical design temperature of 25oC was chosen for membrane cost analysis. Every plant can be designed to accommodate seasonal and daily variations in feed-water temperatures.
TABLE 12. DEFAULT INPUT DATA FOR BRACKISH WATER RO PLANT COST CALCULATIONS.
Seawater feed temperature (oC) 25
Feed-water salinity (ppm) 2500
Recovery ratio (%) 50 Cost of electricity ($/kW.h) 0.04*
Interest/discount rate (%) 7
Plant economic life (years) 20.00
Amortization factor 0.09
Plant availability (%) 90
Specific electric consumption (kWh/m3) 0.67* Specific chemical cost ($/m3) 0.04
Membrane cost ($/element) 550
Longevity of membrane elements (years) 7
Specific labour costs ($/worker/year) 50 000
* based on a 28 000 m3/day 2 stage-RO train
214

TABLE 13. BRACKISH WATER RO PLANT DESALINATION COSTS
Production capacity (m3/day) 100000 200000 300000 Initial capital investment ($) 4. 174E+07 7.602E+07 1.080E+08 Annual costs ($/year) Direct costs 3.940E+06 7. 176E+06 1.019E+07 Indirect costs 1 .576E+06 2.870E+06 4.076E+06 O&M (+ spare parts) 7.880E+04 1 .435E+05 2.038E+05 Membrane replacement 7.275E+05 1 .455E+06 2.183E+06Chemicals 1 .622E+06 3.244E+06 4.867E+06 Power 1 .087E+06 2. 174E+06 3.261E+06 Labour 7.000E+05 9.899E+05 1.212E+06 Total annual costs 9.732E+06 1.805E+07 2.599E+07 Water cost ($/m3) 0.267 0.247 0.23 7 Water costs ($/m3/day) 97.32 90.27 86.64
The variation of plant feed pressure and permeate quality with temperature lead to similar trends in reduction of permeate quality and a decrease in required feed pressure with increasing feed-water temperature as with seawater RO (Fig. 4).
Figure 4. Trends in (a) permeate salinity and (b) feed pressure with varying feedwater temperature for a brackish water RO system with feed salinity of 2500 ppm. Recovery = 85%, RO train product
capacity = 28 000 m3/day.
A key issue concerning the brackish water desalination plant option for an in-land location is the availability of ample brackish ground/surface water as feed for a large-scale facility. An analysis of the available water resources for the specific site is required to guarantee a feed-water flow rate in the range of 120 000 – 360 000 m3/day for a brackish water desalination plant producing 100 000 to 300 000 m3/day of freshwater with an 85% recovery. The typical capacity of a large brackish water
RO plant at present time is only in the tens of thousands of m3/day freshwater produced.
215

A sensitivity analysis to specifically examine the influence of values of various operational parameters on final annual costs for the brackish water desalination plant option is not necessary. The general dependence of the various parameters in this case is similar to that which was observed from the sensitivity analysis for the seawater desalination plant option
A10.4. CONCLUSIONS The study identified several choices for a desalination plant to be coupled to a nuclear power plant for the cogeneration of power and water. The techno-economic results associated with the different desalination plant options can help in choosing the most suitable option for a given site and water needs.
Several main conclusions are reached by examining the comprehensive results:
• The most economical choice for a coupled desalination plant for the inland site is the brackish water RO plant. Overall water costs are about 50% lower than those associated with seawater RO systems and average around $0.25 per m3 of product water. However, capital investment costs could be significantly higher (some 43% higher) if deep well discharge is chosen as the concentrate disposal method rather than blending of the concentrate with the power plant cooling water discharge stream.
• In addition to providing a range of water products of various qualities and operational flexibility, the hybrid RO/LT-MED plant option offers water costs that are very close to those of the stand-alone RO seawater plant.
• The overall energy consumption for the hybrid plant (on the basis of total equivalent MW(e) and assuming a 30% power plant thermal efficiency), as discussed in the main text, is, on average, 60% lower than for the stand-alone LT-MED plant. Thus, savings is energy costs are the main contributor to the lower overall product water costs of the hybrid plant.
• The main advantage of a nuclear power plant coupled to a desalination plant over a fossil-fuel fired plant is the low cost of fuel. This is the main reason for the low steam costs when supplied to an MED or a hybrid membrane/thermal desalination plant. On the other hand, some additional capital investment may be needed for a nuclear cogeneration plant due to the required isolation loop coupling a thermal or a hybrid plant to the power plant, which is not needed for a coupled fossil fuel-fired plant.
• The safety and environmental considerations of a nuclear desalination complex do not pose significant economic or health risks. Some provisions need to be made in order ensure that when the desalination plant as a heat sink is shut down or operated in partial load, there will be a backup heat sink available to accept rejected heat from the power plant and prevent power plant shutdown.
• There is a need to perform a detailed socio-economic study that will assess the true amount of water to be produced by desalination methods.
In conclusion, it can be stated that the preliminary feasibility of cogeneration of water and power using a nuclear reactor as an energy source was demonstrated. The specific implementation of the discussed cogeneration options is to be evaluated in detail for its economic and technical feasibility as a follow-up step to this current analysis, which does indicate that nuclear desalination can readily be considered as a competitive alternative to conventional, fossil fuel-powered cogeneration plants.
REFERENCES [1] W. BATES, et al, Tampa Bay Seawater Desalination Facility: Start to Finish, Proceedings of
the International Desalination Association World Congress, Bahamas (2003).
216

CONTRIBUTORS TO DRAFTING AND REVIEW
El-Desoky Ibrahim, A-H. Nuclear Power Plants Authority, Egypt
Faibish, R. Argonne National Laboratory, United States of America
Gomez de Soler, S.M. Comisión Nacional de Energia Atómica, Argentina
Khamis, I. International Atomic Energy Agency
Lee, M.K. Korea Atomic Energy Research Institute, Republic of Korea
Mahmood, K. Pakistan Atomic Energy Commission, Pakistan
Methnani, M. International Atomic Energy Agency
Misra, B.M. International Atomic Energy Agency
Nisan, S. Commissariat à l’Energie Atomique, France
Polunichev, V.I. Institute of Physics and Power Engineering, Russian Federation
Suleiman, S. Atomic Energy Commission of Syria, Syrian Arab Republic
Tewari, P.K. Bhabha Atomic research Center, India
Wagner, K. Consultant, International Atomic Energy Agency
Wu, S. Institute of Nuclear and New Energy Technology, Tsinghua University, China
217