economics and politics research group cerme-cief … · economics and politics research group ......
TRANSCRIPT
!
!
University of Brasilia! !Economics and Politics Research Group
A CNPq-Brazil Research Group http://www.EconPolRG.wordpress.com
Research Center on Economics and Finance−CIEF Research Center on Market Regulation–CERME
Research Laboratory on Political Behavior, Institutions and Public Policy−LAPCIPP
Master’s Program in Public Economics−MESP
The decline in inequality in Brazil, 2003–2009: The role of the State
Pedro H. G. F. de Souza and Marcelo Medeiros
IPEA and University of Brasilia
Economics and Politics Working Paper 14/2013
June 26, 2013 !
Economics and Politics Research Group CERME-CIEF-LAPCIPP-MESP Working Paper Series
ISBN: !

State%and%the%fall%in%inequality%in%Brazil%%
1%%
The$decline$in$inequality$in$Brazil,$2003$–$2009:$the$role$of$the$State%
%Pedro%HGF%Souza%
Ipea%%
Marcelo%Medeiros%Ipea,%UnB%
%%%%
(Draft%v2,%June%01,%2013)%%%%%%%%%%%
Aknowledgements:%%we%would%like%to%thank%Branko%Milanovic%and%Rodolfo%Hoffmann%for%their%comments%and%suggestions%on%the%first%draft%of%this%study.%% %
State%and%the%fall%in%inequality%in%Brazil%%
2%%
$
The$decline$in$inequality$in$Brazil,$2003$–$2009:$the$role$of$the$State$
Abstract
We employ methods of static and dynamic factor decomposition of income inequality to examine the role of the State in the decline of Brazilian inequality between 2003 and 2009. The data comes from two rounds of the Brazilian Consumption and Expenditure Survey (POF). We found that about one third of the decline was related to direct income flows between the State and the families, but not all State actions contributed to reduce inequality. The contributions of different factors to the decline in inequality were 20% for social assistance, 10% for pensions and 8% for different types of unemployment insurance incomes. Behind these contributions there is more than a simple expansion of social transfers: these transfers became less concentrated. Tax policy was altered with the primary goal of increasing revenue, but ended having inequality-reducing consequences, with all direct tributes contributing with 5% of the decline. An increase in State regressive transfers, particularly a systematic increase in salaries of workers of the public sector, had a negative effect on inequality, with a contribution of -10%. Such negative effect was sufficient to offset the egalitarian consequences of changes in most State-related factor components, if each is considered separately.
Keywords
Income Distribution; Social Inequality; Welfare State; Social Policies; Public work; Pensions
JEL
D31; D33; D63; H22; H23; H53; H55; I38; J45
% !
State%and%the%fall%in%inequality%in%Brazil%%
3%%
Introduction
In contrast with the increasing concentration of income in most OECD and BRICS countries, inequality fell rapidly in Latin America during the 2000s. At that time Brazil was one of the most unequal countries in the world and was also the first country in the region to show clear signs of a stable decline in its inequality. Part of the decline can be related to the micro determinants of inequality, such as the characteristics of individuals and families. In this study we adopt a diffrerent approach and focus on the role of the State in the dynamics of inequality.
To examine the role of the State in the fall of Brazilian inequality during the 2000s we evaluate the double-folded argument that i) the State contributes to a large share of total inequality and therefore it has an important role in the dynamics of inequality, and ii) the State became more egalitarian over time, although some of its regressive policies partially offset its most progressive transfers.
This approach is more or less present in comparative studies since, at least, the late 1970s (Stack, 1978) and recently became more frequent in studies showing that direct income flows between the State and families play a relevant role in the behavior of inequality. These include analyses of the role of taxes and transfers from social security in OECD countries (Atkinson, 2003; Brown & Prus, 2006; Gottschalk & Smeeding, 1997; Gustafsson & Johansson, 1999; Roine, Vlachos, & Waldenström, 2009; Smeeding, 2005) and Africa (Odedokun & Round, 2004), and of social security and social assistance, but not taxes, in Latin America (Gasparini, Cruces, & Tornarolli, 2011; Gasparini & Lustig, 2011; López-Calva & Lustig, 2010; Soares, Osorio, Soares, Medeiros, & Zepeda, 2009; Székely & Hilgert, 2011) and specifically in Brazil (Barros, Carvalho, Franco, & Mendonça, 2007; Ferreira, 2006; Soares, 2006) (Barros, Carvalho, & Franco, 2007; Ferreira, 2006; Soares, 2006).
Most of these studies relate the State to broad categories of incomes such as taxes and social policies. We, however, move in a slightly different direction. To examine how the State affects the evolution of inequality we have another way of classifying incomes, which can be summarized in three points. First, we do not limit the State to social policies and taxes, but also include wages in the public sector as part of State transfers. We argue that the impact of the State on inequality goes beyond a tax-and-social benefit transfer system and should include other types of gains received by various interest groups; in the case of salaries of public sector workers, State politics play an important role as the institutional setting (both the ‘rules of the game’ and the organizational and political environment) affecting these wages is very different from that observed in the private sector. Second, we try to disaggregate broad categories of social policies, such as social security, according to the social groups these policies were designed to benefit; in particular, we partition the public pension system into subsystems, one for workers in the public and another for those in the private sector. We do this because pensions for public servants in Brazil, as in many other countries, follow rules different than those for public pensions for private sector workers. Third, differently from what has been done in the studies about Latin America (Brazil included) mentioned above, we also look at the effect of direct taxation on inequality, which is key to express the distributional conflict that underlies State actions.
By following this scheme we are better able to evaluate three ideas commonly discussed in the literature about the static determinants of social inequality, as well as to relate these ideas to the dynamics of the income distribution in Brazil: i) that work in the public sector contributes to lower inequality; ii) that the level of inequality is inversely related to the level of direct taxation, thus they should move in different directions, coeteris paribus; iii) and that social expenditure is intrinsically progressive, therefore the more of it, the less inequality there will be.
Indeed, there is ample evidence that in several developed countries public sector work reduces inequality(Blau & Kahn, 1996; Gustafsson & Johansson, 1999; Milanović, 1994; Wallerstein, 1999). In addition, the level of taxation in OECD countries often has a stable inverse association with the level of
State%and%the%fall%in%inequality%in%Brazil%%
4%%
inequality, although this relation is not always linear due to the fact that the tax base depends on other determinants of inequality (Atkinson, 2003; Brown & Prus, 2006; Goñi, López, & Servén, 2008; Gottschalk & Smeeding, 1997; Roine et al., 2009). Regarding the level of social spending, the existing evidence is not so conclusive. There seems to be an inverse correlation between total spending and inequality (Mahler & Jesuit, 2006; Moene & Wallerstein, 2001; Roine et al., 2009) and some studies argue that the level of total expenditure matters more to inequality than its progressiveness, as a higher universalistic spending legitimizes more targeted policies (Korpi & Palme, 1998; Smeeding, 2005). However, when more refined methods of decomposition are used, total expenditure, by itself, has limited explanatory power (Caminada & Goudswaard, 2001; Wang, Caminada, & Goudswaard, 2012). Whether this correctly describes the Brazilian case is, of course, a matter of empirical testing.
Analyzing two rounds of the major consumption and expenditure survey in Brazil we found that the State contributed decisively to the decline in inequality observed between 2003 and 2009. About one third of this decline relates to changes in the level and in the distribution of direct flows of income between the State and the families. As we discuss below, the expansion of highly progressive conditional and unconditional cash transfers, reductions in the regressiveness of pensions and the increase of taxation, even at the cost of making direct taxes a little less progressive, resulted in less inequality. Notwithstanding, in this period the State acted in an ambiguous way, offsetting some of its progressive measures with regressive policies such as the wage policy for workers in the public sector.
Methodology!
! Data!The study uses microdata from two comparable rounds - 2002-3 and 2008-9 - of the Brazilian
Consumption and Expenditure Survey (POF - Pesquisa de Orçamentos Familiares) conducted by the country’s statistics office (Instituto Brasileiro de Geografia e Estatística – IBGE). POF is the most reliable source for household income data in Brazil in what refers to capital incomes and social assistance, and the only source of data on the payment of direct taxes by households. The survey uses consumption and expenditure diaries filled out for each family during a period of two weeks, plus individual questionnaire interviews with each family member to collect additional social, demographic and economic information. Data in each round is collected over a period of twelve months, to control for seasonality. POF’s sample has national coverage and total sample sizes of approximately 180,000 individuals in 48,000 families in 2002-2003 and 190,000 individuals in 55,000 families in 2008-2009, representing populations of, respectively, 174 and 189 million people.
We analyze the distribution of disposable per capita family income, which encompasses monetary labor earnings, capital incomes (excluding capital gains) and private and public monetary transfers of all kinds, minus direct taxes and employees’ Social Security contributions. A negligible number of households with negative disposable income were left out of our analysis. Both income and tax data have a 12 month reference period and are by default deflated by IBGE to January 2003 (POF 2002-2003) and January 2009 (POF 2008-2009). In order to facilitate meaningful international comparisons, we present our results in 2005 PPP$, that is, we first deflated both rounds to 2005 and then applied the World Bank’s Purchasing Power Parity (PPP) factor for Brazil during that year, at a rate of R$ 1.57 per PPP$. For the sake of simplicity, data from the 2002-3 and 2008-9 surveys are referred to as 2003 and 2009 values.
Dynamic!Decomposition!of!Inequality!We measure total inequality using the Gini coefficient, which varies between 0 (no inequality)
and 1 (all income belongs to a single individual). The Gini coefficient is additively decomposable by income sources or factors (Rao, 1969). Factor is a term used to indicate different sources of income
State%and%the%fall%in%inequality%in%Brazil%%
5%%
(positive incomes) and taxes (negative incomes), as well as subdivisions or aggregations of income sources (ie. negative and positive wage differentials, pensions of the public and private sectors and so on). In the factor decomposition, total inequality can be represented as the sum of the concentration coefficient of each factor weighted by the share of this factor in total income. Using the simpler and more commonly adopted notation of Pyatt et al. (1980):
G = ϕkCkk=1
m
∑ (1)
Where kφ is the share of income source (factor) k in the total income, and kC the concentration
coefficient of income k. The absolute contribution of each factor k to total inequality is given by kkCφ
and its relative contribution by GCkk /)(φ .
The concentration coefficient is a measure of the distribution of a factor among the distribution of ordered total incomes. The concentration coefficients stay within the (-1, +1) range when factors have only positive or only negative values, with -1 indicating that all the income from that factor is received by the poorest person and + 1 the opposite (Pyatt et al., 1980). However, when a factor has both positive and negative values but the distribution of total incomes has only positive values, the coefficients may stay outside the (-1,+1) range (Chen, Tsaur, & Rhai, 1982). As we show below, this occurs in the case of the concentration coefficient of one of our factors, the public-private wage gap.
To analyze data when a factor causes the coefficients to fall outside the regular range one can adjust the scale of the Gini, split the factor in subfactors with only positive or negative values or change the way the concentration levels of the factor are interpreted. Each alternative has its advantages and disadvantages. We opted to divide the unusual factor into subfactors and, simultaneously, accepted an unconventional scale for the concentration coefficient of the total wage differential. By doing this we granted comparability with other studies at the cost of having to make a careful interpretation of the concentration of only one factor component of less importance to inequality.
The factor decomposition of the Gini coefficient also yields a progressivity index of an income source or factor (Kakwani, 1977). The difference between the concentration coefficient of each factor and the Gini gives the progressivity index P :
P! = !! − ! (2)
All incomes factors whose concentration coefficient is lower than the overall Gini can be considered progressive, ie. they are more equally distributed than the sum of all factors and thus contribute to lower inequality. An income factor is said to be regressive when it is more unequally distributed than the sum of all factors.
For the dynamic decomposition of the Gini coefficient we followed the approach developed in Soares (2006) and Hoffmann (2006), both in Portuguese, and presented in English in Soares et al. (2009) and Hoffmann (2013), which depart from the factor decomposition of the Gini coefficient to derive a method to decompose changes in total inequality into changes in the concentration of each factor (the concentration effect) and changes in the share of the factor in the total income (the share effect). It can be written as:
∆! = !! − !! = !!∆!! + !!∆!!!!!! (3)
The bar over a variable refers to the average of that variable over the two periods; the capital deltas refer to the difference from one period to the next.
State%and%the%fall%in%inequality%in%Brazil%%
6%%
The sum of changes in the weights of all factor components is zero. Thus, subtracting it from (3), and rearranging, we have:
Δ! = (!!Δ!! + !! − ! Δ!!!!!! (4)
Replacing from (2) in (4), the equation for the dynamic decomposition of the Gini coefficient can be rewritten as
Δ! = (!!Δ!! − !!Δ!!!!!! ) (5)
For the decomposition we categorized factor components by dividing income flows into transfers from the State (wages, pensions, social assistance, etc), transfers to the State (direct taxes and employees’ social security contributions) and transfers from the Private Sector (wages, other earnings, etc). Then we subdivided these into four categories: public servants’ wages, Social Security pensions, unemployment benefits and Social Assistance transfers. The first two categories were again subdivided to account for wage differentials in the public and private sectors and the segmentation between the public servants’ and the private sector workers’ pension systems.
Earnings!of!Workers!in!the!Public!Sector!The earnings of workers in the public sector were subdivided into two components: the estimated
market earnings and the public-private wage differential (often called ‘wage premium’, although it can be negative). The first component is what public sector employees would presumably earn in the private sector labor market given their individual attributes; the second is the difference between their observed earnings and the counterfactual wages.
This counterfactual was estimated using the decomposition proposed by Juhn, Murphy and Pierce (JMP), which separates price, quantity and residual effects using linear regressions (Juhn, Murphy, & Pierce, 1993). Given a vector of independent variables X, the basic wage equations used to estimate the wages of the workers in the public and private sectors ( iw and iq , respectively) were written as:
wwi uXw += β)ln( (6)
qqi uXq += β)ln( (7)
The residuals of the wage equations for the workers in the private sector (u!) can be disaggregated in two parts: the distribution function of the residuals ( qF ) and the rank of the individuals
in the quantile distribution of residuals ( iqτ ). Thus:
)|(1 XFu iqqq τ−= (8)
Where )|(.1 XFq− is the inverse of the accumulated distribution function for the workers in the
private sectors with the characteristics X. The counterfactual wages, icf , of the workers in the public sector were estimated by:
)|()ln( 1 XFXcf iwqqi τβ −+= (9)
In other words, we computed the counterfactual wages using the coefficients and the distribution of residuals estimated for comparable workers in the private sector. To define ‘comparable worker’ we
State%and%the%fall%in%inequality%in%Brazil%%
7%%
restricted the comparison to public sector employees and formal workers in the private sector. Domestic workers were excluded from the latter group. Military personnel and rural workers could not be excluded from the definition of ‘comparable worker’ due to the lack of data, but from other surveys we know they account for less 5% of all public sector and formal private sectors employees.
Equations 6-9 assume the allocation of workers between sectors is random. Since this is not a very plausible assumption, there can be a significant selection bias affecting the parameters. To verify this bias we tested four different models: the first was the model described by equations 6-9 (the “uncorrected model”); the other three include different specifications of correction for censored data, which adds to wage equations the Inverse Mills Ratios derived from probit selection equations. Thus, the first of the three followed a probit to model the choice between the formal private labor market and the public sector; the second alternative model employed as its selection equation a probit to account for the choice between not working and working; the third employed a bivariate probit to simultaneously model the choice between not working and working and working in the private or public sectors. This last model generated two Inverse Mills Ratios calculated from the predicted probabilities.
Other than the Inverse Mills Ratios, the wage equations were exactly the same in all four models, using a standard set of independent variables: education (six dummy variables for seven educational levels: elementary school or less; incomplete middle school; complete middle school; incomplete high school; complete high school; incomplete higher education; complete higher education); age and age squared; job tenure (two dummies for three levels: three months or less; 11 months or less; one year or more); gender (dummy for men); race (dummy for whites and Asians); and region (nine dummy variables for 10 regions: non-metropolitan areas of the Northern region; metropolitan areas of the Northern region; non-metro areas of the Northeast; metro areas of the Northeast; non-metro areas of the South; metro areas of the South; non-metro areas of the Southeast; metro areas of the Southeast; non-metro areas of the Center-West; metro areas of the Center-West). The dependent variable was the log of the monthly earnings.
The selection equations used the same variables plus a specific set of variables used to identify the distribution between sectors, that is, the exclusion restrictions: relationship to the household head (four dummies for five types of relationship: head, spouse/partner, child, other relative, other); the presence of children between 0 and 6 years old in the household (one dummy variable); the presence children between 7 and 15 in the household (one dummy variable); and the presence of other public sector workers in the household (one dummy).
All four models yielded remarkably similar results. The public-private wage gaps – the average difference between observed and counterfactual earnings for public sector workers, expressed as a percentage of the counterfactual earnings – were 12% - 13% in 2003 and rose to 23%-24% in 2009. In other words, according to all four models, in 2003 the average public sector worker earned a bit over 10% more than he or she would if he or she worked in the private sector, whereas in 2009 this figure jumped to almost 25%. The inequality decomposition presented below is based on the result of the bivariate probit model, but the results are thoroughly consistent across models.
Social!security!pensions!–!benefits!and!contributions!The Brazilian public pension system is organized as a mandatory pay-as-you-go system with two
subsystems operating under different rules (two regimes, in Brazilian terminology), one for private sector workers and another for public sector workers. The most important difference between them is a legal cap that limits the values of pensions paid to private sector workers. There is no cap on the pensions of public sector workers. Additionally, there is a legal floor to all pensions, equivalent to the value of one monthly minimum wage, irrespectively of the average contribution of the beneficiary. Over the years the minimum wage was raised in real terms from approximately $180 in 2003 to $250 in 2009 (both in 2005 PPP$). This is about six times less than the legal cap to pensions paid to former private sector workers.
State%and%the%fall%in%inequality%in%Brazil%%
8%%
Supplementary private pensions are a minor source of income in Brazil and were classified as ‘other incomes’.
Since it is not possible to separate public from private sector pensions in the 2003 data, all pensions in the Gini decomposition were disaggregated into three major income factors: pensions lower than or equal to the minimum wage; pensions higher than the minimum wage but lower or equal to the legal cap; and pensions higher than the legal cap. The first income factor encompasses mostly former private sector workers, as there are very few retired civil servants earning the legal floor. The second income factor is more heterogeneous, but the third comprises exclusively former public sector workers. Those pensions above the cap were further split into two additional income factors, one equal to the cap and the other representing the ‘premium’ some retired public servants enjoy as their pensions do not have a cap.
The value of the contributions to social security varies according to the subsystem or regime. Workers in the public sector pay a flat rate around 11% of their total wages; pensioners of the public sector workers’ system pay 11% on the share of their benefits that exceed the value of the cap; workers in the private sector, who are subject to a cap, pay a rate of 11% of the share of their wages below the value of the cap and pensioners of the private sector system do not have to pay contributions because their pensions, by definition, do not exceed the cap.
In order to simplify the analysis, we opted to divide the Social Security contributions into two primary income factors: contributions linked to earnings lower than or equal to the legal cap and contributions linked to earnings above that threshold. Thus, whenever public sector workers earned twice as much as the legal cap, their contributions were split evenly between the latter two income factors. It is also worth noting that all contributions made by retired public servants are considered as part of the last income group. The contributions of pensioners of the subsystem for public sector workers had to be imputed, as POF only collects disaggregated data on the contributions of active workers.
Other!income!factors!Social assistance transfers, unemployment benefits and taxes were computed as they are in the
database. Social Assistance encompasses all non-contributory cash benefits but two programs are responsible for almost all transfers: the Bolsa Familia conditional cash transfers program, which targets poor and extremely poor families, especially those with children, and the Continuous Cash Benefit (Benefício de Prestação Continuada), which is unconditional and targeted to poor people aged over 65 or with severe disabilities. The most important unemployment benefit is the standard benefit paid to formal private sector workers upon dismissal. Taxes include all direct taxes registered by survey, with income, vehicle and land taxes being the most important ones.
Results!and!discussion!Between 2003 and 2009 inequality in disposable per capita family income in Brazil fell by 6% --
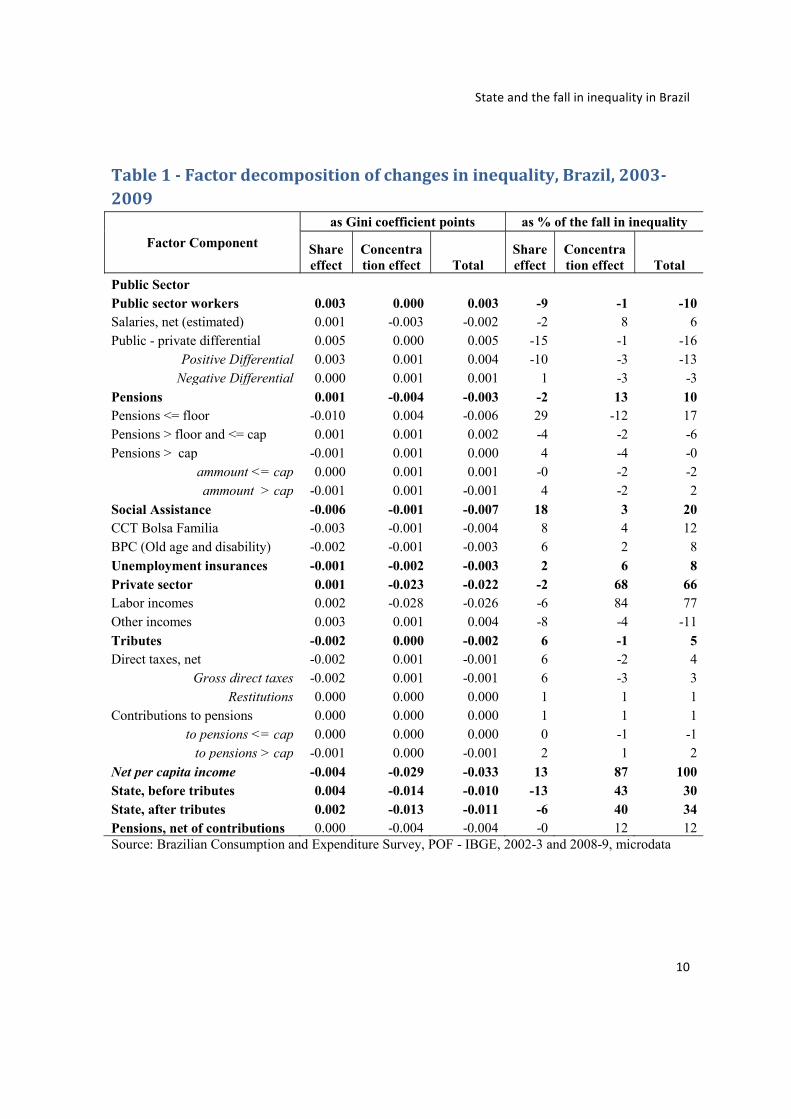
the Gini coefficient dropped from 0.595 to 0.562 (-0.033 points). The total fall in the decade is larger, as inequality begun falling rapidly in 2001. Table 1 shows the absolute and relative contribution of each factor component to this fall in inequality. Negative absolute values indicate contributions to reduce the Gini coefficient, and vice-versa. However, to facilitate understanding we inverted the signs of the percentage contributions so we can express values in terms of the effect on the fall on inequality. Therefore, positive percentage values indicate a contribution to this fall and negative values the opposite. The table also decomposes the contribution of each income component into changes on their relative size, that is, the fraction of total income accounted for each factor component (share effect) and changes on the degree of concentration of each component (concentration effect). All values express the net contribution

State%and%the%fall%in%inequality%in%Brazil%%
9%%
of a factor component, with positive contributions offsetting negative contributions when the total fall is computed. Concentration coefficients and population shares for each year are presented in tables 2 and 3.
The most important determinants of the dynamics of inequality in this period were changes in earnings from work in the private sector of the economy, which had a contribution of +66% of the fall in inequality (that is, -0.022 Gini points). In particular, these earnings became noticeably less concentrated over time: the concentration effect of these incomes contributed to reduce inequality by 0.028 Gini points – that is, 84% of the total fall –, being only slightly offset by the inequality-increasing share effect. Yet, in spite of the weight of these incomes, in relative terms the State contributed more to the decline in inequality than the private sector, as we discuss below.
% !
State%and%the%fall%in%inequality%in%Brazil%%
10%%
Table&1&(&Factor&decomposition&of&changes&in&inequality,&Brazil,&2003(2009&
Factor Component as Gini coefficient points as % of the fall in inequality
Share effect
Concentration effect Total
Share effect
Concentration effect Total
Public Sector Public sector workers 0.003 0.000 0.003 -9 -1 -10
Salaries, net (estimated) 0.001 -0.003 -0.002 -2 8 6 Public - private differential 0.005 0.000 0.005 -15 -1 -16
Positive Differential 0.003 0.001 0.004 -10 -3 -13 Negative Differential 0.000 0.001 0.001 1 -3 -3
Pensions 0.001 -0.004 -0.003 -2 13 10 Pensions <= floor -0.010 0.004 -0.006 29 -12 17 Pensions > floor and <= cap 0.001 0.001 0.002 -4 -2 -6 Pensions > cap -0.001 0.001 0.000 4 -4 -0
ammount <= cap 0.000 0.001 0.001 -0 -2 -2 ammount > cap -0.001 0.001 -0.001 4 -2 2
Social Assistance -0.006 -0.001 -0.007 18 3 20 CCT Bolsa Familia -0.003 -0.001 -0.004 8 4 12 BPC (Old age and disability) -0.002 -0.001 -0.003 6 2 8 Unemployment insurances -0.001 -0.002 -0.003 2 6 8 Private sector 0.001 -0.023 -0.022 -2 68 66 Labor incomes 0.002 -0.028 -0.026 -6 84 77 Other incomes 0.003 0.001 0.004 -8 -4 -11 Tributes -0.002 0.000 -0.002 6 -1 5 Direct taxes, net -0.002 0.001 -0.001 6 -2 4
Gross direct taxes -0.002 0.001 -0.001 6 -3 3 Restitutions 0.000 0.000 0.000 1 1 1
Contributions to pensions 0.000 0.000 0.000 1 1 1 to pensions <= cap 0.000 0.000 0.000 0 -1 -1
to pensions > cap -0.001 0.000 -0.001 2 1 2 Net per capita income -0.004 -0.029 -0.033 13 87 100 State, before tributes 0.004 -0.014 -0.010 -13 43 30 State, after tributes 0.002 -0.013 -0.011 -6 40 34 Pensions, net of contributions 0.000 -0.004 -0.004 -0 12 12 Source: Brazilian Consumption and Expenditure Survey, POF - IBGE, 2002-3 and 2008-9, microdata!
State%and%the%fall%in%inequality%in%Brazil%%
11%%
The State played an important role in the dynamics of inequality. Although changes in the distribution of incomes in the private sector were the major determinant of the fall in the Gini coefficient, a third (34%) of this fall was due to the evolution of direct income flows between the State and the families. Among them, social assistance transfers were the factor component with the most important contribution (20%), followed by pensions (10%), unemployment insurance funds incomes (8%) and a small contribution of income taxes and other tributes (5%).
However, the State acted in an ambiguous way in this dynamics. While some direct income flows favored equality, they were partially counteracted by changes in the wages of workers in the public sector. Taken as a whole, changes in the level and the distribution of salaries of public workers had the effect of slowing down the fall in inequality, with negative contribution to this fall of -10%. The importance of this negative effect should not be underestimated. It was sufficient to offset the positive effect of any State factor component considered alone, except for social assistance transfers.
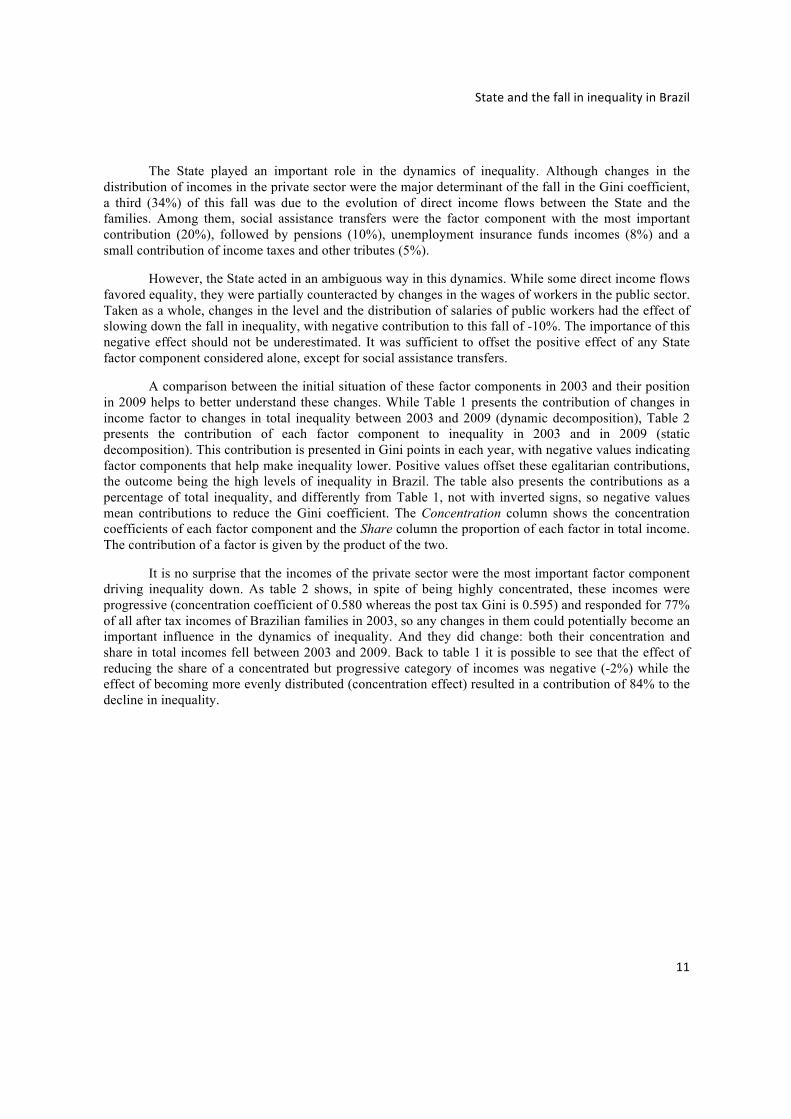
A comparison between the initial situation of these factor components in 2003 and their position in 2009 helps to better understand these changes. While Table 1 presents the contribution of changes in income factor to changes in total inequality between 2003 and 2009 (dynamic decomposition), Table 2 presents the contribution of each factor component to inequality in 2003 and in 2009 (static decomposition). This contribution is presented in Gini points in each year, with negative values indicating factor components that help make inequality lower. Positive values offset these egalitarian contributions, the outcome being the high levels of inequality in Brazil. The table also presents the contributions as a percentage of total inequality, and differently from Table 1, not with inverted signs, so negative values mean contributions to reduce the Gini coefficient. The Concentration column shows the concentration coefficients of each factor component and the Share column the proportion of each factor in total income. The contribution of a factor is given by the product of the two.
It is no surprise that the incomes of the private sector were the most important factor component driving inequality down. As table 2 shows, in spite of being highly concentrated, these incomes were progressive (concentration coefficient of 0.580 whereas the post tax Gini is 0.595) and responded for 77% of all after tax incomes of Brazilian families in 2003, so any changes in them could potentially become an important influence in the dynamics of inequality. And they did change: both their concentration and share in total incomes fell between 2003 and 2009. Back to table 1 it is possible to see that the effect of reducing the share of a concentrated but progressive category of incomes was negative (-2%) while the effect of becoming more evenly distributed (concentration effect) resulted in a contribution of 84% to the decline in inequality.
State%and%the%fall%in%inequality%in%Brazil%%
12%%
Table&2&(&Factor&decomposition&of&inequality,&Brazil,&2002(3&and&2008(9&
Factor Component
2002-3 2008-9
Concentration Share
Factor contribution
% of Gini
Concentration Share
Factor contribution
% of
Gini Public Sector
Labor incomes 0.732 0.146 0.107 18 0.734 0.166 0.121 22 Salaries, net (estimated) 0.710 0.130 0.092 16 0.690 0.134 0.093 17 Public - private differential 0.912 0.016 0.015 3 0.922 0.031 0.029 5
Positive Differential 0.819 0.023 0.019 3 0.857 0.036 0.030 5 Negative Differential 0.594 -0.007 -0.004 -1 0.404 -0.004 -0.002 0
Pensions 0.606 0.155 0.094 16 0,001 0.204 0.119 21 Pensions <= floor 0.051 0.034 0.002 0 0.142 0.054 0.008 1 Pensions > floor and < = cap 0.619 0.062 0.039 6 0.627 0.096 0.060 11 Pensions > cap 0.917 0.058 0.053 9 0.940 0.055 0.051 9
amount <= cap 0.888 0.026 0.023 4 0.915 0.026 0.024 4 ammount > cap 0.940 0.033 0.031 5 0.961 0.029 0.028 5
Social Assistance -0.211 0.003 -0.001 0 -0.347 0.010 -0.003 -1 CCT Bolsa Familia -0.215 0.003 -0.001 0 -0.539 0.006 -0.003 -1 BPC (Old age and disability) 0.296 0.000 0.000 0 -0.077 0.004 0.000 0 Unemployment insurances 0.697 0.022 0.016 3 0.590 0.013 0.008 1 Private sector 0.580 0.770 0.447 75 0.550 0.720 0.396 71 Labor incomes 0.567 0.702 0.398 67 0.526 0.636 0.334 59 Other incomes 0.718 0.067 0.048 8 0.735 0.084 0.062 11 Tributes 0.704 -0.096 -0.067 -11 0.701 -0.113 -0.079 -14 Direct taxes, net 0.742 -0.060 -0.045 -8 0.732 -0.073 -0.054 -10
Gross direct taxes 0.750 -0.064 -0.048 -8 0.735 -0.076 -0.056 -10 Restitutions 0.878 0.004 0.003 1 0.825 0.003 0.002 0
Contributions to pensions 0.639 -0.036 -0.023 -4 0.644 -0.040 -0.026 -5 to pensions <= cap 0.592 -0.031 -0.018 -3 0.581 -0.033 -0.019 -3 to pensions > cap 0.909 -0.005 -0.005 -1 0.938 -0.007 -0.007 -1
Net per capita income
1.000 0.595 100 2.810 1.000 0.562 100 State, before tributes 0.664 0.329 0.219 37 0.625 0.395 0.246 44 State, after tributes 0.644 0.230 0.148 25 0.592 0.280 0.166 29 Pensions, net of contributions 0.596 0.119 0.071 12 0.568 0.165 0.093 17
Source: Brazilian Consumption and Expenditure Survey, POF - IBGE, 2002-3 and 2008-9, microdata!
On the other hand, the share of the State-related income flows in total income increased between 2003 and 2009, both before as well as after taxes and other tributes. As table 2 shows, the sum of all State-related incomes, including salaries, grew from 33% to 40% of all pre-tax incomes. Tributes also
State%and%the%fall%in%inequality%in%Brazil%%
13%%
increased, raising from 9,6% to 11,3% of the pre-tax incomes. As the State taxes part of the incomes it transfers, the net effect of this increase in both incomes and tributes was an increase of the share of State-related income flows from 23% to 28%.
Considering the results presented in tables 1 and 2, proportionally the changes in State-related incomes contributed slightly more to the fall in inequality than transfers occurring in the private sector. Beginning with a pre-tax share of total income of 33% in 2003 and contributing to 30% of the fall inequality, the State incomes contributed with about 6% per dollar more than those of the private sector, which begun with a pre-tax share of 77% of incomes and contributed to 66% of the fall.
The largest State-related income factor in 2003 and 2009 were pensions (respectively 15.5% and 20.4%), followed by salaries (14.6% and 16.6%), unemployment insurance (2.2% and 1.3%) and social assistance (0.1% and 1%), as table 2 shows. Except for unemployment insurance, the share of all sources of State-related income grew in the period. Nevertheless, the ordering of the progressiveness of these sources of income is completely different. Social assistance, the smallest of them, has always been the most progressive income factor, and this progressiveness even increased between 2003 and 2009, with its concentration coefficients falling from -0.211 to -0.347; pensions were highly concentrated, but their concentration decreased from 0.606 in 2003 to 0.582 in 2009, turning them into a modestly progressive source of income. Unemployment insurance and related incomes has always been regressive, but this regressiveness was reduced (0.697 to 0.590). Incomes from work in the public sector, which are the most regressive of all major factor components of inequality in Brazil, were the only component of State-related income factors moving in the opposite direction, with a little rise in its coefficients of concentration (0.732 to 0.734).
The evidence indicates that the net contribution of the income flows between the State and families was indeed successful in reducing inequality, but once we look into its different components, it becomes clear that the fall could be much larger. In spite of becoming more egalitarian between 2003 and 2009, direct income flows from the State still contribute to maintain inequality at high levels. In fact, changes were positive but arguably marginal and there is still much to improve. A more detailed analysis will help to clarify this idea.
Most of the State's contribution to the fall in the Gini coefficient can be linked to social policies, such as social assistance, pensions, unemployment insurance. Yet, each policy affected inequality for different reasons. Social assistance programs, which were already extremely progressive in 2003, reduced inequality as they were scaled up. On the other hand, the expansion of pensions, which were highly concentrated, actually had a negative contribution to inequality; what made pensions help inequality fall was a reduction in their regressiveness. Finally, unemployment insurance, which was even more regressive than pensions, contributed by shrinking in importance as a percentage of total incomes and by simultaneously becoming less concentrated. Therefore, the Brazilian case clearly does not support the argument that an expansion in social expenditures automatically translates into equality; actually, pure growth without changes in the distribution of these policies could have increased inequality.
Social assistance in Brazil is composed essentially by two targeted cash transfer programs, Benefício de Prestação Continuada (BPC; in Portuguese the acronym stands for Continuous Cash Benefit) and Bolsa Familia. BPC is an unconditional transfer targeted to low income individuals with disabilities or aged 65 or more. Bolsa Familia, which translates as ‘family grant’, is a conditional (to schooling and health) cash transfer targeted to poor families. Both programs had their origins in the 1990s but were fully implemented only in the following decade. In 2003, 14% of the population lived in a household that benefited from social assistance transfers; in 2009 this proportion was raised to 20% (Table 3). Together they correspond to only a small share of total family per capita income – 1% in 2009 – but they were and remain very well targeted and thus their scaling up was one of the most important forces driving

State%and%the%fall%in%inequality%in%Brazil%%
14%%
inequality down. Most of their 20% contribution to the fall in inequality resulted from the effect of the increase of their share in total incomes (18%).
State%and%the%fall%in%inequality%in%Brazil%%
15%%
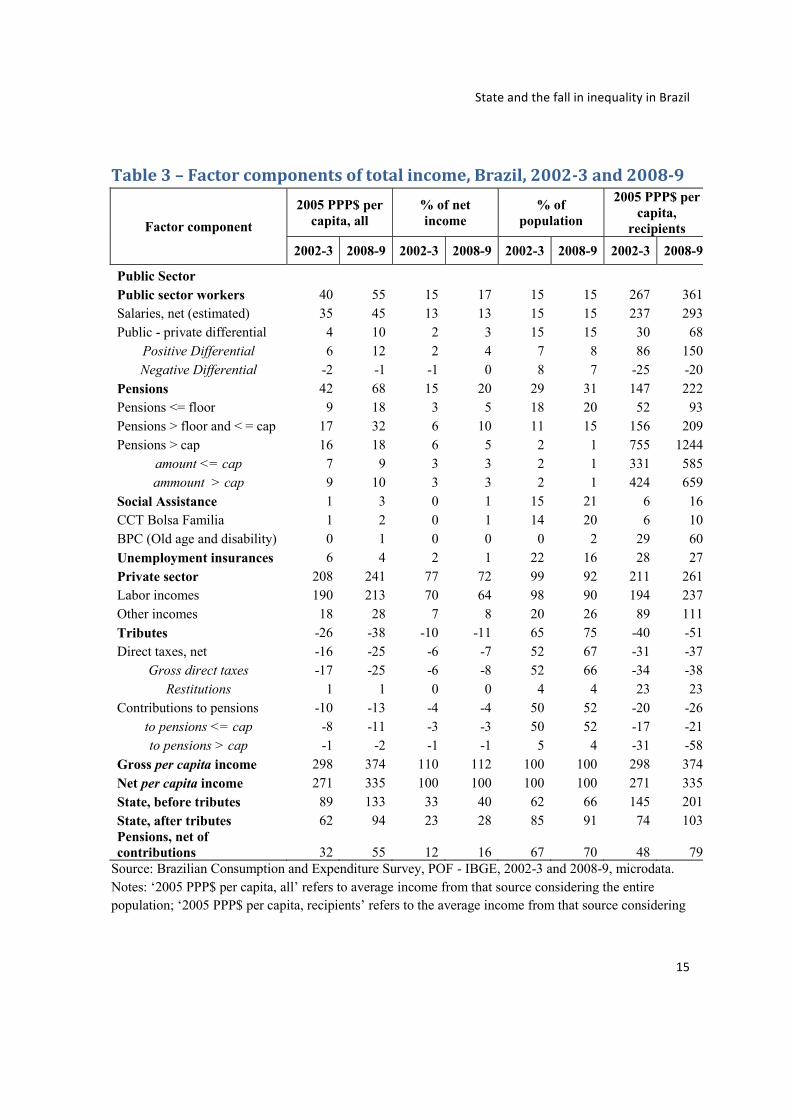
Table&3&–&Factor&components&of&total&income,&Brazil,&200293&and&200899&
Factor component
2005 PPP$ per capita, all
% of net income
% of population
2005 PPP$ per capita,
recipients
2002-3 2008-9 2002-3 2008-9 2002-3 2008-9 2002-3 2008-9
Public Sector Public sector workers 40 55 15 17 15 15 267 361
Salaries, net (estimated) 35 45 13 13 15 15 237 293 Public - private differential 4 10 2 3 15 15 30 68
Positive Differential 6 12 2 4 7 8 86 150 Negative Differential -2 -1 -1 0 8 7 -25 -20
Pensions 42 68 15 20 29 31 147 222 Pensions <= floor 9 18 3 5 18 20 52 93 Pensions > floor and < = cap 17 32 6 10 11 15 156 209 Pensions > cap 16 18 6 5 2 1 755 1244
amount <= cap 7 9 3 3 2 1 331 585 ammount > cap 9 10 3 3 2 1 424 659
Social Assistance 1 3 0 1 15 21 6 16 CCT Bolsa Familia 1 2 0 1 14 20 6 10 BPC (Old age and disability) 0 1 0 0 0 2 29 60 Unemployment insurances 6 4 2 1 22 16 28 27 Private sector 208 241 77 72 99 92 211 261 Labor incomes 190 213 70 64 98 90 194 237 Other incomes 18 28 7 8 20 26 89 111 Tributes -26 -38 -10 -11 65 75 -40 -51 Direct taxes, net -16 -25 -6 -7 52 67 -31 -37
Gross direct taxes -17 -25 -6 -8 52 66 -34 -38 Restitutions 1 1 0 0 4 4 23 23
Contributions to pensions -10 -13 -4 -4 50 52 -20 -26 to pensions <= cap -8 -11 -3 -3 50 52 -17 -21 to pensions > cap -1 -2 -1 -1 5 4 -31 -58
Gross per capita income 298 374 110 112 100 100 298 374 Net per capita income 271 335 100 100 100 100 271 335 State, before tributes 89 133 33 40 62 66 145 201 State, after tributes 62 94 23 28 85 91 74 103 Pensions, net of contributions 32 55 12 16 67 70 48 79
Source: Brazilian Consumption and Expenditure Survey, POF - IBGE, 2002-3 and 2008-9, microdata. Notes: ‘2005 PPP$ per capita, all’ refers to average income from that source considering the entire population; ‘2005 PPP$ per capita, recipients’ refers to the average income from that source considering
State%and%the%fall%in%inequality%in%Brazil%%
16%%
Brazil was not an isolated case. Other Latin American countries expanded their cash transfer programs during the 2000s and obtained positive impacts on inequality. For example, in spite of differences in terms of program design and administration, the targeted programs of Mexico and Chile achieved levels of targeting efficiency similar to those of Brazil when being scaled up and, as a consequence, also drove income inequality down in these countries (Soares et al., 2009).
If Brazil shares with other Latin American countries the progressiveness of is social assistance, it also shares the regressiveness of its pensions. The pension systems of many Latin American countries were designed following the model of corporatist European welfare states (Mesa-Lago, 1978). By differing protection according to segments of the labor force, corporatist pensions have limited capacity to reduce preexisting inequalities (Palme, 2006; Pedraza, Llorente, & Rivas, 2009; Wang et al., 2012). Due to specificities of the history of Latin America, this corporatist character was aggravated by the fact that social security was used politically to co-opt working elites, becoming marked by high levels of regressiveness (Esquivel, 2011; R. Hoffmann, 2003; Lavado, 2007; Soares et al., 2009).
After the 1990s these countries began reforming their pension systems in different directions. On one extreme, Chile assumed the huge transition costs of quickly switching from a pay-as-you-go to a fully funded system of individual accounts. That option tends to be neutral or even regressive as, by definition, such systems replicate in benefits what were once labor market inequalities. On the other, Brazil reformed its pay-as-you-go system in order to make it more egalitarian, expanding noncontributory and heavily subsidized protection and introducing floors and caps for the value of pensions.
Currently, the public pension system is subdivided in two subsystems (or regimes, in the Brazilian terminology), one for formal workers of the private sector and another for public servants. The subsystem for private sector retirees has a floor and a cap for benefits whereas the one for public sector workers has only a floor. The absence of a cap makes this subsystem very regressive.
In the late 1980s the national minimum wage was defined as the floor to all pensions. By linking social security to labor policies, this legal provision bolstered the political appeal of the minimum wage. Since the mid-1990s, and especially the early 2000s, the minimum wage has been increasing in real terms. However, the problem of imposing a cap to pensions paid to former public servants and overcoming the resulting opposition from working elites was yet to be solved. To avoid part of the economic and political costs of a rapid change, Brazil implemented transition rules that will gradually make the system progressive, but will do this at a very slow pace.
An initial impact of Brazilian pension reforms can already be seen on Tables 1 and 2. A systematic rise in the minimum wage over the decade actually made pensions at the floor more regressive between 2003 and 2008. An expansion of their coverage, however, more than reversed this, contributing to reduce inequality. In other words, pensions at the floor turned out to be more egalitarian because of a combination of higher values and better coverage. Higher values, only, could have had the opposite effect.
Pensions above the cap applied for retirees of the private sector, which in 2003 were already the most concentrated of all income factor components (0.917), became even more concentrated in 2009 (0.940). Although benefiting only about 1% of the population, as table 3 shows, these pensions correspond to 5% of the total income in 2009. Not surprisingly they contribute to a disproportional 9% of the Gini coefficient (table 2). A cap for the pensions of workers in the public sector is being gradually introduced. However, due to the gradual transition to the new rules, the implementation of pension caps is yet to result in relevant impacts on inequality since they will only apply to new hires in the public sector. As a result, the extremely high concentration coefficients for pensions higher than the cap for the private sector workers will probably persist for decades to come.
State%and%the%fall%in%inequality%in%Brazil%%
17%%
Another social policy that contributed to the decline in inequality was unemployment insurance, essentially because it became less concentrated. Public unemployment insurance incomes in Brazil are, basically, of two types. One is the unemployment wage compensation paid monthly to workers upon dismissal during up to six months. The other is unemployment insurance savings drawdown, in which workers are allowed withdraw the mandatory savings in their insurance fund accounts. Both have a tendency to be regressive as they are proportional to previous contributions.
Unemployment wage compensation laws in Brazil date back to the 1980s, but it was during the 1990s that the program became fully implemented. Insurance covers only employees in the formal sector who had contributed to social security during six non-consecutive months in the last three years. The compensation is proportional to wages (between 70% and 80%) and has a cap. In spite of the cap, it tends to be regressive, as the majority of the lower income labor force – the self-employed, workers in the informal sector, employees in temporary or high turnover jobs – cannot benefit from it.
The compulsory unemployment insurance savings, known in Brazil by their acronym in Portuguese, FGTS, go back to the 1960s and are more than a protection against the loss of work incomes. Workers are allowed to take income from their insurance accounts after dismissal, retirement, contraction of a serious illness (such as HIV or cancer) or to finance the purchase of a house when the worker does not have one. Drawing these savings can be even more regressive than unemployment monthly compensation, as there is no cap and some workers draw the entire savings account at once at a later phase of their lives, often when family sizes are smaller and family incomes are higher.
These incomes are still highly concentrated, but their concentration decreased from 0.697 in 2003 to 0.590 in 2009. They also lost importance as a share of total incomes, falling from a little more than 2% to about 1%. The combined reduction in regressiveness and in relative importance of these incomes had a contribution of 8% to the fall in inequality, of which 6 percentage points refer to the lower concentration effect alone. As in the case of pensions, a simple growth of unemployment insurances, without changes in their distribution, could have had the effect of increasing inequality.
Direct taxes also helped to lower inequality. Brazil has a rather complex series of tributes, most of which are indirect taxes. In spite of having a fiscal capacity close to that of some developed countries (between 30-35% of GDP), the Brazilian tax system dates back to the 1960s and still has many characteristics of the tax systems of semi-industrialized countries. Direct taxes are highly progressive but account for a small share of the total tax revenue; indirect taxes correspond to the bulk of the load, but are regressive (Pintos-Payeras, 2010). We are not capable of assessing the effect on inequality of indirect taxes, such as those levied on fuel and energy, but in Table 2 we measure the effect of direct taxation, which in 2003 and 2009 amounted to approximately 10% and 11% of all incomes, after restitution of overpaid taxes.
The most important of the direct taxes are contributions to the pension system and income taxes. Individual contributions to pensions, in most cases, correspond to 11% of gross wages, or 11% of the amount of the pensions for the public sector exceeding the cap valid for the private sector. With regard to income taxes, only annual earnings above R$ 12,696 in 2003 (2005 PPP$ 9,671) and R$ 16,474 in 2009 (2005 PPP$ 8,938) were taxed, which actually meant the floor was lowered down 8% in real terms. In 2003 the highest marginal rate of 27.5% was applied to incomes twice as large as the lower threshold (above 2005 PPP $19,333), whereas in 2009 incomes twice the minimum were taxed at a new 22.5% marginal rate, and only incomes 2,6 times the lower tax threshold were subject to the 27.5% marginal rate. These values are net of a series of regressive exemptions, such as a certain level of payments for private education and private health insurance and treatments.
The relation between taxes and overall inequality depends on interrelated factors, such as the size and the composition of the tax base. For example, if the rich become richer, inequality can go up along
State%and%the%fall%in%inequality%in%Brazil%%
18%%
with the share of taxes in total income. The same can happen if the poor, among whom there is no tax collection, become poorer. Therefore it is not easy to anticipate precisely how changes in the level and the distribution of incomes will affect tributes and how changes in tributes may influence the overall distribution of incomes.
The fact is that in Brazil direct taxes lower inequality. They also became more progressive over time. In 2003 their contribution to the Gini coefficient was of -11%, thus reducing inequality; in 2009 became -14% (Table 2). This change caused 5% of the total fall in inequality observed in the period (Table 1). The variation in the contributions to pensions accounts for very little of the total fall; most changes occurred in direct taxes.
Most of this egalitarian trend in taxes is a consequence of the expansion of the tax base, not of changes to make the tax code more progressive. Taking inflation into account, the new tax brackets of 2009 increased the income tax revenue but changed very little its distribution among tax payers. The share effect of taxes responds for all of its positive contribution in the fall of inequality. This rise in the share of tributes derives from a higher incidence of taxation, as the proportion of the population in families paying direct taxes increased from 52% to 67 (Table 3), and from a reduction in the restitution in overpaid taxes (Table 1). The concentration effect, which is what better represents a system becoming more progressive, actually slowed down the fall, although with an impact of a little less than 1%. In other words, direct taxes helped to reduce inequality not because the State collected more taxes from the richest families but simply because it collected taxes from more persons and more taxes from each person.
As in OECD countries, taxation helps to reduce inequality. Its expansion supported the fall in inequality under analysis. Yet, unlike many OECD countries, there is no evidence that public work pulls inequality down in Brazil. Quite the opposite, the rise in public employment and salaries contributed to increase inequality between 2003 and 2009. The negative contribution of salaries in the public sector (-10%) was such that it was sufficient to almost offset the positive contribution of any State-related factor component considered separately, except social assistance.
In particular, the wage differential between workers of the public and the private sectors increased during the decade, hampering the decline in inequality. Back in the 1970s, wages in the public sector were on average 28% lower than those in the private sector and even after controlling for characteristics of workers the disadvantage in the public sector remained around 14% (Vergara, 1991). During the 1990s the two sectors were equalized and in the following decade wages in the public sector quickly became higher than those of the rest of the labor force (Marconi, 2003; Vaz & Hoffmann, 2007). Behind this increase were both a composition effect, mostly related to improvements in the qualification of the public sector labor force, and a segmentation effect, expressed in the form of wage differential in favor of public workers after controlling for characteristics in the two sectors.
In absolute terms public employment increased in Brazil during the 2000s, but as employment in the private sector also increased, the share of the population – including family members – benefited by incomes from work in the public sector remained about the same between 2003 and 2009 (Table 3). Wages in the public sector, however, increased, both in absolute and relative terms, inflating the public-private wage premium. This increase more than offset all the positive contribution of the social assistance programs Bolsa Familia or BPC taken separately.
The composition effect of wages in the public sector is important to explain total inequality in Brazil, and this importance has increased over time. In 2003 public sector wages contributed to 18% of the Gini coefficient, with net salaries contributing to 16% of it. In 2009 the contribution of net salaries increased slightly, 17%. The segmentation effect, by its turn, is more relevant to explain the dynamics of inequality. The relative increase in the salaries of workers in the public sector slowed down the decline in inequality with a negative contribution of -16%. Most of this contribution (-13% of the total fall) came
State%and%the%fall%in%inequality%in%Brazil%%
19%%
from the relative advantage (positive differential) public sector workers have over similar workers in the private sector.
Conclusions!
During the 2000s inequality in Brazil fell rapidly. In the 6 years between 2003 and 2009 the fall in the Gini coefficient of disposable per capita family income was of about 6%. The main determinant of this decline was the behavior in the remuneration of labor in the private sector. Earnings became less concentrated, which was sufficient to make inequality fall noticeably. Yet, the State also played an important role in the dynamics of inequality in the period, advancing the reduction in inequality. Almost one third of the decline in inequality was due to the evolution of direct income flows between the State and the families, which includes social security and social assistance transfers, wages paid to public sector workers, and direct taxes and mandatory contributions to the public pension system. Moreover, State-related incomes contributed 6% more per dollar to the decline than other incomes. The net effect of State direct transfers was egalitarian, but not all of these factor components helped to reduce inequality.
Social security and assistance were central to the fall of inequality. We estimated these contributions to be 20% for social assistance, 10% for pensions and 8% for different type of unemployment insurance incomes. Behind these contributions there is more than a simple expansion of social transfers: at the same time the shares of social assistance and pensions in total income increased, their concentration decreased. Actually, a rise in these social expenditures without an improvement in its distribution could have increased inequality, not lowered it. It must be highlighted that the positive contribution of incomes related to unemployment insurance is a consequence of the reduction of expenditures with this policy, as these incomes are regressive. It seems, at least in the case of Brazil, that the level of social expenditures is not sufficient to explain the trends in inequality. Without knowing the behavior of the concentration of these expenditures, little can be said about their effect on the dynamics of inequality.
Social policies with explicit egalitarian design had an immediate impact on inequality. The scaling up of targeted cash transfer programs, for example, contributed to reduce inequality more than any other State transfer, in spite of the almost negligible share of social assistance transfers in total incomes. The same can be said of expanding non-contributory and subsidized pensions, and of setting and systematically increasing a minimum floor for pensions linked to the national minimum wage; both helped to make pension incomes less concentrated over the decade.
Changes in tax rules apparently aimed at increasing revenue, but ended having inequality-reducing consequences. Taxes and mandatory contributions to pensions respond for about 5% of the fall in inequality between 2003 and 2009, with taxes accounting for most of the effect. What made taxes more egalitarian was an expansion of the bottom of the tax base – that is, more people paying more taxes – and not changes in marginal rates at the top incomes to make direct taxation even more progressive.
Notwithstanding, an increase in State regressive transfers slowed down the decline in inequality. Especially important for this were changes related to public employment. Rising salaries of public sector workers were inequality-increasing. In particular, the growth of the public-private wage differential favoring public employees (the relative wage premium) had such a negative effect on inequality that it was sufficient to offset the egalitarian consequences of changes in most State-related factor components, if each is considered separately.
In short, the State gave an important contribution to the fall in inequality observed in Brazil between 2003 and 2009. Most of this contribution results from the expansion of highly progressive
State%and%the%fall%in%inequality%in%Brazil%%
20%%
conditional and unconditional cash transfers, from changes in the composition of pensions that made them more progressive, or from higher levels of direct taxation, even at the cost of making direct taxes a little less progressive. However, the State acted in an ambiguous way. Some of its progressive measures were offset by regressive policies, particularly the wage policy for workers in the public sector. Needless to say, had it acted more progressively inequality could have fallen even more.
Taking into account issues that have been debated internationally, we can arrive at three general conclusions. First, that a simple growth in social expenditure will not necessarily bring inequality down and can, in point of fact, increase it. Second, that the level of inequality is inversely related to the level of direct taxes and contributions to pensions, thus the expansion of the tax base and the increase in marginal rates tend to bring inequality down. Third, that public work, as it is now, does not contribute to lower inequality, and consequently increases in public sector wages may be important for administrative reasons, but one should not expect it to be some form of egalitarian measure.
There are reasons to believe the substantive results of this analysis would be robust to changes in methods or sources of data. They were obtained using a dynamic decomposition of the Gini coefficient applied to data from two waves of an expenditure survey, POF 2002-3 and POF 2008-9. The use of another suitable inequality measure is likely to change the estimated values of factor components shares and contributions, and perhaps the order of importance to the decline in inequality of some factor components, but would hardly lead to different substantive conclusions. By looking at changes at concentration curves and taking changes in shares into account we come to an interpretation similar to that we arrive with the decomposition of a specific inequality measure. We also tested six different models to estimate the public-private wage differentials and the main conclusions hold the same in all of them. Finally, we repeated a longer yearly series (2001 to 2009) of static decompositions using a different household survey (PNAD) and, in spite of the fact that these surveys have no data on taxes and contributions to social security and poorer information on social assistance, arrived again at similar conclusions.
Our study is limited to a period within a decade, but we may risk some extrapolation for the years to come. The 2000s were a decade of recovery for Brazil, from both a stagnation during the 1980s and hyperinflation in the early 1990s. It was also a decade when social security and welfare policies instituted in the 1990s were fully implemented. Wages in the lower end of the distribution benefited much from this economic recovery and those who were not benefited by better wages found protection in pensions and assistance.
There are already signs that the decline in inequality in private sector wages is slowing down – systematic reductions in returns to schooling, for example – and that the expansion of social assistance will have less progressive effects – about a quarter of the entire population is already beneficiary of assistance policies. Pensions have also achieved high coverage and the pension floor, linked to the minimum wage, will hardly grow as fast as it did in an economy in recovery. Due to gradualism in the implementation of pension reforms, the control of the regressiveness of pensions for workers in the public sector will take more than a decade to be truly relevant to inequality. Most low hanging fruits were already picked and it is probable that Brazil slowly enters a new phase, in which the reduction of inequality will depend more on structural changes in the labor market and on the progressiveness of the tax system. If inequality keeps falling, it will hardly fall as fast as it did in the 2000s.
Finally, there are some limitations in this study which deserve mentioning. First, the period covered is of less than a decade; our conclusions refer to an event – the recent decline in inequality – and not to the long term dynamics of inequality. Second, by using survey data we most probably lost information on the top incomes, that is, the richest families; the data collection instruments and techniques used by the two rounds of the survey are of excellent quality, and POF is probably the best available source of information in capital incomes in Brazil, but a sample survey is likely to miss high
State%and%the%fall%in%inequality%in%Brazil%%
21%%
incomes. The real levels of inequality in Brazil can be higher than we estimate and some aspects of the dynamics of inequality may have been missed. Third, taxes in our study refer only to direct taxes; although direct taxes are of particular interest in a study of family income inequality, they are a minor share of total taxation in the country and given that the a good share of remaining taxes is of value added taxes, which are often neutral or regressive, taxation as a whole can actually contribute to increase inequality. A similar line of thought can be applied to indirect transfers, such as production subsidies, which are probably very regressive; if so, the State may contribute much more to inequality and its dynamics than we have estimated.
References!%
Atkinson, A. B. (2003). Income Inequality in OECD Countries: Data and Explanations. CESifo Economic
Studies, 49(4), 479–513. doi:10.1093/cesifo/49.4.479
Barros, R. P. de, Carvalho, M., & Franco, S. (2007). O papel das transferências públicas na queda recente
da desigualdade de renda brasileira. In R. P. de Barros, M. N. Foguel, & G. Ulyssea (Eds.),
Desigualdade De Renda No Brasil: Uma Análise Da Queda Recente (Vols. 1-2, Vol. 2). Brasília:
Ipea.
Barros, R. P. de, Carvalho, M., Franco, S., & Mendonça, R. (2007). Determinantes Imediatos da Queda
da Desigualdade de Renda Brasileira. In R. P. de Barros, M. N. Foguel, & G. Ulyssea (Eds.),
Desigualdade De Renda No Brasil: Uma Análise Da Queda Recente (Vols. 1-2, Vol. 2). Brasília:
Ipea.
Blau, F. D., & Kahn, L. M. (1996). International Differences in Male Wage Inequality: Institutions versus
Market Forces (Working Paper No. 4678). National Bureau of Economic Research. Retrieved
from http://www.nber.org/papers/w4678
Brown, R. L., & Prus, S. G. (2006). Income Inequality over the Later-Life Course: a Comparative
Analysis of Seven OECD Countries. Annals of Actuarial Science, 1(02), 307–317.
doi:10.1017/S1748499500000178
Caminada, K., & Goudswaard, K. (2001). International Trends in Income Inequality and Social Policy.
International Tax and Public Finance, 8(4), 395–415. doi:10.1023/A:1011262706412
State%and%the%fall%in%inequality%in%Brazil%%
22%%
Chen, C.-N., Tsaur, T.-W., & Rhai, T.-S. (1982). The Gini Coefficient and Negative Income. Oxford
Economic Papers, 34(3), 473–478.
Esquivel, G. (2011). The Dynamics of Income Inequality in Mexico since NAFTA. Economía, 12(1),
155–179.
Ferreira, C. R. (2006). Aposentadorias e distribuição da renda no Brasil: uma nota sobre o período 1981 a
2001. Revista Brasileira de Economia, 60(3), 247–260. doi:10.1590/S0034-71402006000300003
Gasparini, L., Cruces, G., & Tornarolli, L. (2011). Recent trends in income inequality in latin america.
Economía, 11(2), 147–190.
Gasparini, L., & Lustig, N. C. (2011). The rise and fall of income inequality in Latin America. In J. A.
Ocampo & J. Ros (Eds.), The Oxford Handbook of Latin American Economics (pp. 691 – 714).
Oxford University Press.
Goñi, E., López, J. H., & Servén, L. (2008). Fiscal Redistribution and Income Inequality in Latin
America.
Gottschalk, P., & Smeeding, T. M. (1997). Cross-National Comparisons of Earnings and Income
Inequality. Journal of Economic Literature, 35(2), 633–687.
Gustafsson, B., & Johansson, M. (1999). In Search of Smoking Guns: What Makes Income Inequality
Vary over Time in Different Countries? American Sociological Review, 64(4), 585–605.
doi:10.2307/2657258
Hoffmann, R. (2003). Inequality in Brazil: the contribution of pensions. Revista Brasileira de Economia,
57(4), 755–773.
Hoffmann, Rodolfo. (2006). Transferências de renda ea redução da desigualdade no Brasil e cinco regiões
entre 1997 e 2004. Econômica, 8(1), 55–81.
Hoffmann, Rodolfo. (2013). How to measure the progressivity of an income component. Applied
Economics Letters, 20(4), 328–331.
Juhn, C., Murphy, K. M., & Pierce, B. (1993). Wage inequality and the rise in returns to skill. Journal of
political Economy, 101(3), 410–442.
State%and%the%fall%in%inequality%in%Brazil%%
23%%
Kakwani, N. C. (1977). Measurement of Tax Progressivity: An International Comparison. The Economic
Journal, 87(345), 71–80. doi:10.2307/2231833
Korpi, W., & Palme, J. (1998). The Paradox of Redistribution and Strategies of Equality: Welfare State
Institutions, Inequality, and Poverty in the Western Countries. American Sociological Review,
63(5), 661–687. doi:10.2307/2657333
Lavado, P. (2007). Desigualdad en los programas sociales en el Perú. Diagnóstico y Propuesta, (34).
López-Calva, L. F., & Lustig, N. (2010). Explaining the decline in inequality in Latin America:
technological change, educational upgrading, and democracy. In L. F. López-Calva & N. Lustig
(Eds.), Declining Inequality in Latin America: a Decade of Progress? (p. 253). Baltimore, EUA:
Brookings Institution Press, United Nations Development Programme.
Mahler, V. A., & Jesuit, D. K. (2006). Fiscal redistribution in the developed countries: new insights from
the Luxembourg Income Study. Socio-Economic Review, 4(3), 483–511. doi:10.1093/ser/mwl003
Marconi, N. (2003). A evolução do perfil da força de trabalho e das remunerações nos setores público e
privado ao longo da década de 1990. Revista do Serviço Público, 54(1), 9–45.
Mesa-Lago, C. (1978). Social Security in Latin America: pressure groups, stratification, and inequality.
University of Pittsburgh Press.
Milanović, B. (1994). Determinants of Cross-country Income Inequality: An “augmented” Kuznets’
Hypothesis. Washington, D.C.: World Bank Publications.
Moene, K. O., & Wallerstein, M. (2001). Inequality, Social Insurance, and Redistribution. The American
Political Science Review, 95(4), 859–874. doi:10.2307/3117718
Odedokun, M. o., & Round, J. I. (2004). Determinants of Income Inequality and its Effects on Economic
Growth: Evidence from African Countries. African Development Review, 16(2), 287–327.
doi:10.1111/j.1017-6772.2004.00093.x
Palme, J. (2006). Welfare states and inequality: Institutional designs and distributive outcome. Research
in Social Stratification and Mobility, 24(4), 387–403. doi:10.1016/j.rssm.2006.10.004
State%and%the%fall%in%inequality%in%Brazil%%
24%%
Pedraza, P. de, Llorente, R. M. de B., & Rivas, L. A. (2009). Ageing Population and Spanish Pension
System Reforms: Effects on Average Pensions and Inequality Among Pensioners. Economical
Analysis Working Papers, 8(7), 1–.
Pintos-Payeras, J. A. (2010). Análise da progressividade da carga tributária sobre a população brasileira.
Pesquisa e Planejamento Econômico, 40(2).
Pyatt, G., Chen, C., & Fei, J. (1980). The Distribution of Income by Factor Components. The Quarterly
Journal of Economics, 95(3), 451–473. doi:10.2307/1885088
Rao, V. M. (1969). Two Decompositions of Concentration Ratio. Journal of the Royal Statistical Society.
Series A (General), 132(3), 418–425. doi:10.2307/2344120
Roine, J., Vlachos, J., & Waldenström, D. (2009). The long-run determinants of inequality: What can we
learn from top income data? Journal of Public Economics, 93(7–8), 974–988.
doi:10.1016/j.jpubeco.2009.04.003
Smeeding, T. M. (2005). Public Policy, Economic Inequality, and Poverty: The United States in
Comparative Perspective. Social Science Quarterly, 86, 955–983. doi:10.1111/j.0038-
4941.2005.00331.x
Soares, S. (2006). Análise de bem-estar e decomposição por fatores da queda na desigualdade entre 1995
e 2004. Econômica, 8(1), 83–115.
Soares, S., Osorio, R. G., Soares, F. V., Medeiros, M., & Zepeda, E. (2009). Conditional Cash Transfers
in Brazil, Chile and Mexico: Impacts upon Inequality. Estudios Económicos, n. ex, 207–224.
Stack, S. (1978). The Effect of Direct Government Involvement in the Economy on the Degree of Income
Inequality: A Cross-National Study. American Sociological Review, 43(6), 880–888.
doi:10.2307/2094627
Székely, M., & Hilgert, M. (2011). What Drives Differences in Inequality Across Countries? (SSRN
Scholarly Paper No. ID 1817238). Rochester, NY: Social Science Research Network. Retrieved
from http://papers.ssrn.com/abstract=1817238
State%and%the%fall%in%inequality%in%Brazil%%
25%%
Vaz, D. V., & Hoffmann, R. (2007). Remuneração nos serviços no Brasil: o contraste entre funcionários
públicos e privados. Economia e Sociedade, 16, 199–232.
Vergara, D. H. (1991). Diferenciais de salários entre os setores publico e privado da economia brasileira.
Ensaios FEE, 12(1), 73–8S.
Wallerstein, M. (1999). Wage-Setting Institutions and Pay Inequality in Advanced Industrial Societies.
American Journal of Political Science, 43(3), 649–680. doi:10.2307/2991830
Wang, C., Caminada, K., & Goudswaard, K. (2012). The redistributive effect of social transfer
programmes and taxes: A decomposition across countries. International Social Security Review,
65(3), 27–48. doi:10.1111/j.1468-246X.2012.01435.x