economic value of the nutrient retention function of restored floodplain wetlands in the elbe river...
TRANSCRIPT
Ecological Economics 83 (2012) 108–117
Contents lists available at SciVerse ScienceDirect
Ecological Economics
j ourna l homepage: www.e lsev ie r .com/ locate /eco lecon
Analysis
Economic value of the nutrient retention function of restored floodplain wetlands inthe Elbe River basin
Malte GrossmannTechnische Universität Berlin, Institute of Landscape- and Environmental Planning, EB 4-2, Straße des 17 Juni 145, 10623 Berlin, Germany
E-mail address: [email protected].
0921-8009/$ – see front matter © 2012 Published by Eldoi:10.1016/j.ecolecon.2012.03.008
a b s t r a c t
a r t i c l e i n f oArticle history:Received 23 November 2010Received in revised form 16 March 2012Accepted 19 March 2012Available online 15 October 2012
Keywords:Ecosystem servicesEconomic valuationFloodplain wetlandsCost minimisation modelNutrient management
This paper presents an application of an indirect method, the alternative or replacement cost method to valuea regulatory ecosystem service: the retention of river nutrient loads by floodplain wetlands. The paper pre-sents a cost-minimisation model for nutrient abatement measures for the River Elbe. The model is appliedto estimate the shadow price of phosphate and nitrogen nutrient retention services by restored floodplains.It is shown that the shadow price of restored floodplain area is a function of the nutrient load reduction targetfor the river basin. The scope of the floodplain restoration projects is shown to have a lesser impact on theestimated shadow price.In addition, this paper presents an empirical cost function for the costs of floodplain restoration measures inthe Elbe Basin. In conjunction with the shadow prices, this allows for a rapid strategic assessment of the costsand benefits of 45 potential restoration sites along the Elbe trajectory. In spite of the large investment costsfor dike realignments, the nutrient retention effects alone may in many cases generate sufficient benefits togenerate an economic efficiency gain. Floodplain restoration may therefore, under advantageous circum-stances, constitute a cost effective nutrient abatement measure. However the key thrust of the argument isthat floodplain restoration projects have to be assessed as multifunctional projects, with the positive impactson water quality being one of several benefit dimensions.
© 2012 Published by Elsevier B.V.
1. Introduction
This paper addresses the issue of valuation of the nutrient reten-tion function associated with a restoration of floodplain wetlands.The retention of nutrients is one of the many ecosystem services pro-vided by floodplain wetlands subject to regular inundation. Throughecosystem processes such as denitrification and sedimentation nutri-ents are removed from the river water. The removal of nutrients con-tributes to the provision of clean water that in turn has social benefits,for example in terms of enhanced recreational benefits. However,many rivers have been disconnected from their historic floodplainsby dikes and the floodplains no longer contribute to nutrient reten-tion. The recognition of the potentially large benefits associatedwith the provision of ecosystem services by active floodplains has inmany countries led to a revision of floodplain management policies:away from a historical focus on gaining and securing agriculturalland through the construction of dikes and towards a gradual processof floodplain restoration, for example by dike realignments.
The concept of ecosystem services has become an importantmodel to systematically link functions of ecosystems to human wel-fare. It is an important concept for the valuation of negative and pos-itive external environmental effects associated with changes of land
sevier B.V.
use in floodplains (Turner et al., 2008). It is well acknowledged inthe environmental economics literature that the public goods charac-teristic of many ecosystem services has traditionally caused manyecosystem services to be undervalued in the assessment of floodplainmanagement options. Sectoral appraisal of floodplain restorationmeasures, for example in cost effectiveness analysis of the flood riskreduction or nutrient abatement potential, tends to omit the co-benefits from multiple ecosystem services. This is largely due to a lackof information on the value of such benefits. As a result neither floodrisk nor nutrient management plans tend to consider floodplain resto-ration as economically advantageous options, because the unit costs ofrestoration are generally high and the benefits with regard to a singletarget dimension are comparatively low. However, both full cost benefitanalysis and correctly specified cost-effectiveness analysis of floodplainrestoration measures need to take co-benefits into account (Engelenet al., 2008). Both types of analysis require information on the valueof ecosystem service benefits provided by floodplains. This paper ad-dresses the valuation of one such benefit: nutrient retention.
The evidence regarding the contribution of floodplain wetlands tonutrient retention is limited but field studies of sedimentation anddenitrification on floodplains indicate considerable potential reten-tion of nitrogen and phosphorous. To assess the importance of sedi-ment deposition and denitrification in floodplains for nutrientretention, annual nutrient fluxes out of the river water by these pro-cesses have to be compared with the annual loads of nutrients that
109M. Grossmann / Ecological Economics 83 (2012) 108–117
are transported in the river. In a study for the lower Rhine, van derLee et al. (2004) scaled up the results from measurements on inun-dated floodplain sites to the entire river stretches of the Waal andthe Ijssel and compared the resultant fluxes with annual nutrientloads in the river. They concluded that N-retention was low (lessthan 3% of annual load), whereas P-retention was significant (5–18%of annual load in Waal and Ijssel). Walling and Owens (2003) calcu-late annual conveyance losses from overbank events for total phos-phorous in floodplains bordering the main channel of the riversSwale and Aire as 14 and 9%. Other authors have compared nutrientloads and fluxes not on an annual, but on an event basis. For exampleEngelhardt et al. (1999) report retention of 50% of particulate P and16% of total N load during flood events for controlled polders on theOdra River. Kronvang et al. (2007) estimate a storage efficiency fortotal phosphorous during overbank events of 4–7% for the RiverGjern. Brunet and Brian Astin (1998) report retention rates of partic-ulate P during flood events of 26–28% on the River Adour.
Several authors have attempted to estimate the economic value ofthe nutrient retention ecosystem services of restored floodplain wet-lands. All of these studies use the replacement or alternative costmethod, whereby the value of the retention capacity is estimatedfrom the savings of abatement costs from alternative measures toachieve nutrient reduction targets for the basin. The most commonalternative measures are either some form of improved waste watertreatment or measures to reduce nutrient emissions from agriculturalproduction. The replacement value is based on estimates of the mar-ginal abatement costs of these measures that are generated eitherwith micro-engineering approaches (Gren et al., 1995 for the DanubeRiver floodplains, Dubgaard et al., 2005 for Skjern River, Meyerhoffand Dehnhardt, 2007 for the Elbe River) or with cost minimisationmodels (Jenkins et al., 2010 for the Mississippi River).
Several other studies based on spatial cost minimisation modelshave attempted to quantify the possible costs savings from includingwetland restoration in programmes of measures to reduce nutrientloads. Such programmes to date often focus on measures that reduceemissions, like improved waste water treatment, and less on measuresthat improve nutrient retention. For example Byström (2000) andRibaudo et al. (2001) use abatement cost models to investigate the sav-ings in total abatement costs that aremade possible by investing inwet-land construction or restoration projects. Other major abatement costmodel studies in the European context, such as Gren et al. (1997) orSchou et al. (2006) for the Baltic Sea drainage basin, Lise and van derVeeren (2002) or van der Veeren and Tol (2001) for the Rhine includewetlandmeasures as cost effective abatement options. All of these stud-ies argue that wetland construction and restoration, depending on thecontextual conditions, can be a cost effective abatement measure andthat there are opportunity costs associated with omitting wetland res-toration from the catalogue of abatement options.
The present paper attempts to value the benefit of the nutrient re-tention ecosystem services that are reactivated in the course of wetlandrestoration. In the first step, we present a novel cost minimisationmodel for nutrient abatement measures for the River Elbe. We applythemodel to generate estimates of the value or shadow price of the nu-trient retention services provided by floodplain restoration. None of theprevious cost minimisation approaches have addressed floodplain res-toration, but have focused on constructed or pond like wetlands(cf. Byström, 2000). We consider not only nitrogen but also phospho-rous retention.
In the second step, using the estimated shadow prices, we con-duct a strategic cost–benefit analysis to assess floodplain restorationalong the Elbe River. In order to be able to carry out this assessment,this paper also presents an empirical cost function that can be usedto estimate the costs of floodplain restoration in the Elbe Basin.Such functions have been presented for constructed wetlands, forexample, by Söderqvist (2002) or Byström (1998) but not for flood-plain restoration.
The rest of the paper is organised as follows: after an introductionto the study site, we present the methodological approach. The focusis on the replacement cost method, the cost-minimisation modellingapproach, the method to estimate the nutrient retention capacityand the empirical estimate of the costs of floodplain restoration mea-sures. We proceed to present selected results for the shadow price ofthe nutrient retention capacity of restored floodplains and close witha discussion of the implications for the cost–benefit analysis of wet-land restoration and the valuation of ecosystem services.
2. Study Area and Management Scenarios
The German part of Elbe River catchment covers an area of97,175 km2 and has 18.5 million inhabitants. The Elbe River has char-acteristics of a lowland river with a wide alluvial valley downstreamof Dresden. Approximately 84% of the floodplains along this riverstretch are protected by dikes. The loss of active floodplains in theUpper and Middle Elbe differs according to the width of the alluvialvalley. The narrow valley of the southern section generally haslower losses of active floodplain. After entry to the wider lowland val-ley, 50–90% of the floodplains have been diked (Brunotte et al., 2009).
Despite these large reductions in active floodplain area, the Elbestill has a very long free flowing river stretch. The designation oflarge parts of the remaining active floodplains as a UNESCO BiosphereReserve and of other categories of protected areas highlights the im-portance these habitats have been accorded for habitat and biodiver-sity protection in Germany. An early analysis of potential dikerelocation sites for large scale conservation programmes was con-ducted by Neuschulz and Purps (2000). The public debate on dike re-alignments gained momentum in the aftermath of the major flood onthe Elbe in 2002. The International Commission for the Protection ofthe Elbe commissioned an action plan (IKSE, 2004), whose purposewas to develop a comprehensive flood risk management strategy forthe river. The proposed measures include amongst others, reactiva-tion of the retention capacity along the river floodplains and recon-struction of dikes to the desired safety standard. Several federalstate governments have since commissioned detailed studies to eval-uate potential sites for dike relocations and retention polders. Thenumber, exact location, area and retention volume of potential sitesare the subject of public debate and constant review.
The Ministry of Environment (BMU) and the Federal Agency forNature Protection (BfN) actively promote the concept of an integrat-ed approach to the management and development of floodplains(BMU/BfN, 2009). Such an approach seeks to harness multiple bene-fits for flood protection, water resource management, nature and bio-diversity conservation and climate change mitigation. The strategy isbased on the three principles of strict protection of remaining naturalfloodplain habitats, restoration of modified floodplains in agriculturaluse that are still subject to regular flooding and increased efforts toregain historic floodplains by dike realignments where feasible.
Nutrient management goals for the Elbe River Basin are set outunder the management plan developed in compliance with the EUWater Framework Directive (FGG Elbe, 2009). The reduction targetsare deemed necessary to comply with the general target of achievinga good ecological status of the river and coastal seas. The currentgoal is to reduce both phosphorous and nitrogen load to the sea by24% by the year 2027. This is to be achieved in a stepwise approach,with a third of the commitment to be achieved over three reportingperiods ending 2014, 2021, and 2027. The Federal Agency for NatureConservation (BfN) has commissioned studies to explore potentialoverlaps and synergies of conservation oriented floodplain manage-ment with water resource management as mandated by the Europe-an Union Water Framework Directive (cf. Korn et al., 2006). Whilstriver management plans have taken up the issue of restoration ofriver morphology including the restoration of the natural flood-plains on minor rivers, major floodplain restorations on the main
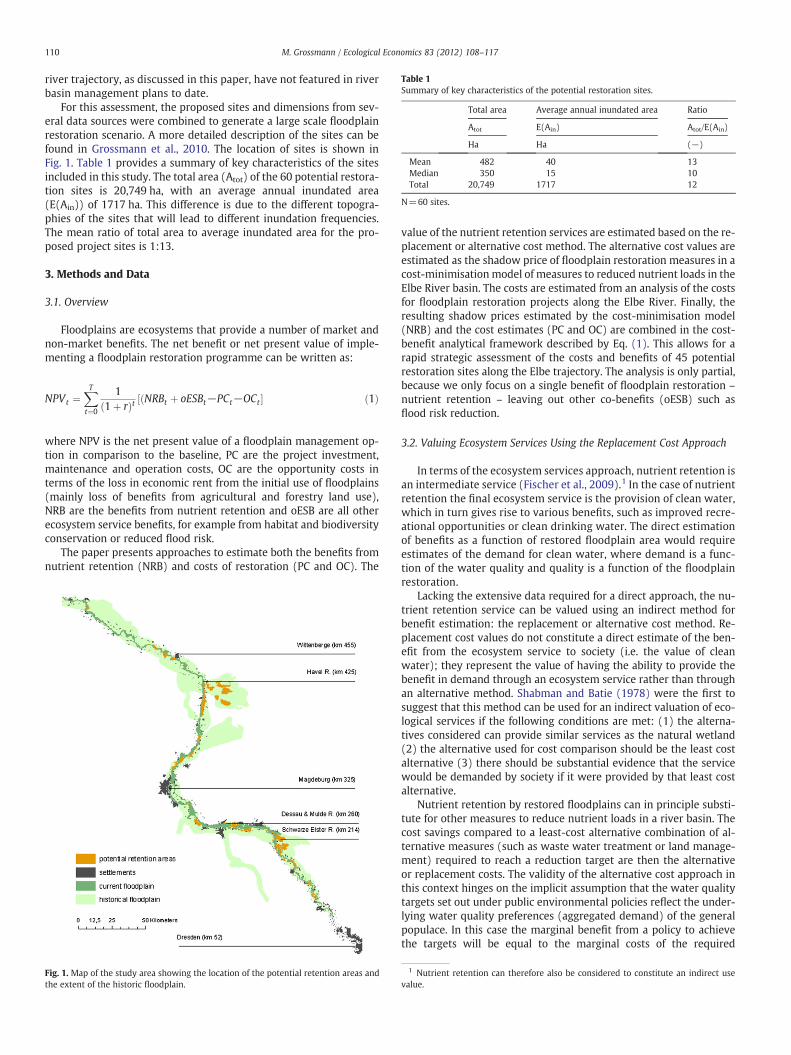
Table 1Summary of key characteristics of the potential restoration sites.
Total area Average annual inundated area Ratio
Atot E(Ain) Atot/E(Ain)
Ha Ha (−)
Mean 482 40 13Median 350 15 10Total 20,749 1717 12
N=60 sites.
110 M. Grossmann / Ecological Economics 83 (2012) 108–117
river trajectory, as discussed in this paper, have not featured in riverbasin management plans to date.
For this assessment, the proposed sites and dimensions from sev-eral data sources were combined to generate a large scale floodplainrestoration scenario. A more detailed description of the sites can befound in Grossmann et al., 2010. The location of sites is shown inFig. 1. Table 1 provides a summary of key characteristics of the sitesincluded in this study. The total area (Atot) of the 60 potential restora-tion sites is 20,749 ha, with an average annual inundated area(E(Ain)) of 1717 ha. This difference is due to the different topogra-phies of the sites that will lead to different inundation frequencies.The mean ratio of total area to average inundated area for the pro-posed project sites is 1:13.
3. Methods and Data
3.1. Overview
Floodplains are ecosystems that provide a number of market andnon-market benefits. The net benefit or net present value of imple-menting a floodplain restoration programme can be written as:
NPVt ¼XTt¼0
11þ rð Þt NRBt þ oESBt−PCt−OCtð �½ ð1Þ
where NPV is the net present value of a floodplain management op-tion in comparison to the baseline, PC are the project investment,maintenance and operation costs, OC are the opportunity costs interms of the loss in economic rent from the initial use of floodplains(mainly loss of benefits from agricultural and forestry land use),NRB are the benefits from nutrient retention and oESB are all otherecosystem service benefits, for example from habitat and biodiversityconservation or reduced flood risk.
The paper presents approaches to estimate both the benefits fromnutrient retention (NRB) and costs of restoration (PC and OC). The
Fig. 1. Map of the study area showing the location of the potential retention areas andthe extent of the historic floodplain.
value of the nutrient retention services are estimated based on the re-placement or alternative cost method. The alternative cost values areestimated as the shadow price of floodplain restoration measures in acost-minimisation model of measures to reduced nutrient loads in theElbe River basin. The costs are estimated from an analysis of the costsfor floodplain restoration projects along the Elbe River. Finally, theresulting shadow prices estimated by the cost-minimisation model(NRB) and the cost estimates (PC and OC) are combined in the cost-benefit analytical framework described by Eq. (1). This allows for arapid strategic assessment of the costs and benefits of 45 potentialrestoration sites along the Elbe trajectory. The analysis is only partial,because we only focus on a single benefit of floodplain restoration –
nutrient retention – leaving out other co-benefits (oESB) such asflood risk reduction.
3.2. Valuing Ecosystem Services Using the Replacement Cost Approach
In terms of the ecosystem services approach, nutrient retention isan intermediate service (Fischer et al., 2009).1 In the case of nutrientretention the final ecosystem service is the provision of clean water,which in turn gives rise to various benefits, such as improved recre-ational opportunities or clean drinking water. The direct estimationof benefits as a function of restored floodplain area would requireestimates of the demand for clean water, where demand is a func-tion of the water quality and quality is a function of the floodplainrestoration.
Lacking the extensive data required for a direct approach, the nu-trient retention service can be valued using an indirect method forbenefit estimation: the replacement or alternative cost method. Re-placement cost values do not constitute a direct estimate of the ben-efit from the ecosystem service to society (i.e. the value of cleanwater); they represent the value of having the ability to provide thebenefit in demand through an ecosystem service rather than throughan alternative method. Shabman and Batie (1978) were the first tosuggest that this method can be used for an indirect valuation of eco-logical services if the following conditions are met: (1) the alterna-tives considered can provide similar services as the natural wetland(2) the alternative used for cost comparison should be the least costalternative (3) there should be substantial evidence that the servicewould be demanded by society if it were provided by that least costalternative.
Nutrient retention by restored floodplains can in principle substi-tute for other measures to reduce nutrient loads in a river basin. Thecost savings compared to a least-cost alternative combination of al-ternative measures (such as waste water treatment or land manage-ment) required to reach a reduction target are then the alternativeor replacement costs. The validity of the alternative cost approach inthis context hinges on the implicit assumption that the water qualitytargets set out under public environmental policies reflect the under-lying water quality preferences (aggregated demand) of the generalpopulace. In this case the marginal benefit from a policy to achievethe targets will be equal to the marginal costs of the required
1 Nutrient retention can therefore also be considered to constitute an indirect usevalue.
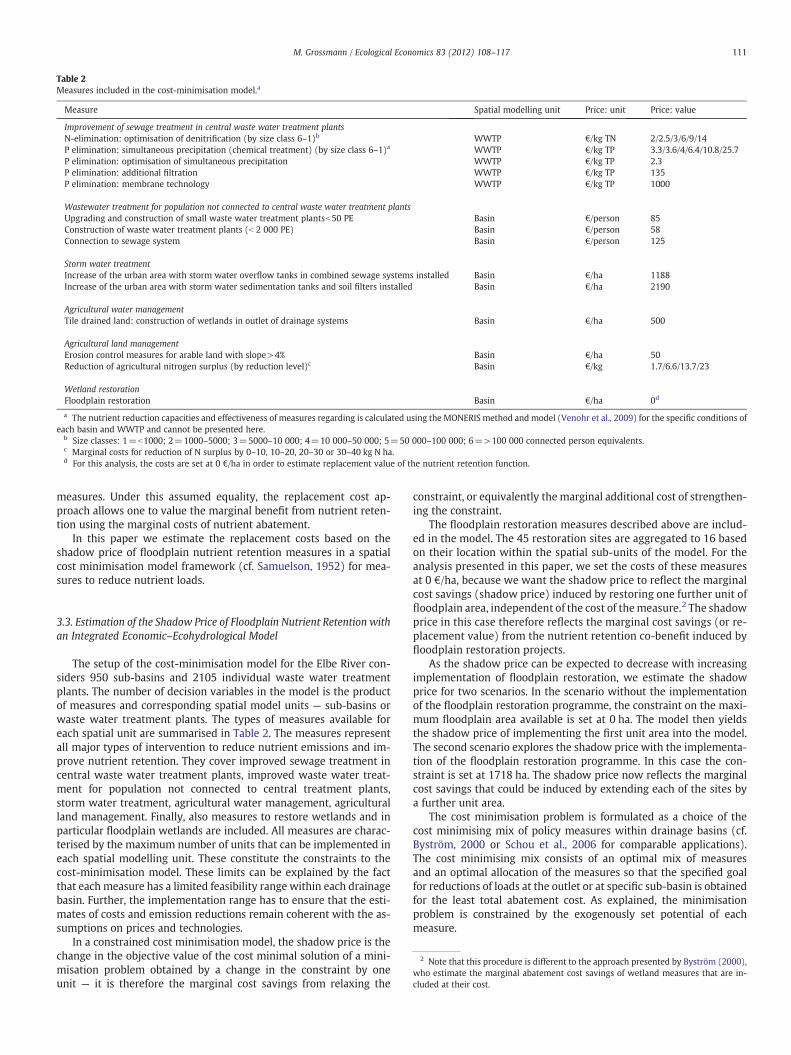
Table 2Measures included in the cost-minimisation model.a
Measure Spatial modelling unit Price: unit Price: value
Improvement of sewage treatment in central waste water treatment plantsN-elimination: optimisation of denitrification (by size class 6–1)b WWTP €/kg TN 2/2.5/3/6/9/14P elimination: simultaneous precipitation (chemical treatment) (by size class 6–1)a WWTP €/kg TP 3.3/3.6/4/6.4/10.8/25.7P elimination: optimisation of simultaneous precipitation WWTP €/kg TP 2.3P elimination: additional filtration WWTP €/kg TP 135P elimination: membrane technology WWTP €/kg TP 1000
Wastewater treatment for population not connected to central waste water treatment plantsUpgrading and construction of small waste water treatment plantsb50 PE Basin €/person 85Construction of waste water treatment plants (b 2 000 PE) Basin €/person 58Connection to sewage system Basin €/person 125
Storm water treatmentIncrease of the urban area with storm water overflow tanks in combined sewage systems installed Basin €/ha 1188Increase of the urban area with storm water sedimentation tanks and soil filters installed Basin €/ha 2190
Agricultural water managementTile drained land: construction of wetlands in outlet of drainage systems Basin €/ha 500
Agricultural land managementErosion control measures for arable land with slope>4% Basin €/ha 50Reduction of agricultural nitrogen surplus (by reduction level)c Basin €/kg 1.7/6.6/13.7/23
Wetland restorationFloodplain restoration Basin €/ha 0d
a The nutrient reduction capacities and effectiveness of measures regarding is calculated using the MONERIS method and model (Venohr et al., 2009) for the specific conditions ofeach basin and WWTP and cannot be presented here.
b Size classes: 1=b1000; 2=1000–5000; 3=5000–10 000; 4=10 000–50 000; 5=50 000–100 000; 6=>100 000 connected person equivalents.c Marginal costs for reduction of N surplus by 0–10, 10–20, 20–30 or 30–40 kg N ha.d For this analysis, the costs are set at 0 €/ha in order to estimate replacement value of the nutrient retention function.
111M. Grossmann / Ecological Economics 83 (2012) 108–117
measures. Under this assumed equality, the replacement cost ap-proach allows one to value the marginal benefit from nutrient reten-tion using the marginal costs of nutrient abatement.
In this paper we estimate the replacement costs based on theshadow price of floodplain nutrient retention measures in a spatialcost minimisation model framework (cf. Samuelson, 1952) for mea-sures to reduce nutrient loads.
2 Note that this procedure is different to the approach presented by Byström (2000),who estimate the marginal abatement cost savings of wetland measures that are in-cluded at their cost.
3.3. Estimation of the Shadow Price of Floodplain Nutrient Retention withan Integrated Economic–Ecohydrological Model
The setup of the cost-minimisation model for the Elbe River con-siders 950 sub-basins and 2105 individual waste water treatmentplants. The number of decision variables in the model is the productof measures and corresponding spatial model units — sub-basins orwaste water treatment plants. The types of measures available foreach spatial unit are summarised in Table 2. The measures representall major types of intervention to reduce nutrient emissions and im-prove nutrient retention. They cover improved sewage treatment incentral waste water treatment plants, improved waste water treat-ment for population not connected to central treatment plants,storm water treatment, agricultural water management, agriculturalland management. Finally, also measures to restore wetlands and inparticular floodplain wetlands are included. All measures are charac-terised by the maximum number of units that can be implemented ineach spatial modelling unit. These constitute the constraints to thecost-minimisation model. These limits can be explained by the factthat each measure has a limited feasibility range within each drainagebasin. Further, the implementation range has to ensure that the esti-mates of costs and emission reductions remain coherent with the as-sumptions on prices and technologies.
In a constrained cost minimisation model, the shadow price is thechange in the objective value of the cost minimal solution of a mini-misation problem obtained by a change in the constraint by oneunit — it is therefore the marginal cost savings from relaxing the
constraint, or equivalently the marginal additional cost of strengthen-ing the constraint.
The floodplain restoration measures described above are includ-ed in the model. The 45 restoration sites are aggregated to 16 basedon their location within the spatial sub-units of the model. For theanalysis presented in this paper, we set the costs of these measuresat 0 €/ha, because we want the shadow price to reflect the marginalcost savings (shadow price) induced by restoring one further unit offloodplain area, independent of the cost of themeasure.2 The shadowprice in this case therefore reflects the marginal cost savings (or re-placement value) from the nutrient retention co-benefit induced byfloodplain restoration projects.
As the shadow price can be expected to decrease with increasingimplementation of floodplain restoration, we estimate the shadowprice for two scenarios. In the scenario without the implementationof the floodplain restoration programme, the constraint on the maxi-mum floodplain area available is set at 0 ha. The model then yieldsthe shadow price of implementing the first unit area into the model.The second scenario explores the shadow price with the implementa-tion of the floodplain restoration programme. In this case the con-straint is set at 1718 ha. The shadow price now reflects the marginalcost savings that could be induced by extending each of the sites bya further unit area.
The cost minimisation problem is formulated as a choice of thecost minimising mix of policy measures within drainage basins (cf.Byström, 2000 or Schou et al., 2006 for comparable applications).The cost minimising mix consists of an optimal mix of measuresand an optimal allocation of the measures so that the specified goalfor reductions of loads at the outlet or at specific sub-basin is obtainedfor the least total abatement cost. As explained, the minimisationproblem is constrained by the exogenously set potential of eachmeasure.
112 M. Grossmann / Ecological Economics 83 (2012) 108–117
The cost minimisation problem is described by:
minxi;m
∑i∑m
ci;m xi;m� �
ð2Þ
s.t.
∑i∑m
qp xi;m� �
Ωi;s ¼ TRs;p ð3Þ
xi;m≤x0i;m ð4Þ
where indexes denote
i spatial model units (sub-basins and waste water treatmentplants)
m type of measurep pollutant/nutrient (phosphorous and nitrogen)s location for nutrient reduction goals (river outlet, upstream
location)and
x is the implementation level of a measurec is a function describing the total costs of implementing a
measureq is a function describing the reduction of nutrients emitted
by implementing a measureΩi;s;p is the retention coefficient describing the share of nutrient
p emitted from a basin i reaching the seaTR is the targeted load reductionx0 is the upper limit to the possible implementation level of a
measure in a basin
In the model, the functions q is linear in x saying that there is apositive linear relationship between the extent of a measure in abasin and the reduction of nutrient loads reaching the sea. There-fore the first derivate for q exists and is continuous. For a solutionto the problem the necessary conditions for optimality are theKuhn–Tucker conditions that are given in Eqs. (5)–(9). To obtainoptimal solutions the general micro-economic theory on cost func-tions is applied, whereby all separate cost functions are convexand total abatement costs (objective function) are quasi-convex.The first order conditions for cost minimisation can then be writ-ten as:
∂Ci;m xi;m�� �
∂xi;m−∑
s;pμs;p⋅Ωi;s;p⋅
∂qp xi;m�� �
∂xi;m
0@
1A−λi;m ¼ 0 ð5Þ
∑i∑m
qp xi;m�� �
Ωi;s;p ¼ TRs;p ð6Þ
xi;m �≤x0i;m ð7Þ
λi;m xi;m�� �
¼ 0 ð8Þ
λi;m≥0 ð9Þ
The condition in Eq. (5) ensures optimality and Eqs. (6) and (7)are feasibility conditions, Eq. (8) is the complementary slacknesscondition and Eq. (9) is a non-negativity condition. According toeconomic theory, the Lagrange multiplier μs can then be interpretedas the marginal cost of increasing the nutrient reduction target byone unit and the Lagrange multiplier λi;m as the shadow price ofthe constraints on the capacities of each of the measures. The La-grangian multiplier λi;m for the floodplain restoration measure
(m=floodplain restoration) and for each of the 16 aggregatedsites (i) can therefore be interpreted as the shadow price of an addi-tional unit of floodplain area, which is identical to the marginalchange in total abatement costs induced by a marginal change infloodplain area.
The model is implemented using GAMS and is solved using thesolver CONOPT. The data for the model parameterisation, specificallythe river retention coefficients (Ωi;s), the upper limit to the possibleimplementation level of a measure in a basin (x0), the reduction ofnutrients emitted by implementing a measure and the costs forimplementing a measure are directly extracted and imported froman existing simulation model for the Elbe River. This model system(MONERIS — Modelling Nutrient Emissions in River Systems) andits applications are described in detail in Behrendt et al. (2002),Behrendt and Dannowski (2005) and Venohr et al. (2011). Themodel has been widely used to estimate nutrient emissions, nutrientretention in the river system and resultant nutrient loads to the sea.In a recent version of the model abatement measures have been in-cluded. The set of abatement measures that were included in thecost minimisation application presented here was selected fromthe set of available measures so that (a) the marginal costs for allmeasures are constant, i.e. the total abatement costs are a linearfunction of the abatement level and (b) that the effects of the mea-sures are independent. Increasing marginal costs are instead cap-tured by two mechanisms: a very high spatial disaggregation anddifferentiation of the effectiveness of measures (by waste watertreatment plant and sub-basin) and a stepwise segmentation ofcost functions with increasing marginal costs in particular for mea-sures to reduce nitrogen surplus in agriculture. Measures that areinterdependent would change the effectiveness of other measuresas their implementation level increases, and their inclusion wouldincrease the model complexity. For example, increased erosion con-trol through tillage would reduce the benefits of buffer strips, be-cause less sediment would be eroded and therefore retained by thestrips. The selected types of measures and the assumptions regard-ing their costs are summarised in Table 2. The abatement potentialof each measure is imported directly from the analysis of these mea-sures in the MONERIS model.
3.4. Estimation of the Nutrient Retention Capacity of FloodplainWetlands
The nutrient retention by floodplain inundation has been studiedat various river sites, however robust assessment methods for thelandscape or watershed scale are not available. In order to capturethe future nutrient retention capacity of restored floodplain wet-lands, we estimate the total retention of a site as the product of theadditional average annual inundated area and the specific nutrientretention rate per inundation day. A comparable approach based ondaily retention rates and inundation modelling is used for exampleby van der Lee et al. (2004) to estimate nutrient retention of theRhine floodplains.
3.4.1. Estimation of the Inundated AreaWe estimate the average annual inundated area for each of the
project sites. Discharge-exceedance and discharge-stage functionsfor each river section are available from a study of the morphody-namics of the Elbe River (cf. Nestmann and Büchele, 2002). We usethe discharge exceedance curve for each site along the river trajec-tory and divide these into ten classes of equal duration. We theninterpolate the corresponding stage for each of the eleven break-points (Qmin, Q10, … , Q90, Qmax) from the discharge-stage func-tion. The corresponding inundated area (Ain) for each stage isestimated by extrapolating the water level over a digital elevationmodel of the floodplain using GIS analysis. The expectation valueor average annual inundated area E(Ain) for each project site is
5 The opportunity costs of agriculture land restored to wetlands is roughly equal to
113M. Grossmann / Ecological Economics 83 (2012) 108–117
then calculated by sum of the product of inundated area and thecorresponding occurrence probability to ensure normalisation asfollows:
E Ainð Þ ¼ 0:05 � Ain Qminð Þ þ 0:1 � Ain Q10ð Þ þ ::þ 0:1 � Ain Q90ð Þþ 0:05 � Ain Qmaxð Þ: ð11Þ
3.4.2. Estimation of the Specific Nutrient Retention CapacityIn eutrophic rivers, a large part of the phosphorous load is
adsorbed to silt particles (50–70%) whereas the largest part of the ni-trogen load is transported in solution (98%) (Olde-Venterink et al.,2003).3 At high stages in the river the floodplain will therefore be in-undated with water having high concentrations of nitrate-N, sedi-ments and particulate phosphorous.
Retention of phosphorous in floodplain wetlands is mainly con-trolled by sedimentation processes. Retention of dissolved P is notas pronounced as retention of particulate P. In contrast to the storageof fluvial sediments on inundated floodplains the evidence of P depo-sition is not as widely documented. Hoffmann et al. (2009) provideone of the most recent reviews of the phosphorus retention capacityof wetlands. Annual deposition rates of particulate P range from 1 to128 kg P ha−1 a−1. However desorption of high P concentrationsfrom wetted soils previously under agricultural use may for sometime lower the effectiveness of restoration measures. The observablenet retention is attributed to the fact that the sedimentation of P isgenerally higher than the remobilisation of P from the soil matrix.For the approach selected for this study, estimates of deposition perinundation day are required. Table 3 provides a survey of estimatesof particulate phosphorous deposition rates per inundation daybased on field measurements on periodically inundated floodplainsfrom European rivers. We find that values range between 0.2 and3.5 kg TP ha−1 day−1.
The most important processes controlling nitrogen retention infloodplains is denitrification in the water column and alluvial soils(Pinay et al., 2002). The surface contact area of water with sedimentas well as the duration of contact determines the rate of nitrogen re-tention, because the nitrogen cycle is driven by processes that occuron or at the interface of particulate matter. Denitrification in alluvialsoils contributes to retention of the river nitrate load if nitrate origi-nating from the river water is denitrified.
Behrendt and Opitz (2000) estimate an empirical relationship be-tween the hydraulic load as an indicator for the intensity of water–surface contact and nutrient retention in large river systems.4 The ap-proach is implemented in the ecohydrologic model system MONERISto quantify nutrient retention in river systems. We applied theMONERIS model version for the Elbe River basin (Venohr et al.,submitted for publication) to estimate the additional nitrogen retentionresulting from an increase in the water surface area by the average an-nual inundated area of all project sites at their respective location alongthe trajectory. For the discharge and nutrient loads of the period2000–2005 this gives an average retention of 1.4 kg N ha−1 day−1.This value compares well with other estimates from the literature. Forexample, Hoffmann and Baattrup-Pedersen (2007) give recommenda-tions for estimating the additional nitrogen retention of restored flood-plain wetlands with regular inundation in Denmark. For rivers withnitrogen concentrations>5 mg N l−1 they propose a value of 1.5 kgTN ha−1 day−1 per inundation day and for nitrogen concentrationsofb5 mg N l−1 a value of 1 kg TN ha−1 day−1. For the branches of theRhine estuary, van der Lee et al. (2004) and Olde-Venterink et al.(2006) estimate retention rates per inundation day in the order of
3 In the following P and N are used to denote phosphorous and nitrogen. TP and TNare used to denote total phosphorous and nitrogen.
4 This approach was also used for an assessment of the nutrient retention potentialof two restoration sites along the Elbe by Meyerhoff and Dehnhardt (2007).
0.1–0.35 kg TN ha−1 day−1 for the alluvial soils of the Maas andIssel floodplains. Engelhardt et al. (1999) observe retention rates ofca. 1.46 kg TN ha−1 day−1 for flood polders along the Odra River.
Based on an evaluation of this evidence, we use a retention rate of0.8 kg TP ha−1 day−1 for phosphorus, that we consider to be a lowerreliable estimate (0,33 percentile) of the sample. We use the recom-mended value of 1.5 kg TN ha−1 day−1 for nitrogen. Because of theuncertainty of the estimates we conduct sensitivity analysis for a50% lower nutrient retention capacity.
3.5. Empirical Estimation of the Costs of Floodplain Restoration
We estimate a simple cost function from the total investmentcosts reported for 27 floodplain restoration projects at various stagesof preparation along the Elbe River (Table 4). The data refers to theperiod 2000–2005. The largest share of the investment costs are theconstruction costs for the relocated dike and the costs for acquiringthe floodplain land from current land owners prior to conversion.5
Other major cost elements are project planning and transaction costs.We estimate the total project investment costs as a function of the
length of the constructed new dike and the restored floodplain area.We tested various specifications and find that the cost per unit areais best explained by the required length of new dike line per unitarea. The costs per unit area decrease with increasing restored areain relation to the length of necessary dike construction. This suggeststhe following cost equation:
TC ¼ β0 þ β1 Ldikeð Þ2 ð12Þ
where TC are the total costs in €ha−1 and Ldike is the length of re-quired dike construction per total restored floodplain area inkm ha−1 and β are the coefficients to be estimated. Table 5 reportsordinary least square estimation results.
The function has an explanatory power of 81%. The variable andconstant are significant at the levelb0.001. We conclude that thecost function can be used for a rough estimation of the investmentcosts of lowland restoration measures at different sites within theElbe basin.
4. Results
4.1. Value of Nutrient Retention Ecosystem Service
We solve the model defined by Eqs. (2–9) for various levels ofabatement requirements defined in the constraint to the objectivefunction and for two implementation levels (with and without) ofthe proposed floodplain restoration programme.6 The average annualinundated area of the 20,749 ha total area of the floodplain restora-tion programme is 1718 ha. We consider load reduction requirementsthat range from 5 to 35% and differ according to the combination ofthe targeted nutrients and locality of the abatement requirement.This range encompasses the current policy target of a simultaneous24% reduction of the load of both nutrients by 2027. The reference nu-trient loads for the main river at the outlet at Hamburg (Seeman-shöft) for the period 2000–2005 are 3500 t TP a−1 and 98,500 tTN a−1 (cf. Venohr et al., submitted for publication).
In Table 6 we present results for a joint and proportional reductionof the load of the two nutrients at the outlet to the North Sea with andwithout implementation of the floodplain restoration programme.The abatement target constraint for each nutrient is binding so that
the value of lost production in perpetuity. This can be considered to be roughly equiv-alent to the purchase price for land.
6 In the without implementation case, the constraint (X′i,m) on the available averageannual inundated floodplain area is set at 0 ha, for the with implementation case theconstraint is set at 1718 ha.
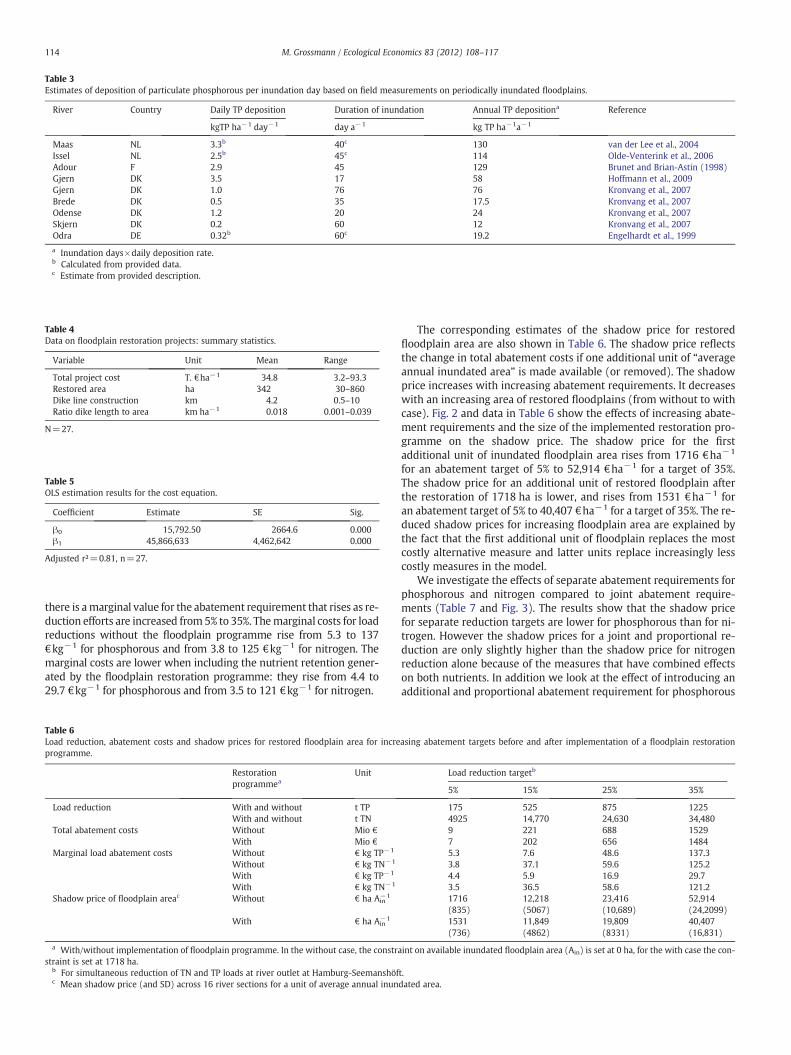
Table 4Data on floodplain restoration projects: summary statistics.
Variable Unit Mean Range
Total project cost T. €ha−1 34.8 3.2–93.3Restored area ha 342 30–860Dike line construction km 4.2 0.5–10Ratio dike length to area km ha−1 0.018 0.001–0.039
N=27.
Table 5OLS estimation results for the cost equation.
Coefficient Estimate SE Sig.
β0 15,792.50 2664.6 0.000β1 45,866,633 4,462,642 0.000
Adjusted r²=0.81, n=27.
Table 3Estimates of deposition of particulate phosphorous per inundation day based on field measurements on periodically inundated floodplains.
River Country Daily TP deposition Duration of inundation Annual TP depositiona Reference
kgTP ha−1 day−1 day a−1 kg TP ha−1a−1
Maas NL 3.3b 40c 130 van der Lee et al., 2004Issel NL 2.5b 45c 114 Olde-Venterink et al., 2006Adour F 2.9 45 129 Brunet and Brian-Astin (1998)Gjern DK 3.5 17 58 Hoffmann et al., 2009Gjern DK 1.0 76 76 Kronvang et al., 2007Brede DK 0.5 35 17.5 Kronvang et al., 2007Odense DK 1.2 20 24 Kronvang et al., 2007Skjern DK 0.2 60 12 Kronvang et al., 2007Odra DE 0.32b 60c 19.2 Engelhardt et al., 1999
a Inundation days×daily deposition rate.b Calculated from provided data.c Estimate from provided description.
114 M. Grossmann / Ecological Economics 83 (2012) 108–117
there is amarginal value for the abatement requirement that rises as re-duction efforts are increased from 5% to 35%. Themarginal costs for loadreductions without the floodplain programme rise from 5.3 to 137€kg−1 for phosphorous and from 3.8 to 125 €kg−1 for nitrogen. Themarginal costs are lower when including the nutrient retention gener-ated by the floodplain restoration programme: they rise from 4.4 to29.7 €kg−1 for phosphorous and from 3.5 to 121 €kg−1 for nitrogen.
Table 6Load reduction, abatement costs and shadow prices for restored floodplain area for increprogramme.
Restorationprogrammea
Unit
Load reduction With and without t TPWith and without t TN
Total abatement costs Without Mio €
With Mio €
Marginal load abatement costs Without € kg TP−1
Without € kg TN−1
With € kg TP−1
With € kg TN−1
Shadow price of floodplain areac Without € ha Ain−1
With € ha Ain−1
a With/without implementation of floodplain programme. In the without case, the constrastraint is set at 1718 ha.
b For simultaneous reduction of TN and TP loads at river outlet at Hamburg-Seemanshöfc Mean shadow price (and SD) across 16 river sections for a unit of average annual inun
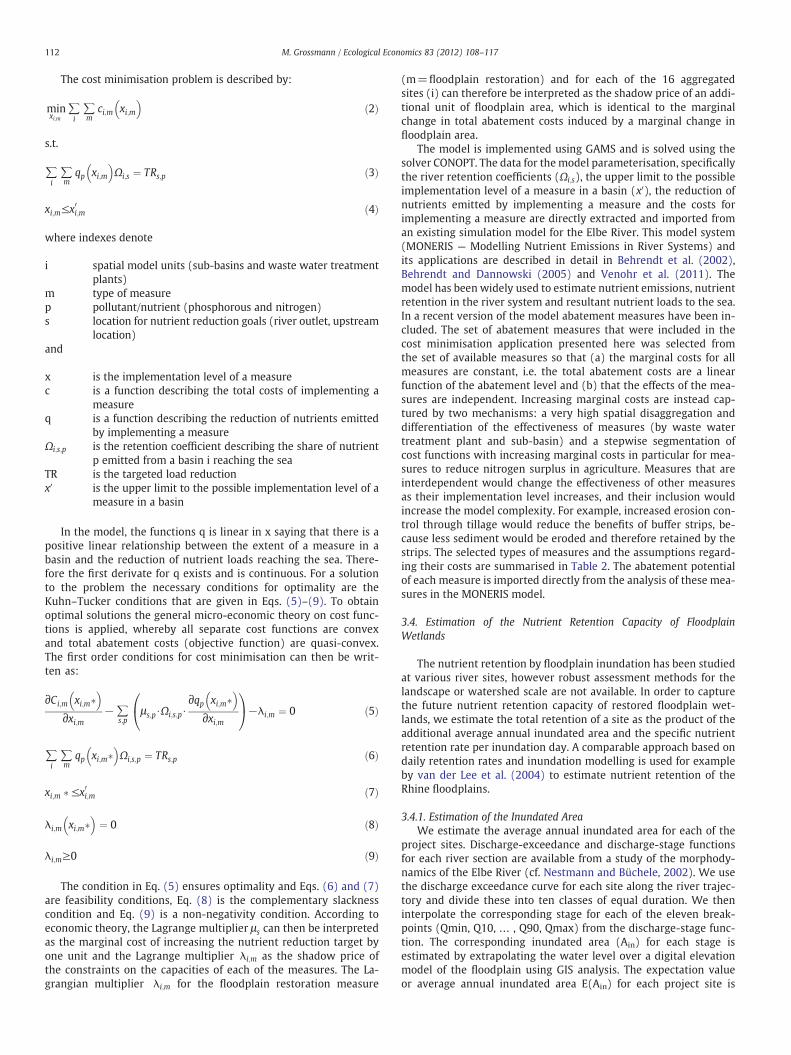
The corresponding estimates of the shadow price for restoredfloodplain area are also shown in Table 6. The shadow price reflectsthe change in total abatement costs if one additional unit of “averageannual inundated area” is made available (or removed). The shadowprice increases with increasing abatement requirements. It decreaseswith an increasing area of restored floodplains (from without to withcase). Fig. 2 and data in Table 6 show the effects of increasing abate-ment requirements and the size of the implemented restoration pro-gramme on the shadow price. The shadow price for the firstadditional unit of inundated floodplain area rises from 1716 €ha−1
for an abatement target of 5% to 52,914 €ha−1 for a target of 35%.The shadow price for an additional unit of restored floodplain afterthe restoration of 1718 ha is lower, and rises from 1531 €ha−1 foran abatement target of 5% to 40,407 €ha−1 for a target of 35%. The re-duced shadow prices for increasing floodplain area are explained bythe fact that the first additional unit of floodplain replaces the mostcostly alternative measure and latter units replace increasingly lesscostly measures in the model.
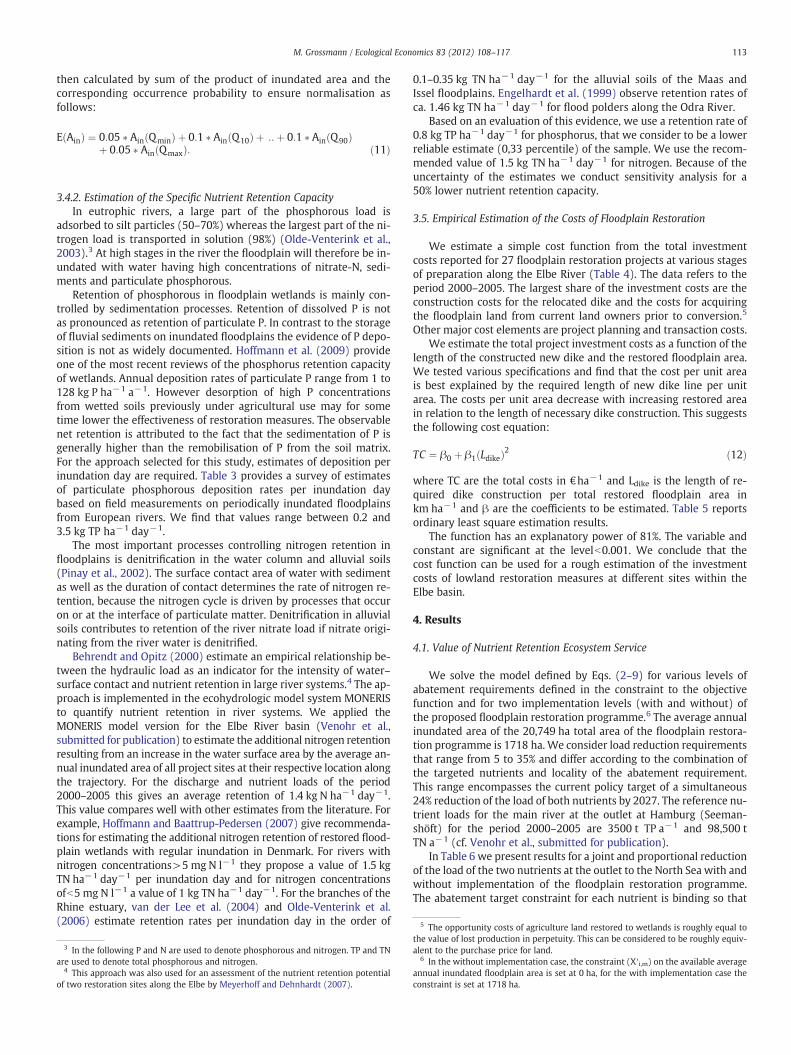
We investigate the effects of separate abatement requirements forphosphorous and nitrogen compared to joint abatement require-ments (Table 7 and Fig. 3). The results show that the shadow pricefor separate reduction targets are lower for phosphorous than for ni-trogen. However the shadow prices for a joint and proportional re-duction are only slightly higher than the shadow price for nitrogenreduction alone because of the measures that have combined effectson both nutrients. In addition we look at the effect of introducing anadditional and proportional abatement requirement for phosphorous
asing abatement targets before and after implementation of a floodplain restoration
Load reduction targetb
5% 15% 25% 35%
175 525 875 12254925 14,770 24,630 34,4809 221 688 15297 202 656 14845.3 7.6 48.6 137.33.8 37.1 59.6 125.24.4 5.9 16.9 29.73.5 36.5 58.6 121.21716(835)
12,218(5067)
23,416(10,689)
52,914(24,2099)
1531(736)
11,849(4862)
19,809(8331)
40,407(16,831)
int on available inundated floodplain area (Ain) is set at 0 ha, for the with case the con-
t.dated area.
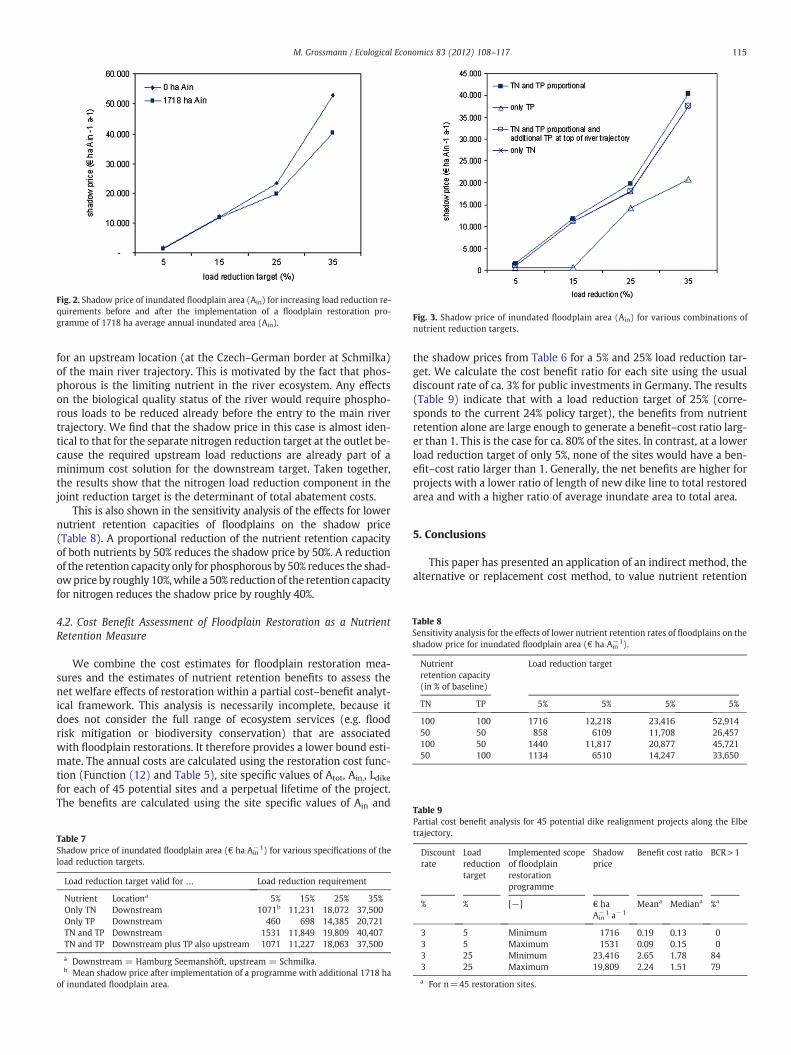
Fig. 2. Shadow price of inundated floodplain area (Ain) for increasing load reduction re-quirements before and after the implementation of a floodplain restoration pro-gramme of 1718 ha average annual inundated area (Ain).
Fig. 3. Shadow price of inundated floodplain area (Ain) for various combinations ofnutrient reduction targets.
Table 8Sensitivity analysis for the effects of lower nutrient retention rates of floodplains on theshadow price for inundated floodplain area (€ ha Ain
−1).
Nutrientretention capacity(in % of baseline)
Load reduction target
TN TP 5% 5% 5% 5%
100 100 1716 12,218 23,416 52,91450 50 858 6109 11,708 26,457100 50 1440 11,817 20,877 45,72150 100 1134 6510 14,247 33,650
Table 9
115M. Grossmann / Ecological Economics 83 (2012) 108–117
for an upstream location (at the Czech–German border at Schmilka)of the main river trajectory. This is motivated by the fact that phos-phorous is the limiting nutrient in the river ecosystem. Any effectson the biological quality status of the river would require phospho-rous loads to be reduced already before the entry to the main rivertrajectory. We find that the shadow price in this case is almost iden-tical to that for the separate nitrogen reduction target at the outlet be-cause the required upstream load reductions are already part of aminimum cost solution for the downstream target. Taken together,the results show that the nitrogen load reduction component in thejoint reduction target is the determinant of total abatement costs.
This is also shown in the sensitivity analysis of the effects for lowernutrient retention capacities of floodplains on the shadow price(Table 8). A proportional reduction of the nutrient retention capacityof both nutrients by 50% reduces the shadow price by 50%. A reductionof the retention capacity only for phosphorous by 50% reduces the shad-owprice by roughly 10%,while a 50% reduction of the retention capacityfor nitrogen reduces the shadow price by roughly 40%.
4.2. Cost Benefit Assessment of Floodplain Restoration as a NutrientRetention Measure
We combine the cost estimates for floodplain restoration mea-sures and the estimates of nutrient retention benefits to assess thenet welfare effects of restoration within a partial cost–benefit analyt-ical framework. This analysis is necessarily incomplete, because itdoes not consider the full range of ecosystem services (e.g. floodrisk mitigation or biodiversity conservation) that are associatedwith floodplain restorations. It therefore provides a lower bound esti-mate. The annual costs are calculated using the restoration cost func-tion (Function (12) and Table 5), site specific values of Atot, Ain,, Ldikefor each of 45 potential sites and a perpetual lifetime of the project.The benefits are calculated using the site specific values of Ain and
Table 7Shadow price of inundated floodplain area (€ ha Ain
−1) for various specifications of theload reduction targets.
Load reduction target valid for … Load reduction requirement
Nutrient Locationa 5% 15% 25% 35%Only TN Downstream 1071b 11,231 18,072 37,500Only TP Downstream 460 698 14,385 20,721TN and TP Downstream 1531 11,849 19,809 40,407TN and TP Downstream plus TP also upstream 1071 11,227 18,063 37,500
a Downstream = Hamburg Seemanshöft, upstream = Schmilka.b Mean shadow price after implementation of a programme with additional 1718 ha
of inundated floodplain area.
the shadow prices from Table 6 for a 5% and 25% load reduction tar-get. We calculate the cost benefit ratio for each site using the usualdiscount rate of ca. 3% for public investments in Germany. The results(Table 9) indicate that with a load reduction target of 25% (corre-sponds to the current 24% policy target), the benefits from nutrientretention alone are large enough to generate a benefit–cost ratio larg-er than 1. This is the case for ca. 80% of the sites. In contrast, at a lowerload reduction target of only 5%, none of the sites would have a ben-efit–cost ratio larger than 1. Generally, the net benefits are higher forprojects with a lower ratio of length of new dike line to total restoredarea and with a higher ratio of average inundate area to total area.
5. Conclusions
This paper has presented an application of an indirect method, thealternative or replacement cost method, to value nutrient retention
Partial cost benefit analysis for 45 potential dike realignment projects along the Elbetrajectory.
Discountrate
Loadreductiontarget
Implemented scopeof floodplainrestorationprogramme
Shadowprice
Benefit cost ratio BCR>1
% % [−] € haAin−1 a−1
Meana Mediana %a
3 5 Minimum 1716 0.19 0.13 03 5 Maximum 1531 0.09 0.15 03 25 Minimum 23,416 2.65 1.78 843 25 Maximum 19,809 2.24 1.51 79
a For n=45 restoration sites.
116 M. Grossmann / Ecological Economics 83 (2012) 108–117
ecosystem services. The presented cost minimisation approach pro-vides a tool for estimating a shadow price of an unpriced benefit pro-vided by wetland ecosystems. The estimated values can be used forsubsequent economic appraisal of floodplain and integrated water re-source management projects in the Elbe River basin. They also pro-vide further empirical evidence on the economic value of restoringwetland ecosystem services.
We have shown that, as expected, the shadow price or nutrient re-tention benefit of restored floodplain area increases with increasingnutrient load reduction targets. Scope effects have a smaller impact,but marginal benefits decrease with increasing scope of the floodplainrestoration projects. The findings underline the fact that value esti-mates for regulatory ecosystem services are highly dependent onthe contextual conditions of the service benefit area, such as the avail-ability of substitute abatement options and abatement targets. Wealso conclude that the existence of clearly defined policy targets,such as for phosphate and nitrogen load reductions to the sea, in prin-ciple enhance the applicability of the replacement cost method.Implementing the replacement or alternative cost method is not dif-ficult in concept, although detailed empirical analysis requires con-siderable effort. The process of imputing shadow prices that takesthe various interdependencies in a river basin context into accountis best addressed within the framework of optimisation models.
The data on shadow prices presented in Table 6 can be used forbenefit transfer for dike relocations along the Elbe River. The appro-priate marginal benefit needs to be selected based on the appropriateload reduction target. It can be adjusted for scope effects. Additionaladjustments will be required to transform from average annual inun-dated area to total area. The data given in Table 1 gives some indica-tion on the appropriate ratio, even though this is an important sitespecific piece of information. Such adjustments are also necessaryfor a comparison of the results of this study to the results of otherstudies, for example an earlier study for the Elbe by Meyerhoff andDehnhardt (2007). These authors assume an average retention rateof 200 kg TN ha−1a−1 of total restored area. They proceed to valuethis retention using estimated emission abatement costs at sourcein the range of 2.5–7.7 € kg TN−1. This yields average benefits perunit of total restored floodplain area of 440–1540 €ha−1. Using amean ratio of inundated area (Ain) to total area (Atot) of 1:13(Table 1), the comparable retention rate for an average unit of totalrestored floodplain in the present study would be in the range of42 kg TN ha−1a−1. This is much lower. The adjusted benefit esti-mates rise from ca. 117 to 3100 €ha−1 of total restored area. Thus,whilst the resulting order of magnitude of benefits found in the twostudies is similar, the estimate of the present study is based on alower retention rate and on evidence of higher marginal abatementcosts for TN load reductions.
A factor we could not account for in our analysis is the expectedreduction of retention rate with increasing abatement efforts and de-creasing nutrient load. Whilst this might be conceptually appealing,we did not find that the available empirical data on nutrient retentionis good enough to warrant such an approach. Large uncertainty re-garding the nutrient retention capacity of restored floodplains re-mains and there is continued need for the development of a robustmethod.
Given the large investment costs for dike realignments, it is a moresurprising result of this study that the nutrient retention effects alonemay generate sufficient benefits to provide an economic efficiencygain, if the long term target of a 24% load reduction is the relevant tar-get. This is not the case for the incremental target of a 7% load reduc-tion until 2014. It can therefore be considered likely that floodplainrestoration will receive more attention as potentially cost-effectiveabatement measures as it becomes apparent that other low cost op-tions for nutrient abatement become scarcer. However the key thrustof the argument developed in this paper is, that floodplain restorationprojects need to be assessed as multifunctional projects, with the
positive impacts on water quality being one of several co-benefitdimensions.
Acknowledgements
I am indebted to the late Horst Behrendt (IGB — Leibniz Institutefor Aquatic Ecology and Inland Fisheries) for the friendly and fruitfulcooperation in developing an integrated economic–ecohydrologicalversion of the MONERIS model. Thanks are also due to Jean-Luc deKok (University of Twente) for making available model result onfloodplain inundation levels. This work was funded by the FederalMinistry of Education and Research (BMBF) under its GLOWA ElbeProgram (FKZ: 01 LW 0307).
References
Behrendt, H., Dannowski, R. (Eds.), 2005. Nutrients and Heavy Metals in the Odra RiverSystem. Weißensee Verlag, Berlin.
Behrendt, H., Huber, P., Kornmilch, M., Opitz, D., Schmoll, O., Scholz, G., Uebe, R.,Pagenkopf, W.-G., Bach, M., Schweikart, U., 2002. Nutrient emissions into river ba-sins of Germany. UBA-Texte Nr. 23/2000. Umweltbundesamt, Dessau.
Behrendt, H., Opitz, D., 2000. Retention of nutrients in river systems: dependence onspecific runoff and hydraulic load. Hydrobiologia 410, 111–122.
BMU/BfN, 2009. Auenzustandsbericht. Flussauen in Deutschland (Report on the statusof riverine floodplains in Germany). Bundesministerium für Umwelt, Naturschutzund Reaktorsicherheit (BMU) and Bundesamt für Naturschutz (BfN), Berlin andBonn.
Brunet, R.-C., Brian Astin, K., 1998. Variation in phosphorous flux during a hydrologicalseason: the river Adour. Water Research 32, 547–558.
Brunotte, E., Dister, E., Günther-Diringer, D., Koenzen, U., Mehl, D., 2009. Flussauen inDeutschland - Erfassung und Bewertung des Auenzustandes. : Naturschutz undBiologische Vielfalt, 87. Bundesamt für Naturschutz, Bonn.
Byström, O., 1998. The nitrogen abatement costs in wetlands. Ecological Economics 26,321–331.
Byström, O., 2000. The replacement value of wetlands in Sweden. Environmental andResource Economics 16, 347–362.
Dubgaard, A., Kallesøe, M.F., Ladenburg, J., Petersen, M.L., 2005. Cost–benefit analysis ofriver restoration in Denmark. In: Brouwer, R., Pearce, D. (Eds.), Cost–Benefit Anal-ysis and Water Resources Management. Edward Elgar, Cheltenham.
Engelen, D., Seidelin, C., van der Veeren, R., Bartom, D., Queb, K., 2008. Cost-effective-ness analysis for the implementation of the EU Water Framework Directive.Water Policy 10, 207–220.
Engelhardt, C., Krüger, A., Karrasch, B., Baborowski, M., 1999. Input/output balances ofnutrients and plankton in a flooded area of the Lower Odra. Acta Hydrochimica etHydrobiologica 27, 325–330.
FGG Elbe, 2009. Hintergrundpapier zur Ableitung der überregionalen Bewirtschaftungszielefür die Oberflächengewässer im deutschen Teil der Flussgebietseinheit Elbe für denBelastungsschwerpunkt Nährstoffe. Flussgebietsgemeinschaft Elbe, Magdeburg.
Fischer, B., Turner, R.K., Morling, P., 2009. Defining and classifying ecosystem servicesfor decision making. Ecological Economics 68, 643–653.
Gren, I.-M., Elofsson, K., Jannke, P., 1997. Cost-effective nutrient reductions to the BalticSea. Environmental and Resource Economics 10, 341–362.
Gren, I.-M., Groth, K.-H., Sylvén, M., 1995. Economic values of Danube floodplains. Journalof Environmental Management 45, 333–345.
Grossmann, M., Hartje, V., Meyerhoff, J., 2010. Ökonomische Bewertung naturverträglicherHochwasservorsorge an der Elbe. : Naturschutz und Biologische Vielfalt, 89. Bundesamtfür Naturschutz, Bonn.
Hoffmann, C.C., Baattrup-Pedersen, A., 2007. Re-establishing freshwater wetlands inDenmark. Ecological Engineering 30, 157–166.
Hoffmann, C.C., Kjaergaard, C., Uusi-Kämppä, J., Bruun Hansen, H.-C., Kronvang, B.,2009. Phosphorus retention in riparian buffers: review of their efficiency. Journalof Environmental Quality 38, 1942–1955.
IKSE, 2004. Aktionsplan Hochwasserschutz (Action Plan for Flood Protection). Interna-tionale Kommission zum Schutz der Elbe (IKSE), Magdeburg.
Jenkins, A., Murray, B., Kramer, R., Faulkner, S., 2010. Valuing ecosystem services fromwetlands restoration in the Mississippi Alluvial Valley. Ecological Economics 69,1051–1061.
Korn, N., Jessel, B., Hasch, B., Mühlinghaus, R., 2006. Flussauen undWasserrahmenrichtlinie.Bedeutung der Flussauen für die Umsetzung der Wasserrahmenrichtlinie -Handlungsempfehlungen für Naturschutz und Wasserwirtschaft (Floodplainsand Water Framework Directive). Naturschutz und Biologische Vielfalt 27 Bonn.
Kronvang, B., Andersen, I.K., Hoffmann, C.C., Pedersen, M.L., Ovesen, N.B., Andersen,H.E., 2007. Water exchange and deposition of sediment and phosphorus during in-undation of natural and restored lowland floodplains. Water, Air, and Soil Pollution181, 115–121.
Lise, W., Van der Veeren, R., 2002. Cost-effective nutrient emission reductions in theRhine River Basin. Integrated Assessment 3, 321–342.
Meyerhoff, J., Dehnhardt, A., 2007. The European Water Framework Directive and eco-nomic valuation of wetlands: the restoration of floodplains along the River Elbe.European Environment 17, 18–36.

117M. Grossmann / Ecological Economics 83 (2012) 108–117
Nestmann, F., Büchele, B. (Eds.), 2002. Morphodynamik der Elbe. Institut fürWasserwirtschaft und Kulturtechnik der Universität Karlsruhe, Karlsruhe.
Neuschulz, F., Purps, J., 2000. Rückverlegung von Hochwasserschutzdeichen zurWiederherstellung von Überflutungsflächen. In: Friese, B., Witter, G., Miehlich,G., Rode, M. (Eds.), Stoffhaushalt von Auenökosystemen. Springer, Berlin.
Olde-Venterink, H., Weigman, F., van der Lee, G., Vermaat, J., 2003. Role of active flood-plains for nutrient retention in the River Rhine. Journal of Environmental Quality32, 1430–1435.
Olde-Venterink, H., Vermaat, J., Pronk, M., Wiegman, F., van der Lee, G., van den Hoorn,M., Higler, L., Verhoeven, J., 2006. Importance of sediment deposition and denitri-fication for nutrient retention in floodplain wetlands. Applied Vegetation Science9, 163–174.
Pinay, G., Clement, J.C., Naiman, R., 2002. Basic principles and ecological consequencesof changing water regimes on nitrogen cycling in fluvial systems. EnvironmentalManagement 30, 481–491.
Ribaudo, M., Heimlich, R., Classen, R., Peters, M., 2001. Least cost management of non-point source pollution: source reduction versus interception strategies for control-ling nitrogen loss in the Mississipi basin. Ecological Economics 37, 183–197.
Samuelson, P.A., 1952. Spatial price equilibrium and linear programming. AmericanEconomic Review 42, 283–303.
Schou, J.S., Neye, S.T., Lundhede, T., Martinsen, L., Hasler, B., 2006. Modelling cost effi-cient reductions of nutrient loads to the Baltic Sea. Concept, data, and cost func-tions for the cost minimisation model. NERI Technical Report 592. NationalEnvironmental Research Institute Denmark, Kopenhagen.
Shabman, L., Batie, S., 1978. Economic value of natural costal wetlands: a critique.Coastal Zone Management Journal 4, 231–247.
Söderqvist, T., 2002. Constructed wetlands as nitrogen sinks in southern Sweden: anempirical analysis of cost determinants. Ecological Engineering 19, 161–173.
Turner, K., Georgiou, S., Fisher, B., 2008. Valuing Ecosystem Services. The Case of Multi-functional Wetlands. Earthscan, London.
van der Lee, G., Olde Venterink, H., Asselman, N., 2004. Nutrient retention in flood-plains of the Rhine distributaries in the Netherlands. River Research and Applica-tions 20, 315–325.
Van der Veeren, R., Tol, R., 2001. Benefits of a reallocation of nitrate emission reduc-tions in the Rhine River Basin. Environmental and Resource Economics 18, 19–41.
Venohr, M., Hirt, U., Hofmann, J., Opitz, D., Gericke, A., Wetzig, A., Natho, S., Neumann,F., Hürdler, J., Matranga, M., Mahnkopf, J., Gadegast, M., Behrendt, H., 2011. Model-ling of nutrient emissions in river systems - MONERIS - Methods and Background.International Review of Hydrobiology 96 (5), 435–483.
Venohr, M., Hürdler, J., Natho, S., Opitz, D., submitted for publication. Influence ofchanging precipitation-run-off conditions on the spatial and seasonal distributionof nutrient emissions and on the effectiveness of measures to reduce nutrientfluxes in the river Elbe. Regional Environmental Change.
Walling, D.E., Owens, P., 2003. The role of overbank floodplain sedimentation in catch-ment contaminant budgets. Hydrobiologia 494, 83–91.