economic outlook 2010 - lmfeui outlook 2010-faisal basri_artikel.pdf · stlh setelah mengalami...
TRANSCRIPT
ECONOMIC OUTLOOK 2010ECONOMIC OUTLOOK 2010ECONOMIC OUTLOOK 2010ECONOMIC OUTLOOK 2010
Faisal BasriFaisal Basri15 November15 November 20092009
BagianBagian IIPerkembangan Ekonomi Dunia TerkiniPerkembangan Ekonomi Dunia TerkiniPerkembangan Ekonomi Dunia TerkiniPerkembangan Ekonomi Dunia Terkini
SummaryPerekonomian dunia sudah menunjukkan recovery, lebih cepat dari perkiraan eco e y, eb cepa da pe aasebelumnya, kecuali AS yang masih rentan.Tulang punggung pemulihan adalah Emerging M k t EM) kh EM A i l bih kh Markets EM), khususnya EM-Asia, lebih khusus lagi Asia Timur. Bahkan kawasan ini pulih sangat cepat dan mendahului negara-negara sangat cepat dan mendahului negara negara maju (fenomena baru).Perlu diwaspadai:p• Tekanan inflasi• Volatilitas nilai tukar.
K ik h h k diti t t i k • Kenaikan harga-harga komoditi, terutama minyak, karena kenaikan real demand

The world economy is facing a deep downturn in 2009downturn in 2009
In the most severe recession since WW II, the global economy is projected to shrink by 1.1 percent in 2009, with slow (sluggish) recovery next year.
Description Jul 08 Oct 08 Nov 08 Jan 09 Mar 09 Apr 09 Jul 09 Oct 09
World GDP growth, % 3.9 3.0 2.2 0.5 -0.8 -1.3 -1.4 -1.1
-United States 0.8 0.1 -0.7 -1.6 -2.6 -2.8 -2.6 -2.7
-Euro Area 1.2 0.2 -0.5 -2.0 -3.2 -4.2 -4.8 -4.2
-Japan 1.5 0.5 -0.2 -2.6 -5.8 -6.2 -6.0 -5.4
-Developing economies 6.7 6.1 5.1 3.3 2.0 1.6 1.5 1.7
-China 9.8 9.3 8.5 6.7 - 6.5 7.5 8.5
-Asean-5 5.6 5.5 4.5 2.7 - 0.0 -0.3 0.7
World trade growth, % 6.0 4.1 2.0 -2.8 - -11.0 -12.2 -11.9
Not available. Sources: IMF, World Economic Outlook, various issues.
It’s been a lousy year for forecasters all over the world.)
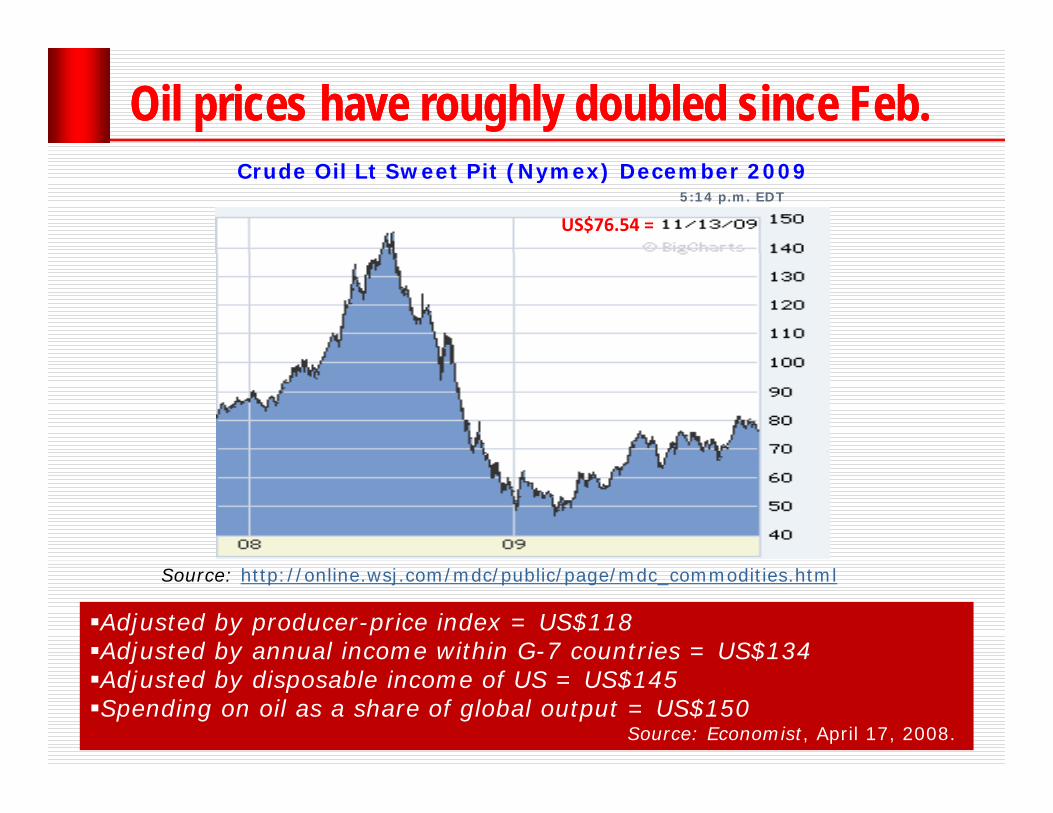
Oil prices Oil prices have roughly doubled since Feb.have roughly doubled since Feb.Crude Oil Lt Sweet Pit (Nymex) December 2009
5:14 p.m. EDT
US$76.54 =
Source: http://online.wsj.com/mdc/public/page/mdc_commodities.html
Adjusted by producer-price index = US$118Adjusted by annual income within G-7 countries = US$134j y $Adjusted by disposable income of US = US$145Spending on oil as a share of global output = US$150
• Source: Economist, April 17, 2008.
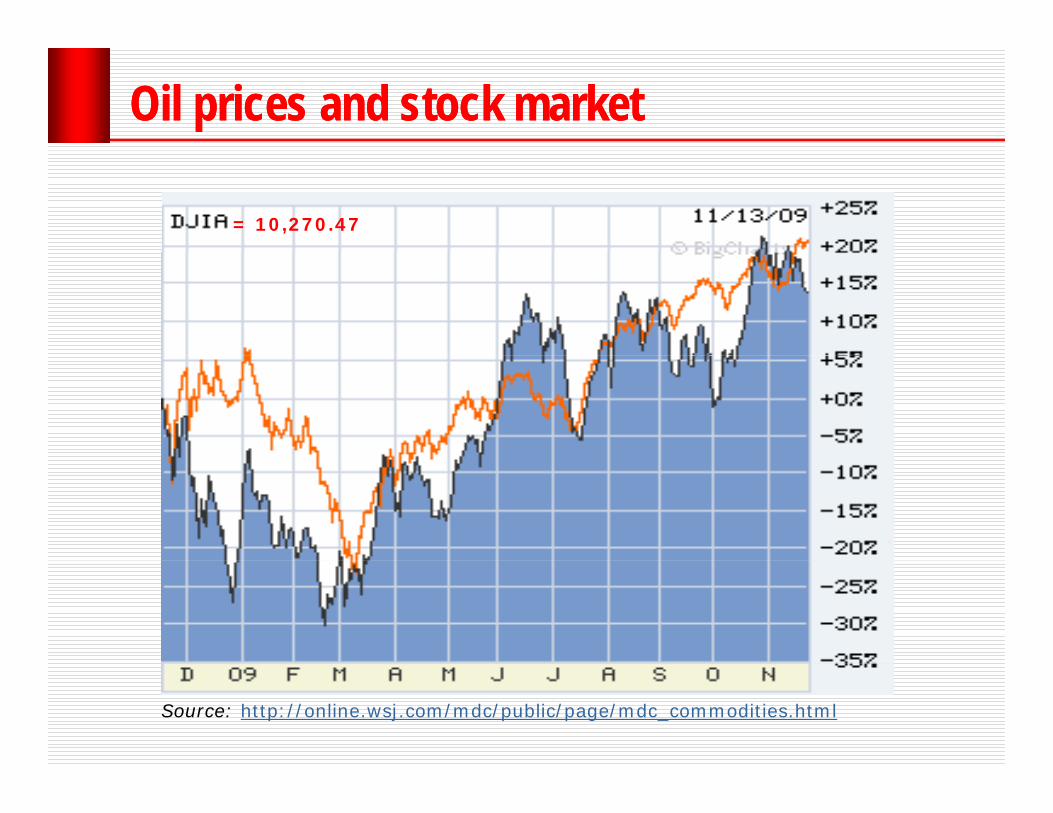
Oil prices and stock marketOil prices and stock market
= 10,270.47
Source: http://online.wsj.com/mdc/public/page/mdc_commodities.html
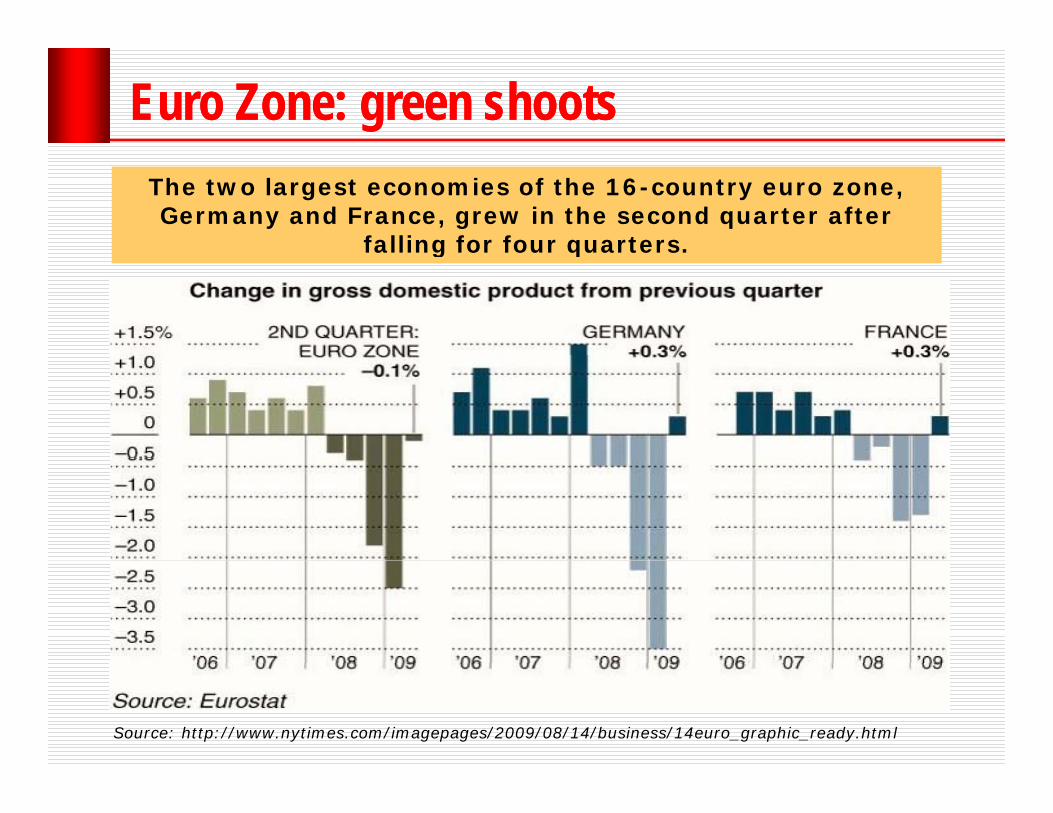
Euro Zone: green shootsEuro Zone: green shootsThe two largest economies of the 16-country euro zone, Germany and France, grew in the second quarter after
falling for four quarters.a g o ou qua e s
Source: http://www.nytimes.com/imagepages/2009/08/14/business/14euro_graphic_ready.html
Business confidence is surging across Business confidence is surging across EU and BRIC EU and BRIC ––FT, 10 August 2009, p.1FT, 10 August 2009, p.1EU and BRIC EU and BRIC FT, 10 August 2009, p.1FT, 10 August 2009, p.1
Business confidence is surging across European Business confidence is surging across European manufacturing, with the UK and Italy taking the lead.O ti i b t d ti t d i b k t l l Optimism about production trends is back at levels seen before the intensification of the global slowdown late last year and points to a clear growth slowdown late last year, and points to a clear growth in manufacturing activity by the middle of 2010.Th ll d “B i ” t i B il R i I di The so-called “Bric” countries – Brazil, Russia, India and China – have also seen a strong rebound in man fact ring confidence manufacturing confidence, ..
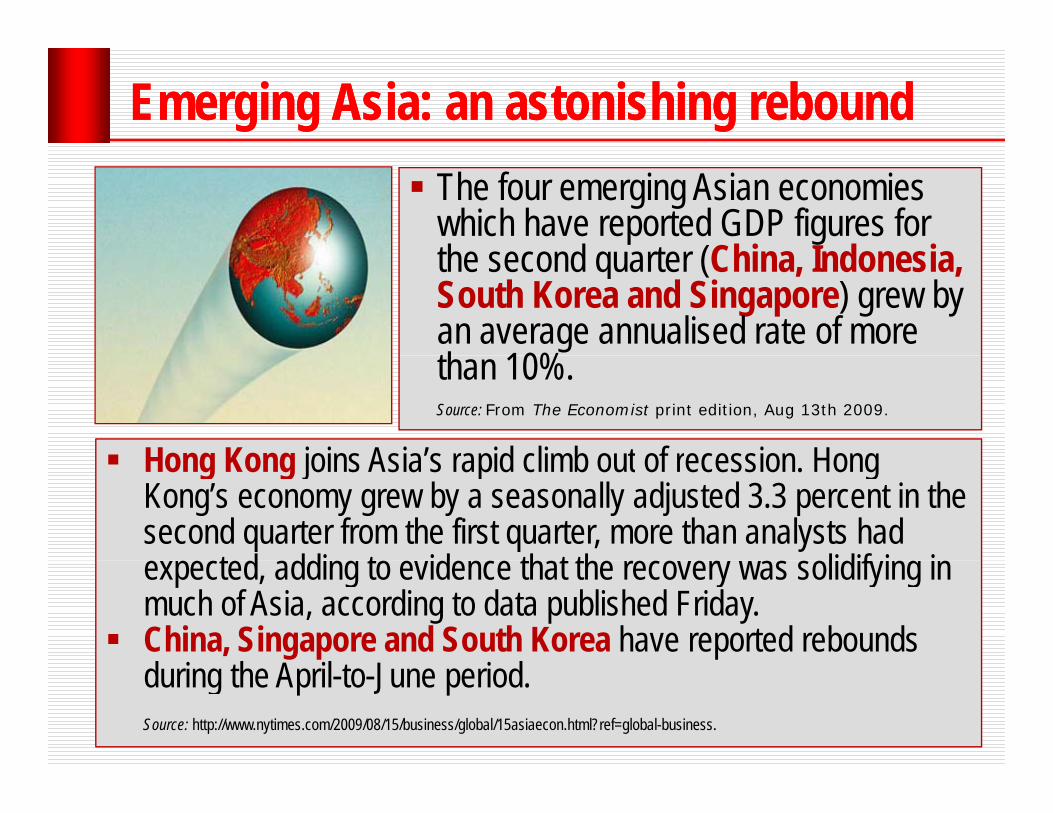
Emerging Asia: aEmerging Asia: an astonishing reboundn astonishing reboundThe four emerging Asian economies which have reported GDP figures for the second quarter (China Indonesia the second quarter (China, Indonesia, South Korea and Singapore) grew by an average annualised rate of more th 10%than 10%.Source: From The Economist print edition, Aug 13th 2009.
Hong Kong joins Asia’s rapid climb out of recession Hong Hong Kong joins Asia s rapid climb out of recession. Hong Kong’s economy grew by a seasonally adjusted 3.3 percent in the second quarter from the first quarter, more than analysts had
t d ddi t id th t th lidif i i expected, adding to evidence that the recovery was solidifying in much of Asia, according to data published Friday.China, Singapore and South Korea have reported rebounds d i h A il J i d during the April-to-June period. Source: http://www.nytimes.com/2009/08/15/business/global/15asiaecon.html?ref=global-business.
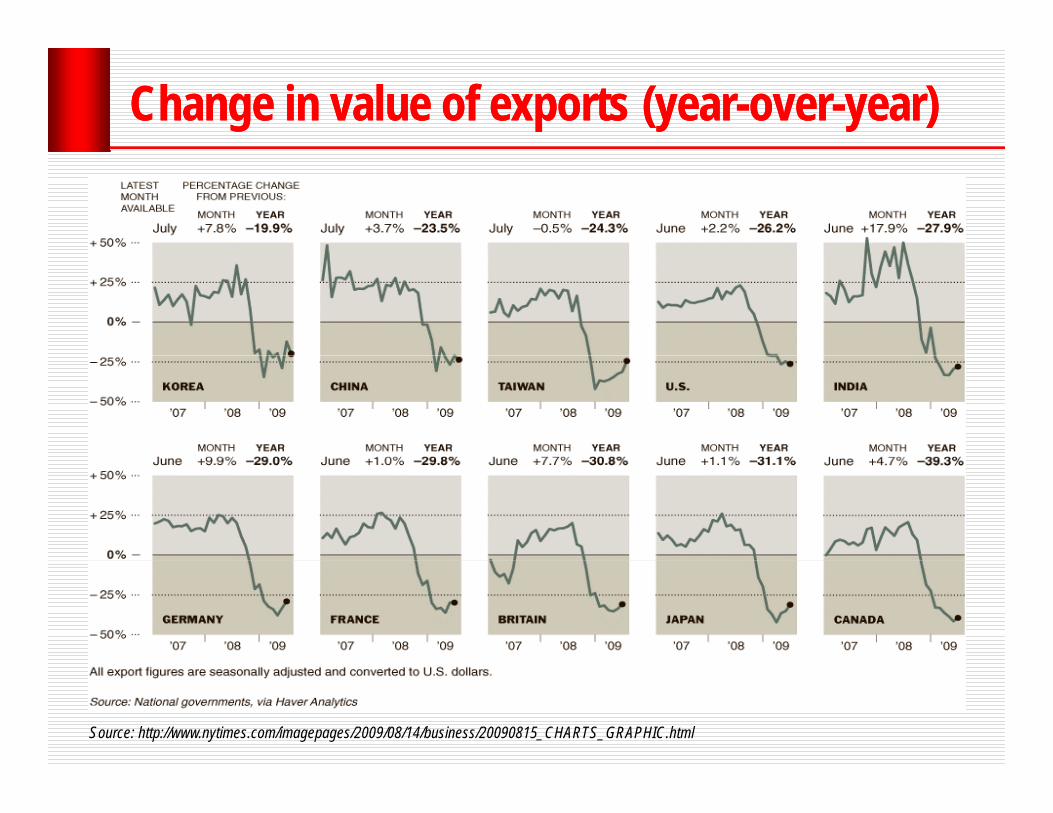
Change in value of exports (yearChange in value of exports (year--overover--year)year)
Source: http://www.nytimes.com/imagepages/2009/08/14/business/20090815_CHARTS_GRAPHIC.html
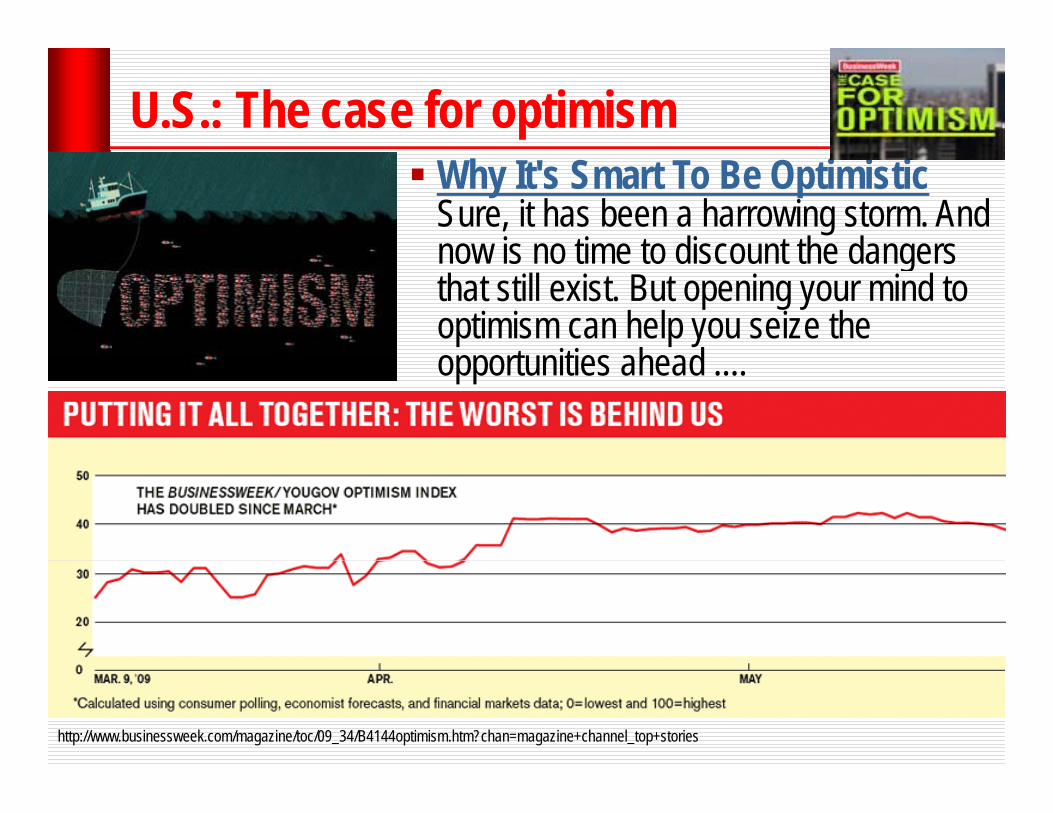
U.S.: The case for optimismWhy It's Smart To Be OptimisticSure, it has been a harrowing storm. And now is no time to discount the dangers now is no time to discount the dangers that still exist. But opening your mind to optimism can help you seize the
t iti h dopportunities ahead ....
http://www.businessweek.com/magazine/toc/09_34/B4144optimism.htm?chan=magazine+channel_top+stories
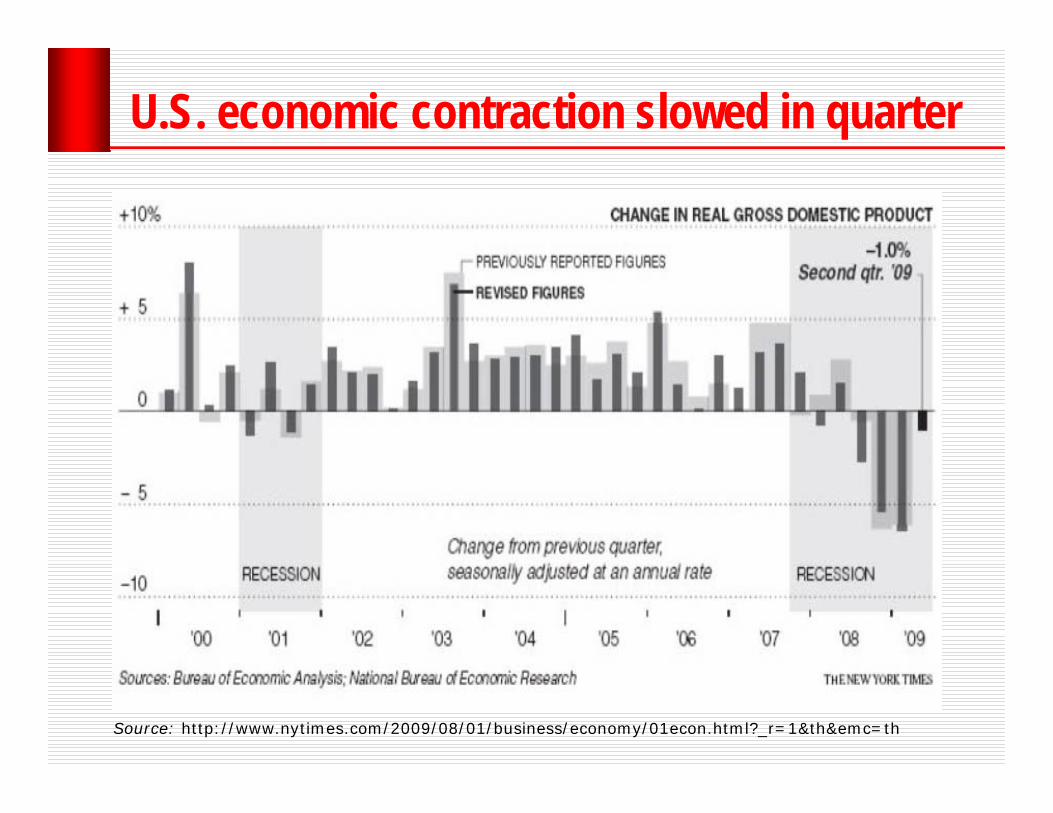
U.S. economic contraction slowed in quarter
Source: http://www.nytimes.com/2009/08/01/business/economy/01econ.html?_r=1&th&emc=th
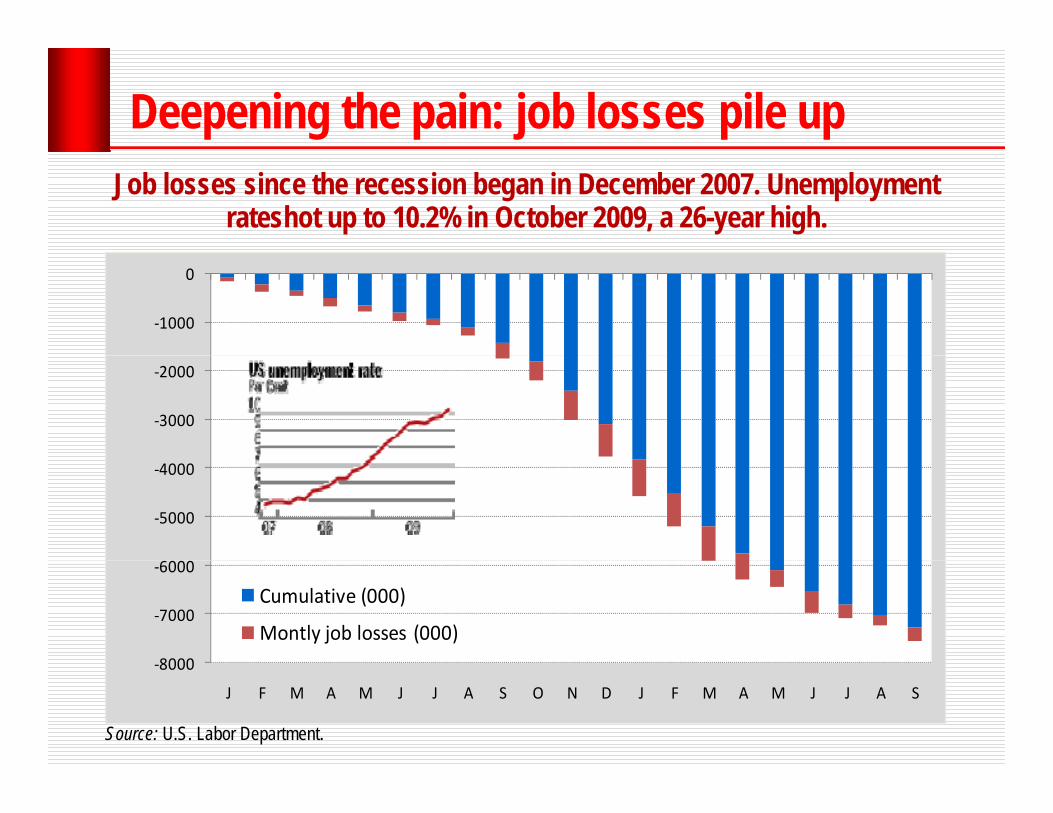
Deepening the pain: job losses pile up Job losses since the recession began in December 2007. Unemployment
rateshot up to 10.2% in October 2009, a 26-year high.
‐1000
0
‐3000
‐2000
‐5000
‐4000
8000
‐7000
‐6000
Cumulative (000)
Montly job losses (000)
Source: U.S. Labor Department.
‐8000
J F M A M J J A S O N D J F M A M J J A S
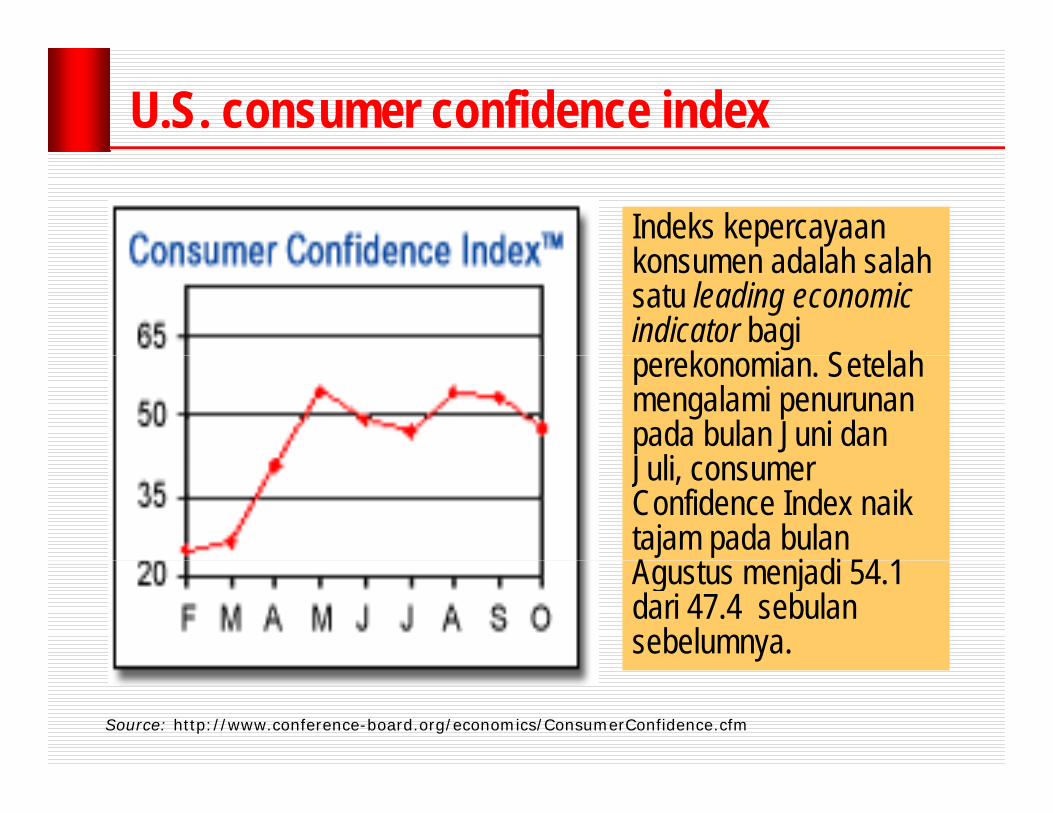
U.S. consumer confidence index
Indeks kepercayaan k d l h l h konsumen adalah salah satu leading economic indicator bagi
k i S t l h perekonomian. Setelah mengalami penurunan pada bulan Juni dan J li Juli, consumer Confidence Index naik tajam pada bulan A t j di 54 1 Agustus menjadi 54.1 dari 47.4 sebulan sebelumnya.
Source: http://www.conference-board.org/economics/ConsumerConfidence.cfm
BagianBagian IIIIPerekonomianPerekonomian IndonesiaIndonesiakk
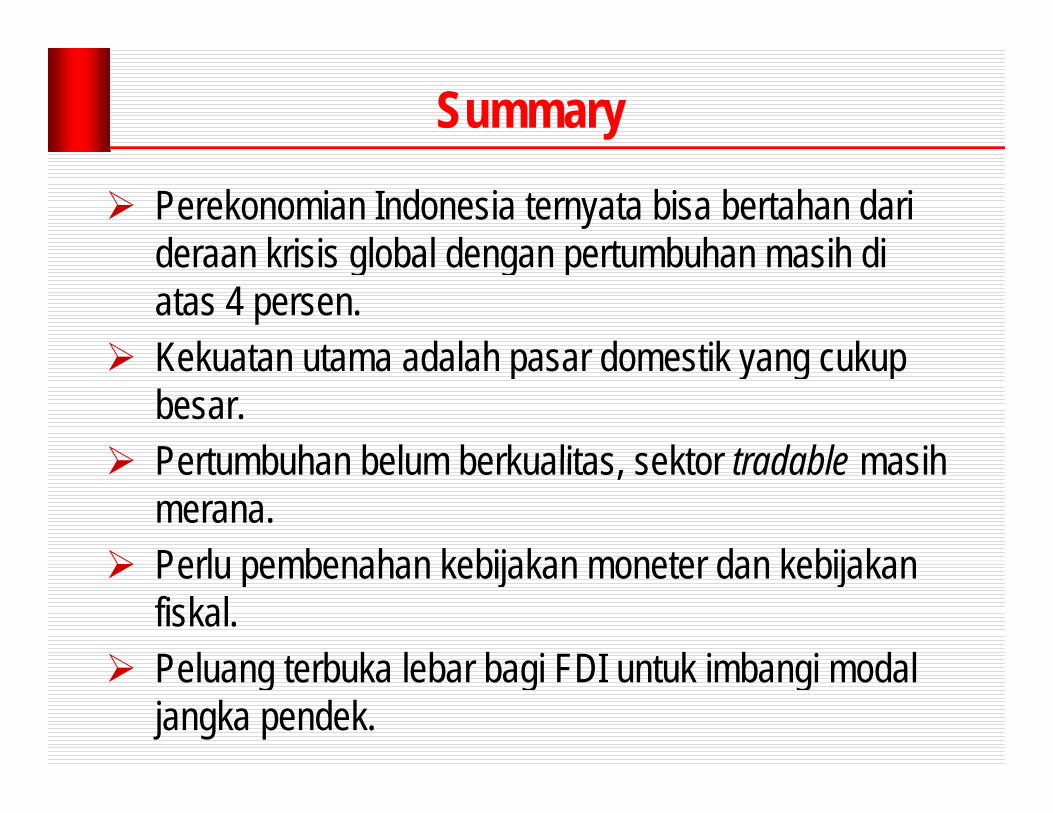
Summary
Perekonomian Indonesia ternyata bisa bertahan dari deraan krisis global dengan pertumbuhan masih di deraan krisis global dengan pertumbuhan masih di atas 4 persen.Kekuatan utama adalah pasar domestik yang cukup Kekuatan utama adalah pasar domestik yang cukup besar.Pertumbuhan belum berkualitas sektor tradable masih Pertumbuhan belum berkualitas, sektor tradable masih merana.Perlu pembenahan kebijakan moneter dan kebijakan Perlu pembenahan kebijakan moneter dan kebijakan fiskal.Peluang terbuka lebar bagi FDI untuk imbangi modal Peluang terbuka lebar bagi FDI untuk imbangi modal jangka pendek.
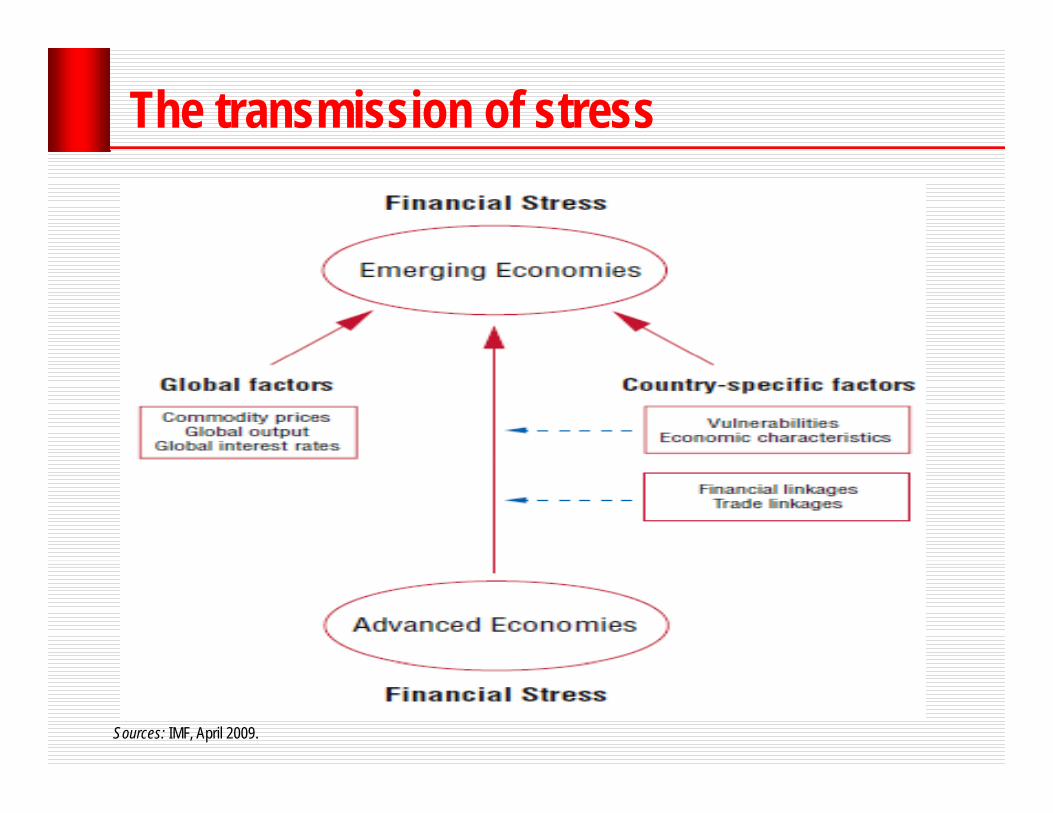
The transmission of stress
Sources: IMF, April 2009.
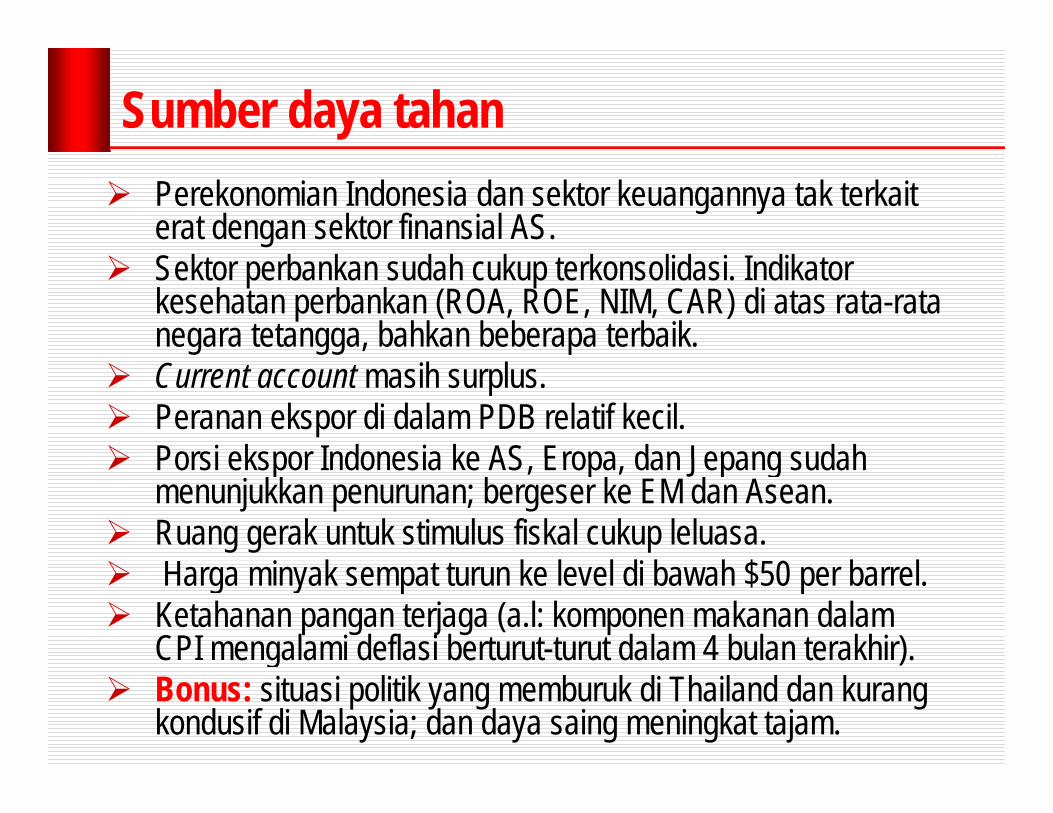
Sumber daya tahanPerekonomian Indonesia dan sektor keuangannya tak terkait erat dengan sektor finansial AS.Sektor perbankan sudah cukup terkonsolidasi. Indikator kesehatan perbankan (ROA, ROE, NIM, CAR) di atas rata-rata negara tetangga, bahkan beberapa terbaik.Current account masih surplus. Peranan ekspor di dalam PDB relatif kecil.Porsi ekspor Indonesia ke AS Eropa dan Jepang sudah Porsi ekspor Indonesia ke AS, Eropa, dan Jepang sudah menunjukkan penurunan; bergeser ke EM dan Asean.Ruang gerak untuk stimulus fiskal cukup leluasa.
$Harga minyak sempat turun ke level di bawah $50 per barrel.Ketahanan pangan terjaga (a.l: komponen makanan dalam CPI mengalami deflasi berturut-turut dalam 4 bulan terakhir).g )Bonus: situasi politik yang memburuk di Thailand dan kurang kondusif di Malaysia; dan daya saing meningkat tajam.

East Asia entered the current crisis East Asia entered the current crisis better prepared than it did the 1997 crisisbetter prepared than it did the 1997 crisisbetter prepared than it did the 1997 crisisbetter prepared than it did the 1997 crisis
(in percent of GDP unless indicated otherwise)
Source: The World Bank, East Asia Pacific Update, East Asia: Navigating the Perfect Storm, December 2008.
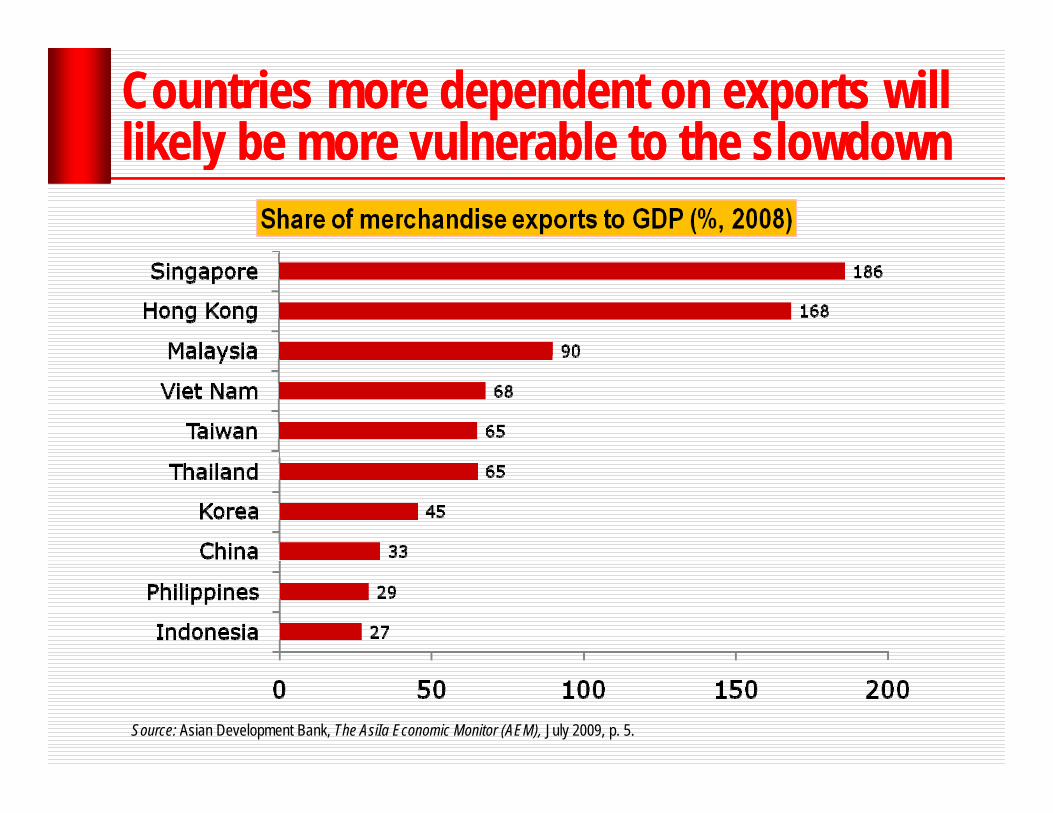
Countries more dependent on exports will Countries more dependent on exports will likely be more vulnerable to the slowdownlikely be more vulnerable to the slowdownlikely be more vulnerable to the slowdownlikely be more vulnerable to the slowdown
Source: Asian Development Bank, The AsiIa Economic Monitor (AEM), July 2009, p. 5.

Direction of trade: Asean and Indonesia
From Asean IndonesiaIngat: Peran Singapura !!!
From
To 2000 2007 2000 2007
Asean Indonesia
Developing Asia 37,4 41,2 33,1 37,1
China 3,7 8,9 4,2 8,1
Japan 12,6 9,4 22,1 18,1
United States 18 2 12 2 13 0 9 4United States 18,2 12,2 13,0 9,4
European Union 14,4 11,1 13,7 10,0
Others 13,7 17,2 13,7 17,3Sources: ADB, March 2009
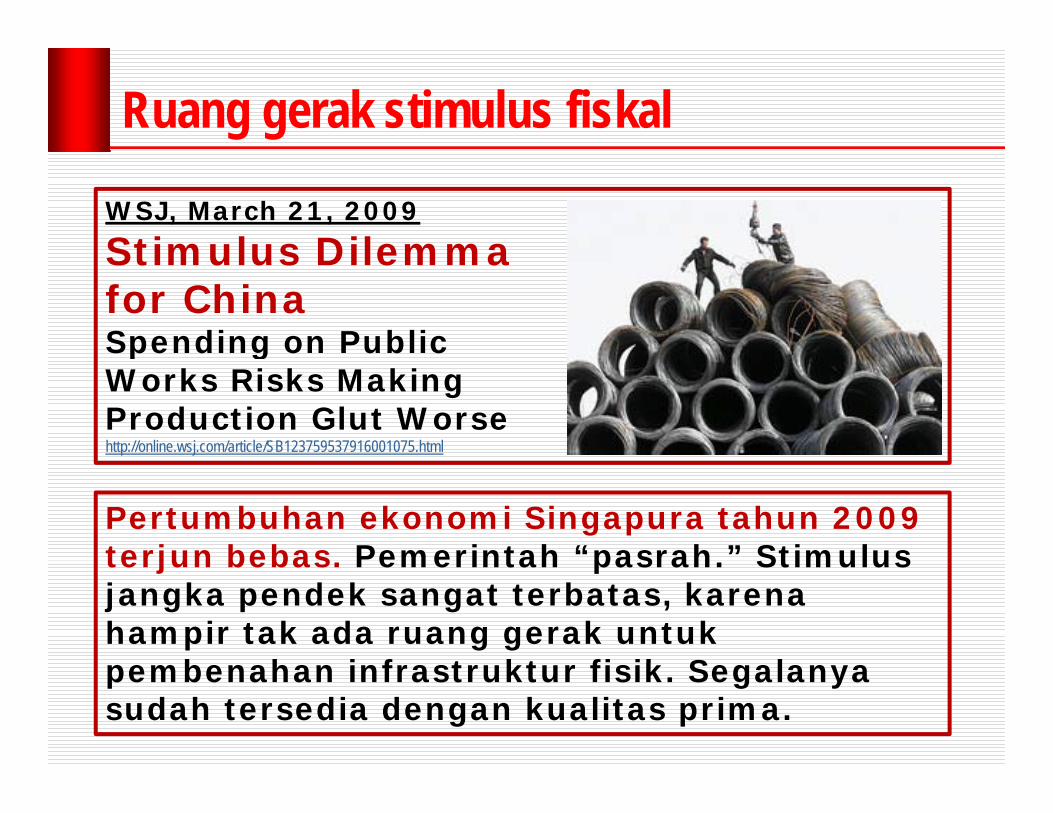
Ruang gerak stimulus fiskal
WSJ, March 21, 2009
Stimulus DilemmaStimulus Dilemmafor ChinaSpending on Public p gWorks Risks MakingProduction Glut Worsehttp://online.wsj.com/article/SB123759537916001075.html
Pertumbuhan ekonomi Singapura tahun 2009 terjun bebas Pemerintah “pasrah ” Stimulus terjun bebas. Pemerintah pasrah. Stimulus jangka pendek sangat terbatas, karena hampir tak ada ruang gerak untuk
b h i f t kt fi ik S l pembenahan infrastruktur fisik. Segalanya sudah tersedia dengan kualitas prima.
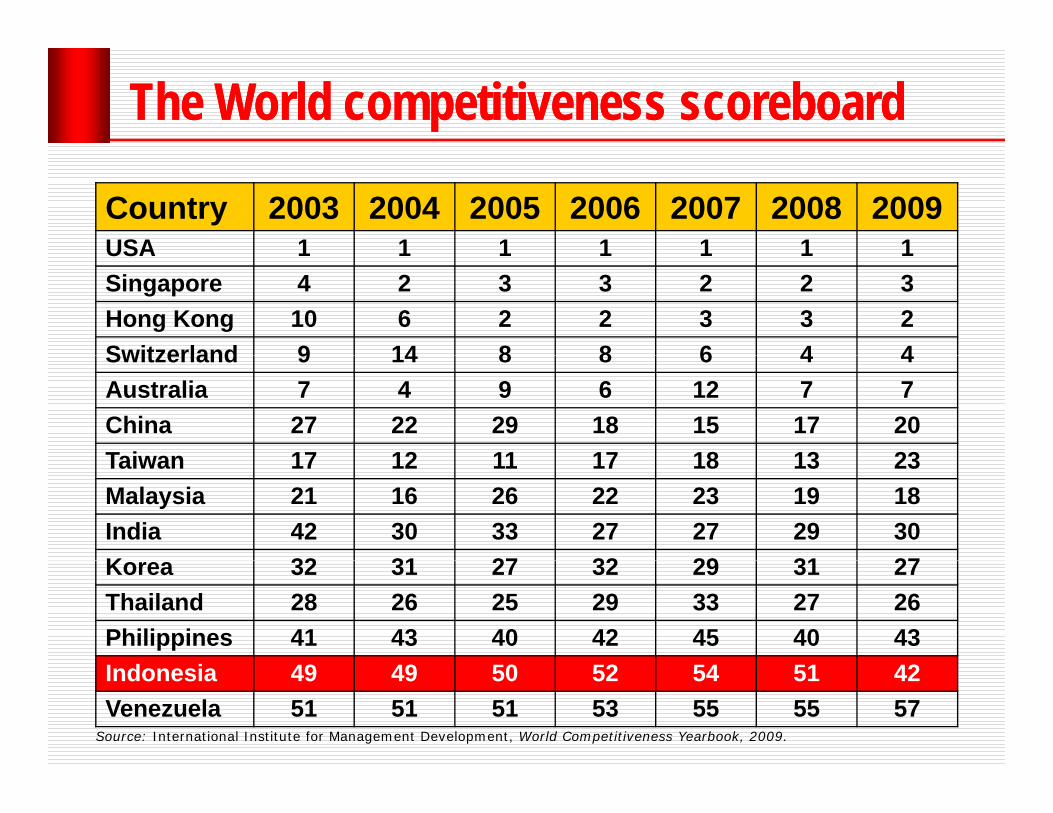
The World competitiveness scoreboardThe World competitiveness scoreboard
Country 2003 2004 2005 2006 2007 2008 2009USA 1 1 1 1 1 1 1USA 1 1 1 1 1 1 1Singapore 4 2 3 3 2 2 3Hong Kong 10 6 2 2 3 3 2Switzerland 9 14 8 8 6 4 4Switzerland 9 14 8 8 6 4 4Australia 7 4 9 6 12 7 7China 27 22 29 18 15 17 20Taiwan 17 12 11 17 18 13 23Taiwan 17 12 11 17 18 13 23Malaysia 21 16 26 22 23 19 18India 42 30 33 27 27 29 30K 32 31 27 32 29 31 27Korea 32 31 27 32 29 31 27Thailand 28 26 25 29 33 27 26Philippines 41 43 40 42 45 40 43Indonesia 49 49 50 52 54 51 42Venezuela 51 51 51 53 55 55 57
Source: International Institute for Management Development, World Competitiveness Yearbook, 2009.
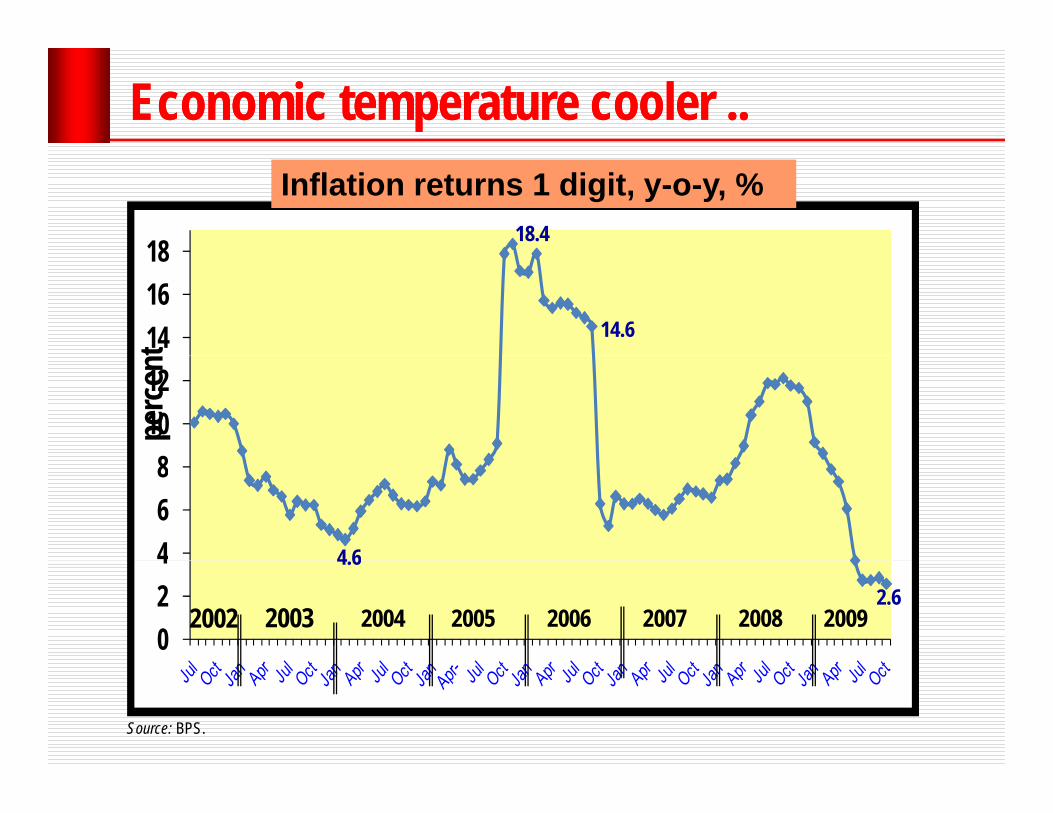
Economic temperature Economic temperature coolercooler ....
18
Inflation returns 1 digit, y-o-y, %18.4
141618
t 14.6
81012
perc
ent
468
4 6
024
2002 2003 2004
4.6
2005 2006 2.6
2007 2008 2009
Source: BPS.
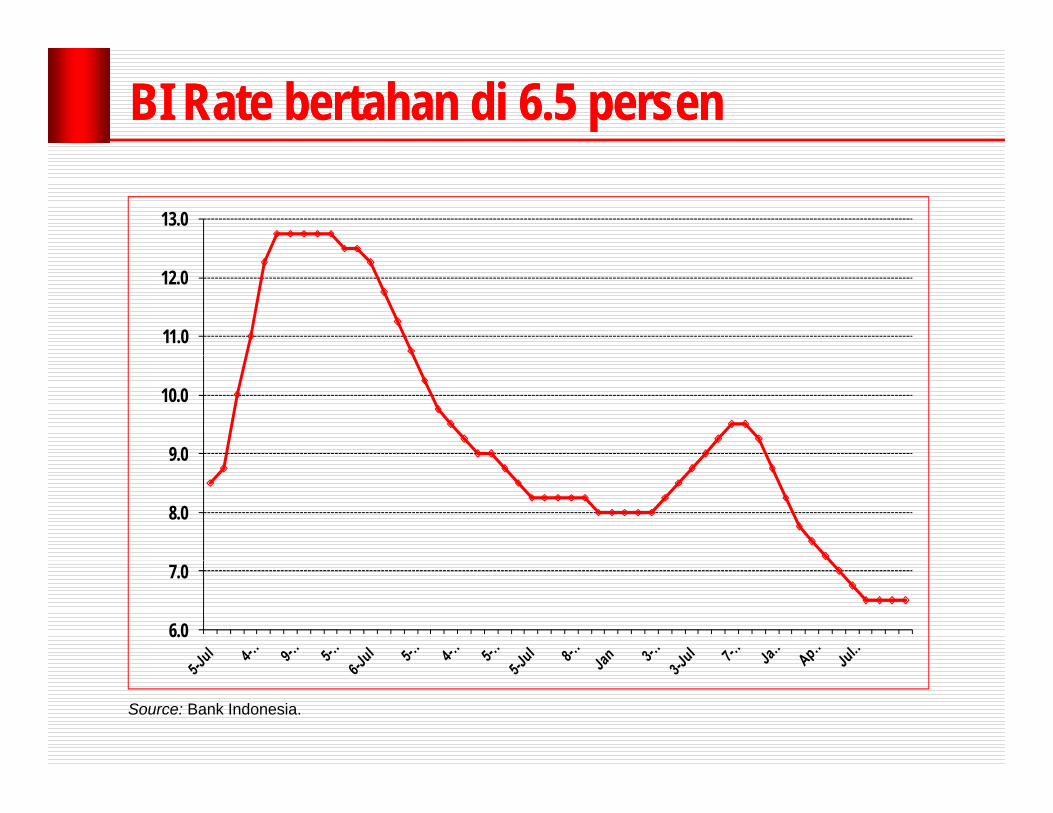
BI Rate BI Rate bertahan di 6.5 persenbertahan di 6.5 persen
13.0
11.0
12.0
9 0
10.0
8.0
9.0
6.0
7.0
Source: Bank Indonesia.
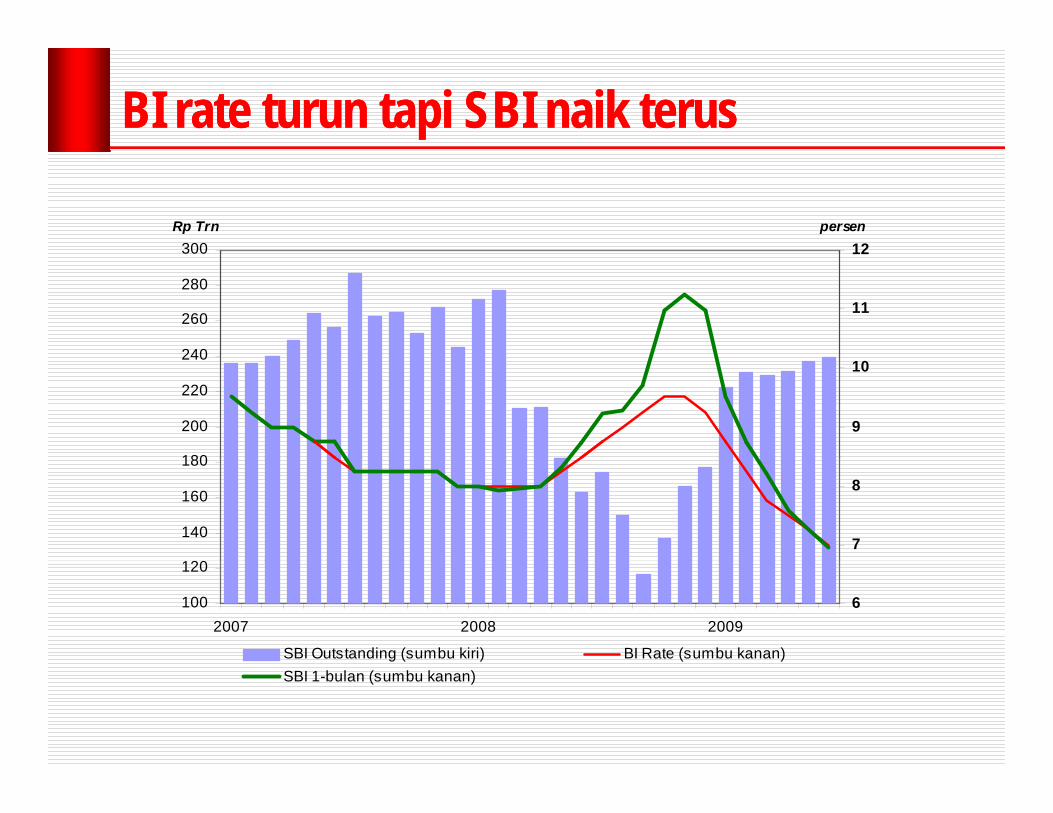
BI rate BI rate turunturun tapitapi SBI SBI naiknaik terusterus
300 12
Rp Trn persen
240
260
280
300
11
12
180
200
220
240
9
10
120
140
160
180
7
8
100
120
2007 2008 20096
SBI Outstanding (sumbu kiri) BI Rate (sumbu kanan)SBI 1-bulan (sumbu kanan)

PertumbuhanPertumbuhan suplaisuplai uanguang relatifrelatif rendahrendah
40
50YoY%
20
30
10
20
-10
02005 2006 2007 2008 2009
M2 M1 M0-20
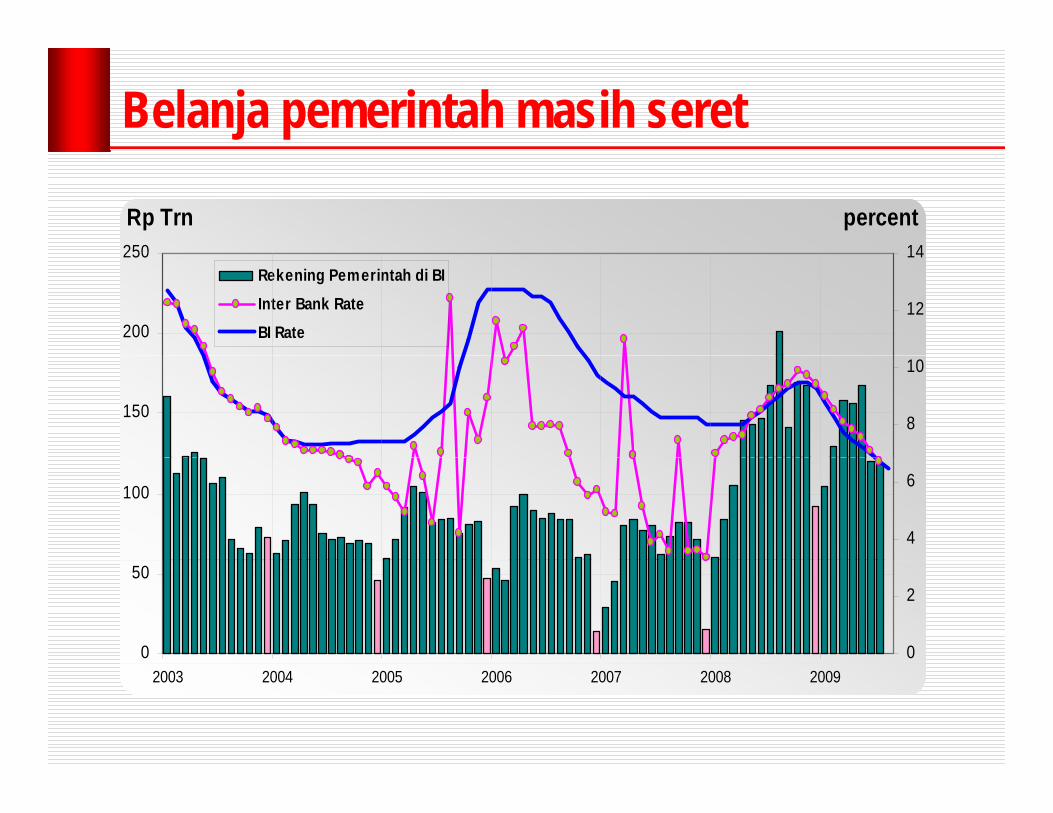
Belanja pemerintah masih seret
250 14
percentRp Trn
200
250
12
14Rekening Pemerintah di BIInter Bank RateBI Rate
1508
10
100
4
6
0
50
0
2
2003 2004 2005 2006 2007 2008 2009
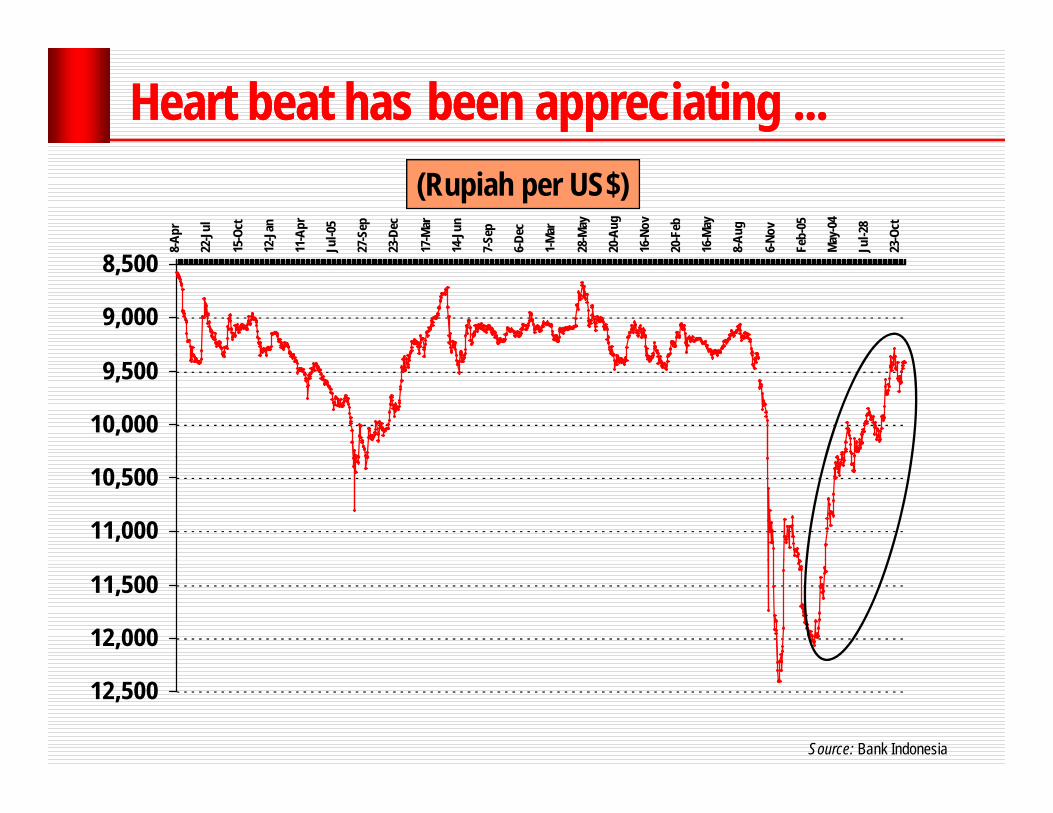
Heart beat has been Heart beat has been appreciating ...appreciating ...8-
Apr
22-J
ul
15-O
ct
12-J
an
11-A
pr
Jul-0
5
27-S
ep
23-D
ec
17-M
ar
14-J
un
7-Se
p
6-De
c
1-M
ar
28-M
ay
20-A
ug
16-N
ov
20-F
eb
16-M
ay
8-Au
g
6-No
v
Feb-
05
May
-04
Jul-2
8
23-O
ct
(Rupiah per US$)
8,500
9,000
9,500
10,000
10,500
11,000
11,500
12,000
12,500
Source: Bank Indonesia
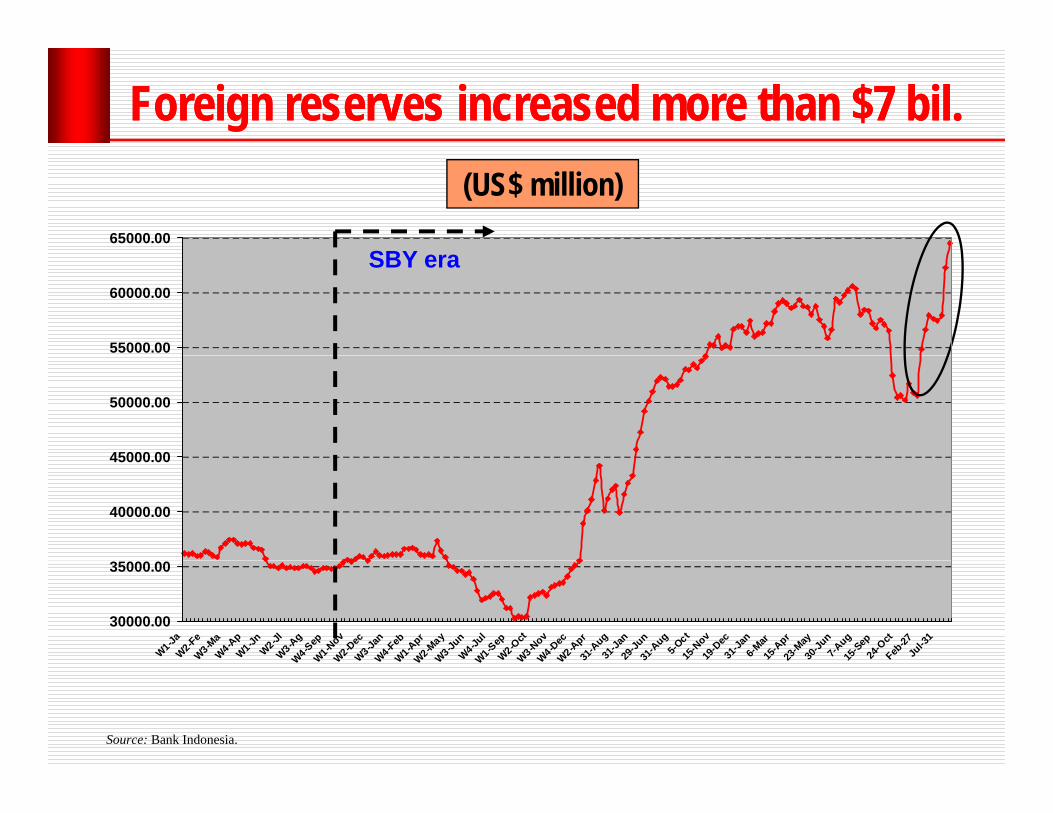
Foreign reserves Foreign reserves increasedincreased more than more than $$77 bilbil..
65000.00SBY
(US$ million)
55000.00
60000.00
SBY era
45000 00
50000.00
40000.00
45000.00
30000.00
35000.00
W1-JaW2-FeW3-M
aW4-A
pW1-JnW2-JlW3-A
gW4-S
epW1-N
ovW2-D
ecW3-Ja
nW4-FebW1-A
prW2-M
ayW3-Ju
nW4-Ju
lW1-S
epW2-O
ctW3-N
ovW4-D
ecW2-A
pr31
-Aug
31-Ja
n29
-Jun
31-A
ug5-O
ct15
-Nov
19-D
ec31
-Jan
6-Mar
15-A
pr23
-May
30-Ju
n7-A
ug15
-Sep
24-O
ctFeb
-27Ju
l-31
W W W
Source: Bank Indonesia.
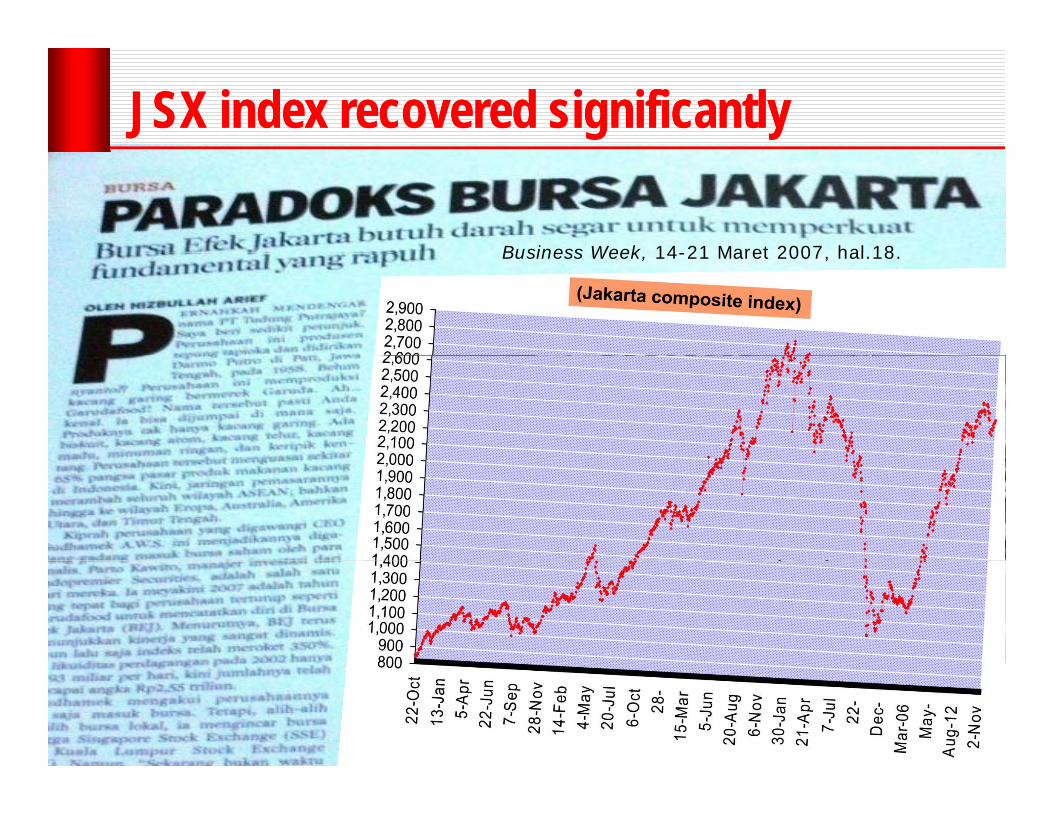
JSX index JSX index recovered recovered significantlysignificantly
Business Week 14-21 Maret 2007 hal 18Business Week, 14-21 Maret 2007, hal.18.

Balance of paymentsBalance of payments (US$ million)(US$ million)2008 Q3‐08 Q4‐08 Q1‐09 Q2‐09 H1‐09
I. CURRENT ACCOUNT 285 ‐891 ‐684 2,885 3,104 5,989
A G d t (T d B l ) 22 916 5 771 4 166 6 969 8 705 15 674A. Goods, net (Trade Balance) 22,916 5,771 4,166 6,969 8,705 15,674
1. Exports, f.o.b. 139,606 38,081 29,768 24,205 27,509 51,714
2. Imports, f.o.b. ‐116,690 ‐32,309 ‐25,603 ‐17,236 ‐18,805 36,041
B S i 12 745 3 195 3 288 2 535 3 097 5 632B. Services, net ‐12,745 ‐3,195 ‐3,288 ‐2,535 ‐3,097 ‐5,632
C. Income, net ‐15,271 ‐4,803 ‐2,879 ‐2,672 ‐3,714 6,386
D. Current Transfers, net 5,385 1,336 1,317 1,122 1,210 2,332
II. CAPITAL & FINANCIAL ACCOUNT ‐1,354 904 ‐3,340 1,750 ‐2,414 ‐664
A. Capital Account 294 187 29 19 29 48
B. Financial Account ‐1,648 717 ‐3,368 1,731 ‐2,443 ‐712
1. Direct investment 2,799 404 2,061 1,660 9 1,669
2. Portfolio investment 1,721 ‐74 ‐ 4,377 1,859 2,003 3,862
3. Other investment ‐6,167 387 ‐1,052 ‐1,788 ‐4,455 ‐6,243
Source: Bank Indonesia.
III. ERRORS & OMISSIONS ‐876 ‐103 ‐188 ‐680 362 ‐318
IV. RESERVES &RELATED ITEMS 1,945 89 4,212 ‐3,955 ‐1,052 ‐5,007
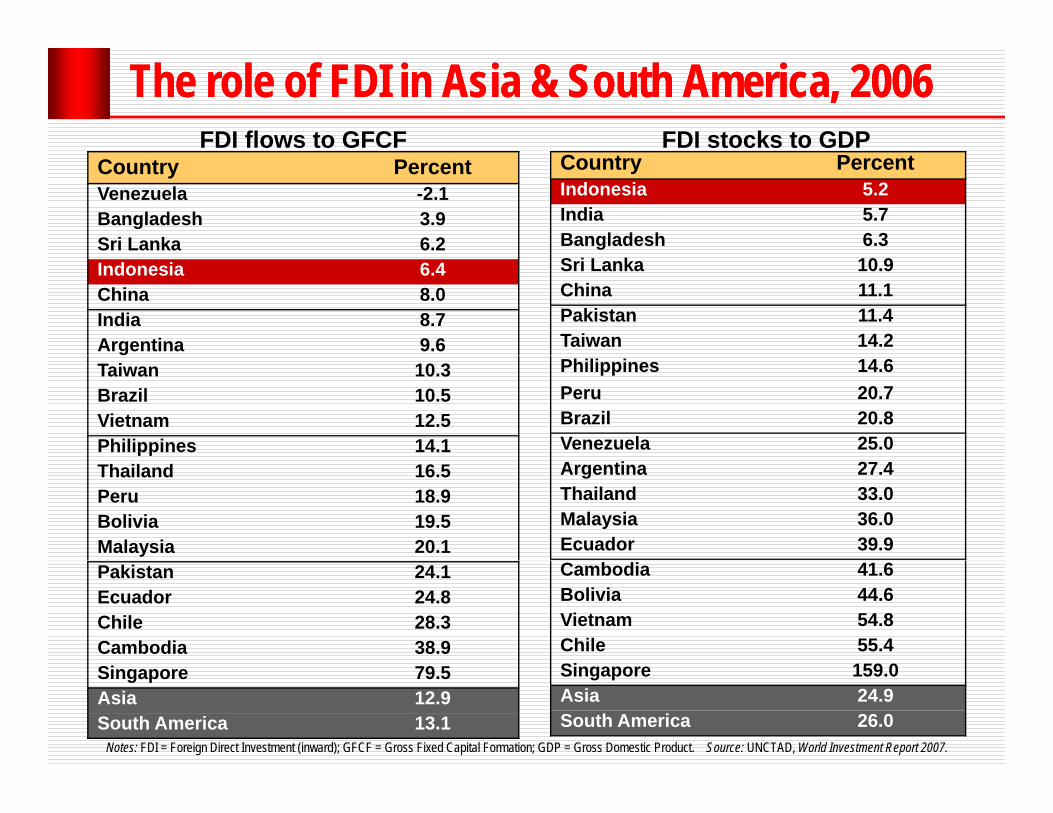
The role of FDI in Asia & South America, 2006The role of FDI in Asia & South America, 2006FDI flows to GFCF FDI stocks to GDP
Country PercentVenezuela -2.1Bangladesh 3.9Sri Lanka 6.2
Country PercentIndonesia 5.2India 5.7Bangladesh 6.3
Indonesia 6.4China 8.0India 8.7Argentina 9.6
Sri Lanka 10.9China 11.1Pakistan 11.4Taiwan 14.2
Taiwan 10.3Brazil 10.5Vietnam 12.5Philippines 14.1
Philippines 14.6Peru 20.7Brazil 20.8Venezuela 25.0
Thailand 16.5Peru 18.9Bolivia 19.5Malaysia 20.1
Argentina 27.4Thailand 33.0Malaysia 36.0Ecuador 39.9
Pakistan 24.1Ecuador 24.8Chile 28.3Cambodia 38.9
Cambodia 41.6Bolivia 44.6Vietnam 54.8Chile 55.4S 1 9 0
Notes: FDI = Foreign Direct Investment (inward); GFCF = Gross Fixed Capital Formation; GDP = Gross Domestic Product. Source: UNCTAD, World Investment Report 2007.
Singapore 79.5Asia 12.9South America 13.1
Singapore 159.0Asia 24.9South America 26.0
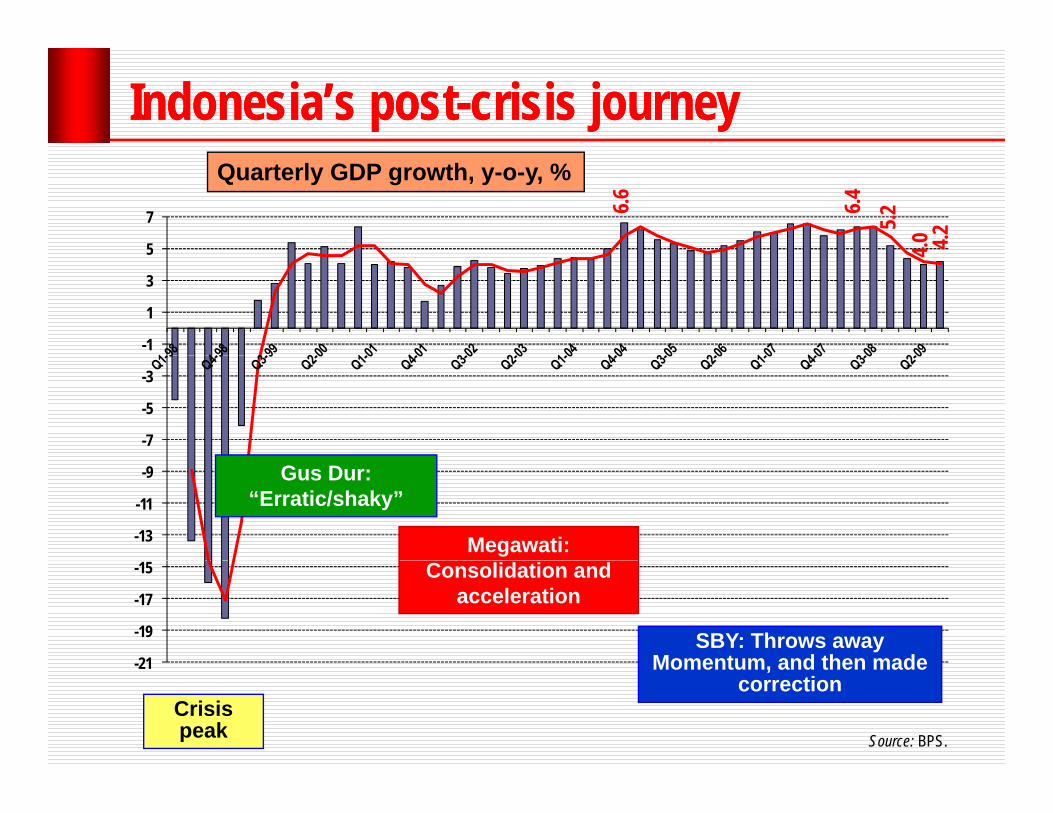
Indonesia’s postIndonesia’s post--crisis journeycrisis journey
5
7 6.6
Quarterly GDP growth, y-o-y, %
5.24.0
6.4
4.2
-1
1
3
5 4
-7
-5
-3
-13
-11
-9 Gus Dur: “Erratic/shaky”
Megawati:
21
-19
-17
-15 Consolidation and acceleration
SBY: Throws awayMomentum and then made-21
Source: BPS.
Crisis peak
Momentum, and then made correction
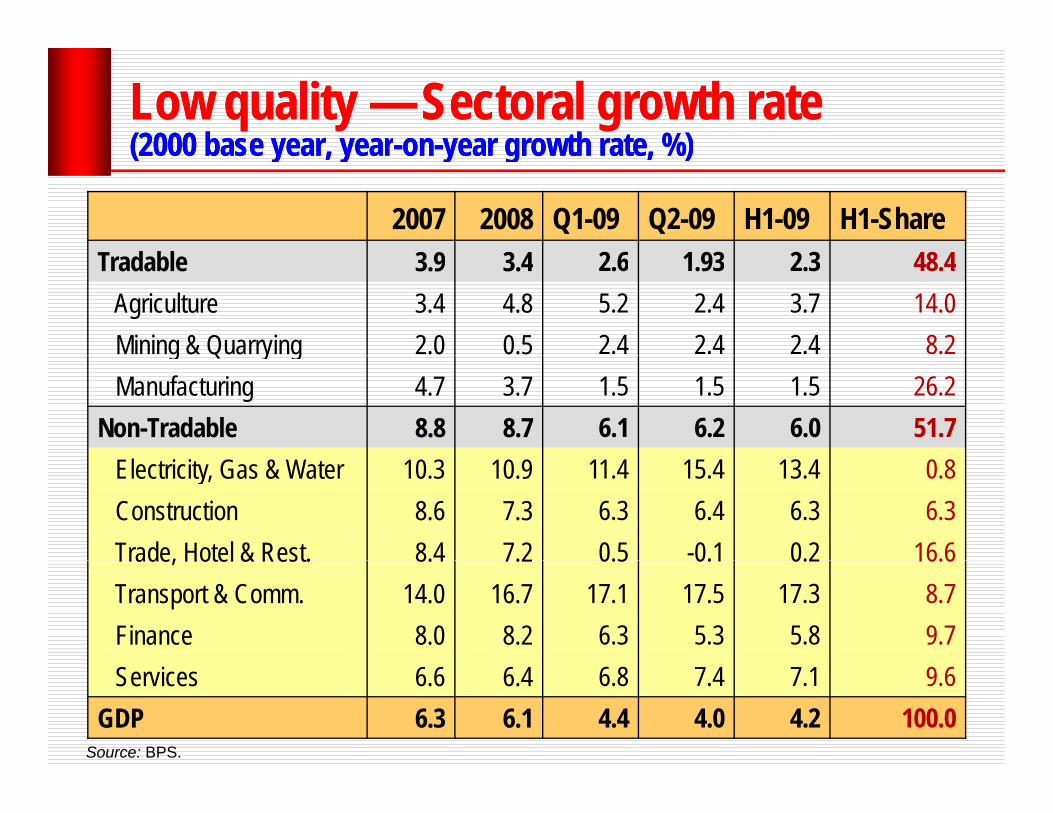
Low quality Low quality —— SectoralSectoral growth rategrowth rate(2000 base year year(2000 base year year--onon--year growth rate %)year growth rate %)(2000 base year, year(2000 base year, year onon year growth rate, %)year growth rate, %)
2007 2008 Q1-09 Q2-09 H1-09 H1-ShareT d bl 3 9 3 4 2 6 1 93 2 3 48 4Tradable 3.9 3.4 2.6 1.93 2.3 48.4
Agriculture 3.4 4.8 5.2 2.4 3.7 14.0Mining & Quarrying 2.0 0.5 2.4 2.4 2.4 8.2g Q y gManufacturing 4.7 3.7 1.5 1.5 1.5 26.2
Non-Tradable 8.8 8.7 6.1 6.2 6.0 51.7Electricity, Gas & Water 10.3 10.9 11.4 15.4 13.4 0.8Construction 8.6 7.3 6.3 6.4 6.3 6.3Trade, Hotel & Rest. 8.4 7.2 0.5 -0.1 0.2 16.6Trade, Hotel & Rest. 8.4 7.2 0.5 0.1 0.2 16.6Transport & Comm. 14.0 16.7 17.1 17.5 17.3 8.7Finance 8.0 8.2 6.3 5.3 5.8 9.7Services 6.6 6.4 6.8 7.4 7.1 9.6
GDP 6.3 6.1 4.4 4.0 4.2 100.0Source: BPS.

Low quality Low quality growth, 2000growth, 2000--2002009*9* (%)(%)
10
Non-tradable8
Non-tradable
4
6GDP
2Tradable
0
2000 2001 2002 2003 2004 2005 2006 2007 2008 2009
* January-June.Source: BPS.
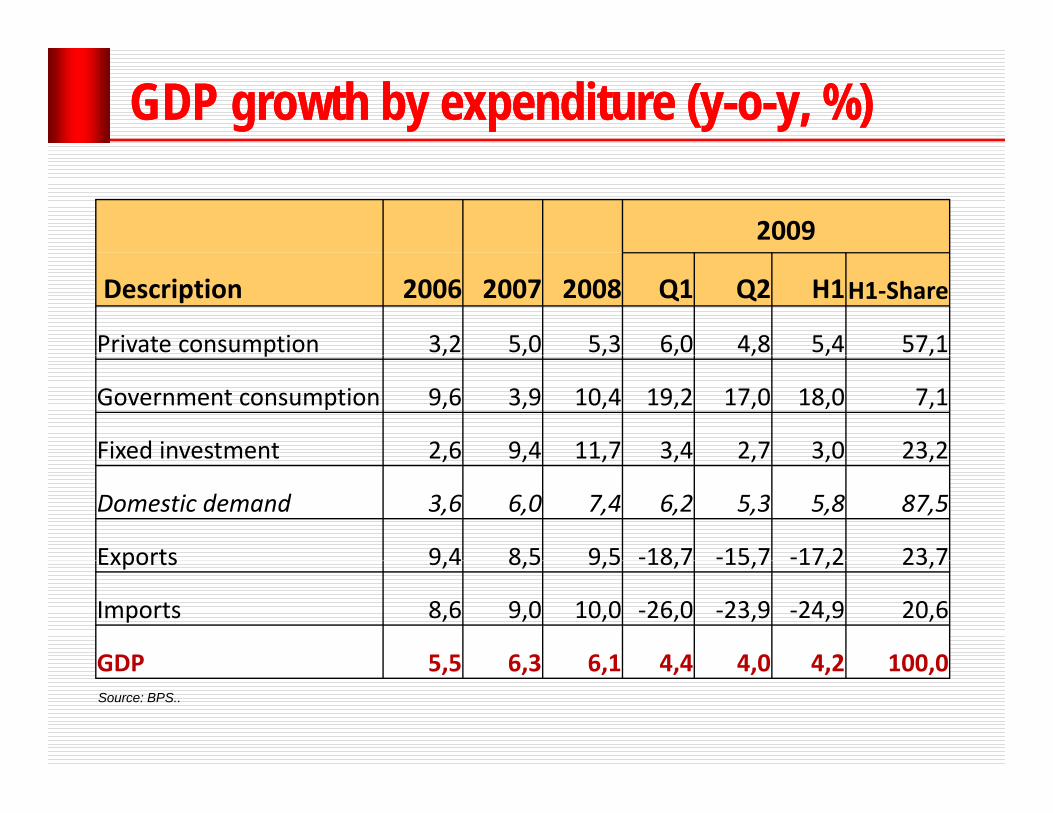
GDP growth by expenditure (yGDP growth by expenditure (y--oo--y, %)y, %)
2009
Description 2006 2007 2008 Q1 Q2 H1H1‐Share
Private consumption 3,2 5,0 5,3 6,0 4,8 5,4 57,1p , , , , , , ,
Government consumption 9,6 3,9 10,4 19,2 17,0 18,0 7,1
Fixed investment 2,6 9,4 11,7 3,4 2,7 3,0 23,2Fixed investment 2,6 9,4 11,7 3,4 2,7 3,0 23,2
Domestic demand 3,6 6,0 7,4 6,2 5,3 5,8 87,5
Exports 9 4 8 5 9 5 ‐18 7 ‐15 7 ‐17 2 23 7Exports 9,4 8,5 9,5 18,7 15,7 17,2 23,7
Imports 8,6 9,0 10,0 ‐26,0 ‐23,9 ‐24,9 20,6
GDP 5 5 6 3 6 1 4 4 4 0 4 2 100 0Source: BPS..
GDP 5,5 6,3 6,1 4,4 4,0 4,2 100,0
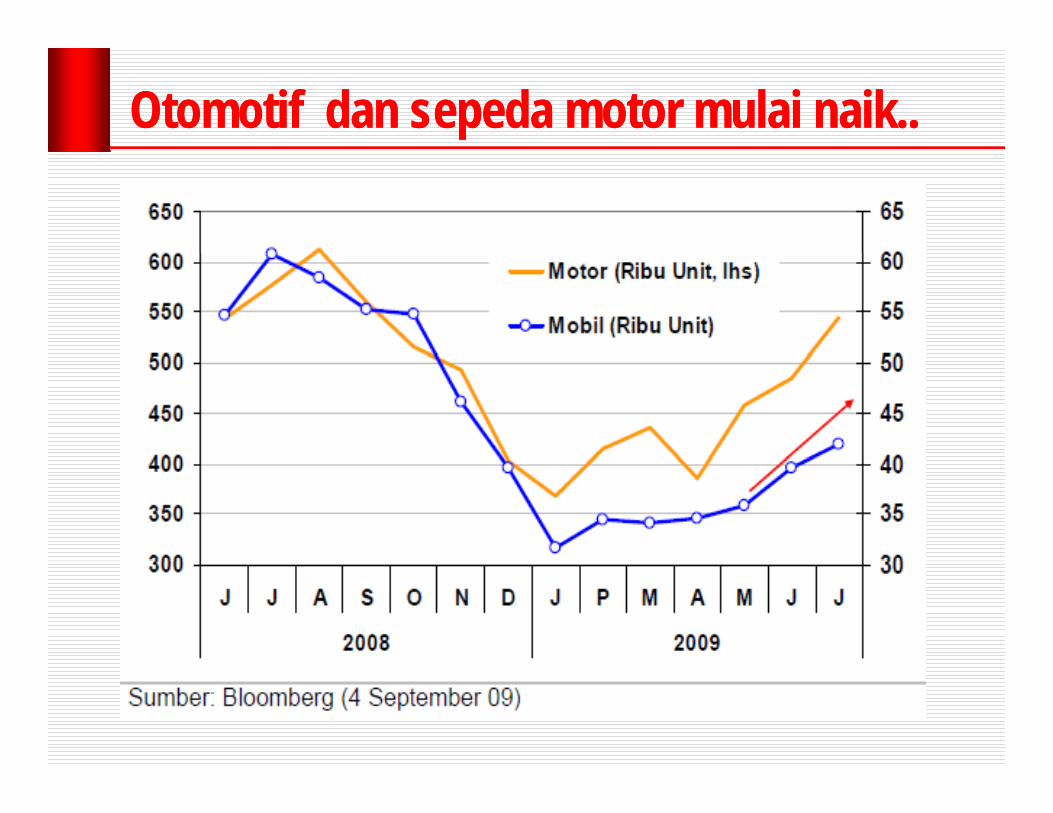
Otomotif Otomotif dandan sepedasepeda motor motor mulai naik..mulai naik..
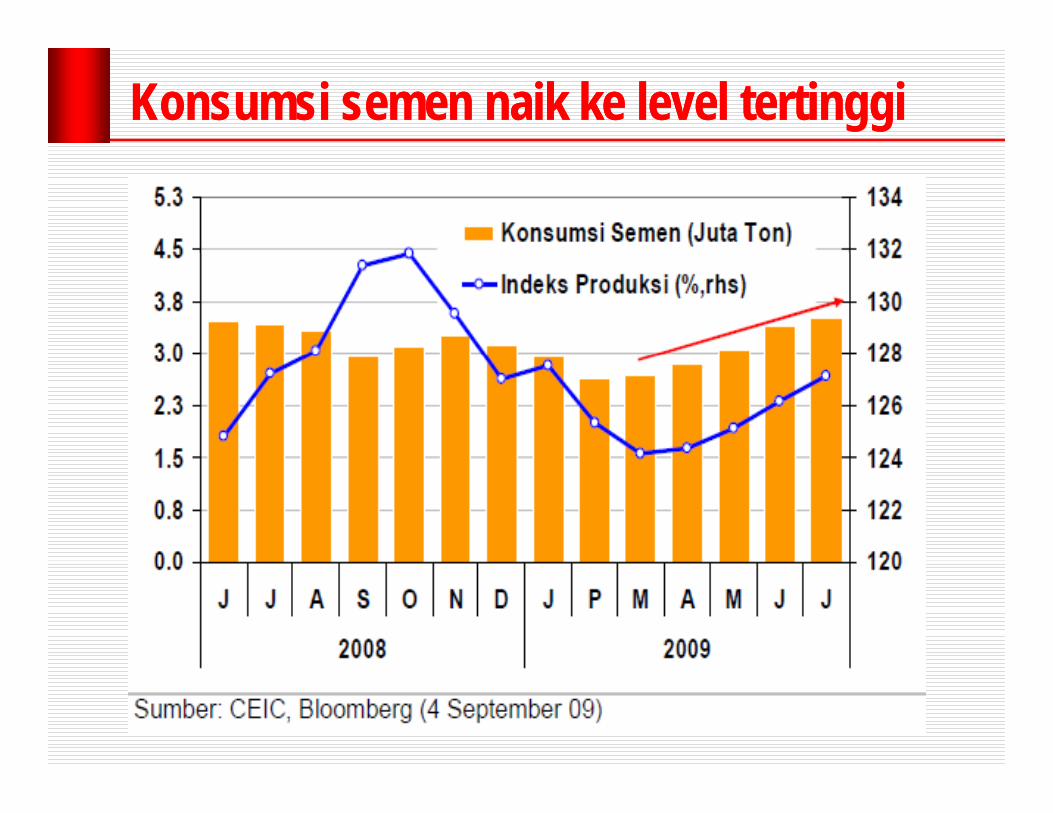
Konsumsi semen Konsumsi semen naiknaik keke level level tertinggitertinggi
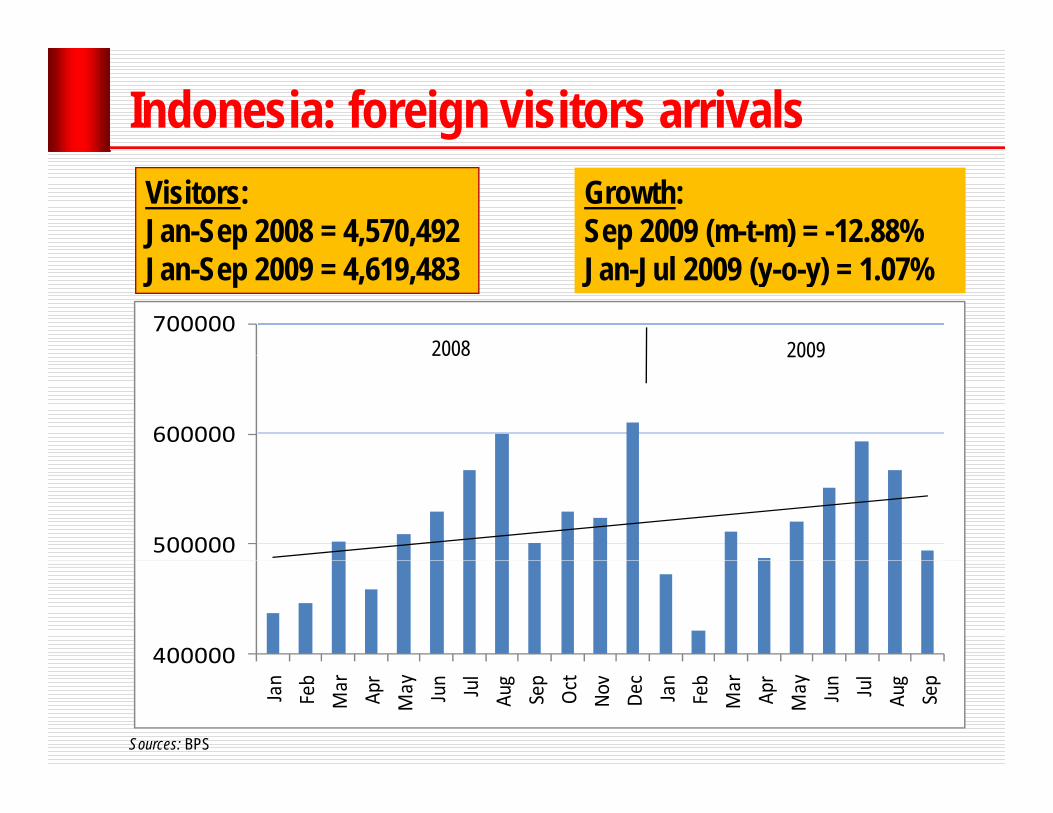
Indonesia: foreign visitors arrivalsVisitors:Jan-Sep 2008 = 4,570,492
Growth:Sep 2009 (m-t-m) = -12.88%
700000
Jan-Sep 2009 = 4,619,483 Jan-Jul 2009 (y-o-y) = 1.07%
2008 2009
600000
2008 2009
500000
400000
Sources: BPS
00000
Jan
Feb
Mar
Apr
May Jun Jul
Aug
Sep
Oct
Nov
Dec
Jan
Feb
Mar
Apr
May Jun Jul
Aug
Sep

Indeks tendensi konsumen
110
100
90
Q3-09 is prediction.Source: BPS.
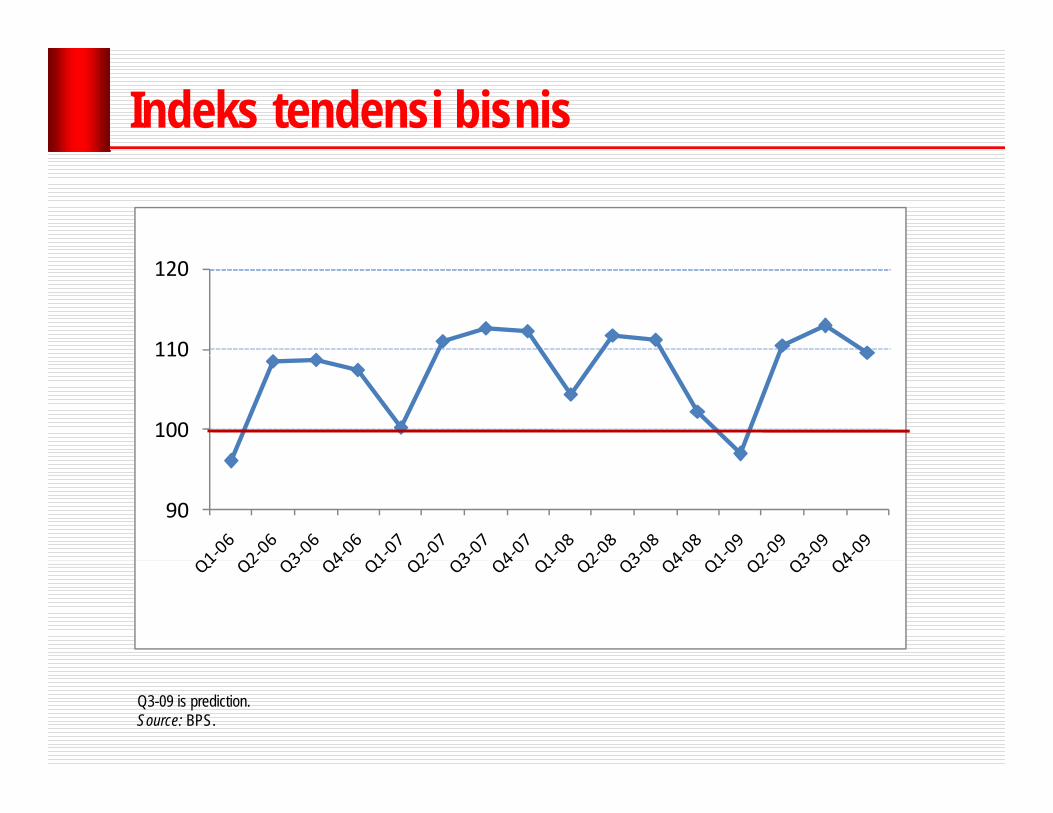
Indeks tendensi bisnis
110
120
100
110
90
Q3-09 is prediction.Source: BPS.
BagianBagian IIIIIILiingkunganLiingkungan PolitikPolitikLiingkunganLiingkungan PolitikPolitik

Decoupling between politics and Decoupling between politics and economic activities?economic activities?economic activities?economic activities?
Jakarta International Java Jazz Festival, held on 6-8 March 2009. The festival's 19 stages featured more than 300 performances. There isn't a jazz festival larger than Java Jazz Festival in this part of the world.
Approximately 1500 delegates from 35 countries attended the 5th World Islamic Economic Forum, i J k t 1 4 M h 2009in Jakarta, 1-4 March 2009.
The 42th Annual Meeting of the Board of Governors of the Asian Development Bank will be held in Bali, 4‐5 May 2009.
World Ocean Conference,
The Seminar Series and other ancillary meetings will commence from 2 May 2009.
to be held in Manado on May 11-14, 2009.
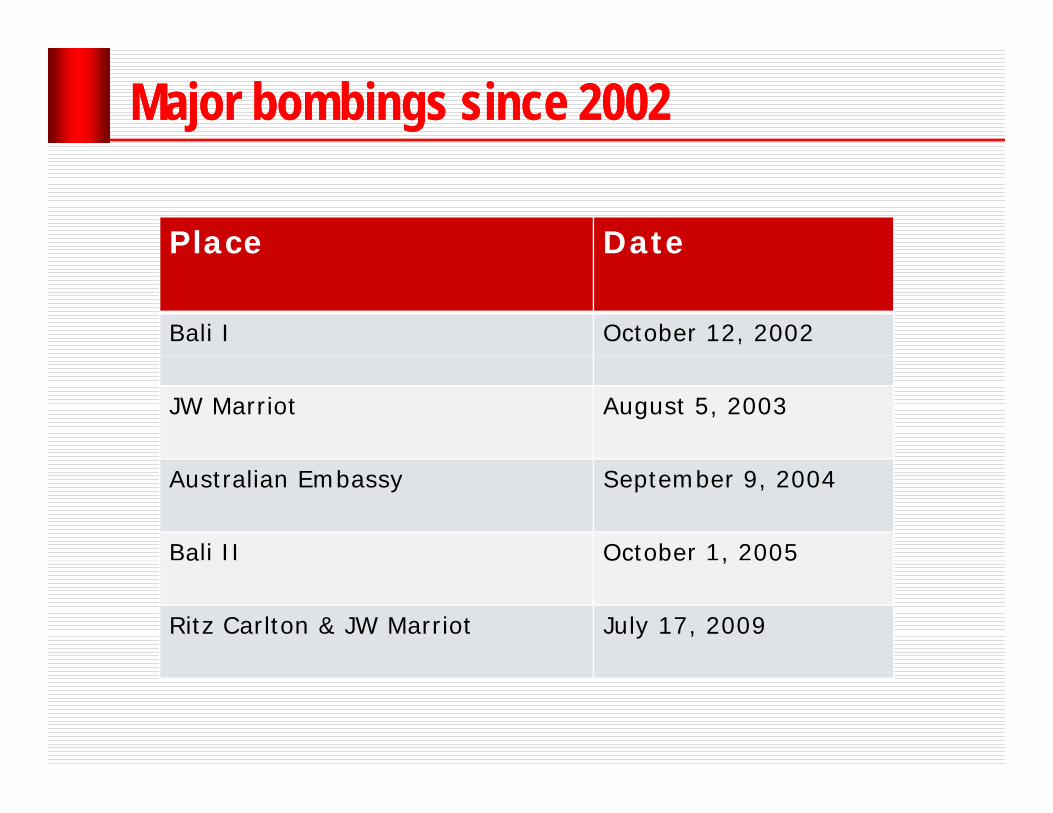
Major bombings since 2002Major bombings since 2002
Place DatePlace Date
Bali I October 12, 2002
JW Marriot August 5, 2003
Australian Embassy September 9, 2004
Bali II October 1, 2005a Octobe , 005
Ritz Carlton & JW Marriot July 17, 2009
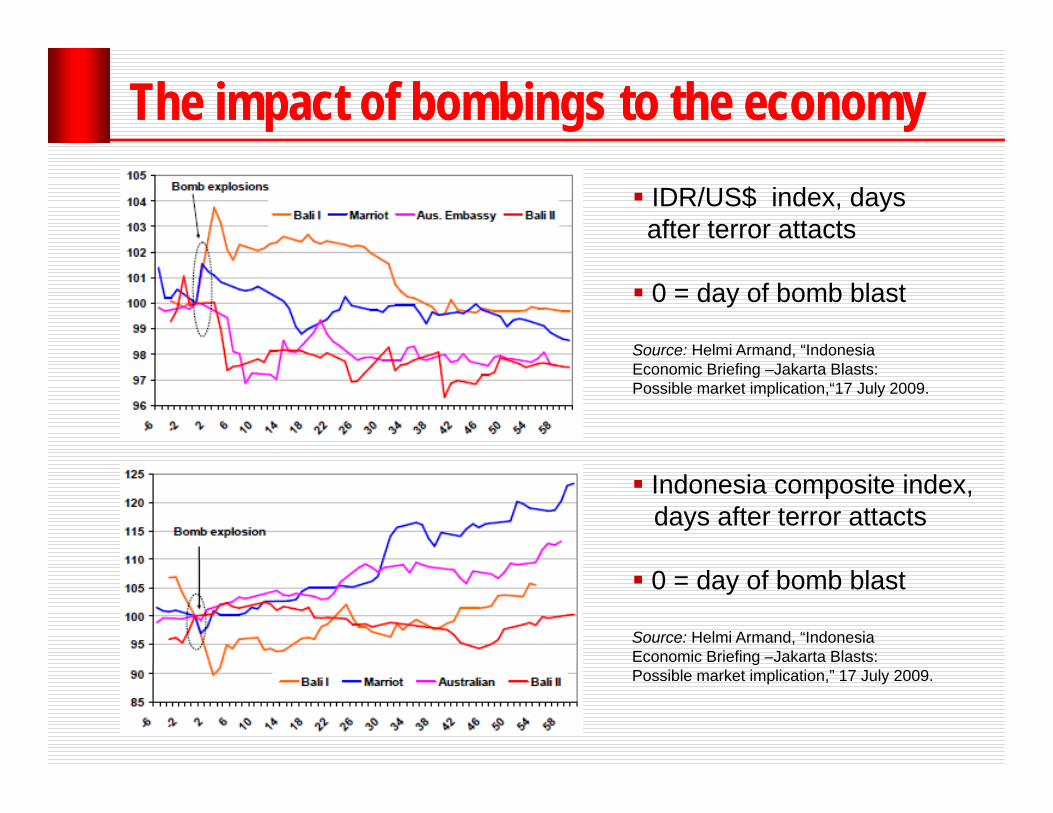
The impact of boThe impact of bombingsmbings to the economyto the economyIDR/US$ index, days after terror attacts
0 = day of bomb blast
Source: Helmi Armand, “Indonesia Sou ce e a d, do es aEconomic Briefing –Jakarta Blasts: Possible market implication,“17 July 2009.
Indonesia composite index,days after terror attacts
0 = day of bomb blast
Source: Helmi Armand, “Indonesia Economic Briefing –Jakarta Blasts: gPossible market implication,” 17 July 2009.
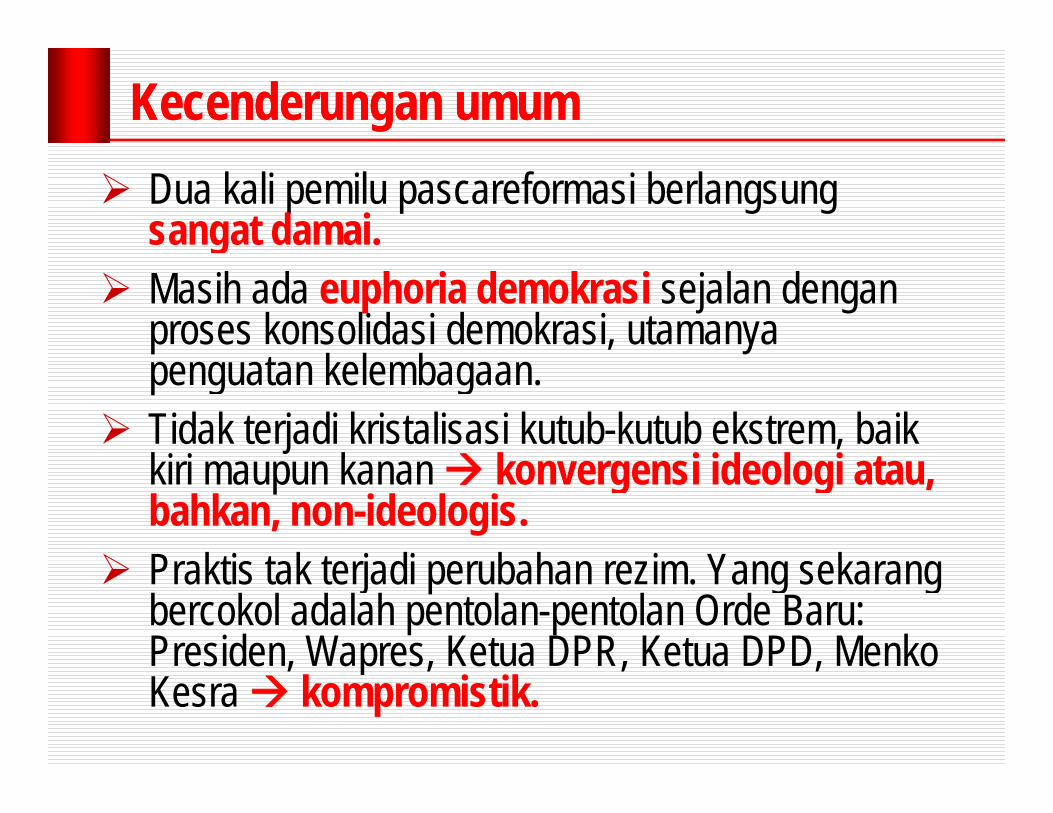
KecenderunganKecenderungan umumumumDua kali pemilu pascareformasi berlangsung sangat damai.gMasih ada euphoria demokrasi sejalan dengan proses konsolidasi demokrasi, utamanya
t k l bpenguatan kelembagaan.Tidak terjadi kristalisasi kutub-kutub ekstrem, baik ki i k k i id l i t kiri maupun kanan konvergensi ideologi atau, bahkan, non-ideologis.P kti t k t j di b h i Y k Praktis tak terjadi perubahan rezim. Yang sekarang bercokol adalah pentolan-pentolan Orde Baru: Presiden, Wapres, Ketua DPR, Ketua DPD, Menko Presiden, Wapres, Ketua DPR, Ketua DPD, Menko Kesra kompromistik.
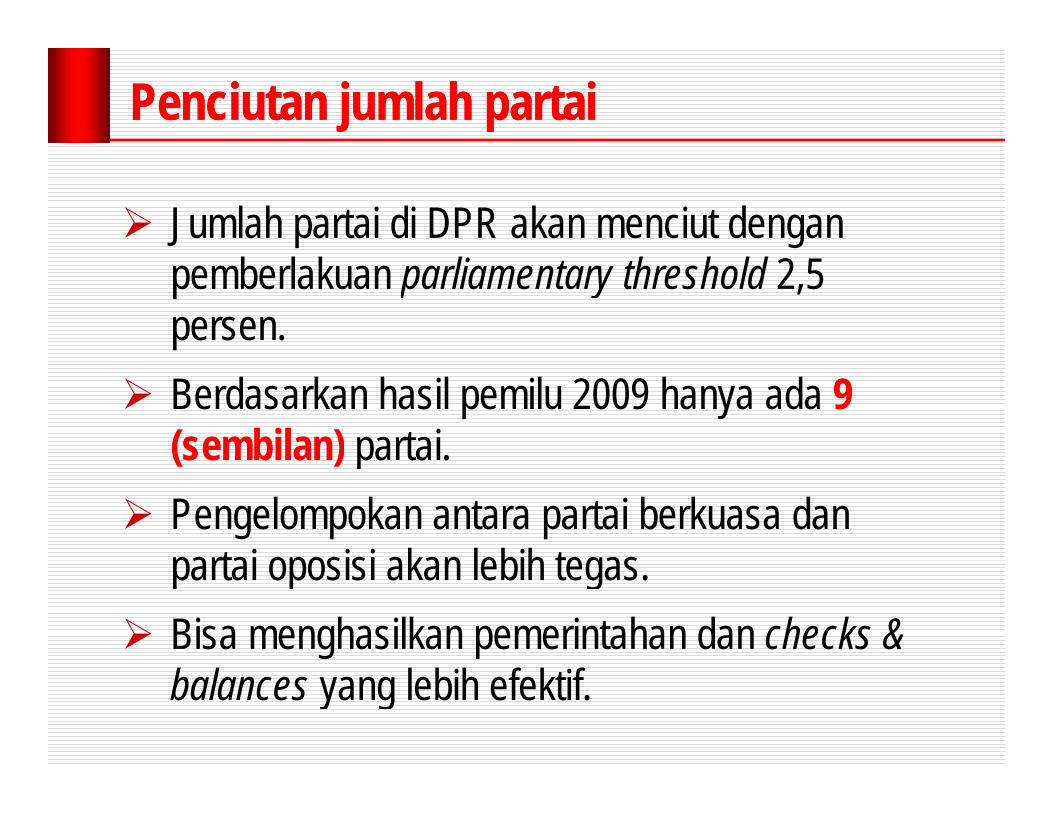
PenciutanPenciutan jumlahjumlah partaipartai
Jumlah partai di DPR akan menciut dengan pemberlakuan parliamentary threshold 2,5 persen.Berdasarkan hasil pemilu 2009 hanya ada 9(sembilan) partai.(sembilan) partai.Pengelompokan antara partai berkuasa dan partai oposisi akan lebih tegaspartai oposisi akan lebih tegas.Bisa menghasilkan pemerintahan dan checks & balances yang lebih efektif.
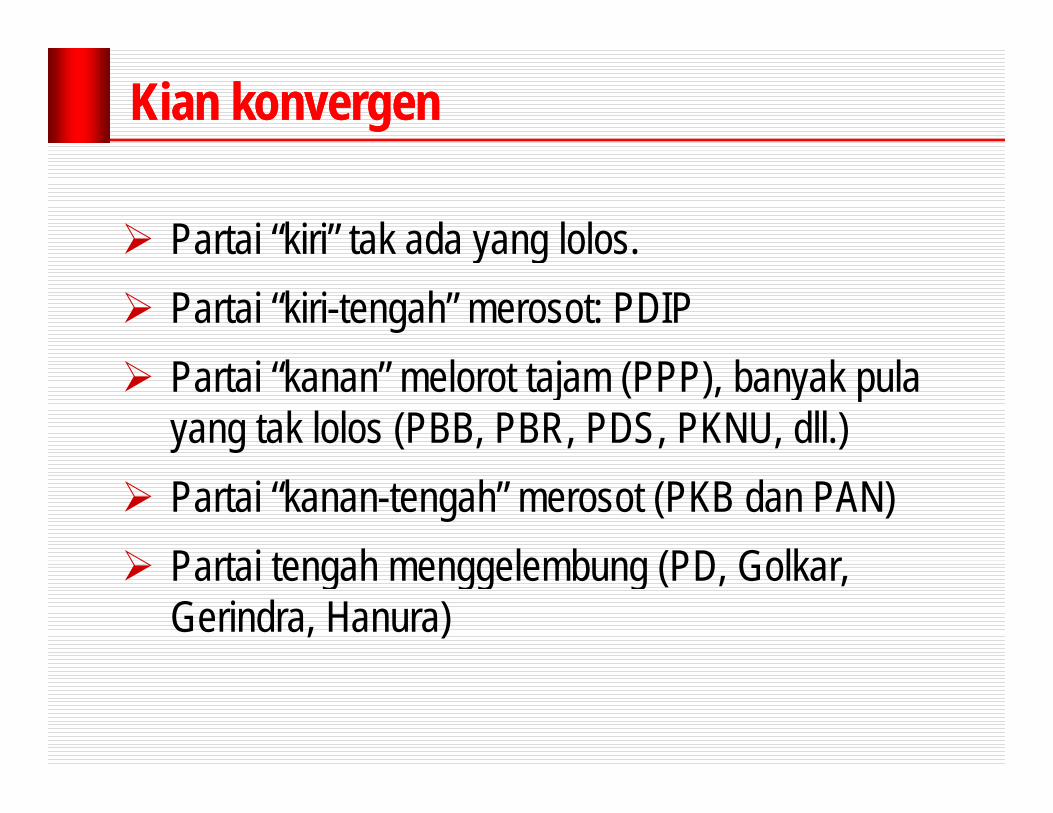
Kian konvergenKian konvergen
Partai “kiri” tak ada yang lolos.Partai kiri tak ada yang lolos.Partai “kiri-tengah” merosot: PDIPPartai “kanan” melorot tajam (PPP), banyak pula yang tak lolos (PBB, PBR, PDS, PKNU, dll.)Partai “kanan-tengah” merosot (PKB dan PAN)Partai tengah menggelembung (PD Golkar Partai tengah menggelembung (PD, Golkar, Gerindra, Hanura)
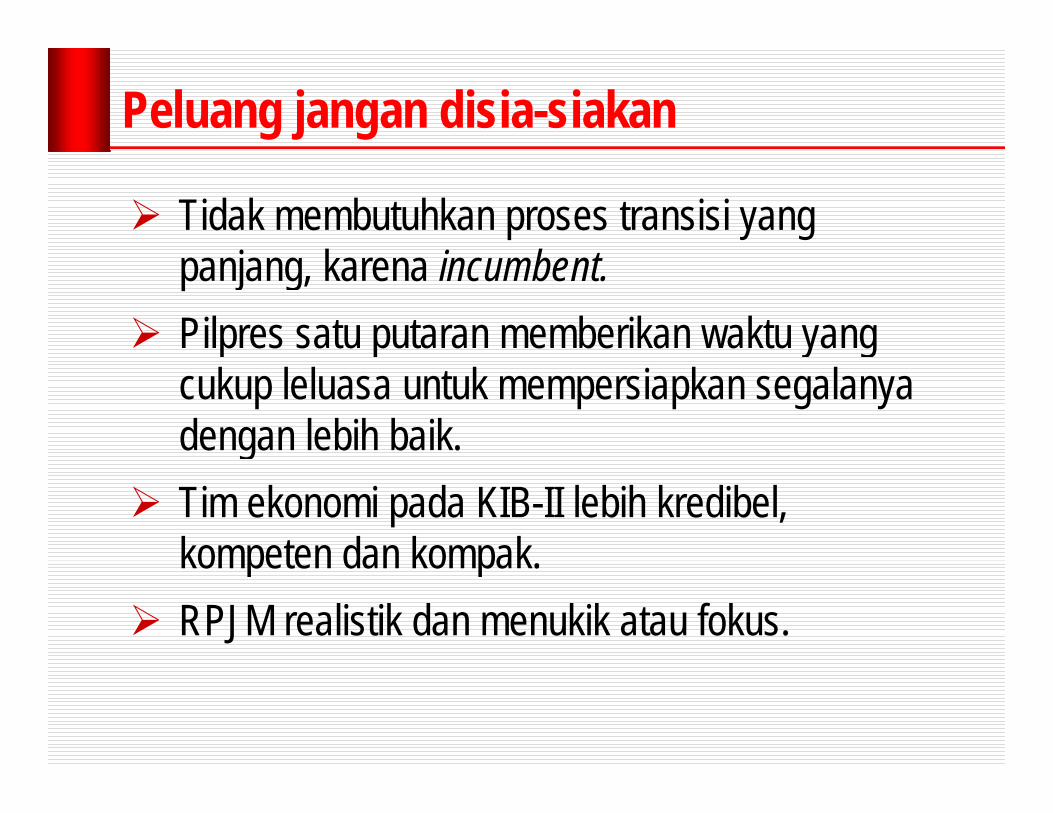
Peluang jangan disia-siakan
Tidak membutuhkan proses transisi yang j k i b tpanjang, karena incumbent.
Pilpres satu putaran memberikan waktu yang p p y gcukup leluasa untuk mempersiapkan segalanya dengan lebih baik.gTim ekonomi pada KIB-II lebih kredibel, kompeten dan kompakkompeten dan kompak.RPJM realistik dan menukik atau fokus.
BagianBagian IVIVProspekProspek 20102010ProspekProspek 20102010
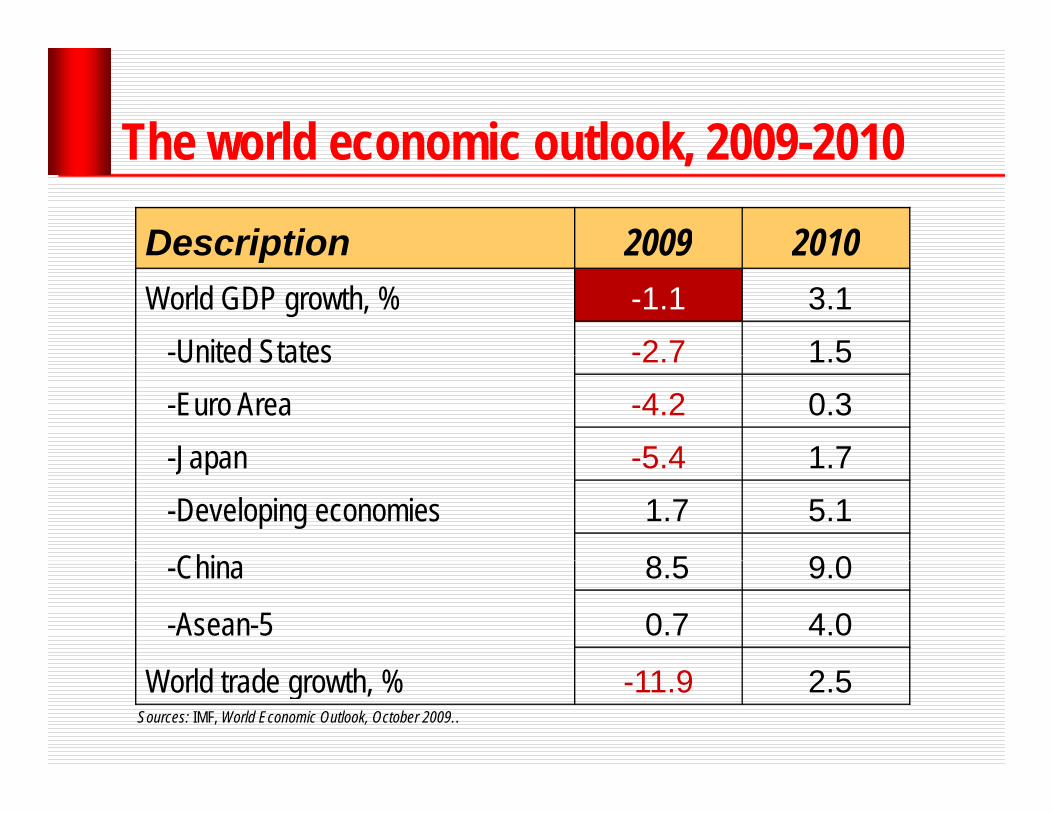
The world economic outlook 2009-2010The world economic outlook, 2009 2010
Description 2009 2010Description 2009 2010World GDP growth, % -1.1 3.1
-United States -2 7 1 5-United States -2.7 1.5-Euro Area -4.2 0.3Japan 5 4 1 7-Japan -5.4 1.7
-Developing economies 1.7 5.1
Chi 8 5 9 0-China 8.5 9.0
-Asean-5 0.7 4.0
World trade growth, % -11.9 2.5Sources: IMF, World Economic Outlook, October 2009..
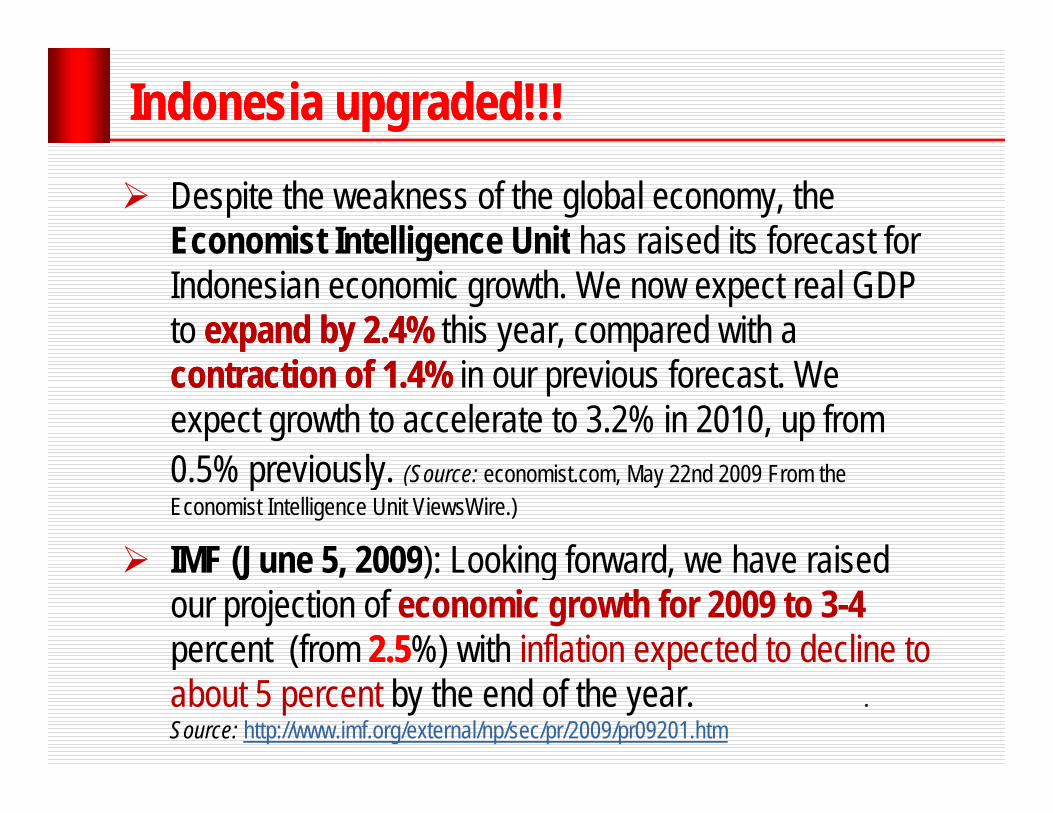
Indonesia upgraded!!!Indonesia upgraded!!!Despite the weakness of the global economy, the Economist Intelligence Unit has raised its forecast for Economist Intelligence Unit has raised its forecast for Indonesian economic growth. We now expect real GDP to expand by 2.4%expand by 2.4% this year, compared with a contraction of 1.4% contraction of 1.4% in our previous forecast. We expect growth to accelerate to 3.2% in 2010, up from 0 5% i l0.5% previously. (Source: economist.com, May 22nd 2009 From the Economist Intelligence Unit ViewsWire.)
IMF (June 5 2009): Looking forward we have raised IMF (June 5, 2009): Looking forward, we have raised our projection of economic growth for 2009 to 3-4 percent (from 2.52.5%) with inflation expected to decline to p ( ) pabout 5 percent by the end of the year. .Source: http://www.imf.org/external/np/sec/pr/2009/pr09201.htm
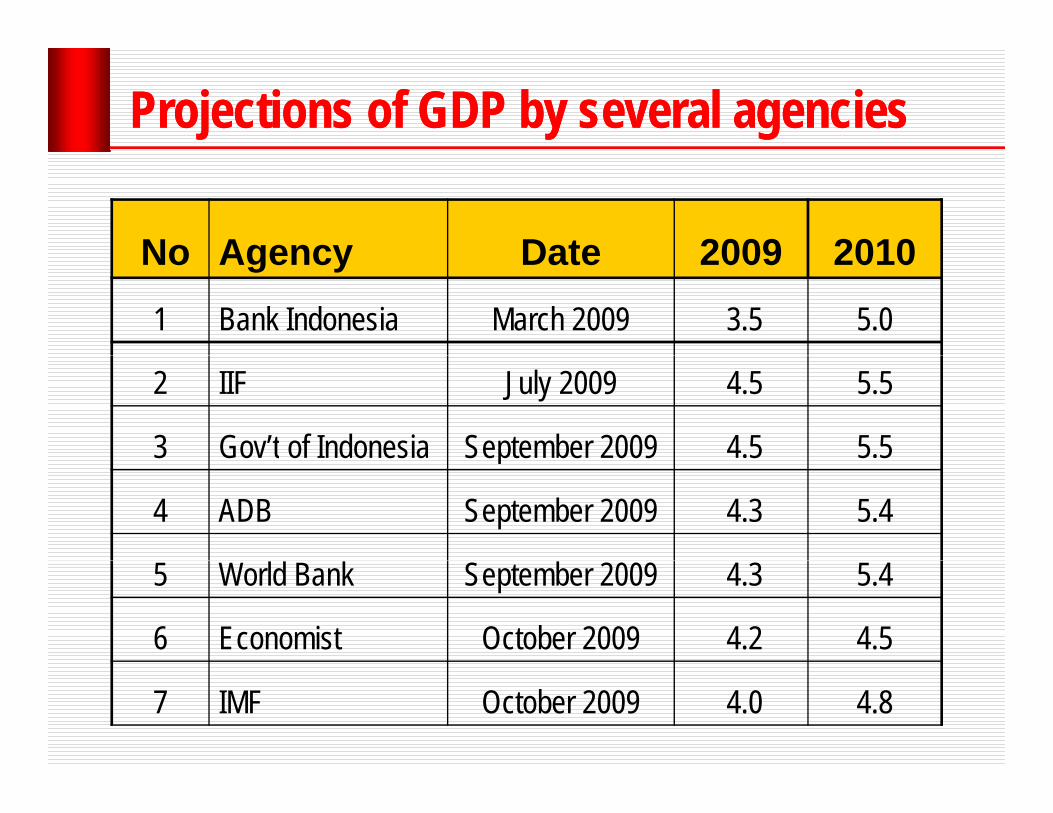
Projections of GDP by several agenciesProjections of GDP by several agencies
No Agency Date 2009 2010No Agency Date 2009 2010
1 Bank Indonesia March 2009 3.5 5.0
2 IIF July 2009 4.5 5.5
3 Gov’t of Indonesia September 2009 4.5 5.53 Go t o do es a Septe be 009 5 5 5
4 ADB September 2009 4.3 5.4
5 World Bank September 2009 4.3 5.4
6 Economist October 2009 4.2 4.5
7 IMF October 2009 4.0 4.8
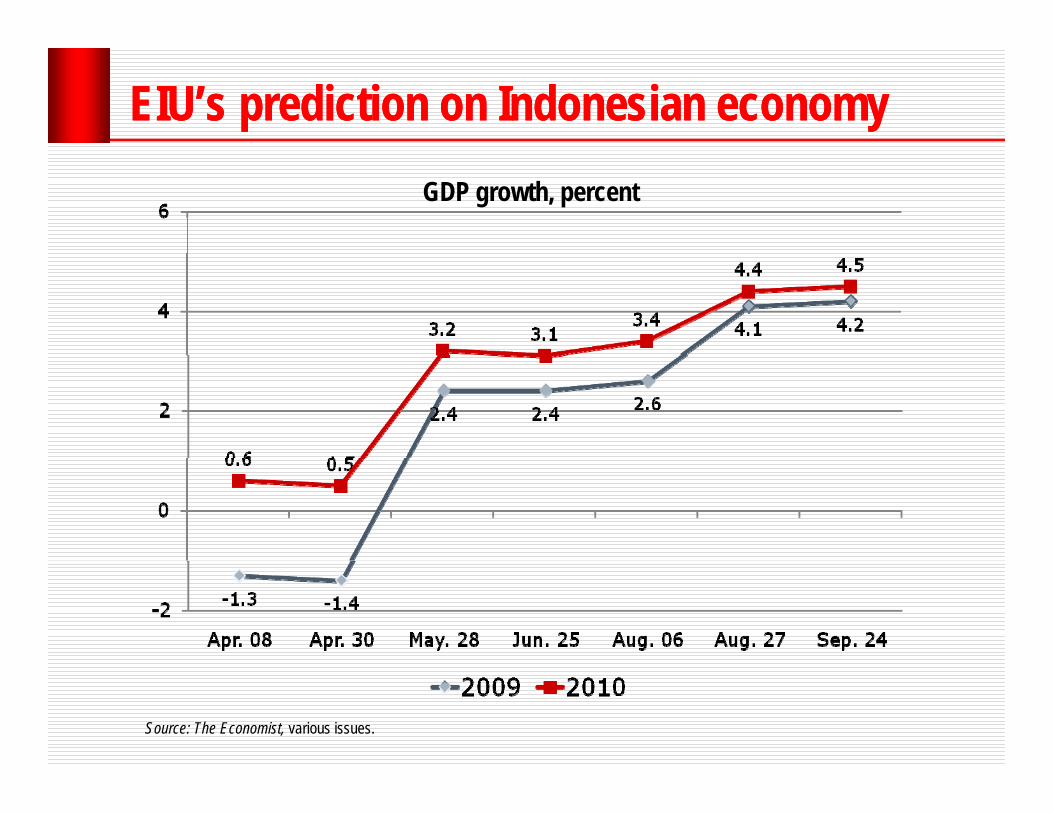
EIU’s prediction on Indonesian economyEIU’s prediction on Indonesian economyGDP growth, percent
Source: The Economist, various issues.
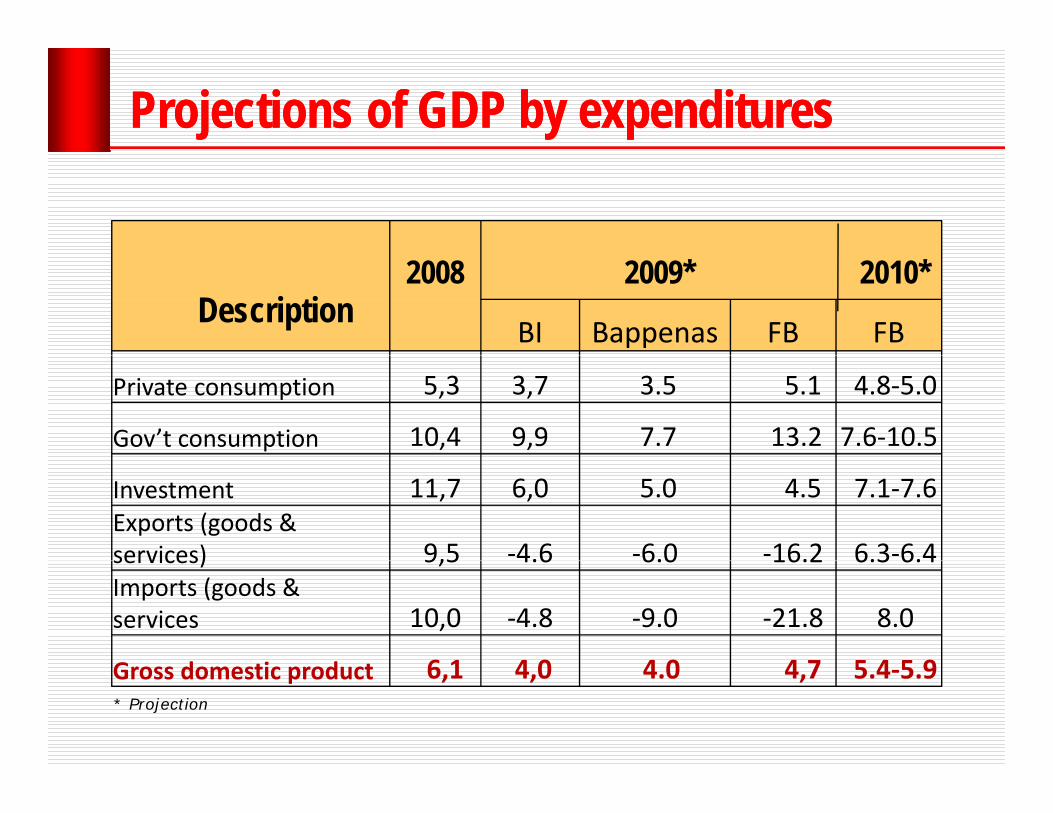
Projections of GDP by Projections of GDP by expendituresexpenditures
BI Bappenas FB FB
2009*Description
2010*2008
Private consumption 5,3 3,7 3.5 5.1 4.8‐5.0
Gov’t consumption 10,4 9,9 7.7 13.2 7.6‐10.5
Investment 11,7 6,0 5.0 4.5 7.1‐7.6Exports (goods & services) 9,5 ‐4.6 ‐6.0 ‐16.2 6.3‐6.4services) 9,5 4.6 6.0 16.2 6.3 6.4Imports (goods & services 10,0 ‐4.8 ‐9.0 ‐21.8 8.0
G d i d 6 1 4 0 4 0 4 7 5 4 5 9* Projection
Gross domestic product 6,1 4,0 4.0 4,7 5.4‐5.9
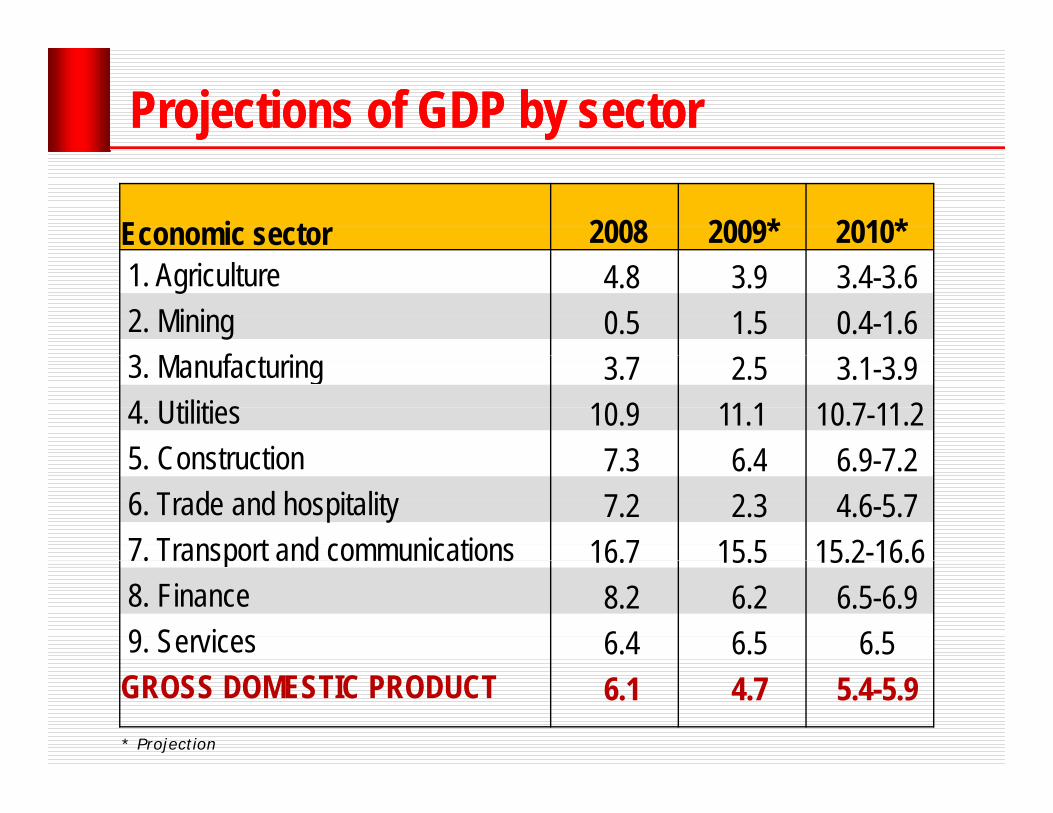
Projections of GDP by Projections of GDP by sectorsector
Economic sector 2008 2009* 2010* 1. Agriculture 4.8 3.9 3.4-3.62. Mining 0.5 1.5 0.4-1.63 M f t i3. Manufacturing 3.7 2.5 3.1-3.94. Utilities 10.9 11.1 10.7-11.25 Construction 7 3 6 4 6 9 7 25. Construction 7.3 6.4 6.9-7.26. Trade and hospitality 7.2 2.3 4.6-5.77. Transport and communications 16.7 15.5 15.2-16.67. Transport and communications 16.7 15.5 15.2 16.68. Finance 8.2 6.2 6.5-6.99. Services 6.4 6.5 6.5
* Projection
GROSS DOMESTIC PRODUCT 6.1 4.7 5.4-5.9
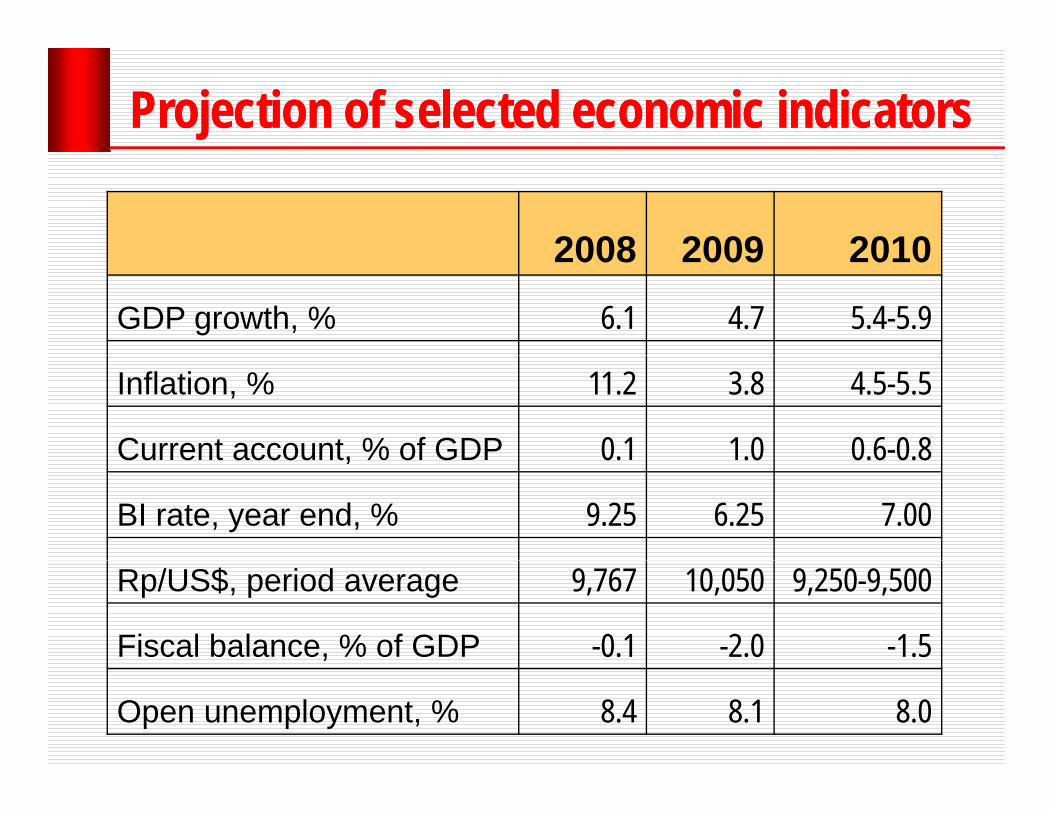
Projection of selected economic indicatorsProjection of selected economic indicators
2008 2009 20102008 2009 2010
GDP growth, % 6.1 4.7 5.4-5.9
Inflation, % 11.2 3.8 4.5-5.5
Current account, % of GDP 0.1 1.0 0.6-0.8Current account, % of GDP 0.1 1.0 0.6 0.8
BI rate, year end, % 9.25 6.25 7.00
Rp/US$, period average 9,767 10,050 9,250-9,500
Fiscal balance, % of GDP -0.1 -2.0 -1.5
Open unemployment, % 8.4 8.1 8.0

Rupiah Rupiah cenderungcenderung menguatmenguatSepanjang likuiditas yang melimpah di AS belum disedot The Fed, nilai US$ akan cenderung melemah.disedot The Fed, nilai US$ akan cenderung melemah.Dengan pasar domestik yang cukup besar, Indonesia semakin menarik bagi FDI. Beberapa sudah masuk. semakin menarik bagi FDI. Beberapa sudah masuk. Akan cukup banyak yang menyusul, asalkan ..Moody’s sudah meningkatkan rating Indonesia Jika tak Moody s sudah meningkatkan rating Indonesia. Jika tak ada halangan mendasar, S & P pun diperkirakan bakal melakukan upgrade dari BB+ menjadi BBB-. Dengan pg j gbegitu, institutional investors akan semakin tertarik masuk ke pasar modal kita.Namun volatilitas Rupiah harus tetap diwaspadai.
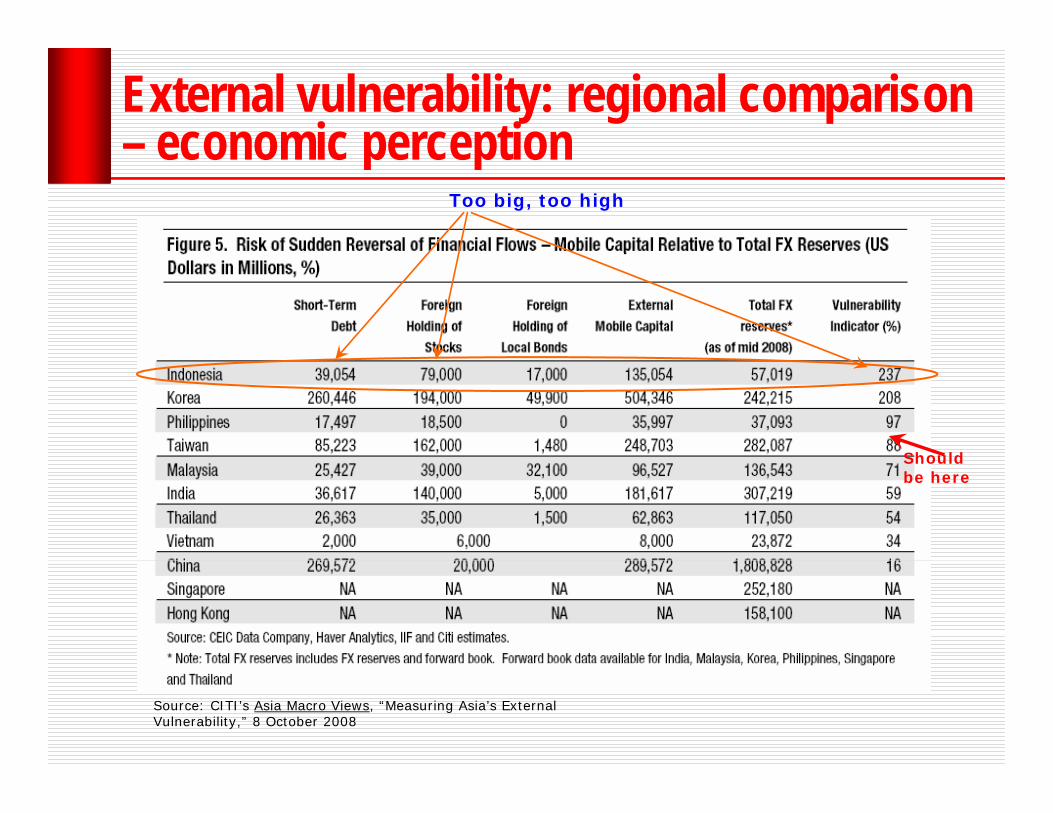
External vulnerability: regional comparison – economic perception
Too big, too high
economic perception
Bloomberg commodity price index
Should Should be here
Source: CITI’s Asia Macro Views, “Measuring Asia’s External Vulnerability,” 8 October 2008
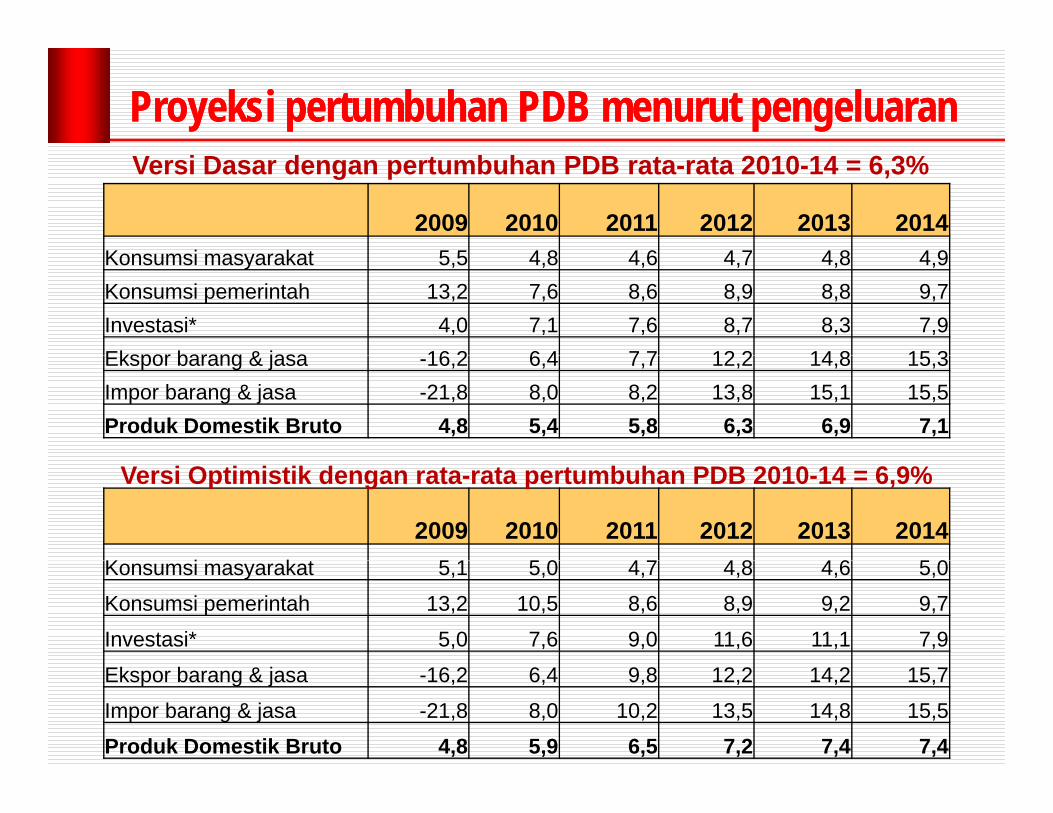
Proyeksi pertumbuhan PDB menurut pengeluaranProyeksi pertumbuhan PDB menurut pengeluaran
2009 2010 2011 2012 2013 2014K i k t 5 5 4 8 4 6 4 7 4 8 4 9
Versi Dasar dengan pertumbuhan PDB rata-rata 2010-14 = 6,3%
Konsumsi masyarakat 5,5 4,8 4,6 4,7 4,8 4,9Konsumsi pemerintah 13,2 7,6 8,6 8,9 8,8 9,7Investasi* 4,0 7,1 7,6 8,7 8,3 7,9Ekspor barang & jasa 16 2 6 4 7 7 12 2 14 8 15 3Ekspor barang & jasa -16,2 6,4 7,7 12,2 14,8 15,3Impor barang & jasa -21,8 8,0 8,2 13,8 15,1 15,5Produk Domestik Bruto 4,8 5,4 5,8 6,3 6,9 7,1
2009 2010 2011 2012 2013 2014K i k t 5 1 5 0 4 7 4 8 4 6 5 0
Versi Optimistik dengan rata-rata pertumbuhan PDB 2010-14 = 6,9%
Konsumsi masyarakat 5,1 5,0 4,7 4,8 4,6 5,0
Konsumsi pemerintah 13,2 10,5 8,6 8,9 9,2 9,7
Investasi* 5,0 7,6 9,0 11,6 11,1 7,9
Ekspor barang & jasa -16,2 6,4 9,8 12,2 14,2 15,7
Impor barang & jasa -21,8 8,0 10,2 13,5 14,8 15,5
Produk Domestik Bruto 4,8 5,9 6,5 7,2 7,4 7,4
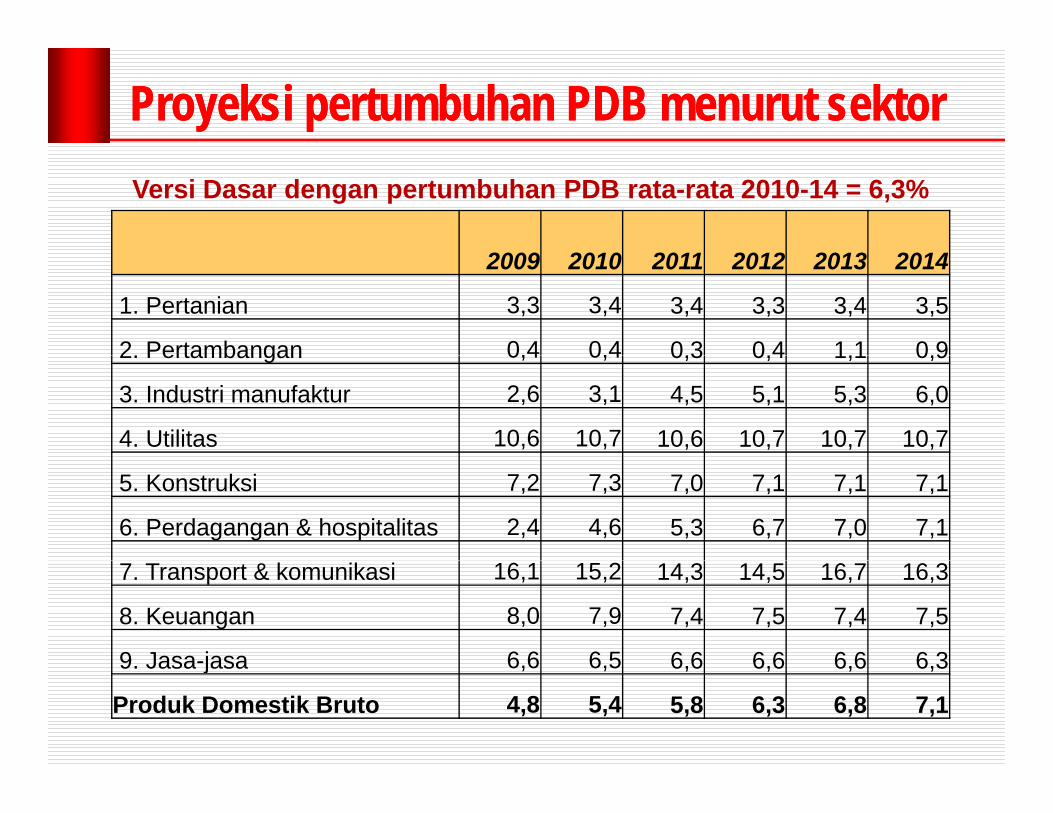
Proyeksi pertumbuhan PDB menurut sektorProyeksi pertumbuhan PDB menurut sektor
2009 2010 2011 2012 2013 2014
Versi Dasar dengan pertumbuhan PDB rata-rata 2010-14 = 6,3%
2009 2010 2011 2012 2013 2014
1. Pertanian 3,3 3,4 3,4 3,3 3,4 3,5
2 Pertambangan 0,4 0,4 0 3 0 4 1 1 0 92. Pertambangan 0,4 0,4 0,3 0,4 1,1 0,9
3. Industri manufaktur 2,6 3,1 4,5 5,1 5,3 6,0
4. Utilitas 10,6 10,7 10,6 10,7 10,7 10,7
5. Konstruksi 7,2 7,3 7,0 7,1 7,1 7,1
6. Perdagangan & hospitalitas 2,4 4,6 5,3 6,7 7,0 7,1
7. Transport & komunikasi 16,1 15,2 14,3 14,5 16,7 16,3
8. Keuangan 8,0 7,9 7,4 7,5 7,4 7,5
9 Jasa-jasa 6 6 6 5 6 6 6 6 6 6 6 39. Jasa-jasa 6,6 6,5 6,6 6,6 6,6 6,3
Produk Domestik Bruto 4,8 5,4 5,8 6,3 6,8 7,1

Proyeksi pertumbuhan PDB menurut sektorProyeksi pertumbuhan PDB menurut sektor
2009 2010 2011 2012 2013 2014
Versi Optimistik dengan rata-rata pertumbuhan PDB 2010-14 = 6,9%
2009 2010 2011 2012 2013 2014
1. Pertanian 3,9 3,6 3,8 4,0 4,1 4,2
2. Pertambangan 1,5 1,6 2,3 2,7 2,2 2,0e a ba ga , , ,3 , , ,0
3. Industri manufaktur 2,6 3,9 4,8 5,5 6,3 6,5
4. Utilitas 11,2 11,2 11,5 11,7 11,7 11,4
5. Konstruksi 6,4 6,9 7,5 7,5 7,3 7,1
6. Perdagangan & hospitalitas 2,3 5,7 6,6 7,3 7,6 7,4
7. Transport & komunikasi 16,5 16,6 15,6 17,7 16,7 16,3
8. Keuangan 6,2 6,9 7,5 7,6 7,5 6,9
9 Jasa jasa 6 6 6 5 6 6 6 6 6 6 6 39. Jasa-jasa 6,6 6,5 6,6 6,6 6,6 6,3
Produk Domestik Bruto 4,8 5,9 6,5 7,2 7,4 7,4

KebutuhanKebutuhan investasiinvestasi
Skenario Indikator 2008 2009F 2010F 2011F 2012F 2013F 2014F
Pertumbuhan Ekonomi, %YoY 6.1 4.8 5.4 5.8 6.3 6.9 7.1,
PDB Nominal, Rp Tril 4954 5795 6791 8015 9479 11299 13548
Kebutuhan Investasi, Rp Tril 1370 1698 1967 2405 2885 3240 3776
Investasi/PDB, % 27.6 29.3 29.0 30.0 30.4 28.7 27.9
Baseline
ICOR 3.7 5.0 4.4 4.2 4.0 3.8 3.8
Pertumbuhan Ekonomi, %YoY 6.1 4.8 5.9 6.5 7.2 7.4 7.4
PDB Nominal Rp Tril 4954 5795 6823 8104 9661 11577 13916 PDB Nominal, Rp Tril 4954 5795 6823 8104 9661 11577 13916
Kebutuhan Investasi, Rp Tril 1370 1698 1976 2432 2941 3320 3879
Investasi/PDB, % 27.6 29.3 29.0 30.0 30.4 28.7 27.9
ICOR 3.7 5.0 4.0 3.8 3.6 3.5 3.6
Adjustment
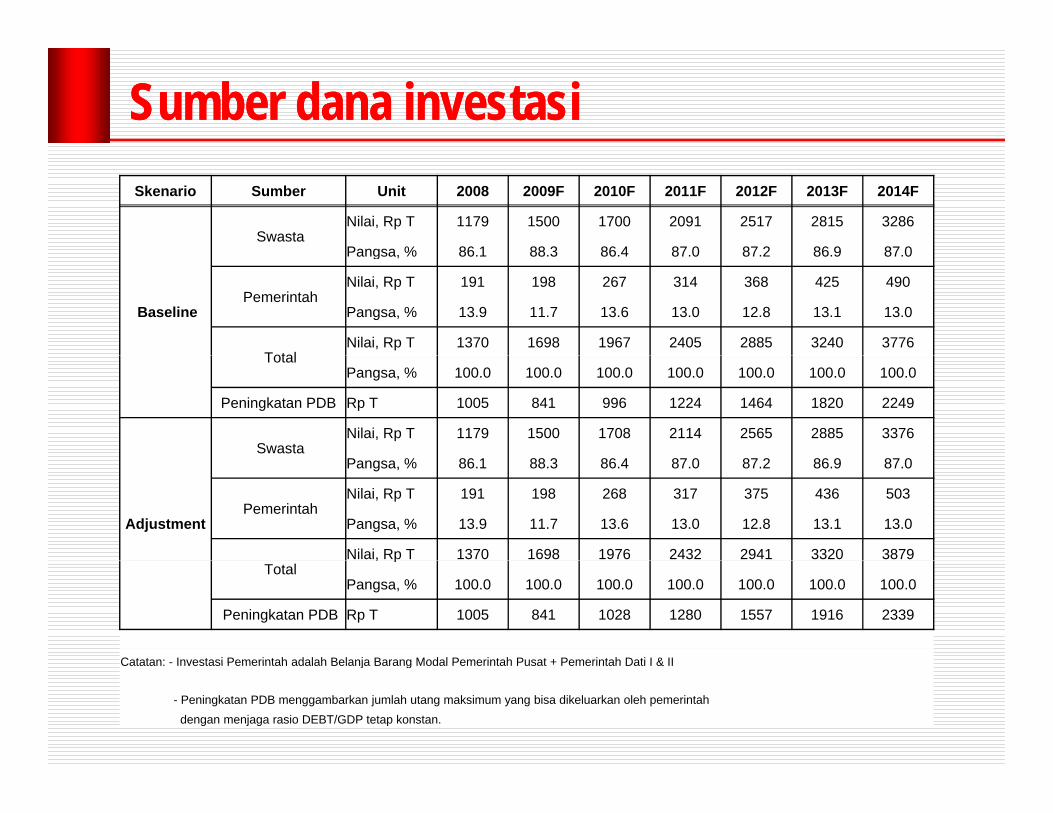
SumberSumber danadana investasiinvestasiSkenario Sumber Unit 2008 2009F 2010F 2011F 2012F 2013F 2014F
SwastaNilai, Rp T 1179 1500 1700 2091 2517 2815 3286
Pangsa % 86 1 88 3 86 4 87 0 87 2 86 9 87 0
Baseline
Pangsa, % 86.1 88.3 86.4 87.0 87.2 86.9 87.0
PemerintahNilai, Rp T 191 198 267 314 368 425 490
Pangsa, % 13.9 11.7 13.6 13.0 12.8 13.1 13.0
TotalNilai, Rp T 1370 1698 1967 2405 2885 3240 3776
TotalPangsa, % 100.0 100.0 100.0 100.0 100.0 100.0 100.0
Peningkatan PDB Rp T 1005 841 996 1224 1464 1820 2249
SwastaNilai, Rp T 1179 1500 1708 2114 2565 2885 3376
P % 86 1 88 3 86 4 87 0 87 2 86 9 87 0
Adjustment
Pangsa, % 86.1 88.3 86.4 87.0 87.2 86.9 87.0
PemerintahNilai, Rp T 191 198 268 317 375 436 503
Pangsa, % 13.9 11.7 13.6 13.0 12.8 13.1 13.0
Nilai, Rp T 1370 1698 1976 2432 2941 3320 3879Total
, p
Pangsa, % 100.0 100.0 100.0 100.0 100.0 100.0 100.0
Peningkatan PDB Rp T 1005 841 1028 1280 1557 1916 2339
Catatan: - Investasi Pemerintah adalah Belanja Barang Modal Pemerintah Pusat + Pemerintah Dati I & IICatatan: - Investasi Pemerintah adalah Belanja Barang Modal Pemerintah Pusat + Pemerintah Dati I & II
- Peningkatan PDB menggambarkan jumlah utang maksimum yang bisa dikeluarkan oleh pemerintahdengan menjaga rasio DEBT/GDP tetap konstan.
KeunikanKeunikan IndonesiaIndonesia
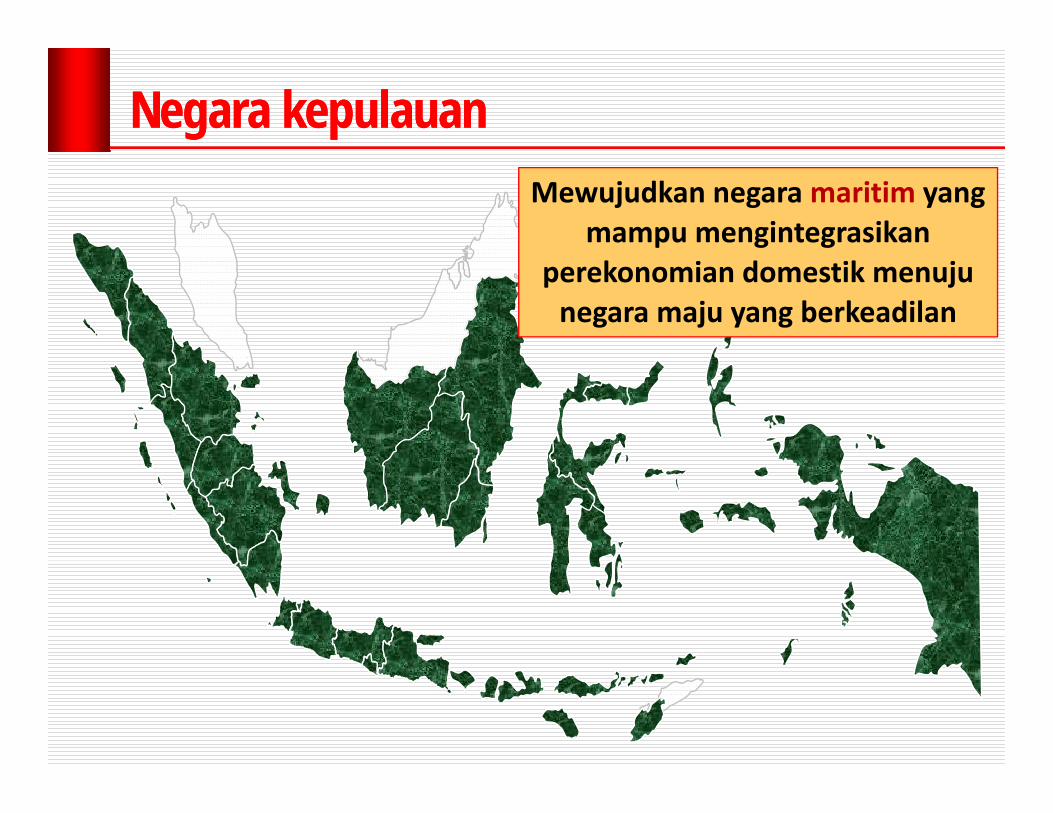
Negara Negara kepulauankepulauanMewujudkan negara maritim yang
mampu mengintegrasikan perekonomian domestik menuju negara maju yang berkeadilan

Kerangka Strategi PembangunanKerangka Strategi PembangunanVISI:
Mewujudkan negara maritim yang mampu mengintegrasikan perekonomian domestik menuju negara maju yang berkeadilanperekonomian domestik menuju negara maju yang berkeadilan
Melalui pencapaian Melalui pencapaian 5 (lima)5 (lima) sasaran strategis:sasaran strategis:
1. Pertumbuhan ekonomi yang tinggi dan berkelanjutan;2. Perluasan penyerapan tenaga kerja;3. Pengentasan kemiskinan dan pemerataan pembangunan.
MISI
p pp p ( )( ) gg
Struktur ekonomi yang kokoh, mandiri dan berdaya
saing
Sumber daya manusia produktif
Sumberpembiayaan
pembangunan mencukupi dan
efisien
Birokrasi yang kompeten, efektif dan
bersih
PemanfaatanSDA secaraoptimal dan
lestari
Fokus pFokus pada ada 77 area kebijakanarea kebijakan: :
Pasar tenaga kerja:P
Kualitas sumberdaya manusia
l i
Infrastruktur• Penyediaan
(
Teknologi• Peningkatan dan
fi i i l k i
saing efisien
Pasar modal dan perbankan:M bili i d
Pasar barang:• Sistem distribusiyang efisien
Kebijakanafirmatif:
• Penyempurnaan UU ketenagakerjaan;
• Peningkatan penyerapan tenaga kerja sektor formal;
• Implementasi
• Implementasi sistem pendanaan kesehatan berkelanjutan dan terencana;
• Pembangunan pendidikan
infrastruktur (fisikdan non fisik) yang handal;
• Skema pendanaan• Kebijakan hargainfrastruktur.
efisiensi alokasi anggaran negarauntukpenelitian;
• Insentif kegiatan R&D oleh swasta;
• Mobilisasi dana masyarakat: tabungan haji, surplus danamasyarakat.
• Monetisasi asset negara;
• Peningkatan
yang efisien. • Perlindungan wajar bagi produsen domestik dari persaingan tidak adil dengan produsen luar
• Active industrial policy: men‐dorong kegiatanusaha potensialdan strategis;
• Penguatanstruktur pelaku
h• Implementasi sistem jaminan sosial bagi pekerja;
pendidikan mengacu pada output.
• Peningkatan basis pajak.
produsen luar negeri;
usaha;• Persebaran spasial kegiatan ekonomi
68Lingkungan sosial dan politik Kerangka kelembagaan Struktur pasar
SUPRASTRUKTUR
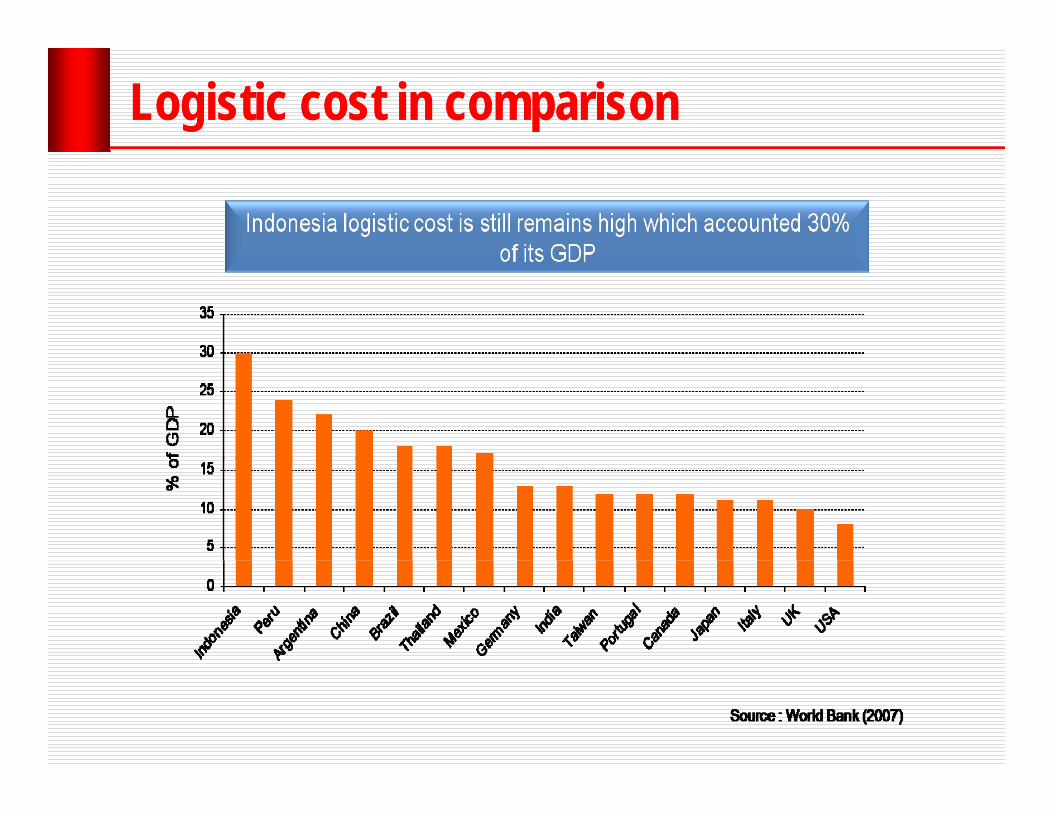
Logistic cost in comparisonLogistic cost in comparison
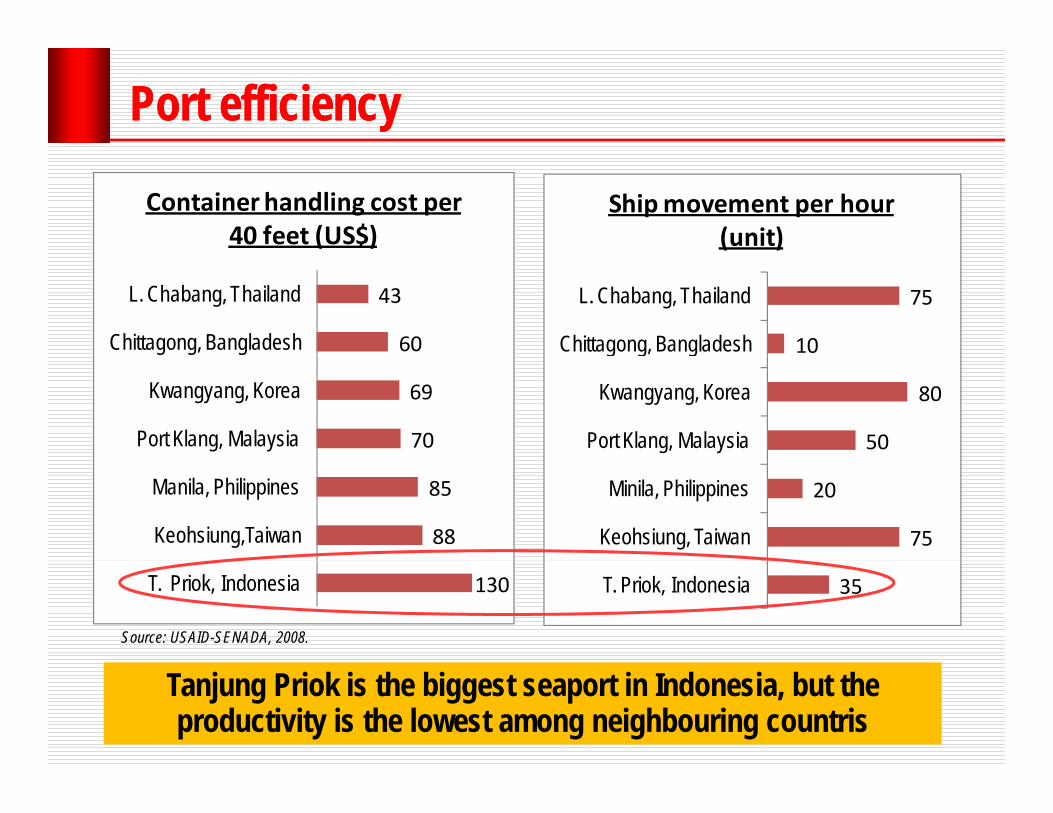
Port efficiencyPort efficiency
Container handling cost per 40 feet (US$)
Ship movement per hour (unit)
60
43
Chittagong, Bangladesh
L. Chabang, Thailand
10
75
Chittagong, Bangladesh
L. Chabang, Thailand
70
69
Port Klang, Malaysia
Kwangyang, Korea
50
80
Port Klang, Malaysia
Kwangyang, Korea
g g g
88
85
Keohsiung,Taiwan
Manila, Philippines
75
20
Keohsiung, Taiwan
Minila, Philippines
Source: USAID-SENADA, 2008.
130T. Priok, Indonesia 35T. Priok, Indonesia
Tanjung Priok is the biggest seaport in Indonesia, but the productivity is the lowest among neighbouring countris

Waspada
Recovery ekonomi dunia yang pesat tahun 2010 mendorong kenaikan real demand untuk commodities. Harga minyak bisa kembali menembus US$100 per barrel.Implementasi FTA dengan China bisa Implementasi FTA dengan China bisa mengganggu pemulihan industri manufaktur.Sk d l d i k d l k t k k Skandal demi skandal akan terkuak, menyentuh lapisan elit.

Terima Kasih
Email: faisal basri@gmail comEmail: [email protected]: http://kompasiana.com/faisalbasri