economic impacts of international migration and remittances on household welfare in vietnam
TRANSCRIPT
Economic impacts ofinternational migration and
remittances on household welfarein VietnamNguyen Viet Cuong
National Economics University, Hanoi, Vietnam, and
Daniel MontWorld Bank, Hanoi, Vietnam
Abstract
Purpose – The purpose of this paper is to examine the impact of international remittances ondifferent household welfare indicators including child education, assets, durable goods, andreservation wages of other working age household members. It examines how internationalremittances are spent for production and consumption by receiving households.
Design/methodology/approach – This paper uses fixed-effect regressions to estimate the impactof international remittances on household spending in Vietnam using Vietnam Household LivingStandard Surveys 2006 and 2008.
Findings – It is found that most of international remittances are spent on housing and land, debtrepayment and saving. A small proportion of remittances are used to buy durable goods. Remittancesare not spent in production as well as living consumptions. The effect of international remittances onconsumption-based poverty is very limited.
Originality/value – The findings from this paper suggest that current international remittances arenot an effective measure for poverty reduction in the short-run in Vietnam.
Keywords Migration, Remittances, Impact evaluation, Household welfare, Poverty, Vietnam, Welfare
Paper type Research paper
1. IntroductionThe main objective of migration is to increase income and reduce the risks of anuncertain income stream (Harris and Todaro, 1970; Stark, 1980, 1991; Katz and Stark,1986; Stark and Taylor, 1991). As a source of labor for destination countries, a source ofwork experience and income generation for migrants, and a source of remittances forcountries of origin, migration has the capacity for both broad and deep impacts.
The most direct impact of migration is increased income, mainly throughremittances (McKenzie and Sasin, 2007). Remittances sent by migrants are remarkablecapital flows for migrant-sending households, especially in developing countries.
Migrants send remittances to their households in home areas for different reasons(Stark and Bloom, 1985; Stark, 1995; Lucas and Stark, 1985; Cox, 1987, 1990). The mostoften cited motives are altruism, exchange and insurance. The altruism motiveassumes that people give transfers to others because of care and love. The exchangemotive theory argues that people give transfers to other because they want to get some
The current issue and full text archive of this journal is available at
www.emeraldinsight.com/1446-8956.htm
JEL classification – O15, R23, I32
IJDI11,2
144
International Journal of DevelopmentIssuesVol. 11 No. 2, 2012pp. 144-163q Emerald Group Publishing Limited1446-8956DOI 10.1108/14468951211241137
benefits in return (Cox, 1987). Migrants might send remittances so that the recipientswill take care of the assets or family of the migrants. Remittances are also sent to investin physical and social assets. The insurance theory argues that in the absence ofcomplete credit markets, migration is a strategy households use to cope with economicrisks or shocks (Stark and Levhari, 1982; Stark and Bloom, 1985; Rosenzweig, 1988).Migrants remit money when their home people experience decreases in income, but themigrants might also receive money or other assistance from their home when they loseemployment or suffer a reduction in income.
In addition to positive impacts on consumption, income and other physical capital,migration can have positive effects on human capital such as transfers of informationand advanced knowledge about production skills and technology and awareness of theimportant role of education as well as child care (McKenzie and Sasin, 2007).
However, migration can lead to negative effects. For example, fewer adults at homemay have a negative impact on the next generation. With less care from adults,children have poorer educational attainment and health, and might have to take morehousework. Migration can also prevent these households from high-return but laborintensive activities (Taylor and Lopez-Feldma, 2007). Moreover, remittances can createa moral hazard problem, since they can lead to work disincentives (Farrington andSlater, 2006; Lloyd-Sherlock, 2006; Sahn and Alderman, 1996). In an extreme case,non-migrants would have earned higher income if they had not received remittances.
Empirical findings on the sign as well as the magnitude of the impact of migrationon household welfare are not consistent. For example, Adams and Page (2005) foundthe strongly positive correlation between international remittances and povertyreduction in developing countries. At the country level, positive impacts of remittances,especially international remittances, on household welfare and poverty reduction werealso found in some studies such as Adams (1991, 2004, 2006), Taylor et al. (2005) andAcosta et al. (2007). However, Azam and Gubert (2006)’ find that in Mali and Senegalmigrants mainly come from rich families, so rich families receive most remittances.Yang (2004) finds that migration reduced the labor supply of non-migrants inPhilippines. McKenzie and Rapoport (2006) found that migration had a negative impacton the schooling ratio of children in Mexico.
In Vietnam, both internal and international migration have been increasing rapidly.According to the 1999 Population and Housing Census, around 6.5 percent of thepopulation over five years old changed their residence during 1994-1999 (Dang et al.,2003). According to the 1998 Vietnam Living Standard Survey (VLSS) and the 2002Vietnam Household Living Standard Survey (VHLSS), the share of the urban populationincreased from 22 to 27 percent during 1998-2006. Currently, 3.2 million Vietnamese livepermanently in other countries. The number of annual exported laborers increased by136 percent from 36 to 85 thousand during 2001-2007 (Labor Newspaper, 2008; Nguyenand Mont, 2010). International remittances have been increasing remarkably over time.During the period 1999-2008 the amount of international remittances increased from1.2 to 8 billion USD (Nguyen-Hung, 2009). The ratio of international remittances to GDPincreased from 4.3 percent in 1999 to 8.5 percent in 2008.
Most studies argue that the main reason for economic migration in Vietnam is to findbetter employment and higher wages (Dang et al., 2003; Cu, 2005; Brauw and Harigaya,2007). Industrialization and high economic growth in the urban areas increasinglyattract rural labors (Dang et al., 1997; Dang, 2001; Cu, 2005). Large flows of foreign direct
Householdwelfare in
Vietnam
145
investment into many industrial zones and companies create more employment for ruralpeople. In addition, there are more landless or near landless households (Ravallion andvan de Walle, 2006). The shortage of land can push farmers into non-farm employmentin other locations (Cu, 2005). For international migration, most exported labors areleaving for higher incomes.
While most studies in Vietnam focus on the pattern and determinants of migration(Guest, 1998; Djamba et al., 1999; Dang et al., 1997, 2003; Dang, 2001; General StatisticsOffice of Vietnam (GSO) and United Nation Population Fund (UNFPA), 2005; Cu, 2005;Dang and Nguyen, 2006; Nguyen-Minh, 2008). Few studies measure the quantitativeimpacts. The first to do so was Brauw and Harigaya (2007), who measured the impactof seasonal migration using the VLSS 1993 and 1998. The second was by Nguyen et al.(2008), who evaluated the impact of long-term migration on household expenditureusing VHLSS in 2002-2004. Recently, Nguyen et al. (2009) measured the impact of workmigration and non-work migration on household welfare and poverty using VHLSS in2004-2006. These studies found a positive impact of migration on householdexpenditure. Regarding international remittances, most studies focus on the impact ofinternational remittances on poverty. Using VHLSS in 2002-2004, Nguyen (2008) foundthat international remittances helped receiving household increase consumption andreduce poverty. It should be noted that in Vietnam remittances come from bothtemporary migrants – who have migrated relatively recently – and permanentmigrants, most of whom migrated at the end of the war in the 1970s.
However, there have been no studies in Vietnam on the impact of migration andremittances on other household welfare indicators such as investment in education,assets, household infrastructure and durable goods, and reservation wages of otherworking age household members.
The objective of the paper is to examine the impact of international remittances ondifferent household welfare indicators including child education, assets, durable goods,and reservation wages of other working age household members. It examines howinternational remittances are spent for production and consumption by receivinghouseholds. Data used in this paper are from the most two recent VHLSSs 2006 and 2008.
The paper is structured into five sections. After this introduction, Section 2introduces the data set used in this paper. Section 3 describes the pattern ofinternational migration and remittances in Vietnam. Section 4 presents the estimationof international remittances on household welfare. Finally, the Section 6 concludes.
2. Data sourcesIn this study, we use data from two recent VHLSSs in 2006 and 2008. The VHLSSswere conducted by the GSO with technical support from the World Bank (WB). Eachsurvey covered around 9,189 households. The samples are representative for thenational, rural and urban, and regional levels. The two surveys set up two-period panelsub-samples of around 4,200 households[1].
The surveys collected information through household and community levelquestionnaires. Information on households includes basic demography, employmentand labor force participation, education, health, income, expenditure, housing, fixedassets and durable goods, participation of households in poverty alleviation programs,and especially information on international remittances that households had receivedduring the 12 months before the interview.
IJDI11,2
146
Expenditure and income per capita are collected using very detailed questionnaires inthe VHLSS. Expenditure includes food and non-food expenditure. Food expenditureincludes purchased food and foodstuff and self-produced products of households.Non-food expenditure comprises expenditure on education, healthcare houses,commodities, power, water supply and garbage. Household income includes incomefrom agricultural and non-agricultural production, labor earnings, pensions,scholarship, income from loan interest and house rental, remittances and socialtransfers. Income from agricultural production comprises crop income, livestockincome, aquaculture income, and income from other agriculture-related activities.
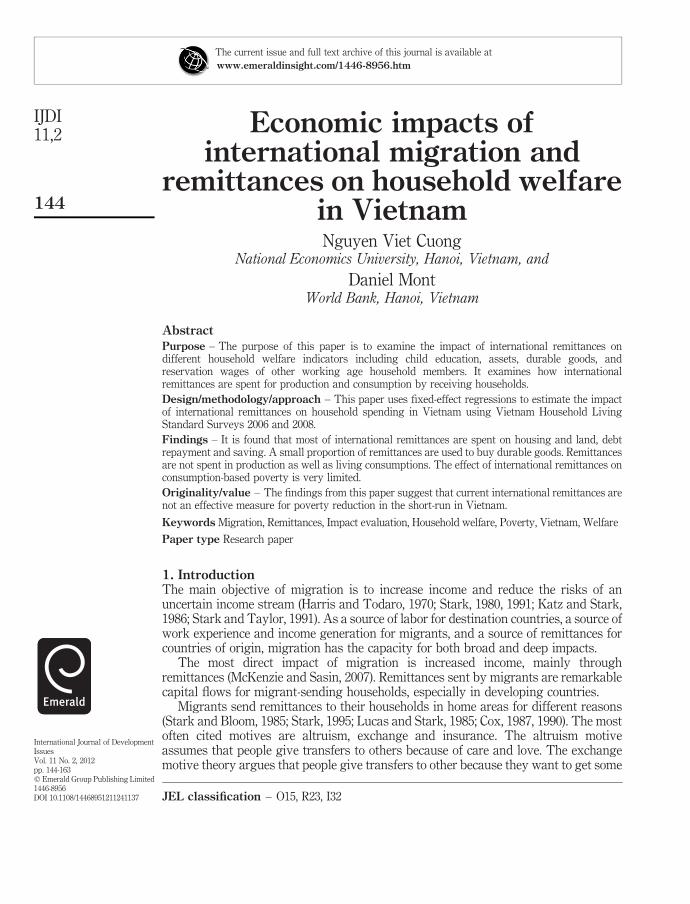
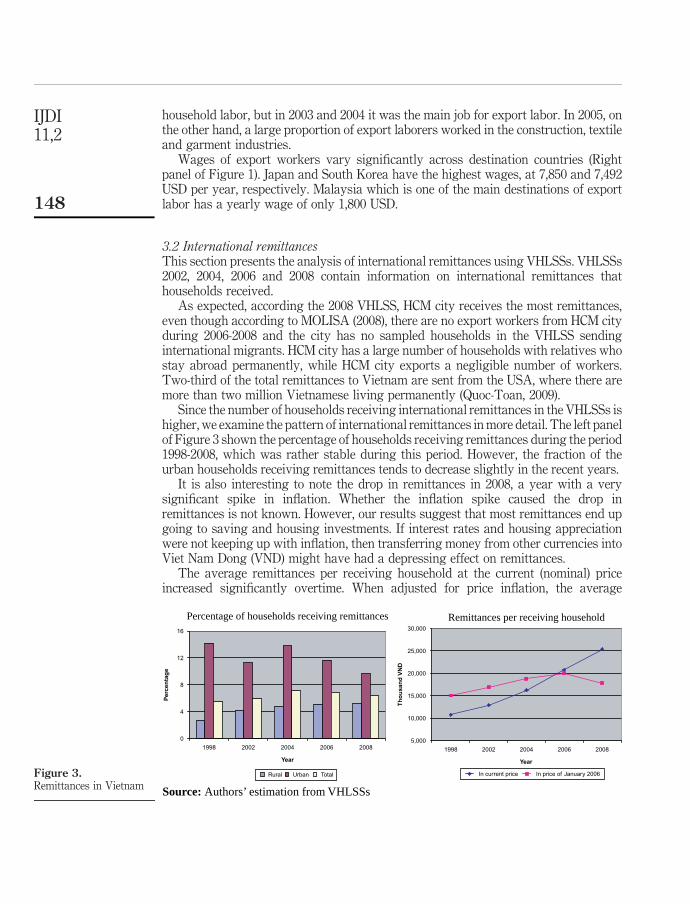
3. International migration and remittances in Vietnam3.1 Labor exportVietnam’s labor export is increasing during the past ten years (Figure 1). The numberof exported laborers increased from 31.5 thousand in 2000 to 87 thousand in 2008. Malelaborers account for around two-third of the exported laborers. Asian countries,especially Taiwan and Malaysia, are the main destination of the Vietnamese workers.
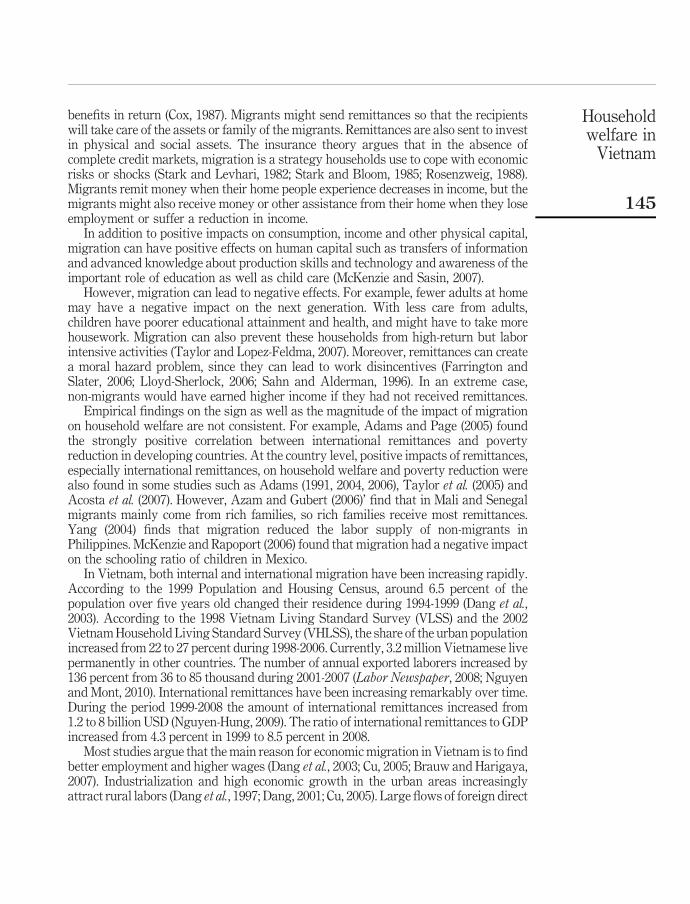
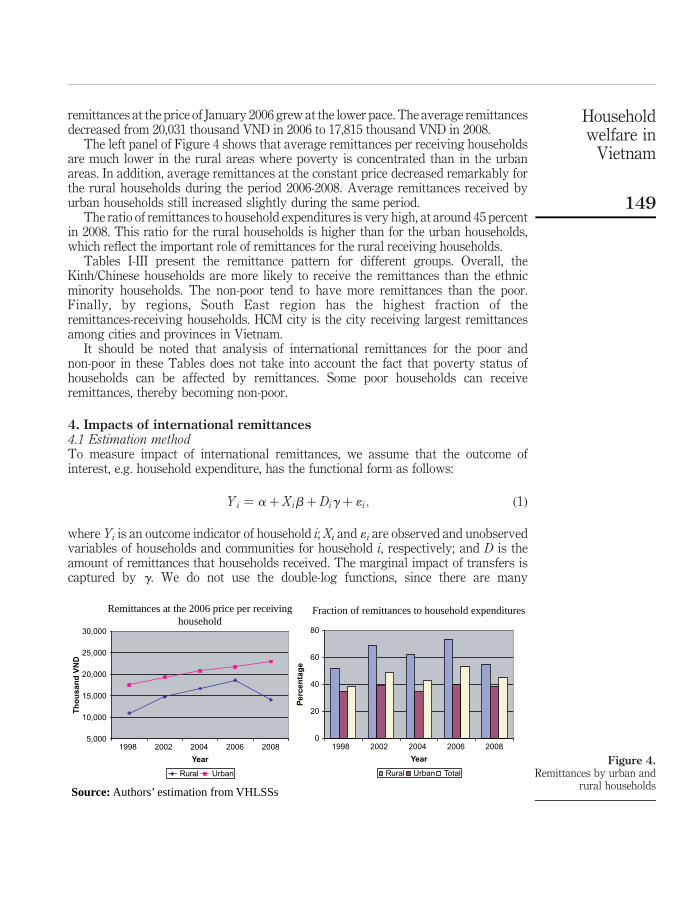
The left panel of Figure 2 shows the main employment of the overseas workers. Thedistribution of jobs is quite volatile. In 2001 relatively few migrants worked as
Figure 1.The number of Vietnam’s
exported workers
The number of export laborers Export laborers by destination countries
0
20,000
40,000
60,000
80,000
100,000
2000 2001 2002 2003 2004 2005 2006 2007 2008Years
Male Female Total
0%
20%
40%
60%
80%
100%
2000 2001 2002 2003 2004 2005 2006 2007 2008Years
Taiwan Japan South Korea Malaysia Others
Source: Authors’ preparation using data from Department of Overseas Labor of MOLISA
Figure 2.Vietnam’s labor export by
employment and wage
Employment
0%
20%
40%
60%
80%
100%
2001 2002 2003 2004 2005
Years
Manufacture Construction,textile and garmentWorking for households Sailors and fish catchOthers
Yearly wage
Source: Authors’ preparation using data from Department of Overseas Labor of MOLISA
Householdwelfare in
Vietnam
147
household labor, but in 2003 and 2004 it was the main job for export labor. In 2005, onthe other hand, a large proportion of export laborers worked in the construction, textileand garment industries.
Wages of export workers vary significantly across destination countries (Rightpanel of Figure 1). Japan and South Korea have the highest wages, at 7,850 and 7,492USD per year, respectively. Malaysia which is one of the main destinations of exportlabor has a yearly wage of only 1,800 USD.
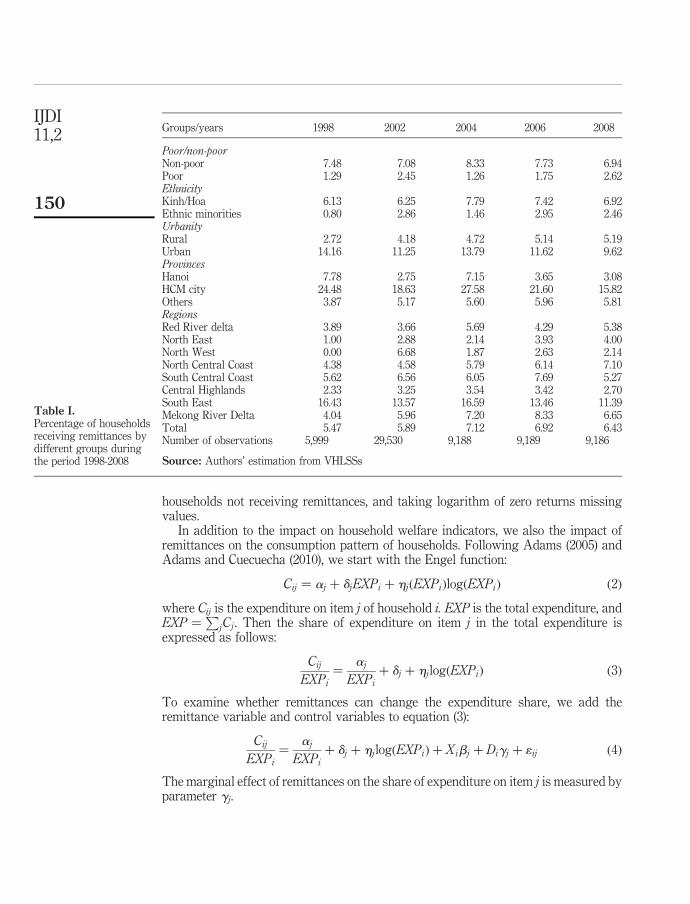
3.2 International remittancesThis section presents the analysis of international remittances using VHLSSs. VHLSSs2002, 2004, 2006 and 2008 contain information on international remittances thathouseholds received.
As expected, according the 2008 VHLSS, HCM city receives the most remittances,even though according to MOLISA (2008), there are no export workers from HCM cityduring 2006-2008 and the city has no sampled households in the VHLSS sendinginternational migrants. HCM city has a large number of households with relatives whostay abroad permanently, while HCM city exports a negligible number of workers.Two-third of the total remittances to Vietnam are sent from the USA, where there aremore than two million Vietnamese living permanently (Quoc-Toan, 2009).
Since the number of households receiving international remittances in the VHLSSs ishigher, we examine the pattern of international remittances in more detail. The left panelof Figure 3 shown the percentage of households receiving remittances during the period1998-2008, which was rather stable during this period. However, the fraction of theurban households receiving remittances tends to decrease slightly in the recent years.
It is also interesting to note the drop in remittances in 2008, a year with a verysignificant spike in inflation. Whether the inflation spike caused the drop inremittances is not known. However, our results suggest that most remittances end upgoing to saving and housing investments. If interest rates and housing appreciationwere not keeping up with inflation, then transferring money from other currencies intoViet Nam Dong (VND) might have had a depressing effect on remittances.
The average remittances per receiving household at the current (nominal) priceincreased significantly overtime. When adjusted for price inflation, the average
Figure 3.Remittances in Vietnam
Percentage of households receiving remittances Remittances per receiving household
0
4
8
12
16
1998 2002 2004 2006 2008
Year
Per
cen
tag
e
Rural Urban Total
5,000
10,000
15,000
20,000
25,000
30,000
1998 2002 2004 2006 2008
Year
Th
ou
san
d V
ND
In current price In price of January 2006
Source: Authors’ estimation from VHLSSs
IJDI11,2
148
remittances at the price of January 2006 grew at the lower pace. The average remittancesdecreased from 20,031 thousand VND in 2006 to 17,815 thousand VND in 2008.
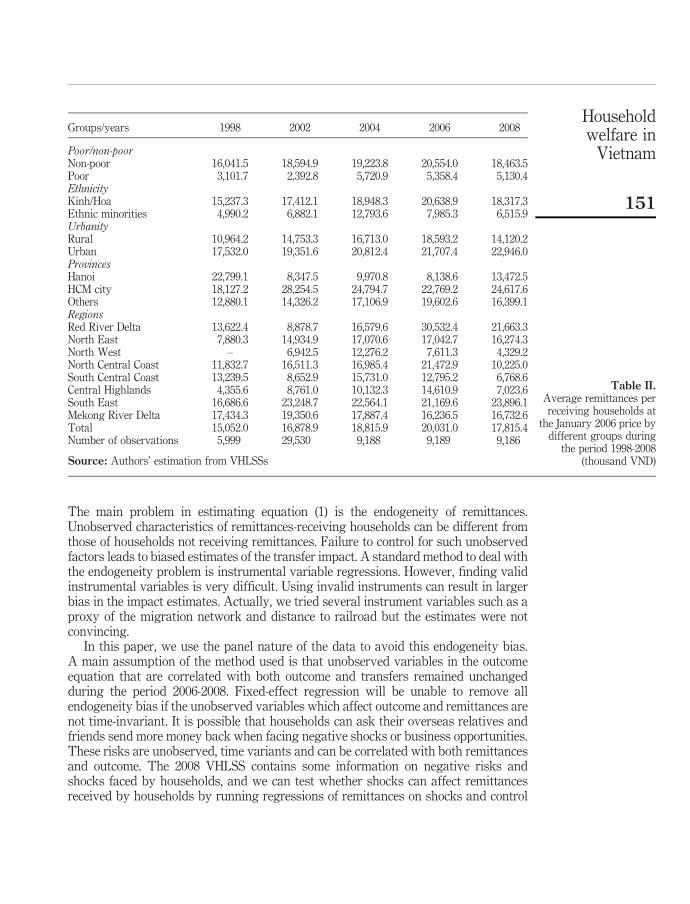
The left panel of Figure 4 shows that average remittances per receiving householdsare much lower in the rural areas where poverty is concentrated than in the urbanareas. In addition, average remittances at the constant price decreased remarkably forthe rural households during the period 2006-2008. Average remittances received byurban households still increased slightly during the same period.
The ratio of remittances to household expenditures is very high, at around 45 percentin 2008. This ratio for the rural households is higher than for the urban households,which reflect the important role of remittances for the rural receiving households.
Tables I-III present the remittance pattern for different groups. Overall, theKinh/Chinese households are more likely to receive the remittances than the ethnicminority households. The non-poor tend to have more remittances than the poor.Finally, by regions, South East region has the highest fraction of theremittances-receiving households. HCM city is the city receiving largest remittancesamong cities and provinces in Vietnam.
It should be noted that analysis of international remittances for the poor andnon-poor in these Tables does not take into account the fact that poverty status ofhouseholds can be affected by remittances. Some poor households can receiveremittances, thereby becoming non-poor.
4. Impacts of international remittances4.1 Estimation methodTo measure impact of international remittances, we assume that the outcome ofinterest, e.g. household expenditure, has the functional form as follows:
Yi ¼ aþ Xibþ Digþ 1i; ð1Þ
where Yi is an outcome indicator of household i; Xi and 1i are observed and unobservedvariables of households and communities for household i, respectively; and D is theamount of remittances that households received. The marginal impact of transfers iscaptured by g. We do not use the double-log functions, since there are many
Figure 4.Remittances by urban and
rural households
5,000
10,000
15,000
20,000
25,000
30,000
1998 2002 2004 2006 2008
Year
Th
ou
san
d V
ND
Rural Urban
0
20
40
60
80
1998 2002 2004 2006 2008
Year
Per
cen
tag
e
Rural Urban Total
Remittances at the 2006 price per receivinghousehold
Fraction of remittances to household expenditures
Source: Authors’ estimation from VHLSSs
Householdwelfare in
Vietnam
149
households not receiving remittances, and taking logarithm of zero returns missingvalues.
In addition to the impact on household welfare indicators, we also the impact ofremittances on the consumption pattern of households. Following Adams (2005) andAdams and Cuecuecha (2010), we start with the Engel function:
Cij ¼ aj þ djEXPi þ hjðEXPiÞlogðEXPiÞ ð2Þ
where Cij is the expenditure on item j of household i. EXP is the total expenditure, andEXP ¼
PjCj. Then the share of expenditure on item j in the total expenditure is
expressed as follows:
Cij
EXPi
¼aj
EXPi
þ dj þ hjlogðEXPiÞ ð3Þ
To examine whether remittances can change the expenditure share, we add theremittance variable and control variables to equation (3):
Cij
EXPi
¼aj
EXPi
þ dj þ hjlogðEXPiÞ þ Xibj þ Digj þ 1ij ð4Þ
The marginal effect of remittances on the share of expenditure on item j is measured byparameter gj.
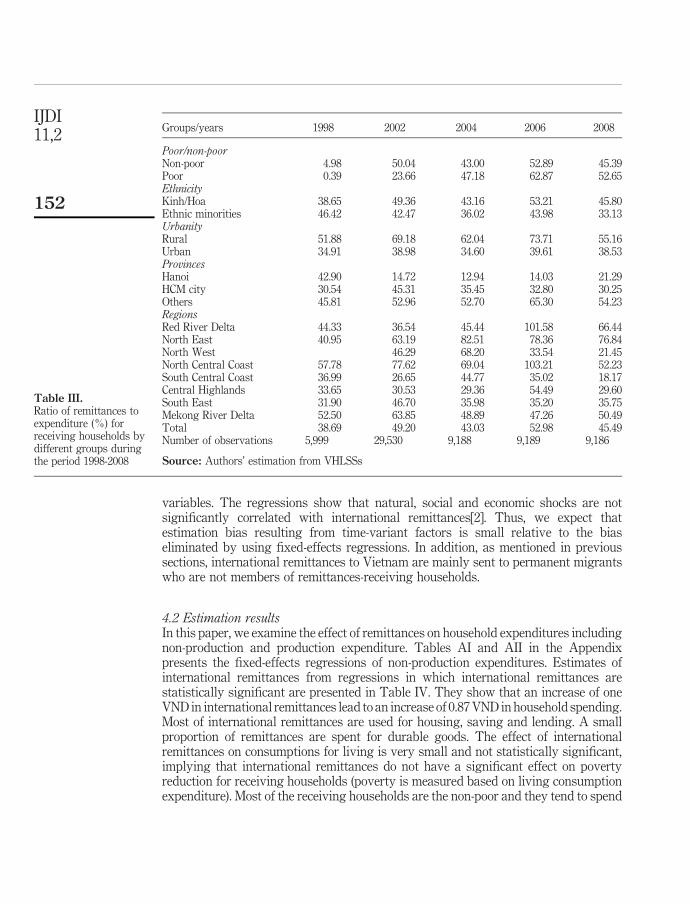
Groups/years 1998 2002 2004 2006 2008
Poor/non-poorNon-poor 7.48 7.08 8.33 7.73 6.94Poor 1.29 2.45 1.26 1.75 2.62EthnicityKinh/Hoa 6.13 6.25 7.79 7.42 6.92Ethnic minorities 0.80 2.86 1.46 2.95 2.46UrbanityRural 2.72 4.18 4.72 5.14 5.19Urban 14.16 11.25 13.79 11.62 9.62ProvincesHanoi 7.78 2.75 7.15 3.65 3.08HCM city 24.48 18.63 27.58 21.60 15.82Others 3.87 5.17 5.60 5.96 5.81RegionsRed River delta 3.89 3.66 5.69 4.29 5.38North East 1.00 2.88 2.14 3.93 4.00North West 0.00 6.68 1.87 2.63 2.14North Central Coast 4.38 4.58 5.79 6.14 7.10South Central Coast 5.62 6.56 6.05 7.69 5.27Central Highlands 2.33 3.25 3.54 3.42 2.70South East 16.43 13.57 16.59 13.46 11.39Mekong River Delta 4.04 5.96 7.20 8.33 6.65Total 5.47 5.89 7.12 6.92 6.43Number of observations 5,999 29,530 9,188 9,189 9,186
Source: Authors’ estimation from VHLSSs
Table I.Percentage of householdsreceiving remittances bydifferent groups duringthe period 1998-2008
IJDI11,2
150
The main problem in estimating equation (1) is the endogeneity of remittances.Unobserved characteristics of remittances-receiving households can be different fromthose of households not receiving remittances. Failure to control for such unobservedfactors leads to biased estimates of the transfer impact. A standard method to deal withthe endogeneity problem is instrumental variable regressions. However, finding validinstrumental variables is very difficult. Using invalid instruments can result in largerbias in the impact estimates. Actually, we tried several instrument variables such as aproxy of the migration network and distance to railroad but the estimates were notconvincing.
In this paper, we use the panel nature of the data to avoid this endogeneity bias.A main assumption of the method used is that unobserved variables in the outcomeequation that are correlated with both outcome and transfers remained unchangedduring the period 2006-2008. Fixed-effect regression will be unable to remove allendogeneity bias if the unobserved variables which affect outcome and remittances arenot time-invariant. It is possible that households can ask their overseas relatives andfriends send more money back when facing negative shocks or business opportunities.These risks are unobserved, time variants and can be correlated with both remittancesand outcome. The 2008 VHLSS contains some information on negative risks andshocks faced by households, and we can test whether shocks can affect remittancesreceived by households by running regressions of remittances on shocks and control
Groups/years 1998 2002 2004 2006 2008
Poor/non-poorNon-poor 16,041.5 18,594.9 19,223.8 20,554.0 18,463.5Poor 3,101.7 2,392.8 5,720.9 5,358.4 5,130.4EthnicityKinh/Hoa 15,237.3 17,412.1 18,948.3 20,638.9 18,317.3Ethnic minorities 4,990.2 6,882.1 12,793.6 7,985.3 6,515.9UrbanityRural 10,964.2 14,753.3 16,713.0 18,593.2 14,120.2Urban 17,532.0 19,351.6 20,812.4 21,707.4 22,946.0ProvincesHanoi 22,799.1 8,347.5 9,970.8 8,138.6 13,472.5HCM city 18,127.2 28,254.5 24,794.7 22,769.2 24,617.6Others 12,880.1 14,326.2 17,106.9 19,602.6 16,399.1RegionsRed River Delta 13,622.4 8,878.7 16,579.6 30,532.4 21,663.3North East 7,880.3 14,934.9 17,070.6 17,042.7 16,274.3North West – 6,942.5 12,276.2 7,611.3 4,329.2North Central Coast 11,832.7 16,511.3 16,985.4 21,472.9 10,225.0South Central Coast 13,239.5 8,652.9 15,731.0 12,795.2 6,768.6Central Highlands 4,355.6 8,761.0 10,132.3 14,610.9 7,023.6South East 16,686.6 23,248.7 22,564.1 21,169.6 23,896.1Mekong River Delta 17,434.3 19,350.6 17,887.4 16,236.5 16,732.6Total 15,052.0 16,878.9 18,815.9 20,031.0 17,815.4Number of observations 5,999 29,530 9,188 9,189 9,186
Source: Authors’ estimation from VHLSSs
Table II.Average remittances perreceiving households at
the January 2006 price bydifferent groups during
the period 1998-2008(thousand VND)
Householdwelfare in
Vietnam
151
variables. The regressions show that natural, social and economic shocks are notsignificantly correlated with international remittances[2]. Thus, we expect thatestimation bias resulting from time-variant factors is small relative to the biaseliminated by using fixed-effects regressions. In addition, as mentioned in previoussections, international remittances to Vietnam are mainly sent to permanent migrantswho are not members of remittances-receiving households.
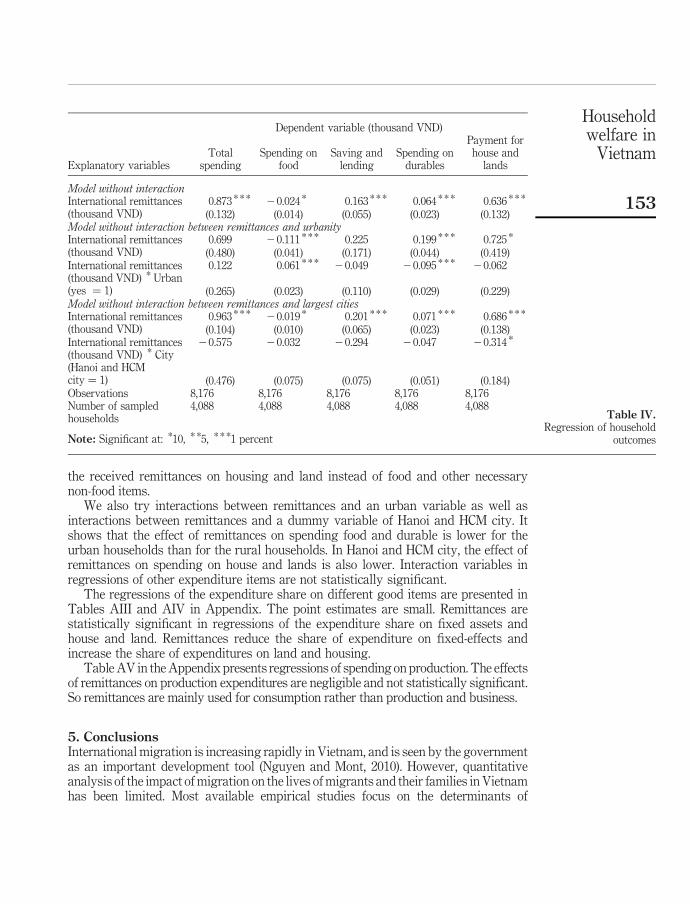
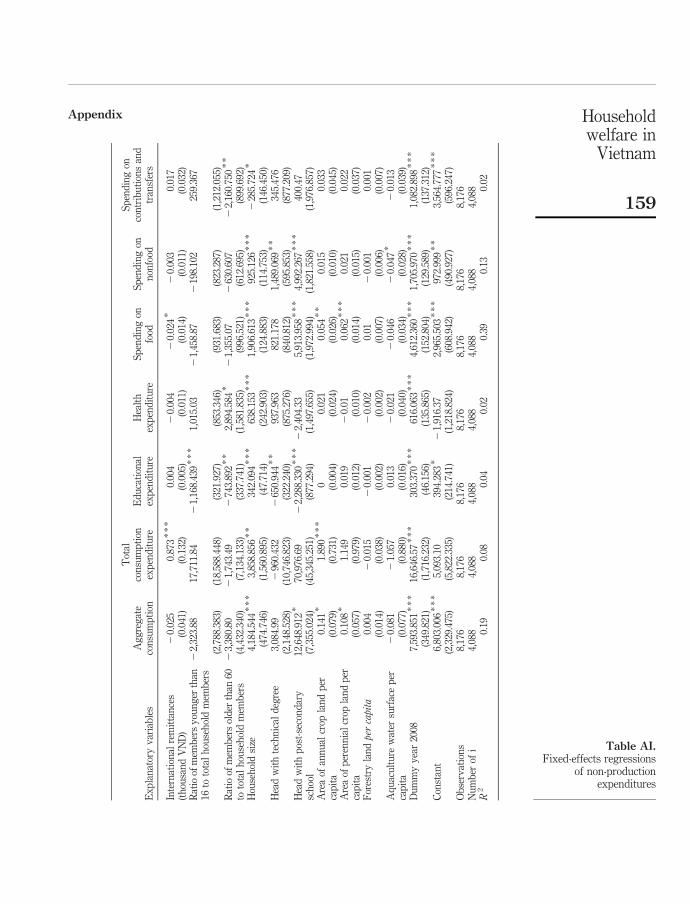
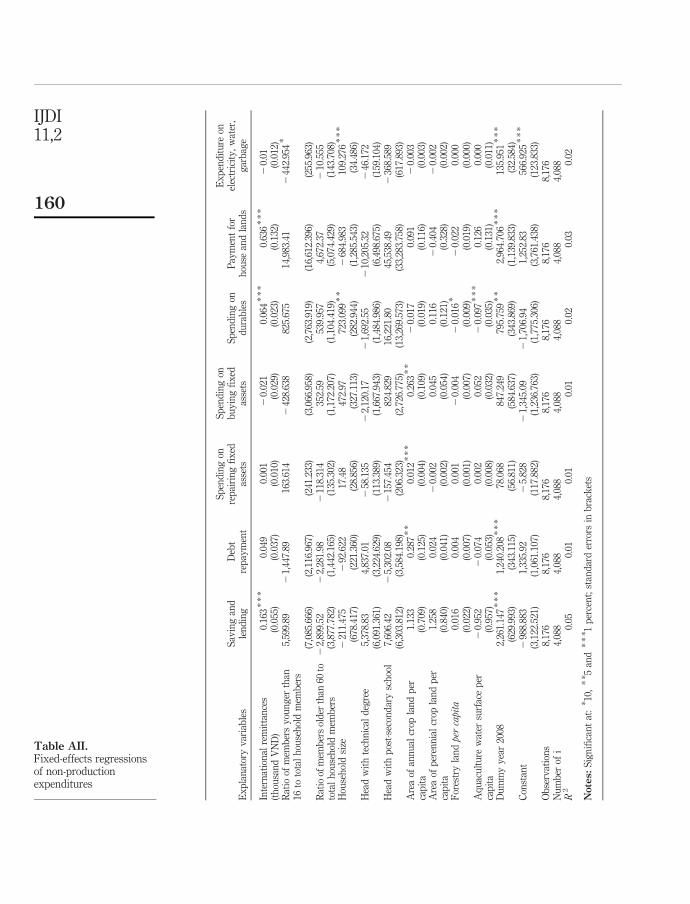
4.2 Estimation resultsIn this paper, we examine the effect of remittances on household expenditures includingnon-production and production expenditure. Tables AI and AII in the Appendixpresents the fixed-effects regressions of non-production expenditures. Estimates ofinternational remittances from regressions in which international remittances arestatistically significant are presented in Table IV. They show that an increase of oneVND in international remittances lead to an increase of 0.87 VND in household spending.Most of international remittances are used for housing, saving and lending. A smallproportion of remittances are spent for durable goods. The effect of internationalremittances on consumptions for living is very small and not statistically significant,implying that international remittances do not have a significant effect on povertyreduction for receiving households (poverty is measured based on living consumptionexpenditure). Most of the receiving households are the non-poor and they tend to spend
Groups/years 1998 2002 2004 2006 2008
Poor/non-poorNon-poor 4.98 50.04 43.00 52.89 45.39Poor 0.39 23.66 47.18 62.87 52.65EthnicityKinh/Hoa 38.65 49.36 43.16 53.21 45.80Ethnic minorities 46.42 42.47 36.02 43.98 33.13UrbanityRural 51.88 69.18 62.04 73.71 55.16Urban 34.91 38.98 34.60 39.61 38.53ProvincesHanoi 42.90 14.72 12.94 14.03 21.29HCM city 30.54 45.31 35.45 32.80 30.25Others 45.81 52.96 52.70 65.30 54.23RegionsRed River Delta 44.33 36.54 45.44 101.58 66.44North East 40.95 63.19 82.51 78.36 76.84North West 46.29 68.20 33.54 21.45North Central Coast 57.78 77.62 69.04 103.21 52.23South Central Coast 36.99 26.65 44.77 35.02 18.17Central Highlands 33.65 30.53 29.36 54.49 29.60South East 31.90 46.70 35.98 35.20 35.75Mekong River Delta 52.50 63.85 48.89 47.26 50.49Total 38.69 49.20 43.03 52.98 45.49Number of observations 5,999 29,530 9,188 9,189 9,186
Source: Authors’ estimation from VHLSSs
Table III.Ratio of remittances toexpenditure (%) forreceiving households bydifferent groups duringthe period 1998-2008
IJDI11,2
152
the received remittances on housing and land instead of food and other necessarynon-food items.
We also try interactions between remittances and an urban variable as well asinteractions between remittances and a dummy variable of Hanoi and HCM city. Itshows that the effect of remittances on spending food and durable is lower for theurban households than for the rural households. In Hanoi and HCM city, the effect ofremittances on spending on house and lands is also lower. Interaction variables inregressions of other expenditure items are not statistically significant.
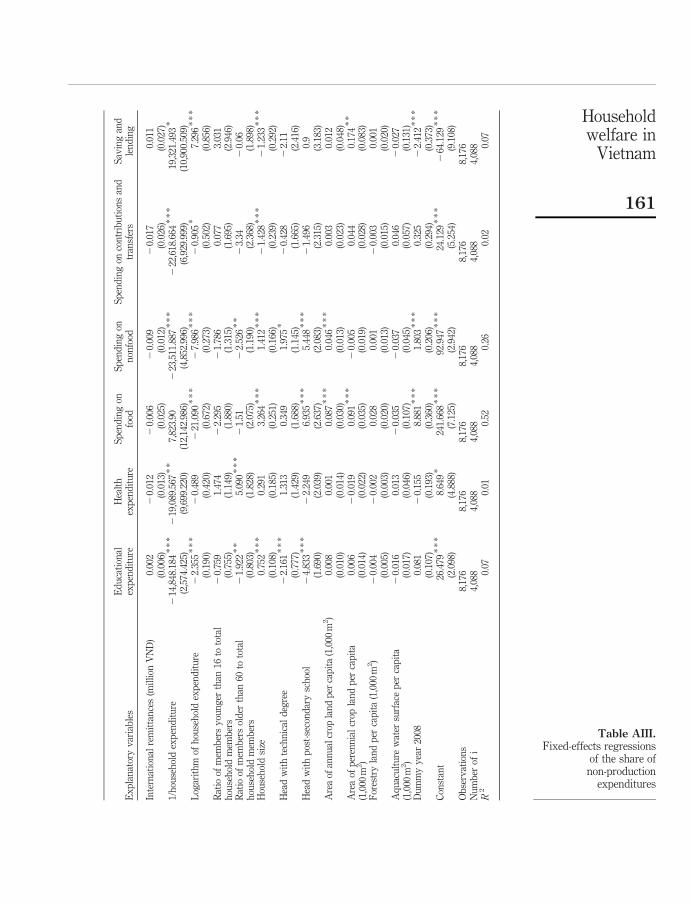
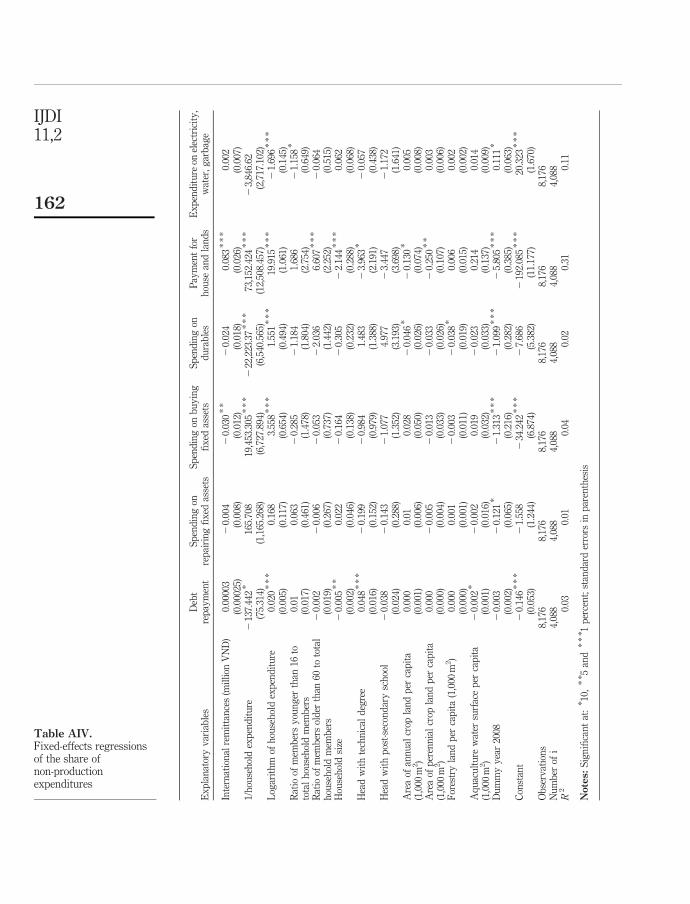
The regressions of the expenditure share on different good items are presented inTables AIII and AIV in Appendix. The point estimates are small. Remittances arestatistically significant in regressions of the expenditure share on fixed assets andhouse and land. Remittances reduce the share of expenditure on fixed-effects andincrease the share of expenditures on land and housing.
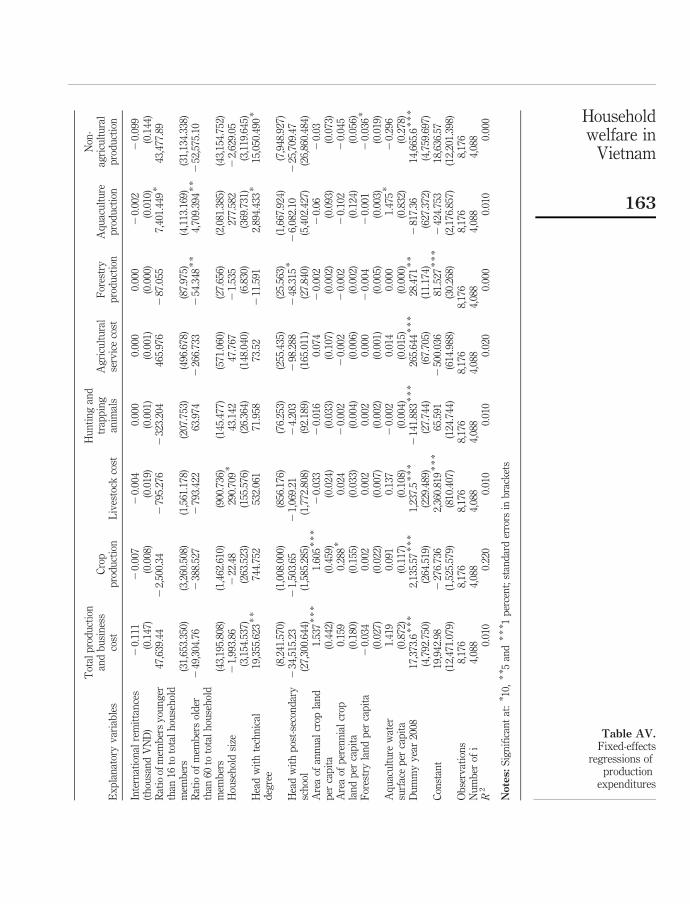
Table AV in the Appendix presents regressions of spending on production. The effectsof remittances on production expenditures are negligible and not statistically significant.So remittances are mainly used for consumption rather than production and business.
5. ConclusionsInternational migration is increasing rapidly in Vietnam, and is seen by the governmentas an important development tool (Nguyen and Mont, 2010). However, quantitativeanalysis of the impact of migration on the lives of migrants and their families in Vietnamhas been limited. Most available empirical studies focus on the determinants of
Dependent variable (thousand VND)
Explanatory variablesTotal
spendingSpending on
foodSaving and
lendingSpending on
durables
Payment forhouse and
lands
Model without interactionInternational remittances(thousand VND)
0.873 * * * 20.024 * 0.163 * * * 0.064 * * * 0.636 * * *
(0.132) (0.014) (0.055) (0.023) (0.132)Model without interaction between remittances and urbanityInternational remittances(thousand VND)
0.699 20.111 * * * 0.225 0.199 * * * 0.725 *
(0.480) (0.041) (0.171) (0.044) (0.419)International remittances(thousand VND) * Urban(yes ¼ 1)
0.122 0.061 * * * 20.049 20.095 * * * 20.062
(0.265) (0.023) (0.110) (0.029) (0.229)Model without interaction between remittances and largest citiesInternational remittances(thousand VND)
0.963 * * * 20.019 * 0.201 * * * 0.071 * * * 0.686 * * *
(0.104) (0.010) (0.065) (0.023) (0.138)International remittances(thousand VND) * City(Hanoi and HCMcity ¼ 1)
20.575 20.032 20.294 20.047 20.314 *
(0.476) (0.075) (0.075) (0.051) (0.184)Observations 8,176 8,176 8,176 8,176 8,176Number of sampledhouseholds
4,088 4,088 4,088 4,088 4,088
Note: Significant at: *10, * *5, * * *1 percent
Table IV.Regression of household
outcomes
Householdwelfare in
Vietnam
153
migration and the impact of remittances on consumption and poverty. This paperattempts to partially fill that gap by examining the use of international remittances byVietnamese families.
Most international remittances go to non-poor families, so the impact of migrationon poverty alleviation is limited, although a recent program promoting internationalmigration in poor areas might begin changing that (Nguyen and Mont, 2010).Presently, though, remittances disproportionately go to non-poor, ethnic majoritypopulations living in urban areas, particularly Ho Chi Minh City.
Similar to findings in other countries, most of the households receiving internationalremittances are more likely to invest them, rather than put them towards consumption.However, unlike some countries such as Guatemala and Mexico where internationalremittances are used for productive assets, education and health (Taylor and Mora,2006; Adams, 2005), most international remittances in Vietnam are used to purchaseland and housing. This is reasonable, since most receiving households in Vietnam arebetter-off and non-agricultural.
If most international migration experiences are temporary, the finding on the positiveeffect of international remittances on housing spending in Vietnam makes sense. A shortspike in income is not likely to be consumed all at once, but rather be leveraged intosecuring a more stable financial situation. By investing in items like housing, thisinvestment is also more able to be shared with other family members and acrossgenerations. This coincides with many motives for migration – increasing income,altruism (giving to families), and securing a wealth base to insure against possible futureincome shocks. However, while short-term international migration is growing inVietnam, the bulk of the remittances are still coming from permanent migrants, fromwho the stream of remittances is more likely to be seen as part of permanent income. Sowe might expect more of those remittances to be financing consumption – except for thefact that families receiving these remittances from these sources are generally thought tobe the best off financially, so consumption needs are not as important.
In fact, in a previous study of international remittances, it was found that they did leadto increased consumption. Using VHLSSs in 2002 and 2004, Nguyen (2008) found apositive effect of international remittances on consumption and poverty reduction. Thefact that remittances are longer used this way, could have to do with the significant growthrates in household income in Vietnam and new opportunities for saving and investment.
It should be noted that our estimates show the effect of international remittances forall of the receiving households. For some specific groups such as poor and farmhouseholds, the effect of international remittances on consumption and povertyreduction could be higher. The effect of international remittances can also differ fordifferent types of migrants including permanent and temporary. Estimation ofdisaggregated impacts of international remittances sent by permanent and temporarymigration for different groups requires data from larger surveys. Thus, it is beyond thescope of the paper, but certainly important for future research.
The findings from this paper suggest that current international remittances are notan effective measure for poverty reduction in the short-run. To increase the effect ofremittances on poverty, remittances should be received by poor households. Currently,the government has launched programs to support the poor in sending internationalmigrants so this may begin to change somewhat. Also, policies which allow Vietnamese
IJDI11,2
154
in foreign countries to buy property in Vietnam could be an effective measure to attractmore international remittances.
Notes
1. The sample selection of VHLSSs follows a method of stratified random cluster sampling.GSO selected households in all rural and urban provinces of Vietnam. The number ofprovinces is 64 in 2006-2008, so the number of strata were. Among each stratum, communeswere selected randomly as primary sampling unit. The number of communes per stratum isproportionate to the population proportion of the strata over the total population. Thenumber of selected communes in each VHLSS is around 3,000. In each commune, aroundthree households were selected randomly.
2. We do not present these regressions in this paper. The regression results can be provided onrequest.
References
Acosta, P., Calderon, C., Fajnzylber, P. and Lopez, H. (2007), “What is the impact of internationalremittances on poverty and inequality in Latin America?”, World Development, Vol. 36No. 1, pp. 89-114.
Adams, R.H. Jr (1991), “The effects of international remittances on poverty, inequality anddevelopment in rural Egypt”, Research Report 86, IFPRI.
Adams, R.H. Jr (2004), “Remittances and poverty in Guatemala”, World Bank Policy ResearchWorking Paper No. 3418, September.
Adams, R.H. Jr (2005), “Remittances, household expenditure and investment in Guatemala”,Policy Research Working Paper No. WPS 3532, World Bank, Geneva.
Adams, R.H. Jr (2006), “Remittances and poverty in Ghana”, World Bank Policy ResearchWorking Paper No. 3838, The World Bank, Washington, DC.
Adams, R.H. Jr and Cuecuecha, A. (2010), “Remittances, household expenditure and investmentin Guatemala”, World Development, Vol. 38 No. 11, pp. 1626-41.
Adams, R.H. Jr and Page, J. (2005), “Do international migration and remittances reduce poverty indeveloping countries?”, World Development, Vol. 33, pp. 1645-69.
Azam, J.P. and Gubert, F. (2006), “Migrants’ remittances and the household in Africa: a review ofevidence”, Journal of African Economies, Vol. 15 No. 2, pp. 426-62.
Brauw, A. and Harigaya, T. (2007), “Seasonal migration and improving living standards inVietnam”, American Journal of Agricultural Economics, Vol. 89 No. 2, pp. 430-47.
Cox, D. (1987), “Motives for private income transfers”, Journal of Political Economy, Vol. 95,pp. 508-46.
Cox, D. (1990), “Intergenerational transfers and liquidity constraints”, Quarterly Journal ofEconomics, Vol. 105, pp. 187-217.
Cu, C.L. (2005), “Rural to urban migration in Vietnam”, in Ha Huy, T and Shozo, S. (Eds), Impactof Socio-economic Changes on the Livelihoods of People Living in Poverty in Vietnam,Chapter 5, Institute of Developing Economies, Japan External Trade Organization, Osaka.
Dang, N.A. (2001), “Rural labor out-migration in Vietnam: a multi-level analysis”, Migration inVietnam-Theoretical Approaches and Evidence from a Survey, Transport CommunicationPublishing House, Beijing.
Dang, N.A. and Nguyen, T.L. (2006), Vietnam Migration Survey 2004 Internal Migration andRelated Life Course Events, VASS, Hanoi, Mimeo.
Householdwelfare in
Vietnam
155
Dang, A., Goldstein, S. and McNally, J.W. (1997), “Internal migration and development inVietnam”, International Migration Review, Vol. 31 No. 2, pp. 312-37.
Dang, N.A., Tackle, C. and Hoang, X.T. (2003), “Migration in Vietnam: a review of information oncurrent trends and patterns, and their policy implications”, paper presented at theRegional Conference on Migration, Development and Pro-Poor Policy Choices in Asia,Dhaka, Bangladesh, 22-24 June.
Djamba, Y., Goldstein, S. and Goldstein, A. (1999), “Permanent and temporary migration inVietnam during a period of economic change”, Asia-PacificMigration Journal, Vol. 14 No. 3,pp. 25-8.
Nguyen, H.L. and Mont, D. (2010), “Vietnam’s regulatory, institutional and governance structurefor cross-border labor migration”, working paper.
Farrington, J. and Slater, R. (2006), “Introduction: cash transfers: panacea for poverty reductionor money down the drain?”, Development Policy Review, Vol. 24 No. 5, pp. 499-511.
GSO and UNFPA (United Nation Population Fund) (2005), Vietnam Migration Survey 2004:Major Findings, Statistical Publishing House, Hanoi.
Guest, P. (1998), “The dynamics of internal migration in Vietnam”, UNDP Discussion Paper 1,Hanoi, Vietnam.
Harris, J. and Todaro, M. (1970), “Migration, unemployment and development: a two-sectoranalysis”, American Economic Review, Vol. 60 No. 1, pp. 126-42.
Katz, E. and Stark, O. (1986), “Labor migration and risk aversion in less developed countries”,Journal of Labor Economics, Vol. 4 No. 1, pp. 134-49.
Labor Newspaper (2008), “Exporting labors”, Labor Union of Ho Chi Minh City, November11 (in Vietnamese).
Lloyd-Sherlock, P. (2006), “Simple transfers, complex outcomes: the impacts of pensions on poorhouseholds in Brazil”, Development and Change, Vol. 37 No. 5, pp. 969-95.
Lucas, R. and Stark, O. (1985), “Motivations to remit: evidence from Botswana”, Journal ofPolitical Economy, Vol. 93 No. 5, pp. 901-18.
McKenzie, D. and Rapoport, H. (2006), “Can migration reduce educational attainment? Evidencefrom Mexico”, Policy Research Working Paper No. 3952, The World Bank, Geneva.
McKenzie, D. and Sasin, M. (2007), “Migration, remittances, poverty, and human capital:conceptual and empirical challenges”, Policy Research Working Paper No. 4272, TheWorld Bank, Geneva.
MOLISA (2008), Proceedings of Conference on Employment and Labor Export, Ministry of Labor,Invalid and Social Affairs of Vietnam, Hanoi, December 15.
Nguyen, T.P., Tran, N.T.M.T., Nguyen, T.N. and Oostendorp, R. (2008), “Determinants andimpacts of migration in Vietnam”, Depocen Working Paper Series No. 2008/01,available at: www.depocenwp.org
Nguyen, V.C. (2008), “Do foreign remittances matter to poverty and inequality? Evidence fromVietnam”, Economics Bulletin, Vol. 15 No. 1, pp. 1-11.
Nguyen, V.C., Van den Berg, M. and Lensink, R. (2009), “The impact of work migration andnon-work migration on household welfare, poverty and inequality: evidence fromVietnam”, unpublished manuscript.
Nguyen-Hung (2009), Kieu hoi nam 2008 dat 8 ty USD. Vnexpress January 6. available at: www.vnexpress.net/GL/Kinh-doanh/2009/01/3BA0A26D/
Nguyen-Minh, T. (2008), “Migration, remittances, and economic development: case of Vietnam”,unpublished manuscript.
IJDI11,2
156
Quoc-Toan, T. (2009), “Lao do_;ng di cu- va kie�;i su, t gia?, m theo kinh te,”, VietnamNetNewspaper, 10 September.
Ravallion, M. and van de Walle, D. (2006), “Does rising landlessness signal success or failure forVietnam’s agrarian transition?”, Policy Research Working Paper No. 3871,The World Bank, Washington, DC.
Rosenzweig, M.R. (1988), “Risk, implicit contracts and the family in rural areas of low incomecountries”, Economic Journal, Vol. 393, pp. 1148-70.
Sahn, E.D. and Alderman, H. (1996), “The effect of food subsidies on labor supply in Sri Lanka”,Economic Development and Cultural Change, Vol. 45 No. 1, pp. 125-45.
Stark, O. (1980), “On the role of urban-rural remittances in rural development”, Journal ofDevelopment Studies, Vol. 16 No. 3, pp. 369-74.
Stark, O. (1991), The Migration of Labour, Harvard University Press, Cambridge, MA.
Stark, O. (1995), Altruism and Beyond, Basil Blackwell, Oxford.
Stark, O. and Bloom, D. (1985), “The new economics of labor migration”, American EconomicReview, Vol. 75, pp. 173-8.
Stark, O. and Levhari, D. (1982), “On migration and risk in LDCs”, Economic Development andCultural Change, Vol. 31, pp. 191-6.
Stark, O. and Taylor, J. (1991), “Migration incentives, migration types: the role of relativedeprivation”, The Economic Journal, Vol. 101, pp. 1163-78.
Taylor, E. and Lopez-Feldma, A. (2007), “Does migration make rural households moreproductive? Evidence from Mexico”, ESA Working Paper No. 07-10, FAO.
Taylor, E. and Mora, J. (2006), “Does migration reshape expenditure in rural households?Evidence from Mexico”, Policy Research Working Paper No. WPS 3842, World Bank,Geneva.
Taylor, J.E., Mora, J., Adams, R.H. Jr and Lopez-Feldman, A. (2005), Remittances, Inequality, andPoverty: Evidence from Rural Mexico, mimeo, University of California, Berkeley, CA.
Yang, D. (2004), “International migration, human capital, and entrepreneurship: evidence fromPhilippine migrants’ exchange rate shocks”, Working Paper Series 02-011, Gerald R. FordSchool of Public Policy, University of Michigan, Ann Arbor, MI.
Further reading
Acosta, P. (2006), “Labor supply, school attendance, and remittances from internationalmigration: the case of El Salvador”, Policy Research Working Paper No. 3903, The WorldBank, Geneva.
Adams, R.H. Jr (1989), “Workers’ remittances and inequality”, Development and Cultural Change,Vol. 38 No. 1, pp. 45-71.
Adams, R.H. Jr, Cuecuecha, A. and Page, J. (2008), “Remittances, consumption and investment inGhana”, Policy Research Working Paper Series No. 4515, The World Bank, Geneva.
Dang, N.A. (2001), Migration in Vietnam: Theoretical Approaches and Evidence from a Survey,Hanoi.
Dang, N.A., Goldstein, S. and Mc Nally, J. (1997), “Internal migration and development inVietnam”, International Migration Review, Vol. 31 No. 2, pp. 312-37.
Foster, J., Greer, J. and Thorbecke, E. (1984), “A class of decomposable poverty measures”,Econometrica, Vol. 52, pp. 761-5.
Householdwelfare in
Vietnam
157
Heckman, J., Lalonde, R. and Smith, J. (1999), “The economics and econometrics of active labormarket programs”, in Ashenfelter, A. and Card, D. (Eds), Handbook of Labor Economics,Vol. 3, Elsevier Science, Amsterdam.
Mansuri, G. (2006), “Migration, sex bias, and child growth in rural Pakistan”, Policy ResearchWorking Paper No. 3946, The World Bank, Geneva.
Stark, O. and David, E. (1985), “The new economics of labor migration”, American EconomicReview, Vol. 75 No. 2, pp. 173-8.
Wooldridge, J.M. (2001), Econometric Analysis of Cross Section and Panel Data, The MIT Press,Cambridge, MA.
Corresponding authorNguyen Viet Cuong can be contacted at: [email protected]
To purchase reprints of this article please e-mail: [email protected] visit our web site for further details: www.emeraldinsight.com/reprints
IJDI11,2
158
Appendix
Ex
pla
nat
ory
var
iab
les
Ag
gre
gat
eco
nsu
mp
tion
Tot
alco
nsu
mp
tion
exp
end
itu
reE
du
cati
onal
exp
end
itu
reH
ealt
hex
pen
dit
ure
Sp
end
ing
onfo
odS
pen
din
gon
non
food
Sp
end
ing
onco
ntr
ibu
tion
san
dtr
ansf
ers
Inte
rnat
ion
alre
mit
tan
ces
(th
ousa
nd
VN
D)
20.
025
0.87
3*
**
0.00
42
0.00
42
0.02
4*
20.
003
0.01
7(0
.041
)(0
.132
)(0
.005
)(0
.011
)(0
.014
)(0
.011
)(0
.032
)R
atio
ofm
emb
ers
you
ng
erth
an16
toto
tal
hou
seh
old
mem
ber
s2
2,32
3.88
17,7
11.8
42
1,16
8.43
9*
**
1,01
5.03
21,
458.
872
198.
102
259.
367
(2,7
88.3
83)
(18,
588.
448)
(321
.927
)(8
53.3
46)
(931
.683
)(8
23.2
87)
(1,2
12.0
55)
Rat
ioof
mem
ber
sol
der
than
60to
tota
lh
ouse
hol
dm
emb
ers
23,
380.
802
1,74
3.49
274
3.89
2*
*2,
894.
584
*2
1,35
5.07
263
0.60
72
2,16
0.75
0*
*
(4,4
32.3
40)
(7,1
34.1
33)
(337
.741
)(1
,581
.835
)(9
96.5
21)
(612
.695
)(8
99.6
92)
Hou
seh
old
size
4,18
4.54
4*
**
3,85
8.85
6*
*34
2.09
4*
**
638.
153
**
*1,
906.
613
**
*92
5.12
6*
**
228
5.72
4*
(474
.746
)(1
,560
.895
)(4
7.71
4)(2
42.9
03)
(124
.883
)(1
14.7
53)
(146
.450
)H
ead
wit
hte
chn
ical
deg
ree
3,08
4.99
296
0.43
22
650.
944
**
937.
963
821.
178
1,48
9.06
9*
*34
5.47
6(2
,148
.528
)(1
0,74
6.82
3)(3
22.2
40)
(875
.276
)(8
40.8
12)
(595
.853
)(8
77.2
09)
Hea
dw
ith
pos
t-se
con
dar
ysc
hoo
l12
,648
.912
*70
,976
.69
22,
288.
330
**
*2
2,40
4.33
5,91
3.95
8*
**
4,99
2.26
7*
**
400.
47(7
,355
.024
)(4
5,34
5.25
1)(8
77.2
94)
(1,4
97.6
55)
(1,9
72.9
94)
(1,8
21.5
58)
(1,9
76.8
57)
Are
aof
ann
ual
crop
lan
dp
erca
pit
a0.
141
*1.
890
**
*0
0.02
10.
054
**
0.01
50.
033
(0.0
79)
(0.7
31)
(0.0
04)
(0.0
24)
(0.0
26)
(0.0
10)
(0.0
45)
Are
aof
per
enn
ial
crop
lan
dp
erca
pit
a0.
108
*1.
149
0.01
92
0.01
0.06
2*
**
0.02
10.
022
(0.0
57)
(0.9
79)
(0.0
12)
(0.0
10)
(0.0
14)
(0.0
15)
(0.0
37)
For
estr
yla
ndpercapita
0.00
42
0.01
52
0.00
12
0.00
20.
012
0.00
10.
001
(0.0
14)
(0.0
38)
(0.0
02)
(0.0
02)
(0.0
07)
(0.0
06)
(0.0
07)
Aq
uac
ult
ure
wat
ersu
rfac
ep
erca
pit
a2
0.08
12
1.05
70.
013
20.
021
20.
046
20.
047
*2
0.01
3(0
.077
)(0
.880
)(0
.016
)(0
.040
)(0
.034
)(0
.028
)(0
.039
)D
um
my
yea
r20
087,
593.
851
**
*16
,646
.57
**
*30
3.37
0*
**
616.
063
**
*4,
612.
360
**
*1,
705.
970
**
*1,
082.
898
**
*
(349
.821
)(1
,716
.232
)(4
6.15
6)(1
35.8
65)
(152
.804
)(1
29.5
89)
(137
.312
)C
onst
ant
6,80
3.00
6*
**
5,09
3.10
394.
283
*2
1,91
6.37
2,96
5.50
3*
**
972.
999
**
3,56
4.77
7*
**
(2,3
29.4
75)
(5,8
22.3
35)
(214
.741
)(1
,218
.824
)(6
08.9
42)
(490
.927
)(5
96.2
47)
Ob
serv
atio
ns
8,17
68,
176
8,17
68,
176
8,17
68,
176
8,17
6N
um
ber
ofi
4,08
84,
088
4,08
84,
088
4,08
84,
088
4,08
8R
20.
190.
080.
040.
020.
390.
130.
02
Table AI.Fixed-effects regressions
of non-productionexpenditures
Householdwelfare in
Vietnam
159
Ex
pla
nat
ory
var
iab
les
Sav
ing
and
len
din
gD
ebt
rep
aym
ent
Sp
end
ing
onre
pai
rin
gfi
xed
asse
ts
Sp
end
ing
onb
uy
ing
fix
edas
sets
Sp
end
ing
ond
ura
ble
sP
aym
ent
for
hou
sean
dla
nd
s
Ex
pen
dit
ure
onel
ectr
icit
y,
wat
er,
gar
bag
e
Inte
rnat
ion
alre
mit
tan
ces
(th
ousa
nd
VN
D)
0.16
3*
**
0.04
90.
001
20.
021
0.06
4*
**
0.63
6*
**
20.
01(0
.055
)(0
.037
)(0
.010
)(0
.029
)(0
.023
)(0
.132
)(0
.012
)R
atio
ofm
emb
ers
you
ng
erth
an16
toto
tal
hou
seh
old
mem
ber
s5,
599.
892
1,44
7.89
163.
614
242
8.63
882
5.67
514
,983
.41
244
2.95
4*
(7,0
85.6
66)
(2,1
16.9
67)
(241
.233
)(3
,066
.958
)(2
,763
.919
)(1
6,61
2.39
6)(2
55.9
63)
Rat
ioof
mem
ber
sol
der
than
60to
tota
lh
ouse
hol
dm
emb
ers
22,
899.
522
2,28
1.98
211
8.31
435
2.59
539.
957
4,67
2.37
210
.555
(3,8
77.7
82)
(1,4
42.1
65)
(135
.302
)(1
,172
.207
)(1
,104
.419
)(5
,074
.429
)(1
43.7
08)
Hou
seh
old
size
221
1.47
52
92.6
2217
.48
472.
9772
3.09
9*
*2
684.
983
109.
276
**
*
(678
.417
)(2
21.3
60)
(28.
856)
(327
.113
)(2
82.9
44)
(1,2
85.5
43)
(34.
486)
Hea
dw
ith
tech
nic
ald
egre
e5,
378.
834,
837.
012
58.1
352
2,12
0.17
21,
692.
552
10,2
05.3
22
46.1
72(6
,091
.361
)(3
,224
.629
)(1
13.3
89)
(1,6
67.9
43)
(1,4
84.9
86)
(6,4
98.6
75)
(159
.104
)H
ead
wit
hp
ost-
seco
nd
ary
sch
ool
7,60
6.42
25,
302.
082
157.
454
824.
829
16,2
21.8
045
,538
.49
236
8.58
9(6
,303
.812
)(3
,584
.198
)(2
06.3
23)
(2,7
26.7
75)
(13,
269.
573)
(33,
283.
758)
(617
.893
)A
rea
ofan
nu
alcr
opla
nd
per
cap
ita
1.13
30.
287
**
0.01
2*
**
0.26
3*
*2
0.01
70.
091
20.
003
(0.7
09)
(0.1
25)
(0.0
04)
(0.1
09)
(0.0
19)
(0.1
16)
(0.0
03)
Are
aof
per
enn
ial
crop
lan
dp
erca
pit
a1.
258
0.02
42
0.00
20.
045
0.11
62
0.40
42
0.00
2(0
.840
)(0
.041
)(0
.002
)(0
.054
)(0
.121
)(0
.328
)(0
.002
)F
ores
try
lan
dpercapita
0.01
60.
004
0.00
12
0.00
42
0.01
6*
20.
022
0.00
0(0
.022
)(0
.007
)(0
.001
)(0
.007
)(0
.009
)(0
.019
)(0
.000
)A
qu
acu
ltu
rew
ater
surf
ace
per
cap
ita
20.
952
20.
074
0.00
20.
052
20.
097
**
*0.
126
0.00
0(0
.957
)(0
.053
)(0
.008
)(0
.032
)(0
.035
)(0
.131
)(0
.011
)D
um
my
yea
r20
082,
261.
147
**
*1,
240.
208
**
*78
.068
847.
249
795.
759
**
2,96
4.70
6*
**
135.
951
**
*
(629
.993
)(3
43.1
15)
(56.
811)
(584
.637
)(3
43.8
69)
(1,1
39.8
33)
(32.
584)
Con
stan
t2
988.
883
1,33
5.92
25.
828
21,
345.
092
1,70
6.94
1,25
2.83
566.
925
**
*
(3,1
22.5
21)
(1,0
61.1
07)
(117
.882
)(1
,236
.763
)(1
,775
.306
)(3
,761
.438
)(1
23.8
33)
Ob
serv
atio
ns
8,17
68,
176
8,17
68,
176
8,17
68,
176
8,17
6N
um
ber
ofi
4,08
84,
088
4,08
84,
088
4,08
84,
088
4,08
8R
20.
050.
010.
010.
010.
020.
030.
02
Notes:
Sig
nifi
can
tat
:* 1
0,*
* 5an
d*
** 1
per
cen
t;st
and
ard
erro
rsin
bra
cket
s
Table AII.Fixed-effects regressionsof non-productionexpenditures
IJDI11,2
160
Ex
pla
nat
ory
var
iab
les
Ed
uca
tion
alex
pen
dit
ure
Hea
lth
exp
end
itu
reS
pen
din
gon
food
Sp
end
ing
onn
onfo
odS
pen
din
gon
con
trib
uti
ons
and
tran
sfer
sS
avin
gan
dle
nd
ing
Inte
rnat
ion
alre
mit
tan
ces
(mil
lion
VN
D)
0.00
22
0.01
22
0.00
62
0.00
92
0.01
70.
011
(0.0
06)
(0.0
13)
(0.0
25)
(0.0
12)
(0.0
26)
(0.0
27)
1/h
ouse
hol
dex
pen
dit
ure
214
,848
.184
**
*2
19,0
89.5
67*
*7,
823.
902
23,5
11.8
87*
**
222
,618
.664
**
*19
,321
.493
*
(2,5
74.4
25)
(9,6
99.2
20)
(12,
142.
986)
(4,8
52.9
96)
(6,9
29.9
99)
(10,
900.
509)
Log
arit
hm
ofh
ouse
hol
dex
pen
dit
ure
22.
355
**
*2
0.48
92
21.0
90*
**
27.
986
**
*2
0.90
5*
7.29
6*
**
(0.1
90)
(0.4
20)
(0.6
72)
(0.2
73)
(0.5
02)
(0.8
56)
Rat
ioof
mem
ber
sy
oun
ger
than
16to
tota
lh
ouse
hol
dm
emb
ers
20.
759
1.47
42
2.29
52
1.78
60.
077
3.03
1(0
.755
)(1
.149
)(1
.880
)(1
.315
)(1
.695
)(2
.946
)R
atio
ofm
emb
ers
old
erth
an60
toto
tal
hou
seh
old
mem
ber
s2
1.92
2*
*5.
090
**
*2
1.51
22.
526
**
23.
342
0.06
(0.8
03)
(1.8
28)
(2.0
75)
(1.1
90)
(2.3
68)
(1.8
98)
Hou
seh
old
size
0.75
2*
**
0.29
13.
264
**
*1.
412
**
*2
1.42
8*
**
21.
233
**
*
(0.1
08)
(0.1
85)
(0.2
51)
(0.1
66)
(0.2
39)
(0.2
92)
Hea
dw
ith
tech
nic
ald
egre
e2
2.16
1*
**
1.31
30.
349
1.97
5*
20.
428
22.
11(0
.777
)(1
.429
)(1
.688
)(1
.145
)(1
.665
)(2
.416
)H
ead
wit
hp
ost-
seco
nd
ary
sch
ool
24.
833
**
*2
2.24
96.
935
**
*5.
448
**
*2
1.49
60.
9(1
.690
)(2
.039
)(2
.637
)(2
.083
)(2
.315
)(3
.183
)A
rea
ofan
nu
alcr
opla
nd
per
cap
ita
(1,0
00m
2)
0.00
80.
001
0.08
7*
**
0.04
6*
**
0.00
30.
012
(0.0
10)
(0.0
14)
(0.0
30)
(0.0
13)
(0.0
23)
(0.0
48)
Are
aof
per
enn
ial
crop
lan
dp
erca
pit
a(1
,000
m2)
0.00
62
0.01
90.
091
**
*2
0.00
50.
044
0.17
4*
*
(0.0
14)
(0.0
22)
(0.0
35)
(0.0
19)
(0.0
28)
(0.0
83)
For
estr
yla
nd
per
cap
ita
(1,0
00m
2)
20.
004
20.
002
0.02
80.
001
20.
003
0.00
1(0
.005
)(0
.003
)(0
.020
)(0
.013
)(0
.015
)(0
.020
)A
qu
acu
ltu
rew
ater
surf
ace
per
cap
ita
(1,0
00m
2)
20.
016
0.01
32
0.03
52
0.03
70.
046
20.
027
(0.0
17)
(0.0
46)
(0.1
07)
(0.0
45)
(0.0
57)
(0.1
31)
Du
mm
yy
ear
2008
0.08
12
0.15
58.
881
**
*1.
803
**
*0.
325
22.
412
**
*
(0.1
07)
(0.1
93)
(0.3
60)
(0.2
06)
(0.2
94)
(0.3
73)
Con
stan
t26
.479
**
*8.
649
*24
1.66
8*
**
92.9
47*
**
24.1
29*
**
264
.129
**
*
(2.0
98)
(4.8
88)
(7.1
25)
(2.9
42)
(5.2
54)
(9.1
08)
Ob
serv
atio
ns
8,17
68,
176
8,17
68,
176
8,17
68,
176
Nu
mb
erof
i4,
088
4,08
84,
088
4,08
84,
088
4,08
8R
20.
070.
010.
520.
260.
020.
07
Table AIII.Fixed-effects regressions
of the share ofnon-production
expenditures
Householdwelfare in
Vietnam
161
Ex
pla
nat
ory
var
iab
les
Deb
tre
pay
men
tS
pen
din
gon
rep
airi
ng
fix
edas
sets
Sp
end
ing
onb
uy
ing
fix
edas
sets
Sp
end
ing
ond
ura
ble
sP
aym
ent
for
hou
sean
dla
nd
sE
xp
end
itu
reon
elec
tric
ity
,w
ater
,g
arb
age
Inte
rnat
ion
alre
mit
tan
ces
(mil
lion
VN
D)
0.00
003
20.
004
20.
030
**
20.
024
0.08
3*
**
0.00
2(0
.000
25)
(0.0
08)
(0.0
12)
(0.0
18)
(0.0
26)
(0.0
07)
1/h
ouse
hol
dex
pen
dit
ure
213
7.44
2*
165.
708
19,4
53.3
05*
**
222
,223
.37
**
*73
,152
.424
**
*2
3,84
6.62
(75.
314)
(1,1
65.2
68)
(6,7
27.8
94)
(6,5
40.5
65)
(12,
508.
457)
(2,7
17.1
02)
Log
arit
hm
ofh
ouse
hol
dex
pen
dit
ure
0.02
0*
**
0.16
83.
558
**
*1.
551
**
*19
.915
**
*2
1.69
6*
**
(0.0
05)
(0.1
17)
(0.6
54)
(0.4
94)
(1.0
61)
(0.1
45)
Rat
ioof
mem
ber
sy
oun
ger
than
16to
tota
lh
ouse
hol
dm
emb
ers
0.01
0.06
32
0.28
52
1.18
41.
686
21.
158
*
(0.0
17)
(0.4
61)
(1.4
78)
(1.8
04)
(2.7
54)
(0.6
49)
Rat
ioof
mem
ber
sol
der
than
60to
tota
lh
ouse
hol
dm
emb
ers
20.
002
20.
006
20.
053
22.
036
6.60
7*
**
20.
064
(0.0
19)
(0.2
67)
(0.7
37)
(1.4
42)
(2.2
52)
(0.5
15)
Hou
seh
old
size
20.
005
**
0.02
22
0.16
42
0.30
52
2.14
4*
**
0.06
2(0
.002
)(0
.046
)(0
.138
)(0
.232
)(0
.288
)(0
.068
)H
ead
wit
hte
chn
ical
deg
ree
0.04
8*
**
20.
199
20.
984
1.48
32
3.96
3*
20.
057
(0.0
16)
(0.1
52)
(0.9
79)
(1.3
88)
(2.1
91)
(0.4
38)
Hea
dw
ith
pos
t-se
con
dar
ysc
hoo
l2
0.03
82
0.14
32
1.07
74.
977
23.
447
21.
172
(0.0
24)
(0.2
88)
(1.3
52)
(3.1
93)
(3.6
98)
(1.6
41)
Are
aof
ann
ual
crop
lan
dp
erca
pit
a(1
,000
m2)
0.00
00.
010.
028
20.
046
*2
0.13
0*
0.00
5(0
.001
)(0
.006
)(0
.050
)(0
.026
)(0
.074
)(0
.008
)A
rea
ofp
eren
nia
lcr
opla
nd
per
cap
ita
(1,0
00m
2)
0.00
02
0.00
52
0.01
32
0.03
32
0.25
0*
*0.
003
(0.0
00)
(0.0
04)
(0.0
33)
(0.0
26)
(0.1
07)
(0.0
06)
For
estr
yla
nd
per
cap
ita
(1,0
00m
2)
0.00
00.
001
20.
003
20.
038
*0.
006
0.00
2(0
.000
)(0
.001
)(0
.011
)(0
.019
)(0
.015
)(0
.002
)A
qu
acu
ltu
rew
ater
surf
ace
per
cap
ita
(1,0
00m
2)
20.
002
*2
0.00
20.
019
20.
023
0.21
40.
014
(0.0
01)
(0.0
16)
(0.0
32)
(0.0
33)
(0.1
37)
(0.0
09)
Du
mm
yy
ear
2008
20.
003
20.
121
*2
1.31
3*
**
21.
099
**
*2
5.80
5*
**
0.11
1*
(0.0
02)
(0.0
65)
(0.2
16)
(0.2
82)
(0.3
85)
(0.0
63)
Con
stan
t2
0.14
6*
**
21.
558
234
.242
**
*2
7.68
62
192.
085
**
*20
.323
**
*
(0.0
53)
(1.2
44)
(6.8
74)
(5.3
82)
(11.
177)
(1.6
70)
Ob
serv
atio
ns
8,17
68,
176
8,17
68,
176
8,17
68,
176
Nu
mb
erof
i4,
088
4,08
84,
088
4,08
84,
088
4,08
8R
20.
030.
010.
040.
020.
310.
11
Notes:
Sig
nifi
can
tat
:* 1
0,*
* 5an
d*
** 1
per
cen
t;st
and
ard
erro
rsin
par
enth
esis
Table AIV.Fixed-effects regressionsof the share ofnon-productionexpenditures
IJDI11,2
162
Ex
pla
nat
ory
var
iab
les
Tot
alp
rod
uct
ion
and
bu
sin
ess
cost
Cro
pp
rod
uct
ion
Liv
esto
ckco
st
Hu
nti
ng
and
trap
pin
gan
imal
sA
gri
cult
ura
lse
rvic
eco
stF
ores
try
pro
du
ctio
nA
qu
acu
ltu
rep
rod
uct
ion
Non
-ag
ricu
ltu
ral
pro
du
ctio
n
Inte
rnat
ion
alre
mit
tan
ces
(th
ousa
nd
VN
D)
20.
111
20.
007
20.
004
0.00
00.
000
0.00
02
0.00
22
0.09
9(0
.147
)(0
.008
)(0
.019
)(0
.001
)(0
.001
)(0
.000
)(0
.010
)(0
.144
)R
atio
ofm
emb
ers
you
ng
erth
an16
toto
tal
hou
seh
old
mem
ber
s
47,6
39.4
42
2,50
0.34
279
5.27
62
323.
204
465.
976
287
.055
7,40
1.44
9*
43,4
77.8
9
(31,
653.
350)
(3,2
60.5
08)
(1,5
61.1
78)
(207
.753
)(4
96.6
78)
(87.
975)
(4,1
13.1
69)
(31,
134.
338)
Rat
ioof
mem
ber
sol
der
than
60to
tota
lh
ouse
hol
dm
emb
ers
249
,304
.76
238
8.52
72
793.
422
63.9
742
266.
733
254
.348
**
4,70
9.39
4*
*2
52,5
75.1
0
(43,
195.
808)
(1,4
62.6
10)
(900
.736
)(1
45.4
77)
(571
.060
)(2
7.65
6)(2
,081
.385
)(4
3,15
4.75
2)H
ouse
hol
dsi
ze2
1,99
3.86
222
.48
290.
709
*43
.142
47.7
672
1.53
527
7.58
22
2,62
9.05
(3,1
54.5
37)
(263
.523
)(1
55.5
76)
(26.
364)
(148
.040
)(6
.830
)(3
69.7
31)
(3,1
19.6
45)
Hea
dw
ith
tech
nic
ald
egre
e19
,355
.623
**
744.
752
532.
061
71.9
5873
.52
211
.591
2,89
4.43
3*
15,0
50.4
90*
(8,2
41.5
70)
(1,0
08.0
00)
(856
.176
)(7
6.25
3)(2
55.4
35)
(25.
563)
(1,6
67.9
24)
(7,9
48.9
27)
Hea
dw
ith
pos
t-se
con
dar
ysc
hoo
l2
34,5
15.2
32
1,50
3.65
21,
069.
212
4.20
32
98.2
882
48.3
15*
26,
082.
102
25,7
09.4
7(2
7,30
0.64
4)(1
,585
.285
)(1
,772
.808
)(9
2.18
9)(1
65.0
11)
(27.
840)
(5,4
02.4
27)
(26,
860.
484)
Are
aof
ann
ual
crop
lan
dp
erca
pit
a1.
537
**
*1.
605
**
*2
0.03
32
0.01
60.
074
20.
002
20.
062
0.03
(0.4
42)
(0.4
59)
(0.0
24)
(0.0
33)
(0.1
07)
(0.0
02)
(0.0
93)
(0.0
73)
Are
aof
per
enn
ial
crop
lan
dp
erca
pit
a0.
159
0.28
8*
0.02
42
0.00
22
0.00
22
0.00
22
0.10
22
0.04
5(0
.180
)(0
.155
)(0
.033
)(0
.004
)(0
.006
)(0
.002
)(0
.124
)(0
.056
)F
ores
try
lan
dp
erca
pit
a2
0.03
40.
002
0.00
20.
002
0.00
02
0.00
42
0.00
12
0.03
6*
(0.0
27)
(0.0
22)
(0.0
07)
(0.0
02)
(0.0
01)
(0.0
05)
(0.0
03)
(0.0
19)
Aq
uac
ult
ure
wat
ersu
rfac
ep
erca
pit
a1.
419
0.09
10.
137
20.
002
0.01
40.
000
1.47
5*
20.
296
(0.8
72)
(0.1
17)
(0.1
08)
(0.0
04)
(0.0
15)
(0.0
00)
(0.8
32)
(0.2
78)
Du
mm
yy
ear
2008
17,3
73.6
**
*2,
135.
57*
**
1,23
7.5
**
*2
141.
883
**
*26
5.64
4*
**
28.4
71*
*2
817.
3614
,665
.6*
**
(4,7
92.7
50)
(264
.519
)(2
29.4
89)
(27.
744)
(67.
705)
(11.
174)
(627
.372
)(4
,759
.697
)C
onst
ant
19,9
42.9
82
276.
736
2,36
0.81
9*
**
65.5
912
500.
036
81.5
27*
**
242
4.75
318
,636
.57
(12,
471.
079)
(1,5
25.5
79)
(810
.407
)(1
24.7
44)
(614
.988
)(3
0.26
8)(2
,176
.857
)(1
2,20
1.39
8)O
bse
rvat
ion
s8,
176
8,17
68,
176
8,17
68,
176
8,17
68,
176
8,17
6N
um
ber
ofi
4,08
84,
088
4,08
84,
088
4,08
84,
088
4,08
84,
088
R2
0.01
00.
220
0.01
00.
010
0.02
00.
000
0.01
00.
000
Notes:
Sig
nifi
can
tat
:* 1
0,*
* 5an
d*
** 1
per
cen
t;st
and
ard
erro
rsin
bra
cket
s
Table AV.Fixed-effects
regressions ofproduction
expenditures
Householdwelfare in
Vietnam
163