economic growth strategy and urbanization policies in china, 1949–1982
TRANSCRIPT
Economic Growth Strategy and Urbanization Policies in China, 1949 - 11982”
KAM WING CHAN
The Chinese model
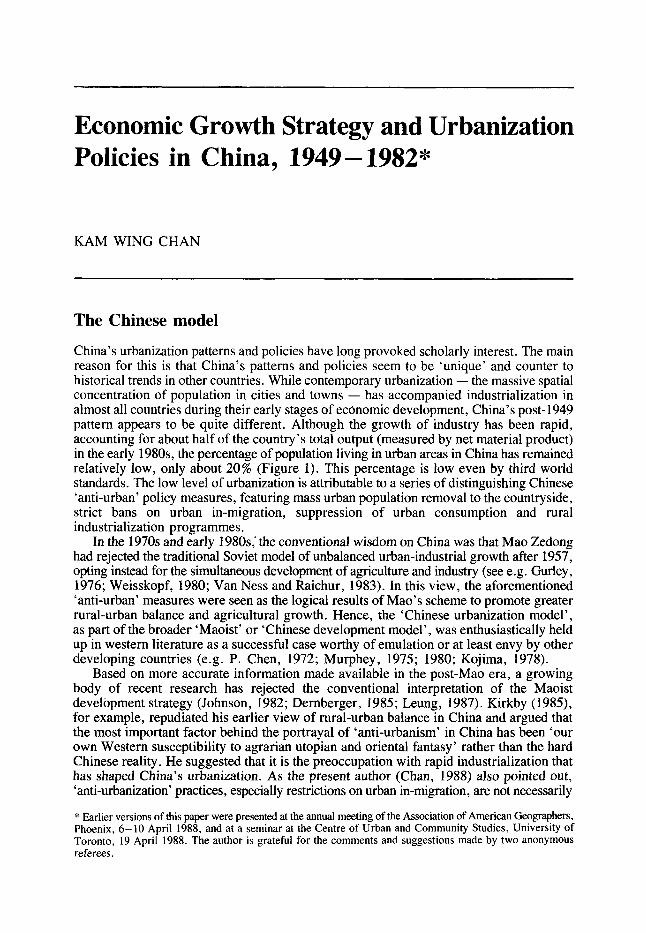
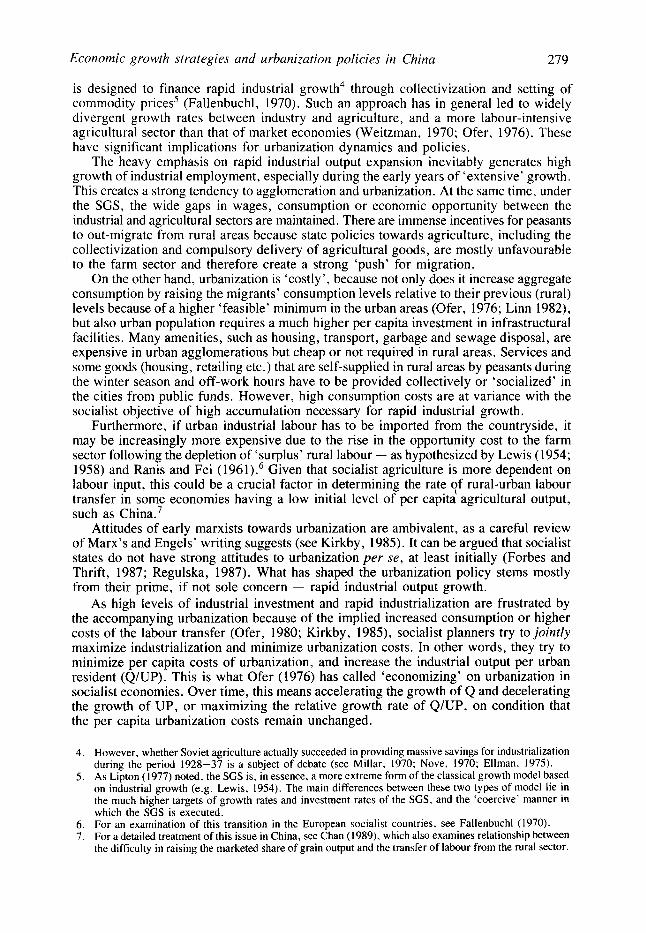
China’s urbanization patterns and policies have long provoked scholarly interest. The main reason for this is that China’s patterns and policies seem to be ‘unique’ and counter to historical trends in other countries. While contemporary urbanization - the massive spatial concentration of population in cities and towns - has accompanied industrialization in almost all countries during their early stages of ec6nomic development, China’s post- 1949 pattern appears to be quite different. Although the growth of industry has been rapid, accounting for about half of the country’s total output (measured by net material product) in the early 1980s, the percentage of population living in urban areas in China has remained relatively low, only about 20% (Figure 1). This percentage is low even by third world standards. The low level of urbanization is attributable to a series of distifiguishing Chinese ‘anti-urban’ policy measures, featuring mass urban population removal to the countryside, strict bans on urban in-migration, suppression of urban consumption and rural industrialization programmes.
In the 1970s and early 1980s,‘ the conventional wisdom on China was that Mao Zedong had rejected the traditional Soviet model of unbalanced urban-industrial growth after 1957, opting instead for the simultaneous development of agriculture and industry (see e.g. Gurley, 1976; Weisskopf, 1980; Van Ness and Raichur, 1983). In this view, the aforementioned ‘anti-urban’ measures were seen as the logical results of Mao’s scheme to promote greater rural-urban balance and agricultural growth. Hence, the ‘Chinese urbanization model’, as part of the broader ‘Maoist’ or ‘Chinese development model’, was enthusiastically held up in western literature as a successful case worthy of emulation or at least envy by other developing countries (e.g. P. Chen, 1972; Murphey, 1975; 1980; Kojima, 1978).
Based on more accurate information made available in the post-Mao era, a growing body of recent research has rejected the conventional interpretation of the Maoist development strategy (Johnson, 1982; Dernberger, 1985; Leung, 1987). Kirkby (1985), for example, repudiated his earlier view of rural-urban balance in China and argued that the most important factor behind the portrayal of ‘anti-urbanism’ in China has been ‘our own Western susceptibility to agrarian utopian and oriental fantasy’ rather than the hard Chinese reality. He suggested that it is the preoccupation with rapid industrialization that has shaped China’s urbanization. As the present author (Chan, 1988) also pointed out, ‘anti-urbanization’ practices, especially restrictions on urban in-migration, are not necessarily
:k Earlier versions of this paper were presented at the annual meeting of the Association of American Geographers, Phoenix, 6-10 April 1988, and at a seminar at the Centre of Urban and Community Studies, University of Toronto, 19 April 1988. The author is grateful for the comments and suggestions made by two anonymous referees.
276 Kam Wing Chun
60,
30
+ 50
40
30
20
10
+ +
f I I I I I I
1950 1952 1955 1960 1965 1970 1975 1980 1982
n Urban Population + Industrial Output - Industrial Output (3-year moving averages)
Figure 1 Industrialization and urbunization in China, 1950-82 (source: SSB, 1983a)
‘anti-urban’ . Instead, they tend to reinforce urban-rural disparities and protect existing privileges of the urbanites.
Although some advances have been made in understanding China’s urbanization and policies, most studies have so far concentrated on sorting out the empirical aspect. A coherent framework for comprehending many apparently contradictory features of China’s urbanization has yet to be developed. Fundamentally, there has been a lack of analysis of the dynamic relationship between sectoral development and urbanization policies in socialist China, especially in the light of the recent renewed understanding of the Chinese model of development. The predominant thinking has still been that China’s urbanization- restricting strategy is different from that of the Soviet rapid industrialization-urbanization model (based on observations of the 1930s) (e.g. Frolic, 1976; Kirkby, 1985). However, a careful survey of Soviet economic and urbanization literature immediately reveals a more diverse and complicated picture than those assumed by students of China’s development. In fact, the literature displays many similarities between the Soviet and Chinese systems in managing urbanization. The allegedly ‘unique’ elements of the Chinese urbanization patterns, such as restricting rural-urban migration, the policy to limit large city growth and the relative under-provision of urban infrastructure and services, are all similar to phenomena found in the Soviet Union and many other East European countries at comparable stages of development. These similarities challenge students of China’s urbanization to investigate whether or not they are mere coiilcidences. Indeed, the tendency to emphasize the idiosyncracies of the Chinese system have led many observers to miss useful insights that might otherwise be gained by studying similar but better researched socialist countries, or to contrast the Chinese and Soviet models, instead of noting the parallel (e.g. Kirkby, 1985; Whyte and Parish, 1984).
Economic growth strategies and urbanization policies in China 277
Given the importance and the complexity of the issue, the main focus of this paper is on the relationship between sectoral development and urbanization policies in China. The paper begins with an identification of the major principles governing socialist urbanization in the early stage of industrialization, based on the literature on Soviet economic development and urbanization. The framework outlined is then used to explain and analyse the post-1949 Chinese case.
Socialist industrialization and urbanization: a generalized framework
Urbanization in the early stage of industrialization’ is, in essence, the spatial manifestation of the economic ‘structural transformation’, characterized by a massive shift of labour and other inputs away from agricultural to non-agricultural activities in the production structure.* In the classical ’basiclnon-basic’ formulation, the size of urban population is seen as a function of the size of industrial or ‘basic’ population (Ullman and Dacey, 1982; Clark, 1982), though, in theory, industrialization is possible with limited or even without ~rbanization.~ Given certain industrial output, Q, the theoretical amount of urban population generated depends on a host of factors specified as follows:
UP = Li*(s*u*e) or UP = Li*UM
(Equation 1) (Equation 2)
where Li: industrial employment; UP: urban population; UM: ‘urbanization multiplier’ of Li (‘urban multiplier’ for short); s: the service employment multiplier (> 1); u: the degree of urbanization of non-agricultural employment (< 1); e: the non-working population multiplier (> 1).
Here Li is the labour directly required in the production of Q; ‘s’ is defined as Ln/Li, where Ln = Li+Ls, and Ls is the labour providing the services (e.g. administration, transportation, research etc.) for the production of Q, as well as for other consumption- oriented activities such as retail, catering etc. Such a formulation emphasizes the demand side and the propulsive role of manufacturing, as well as the supportive or auxiliary role of services. The relationship between manufacturing and services is here expressed in terms of economic multipliers.
The value of ‘u’ rests on the definition of urban areas, the industrial locational patterns (i.e. whether or not concentrated) and the degree of commuting by urban labour (the so- called ‘migration substitution’). The multiplier ‘e’ measures the number of population (including the worker himself or herself) supported by one worker in the non-agricultural sector. ‘e’ is a function of the family size (number of children per household), the labour participation rate and the unemployment rate of the working population. As will be made clear later, socialist planners manipulated the various multipliers to achieve their certain objectives.
While processes of a similar nature occur in socialist economies in the early stage of industrialization, the form of urbanization is distinct from that of market economies because of the relative uniformity of approach of the socialist economies (Musil, 1980; Berry,
1. Here I, refer to the period where a rapid transition from a predominantly agrarian economy to an industrial one occurs. This period is characterized by a significant spurt in the rate of productive investment (to over 15% of national output) and covers roughly the first couple of decades of socialist industrialization.
2. Through changes in demand occasioned by what is known loosely as Engel’s ‘law’, which states that income shares spent on food decrease with income, but those spent on industrial products and service rise with income. That is, the income elasticity of food demand is low.
3. As Kuznets (1965) pointed out, an authority determined to prevent urbanization could prohibit agglomeration of plants and firms within a small area, and could require construction of housing for the workers of a single plant that would assure low density per square mile. ‘Proto-industrialization’ in eighteenth-century Europe is another form of industrialization with limited urbanization (de Vries, 1984).
278 Kum Wing Chun
1974). First, population mobility in these socialist countries is to a high degree regulated by state planning, in contrast to the free, ‘voluntary’ and ‘unplanned’, ‘anarchic’ movement of labour in market economies (Kansky, 1976; Musil, 1980). Under the socialist system, individual labour mobility is subjected to many constraints imposed by the state, such as issuance or denial of a residence permit (Bornstein, 1985). This is a major factor in setting socialist urbanization patterns apart from the ‘capitalist’ ones.
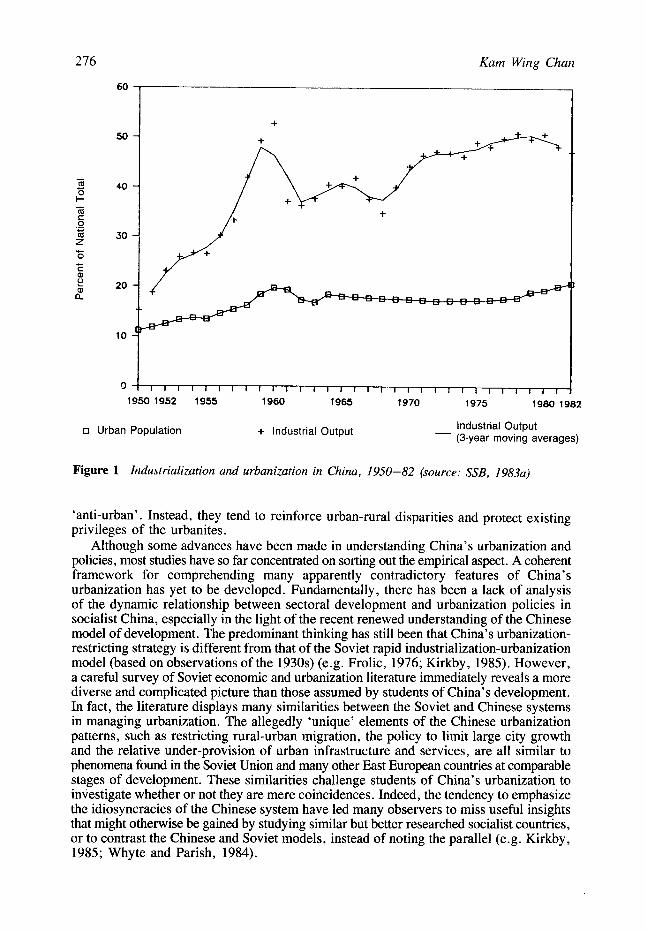
Second, most socialist economies established during the immediate post-second world war period have also adopted industrialization strategies, at least during the early phases of industrialization (the 1950s), similar to that implemented in the USSR under Stalin. The ‘traditional’ Soviet or Stalinist growth strategy (SGS) is characterized by: (a) sustained high rates of domestic saving, which are used to achieve high accumulation rates and high rates of output growth (Table 1); (b) unbalanced growth based on industry, especially heavy industry, often leading to the neglect of other aspects of the economy; and (c) discriminatory policies against agriculture: massive ‘tribute’ from the agricultural sector
Table 1 Investment patterns o f socialist countries during industriulizution stuge
(a) Average shares of accumulation ( % of Net Material Product)
1929 1937 1940 1951-5 1956-60 1961-5 1966-70 USSR 18.7 25.9 19.2 25.1 26.3 27.1 27.4
1951-3 1954-6 1957-9 1960-2 1963-5
Bulgaria Czechoslovakia Hungary Poland Romania
27.1“ 18.4 23.2 14.5 12.3 18.1 25.1 15.6 21.4 24.0 22.7 23.0 25.0 20.0h 20.5‘
(b) Agriculture’s shares in state capital investments (%)
USSR 1928-32 1933-7 1938-40 1941-5 1946-50 1951-5 Agriculture 15.6 11.8 10.8 9.4 11.8 14.2 Heavy industry 31.7 30.5 28.5 39.5 33.4 36.5 Light industry 6.3 6.8 5.9 3.4 5.2 4.5
Agriculture 1951-5 1956-60 1961-5
29.7 34.2 -20.5 14.3 25.9 26.8 24.3 26.0 20.0” 26.0’
1956-60 1961-5 14.3 15.5 30.4 31.7 5.3 4.8
1966-70 1971-4
Bulgaria Czechoslovakia Hung a r y Poland Romania Albania
13 21 22 16 18 1 1 16 14 I 1 10 17 15 17 20 20 10 13 14 16 15 9 16 19 16 14
12 18 15 16 12
1952-3. 1955. 1957 and 1959.
l’ 1960 and 1962. 1963 and 1965.
Sources: Cohn (1970); Fallenbuchl (1970); Bideleux (1985) and Wang (1981).
Economic growth strategies and urbanization policies in China 279
is designed to finance rapid industrial growth4 through collectivization and setting of commodity prices5 (Fallenbuchl, 1970). Such an approach has in general led to widely divergent growth rates between industry and agriculture, and a more labour-intensive agricultural sector than that of market economies (Weitzman, 1970; Ofer, 1976). These have significant implications for urbanization dynamics and policies.
The heavy emphasis on rapid industrial output expansion inevitably generates high growth of industrial employment, especially during the early years of ‘extensive’ growth. This creates a strong tendency to agglomeration and urbanization. At the same time. under the SGS, the wide gaps in wages, consumption or economic opportunity between the industrial and agricultural sectors are maintained. There are immense incentives for peasants to out-migrate from rural areas because state policies towards agriculture, including the collectivization and compulsory delivery of agricultural goods, are mostly unfavourable to the farm sector and therefore create a strong ‘push’ for migration.
On the other hand, urbanization is ‘costly’, because not only does it increase aggregate consumption by raising the migrants’ consumption levels relative to their previous (rural j levels because of a higher ‘feasible’ minimum in the urban areas (Ofer, 1976; Linn 1982), but also urban population requires a much higher per capita investment in infrastructural facilities. Many amenities, such as housing, transport, garbage and sewage disposal, are expensive in urban agglomerations but cheap or not required in rural areas. Services and some goods (housing, retailing etc.) that are self-supplied in rural areas by peasants during the winter season and off-work hours have to be provided collectively or ‘socialized’ in the cities from public funds. However, high consumption costs are at variance with the socialist objective of high accumulation necessary for rapid industrial growth.
Furthermore, if urban industrial labour has to be imported from the countryside, it may be increasingly more expensive due to the rise in the opportunity cost to the farm sector following the depletion of ‘surplus’ rural labour - as hypothesized by Lewis (1954; 1958) and Ranis and Fei (1961).6 Given that socialist agriculture is more dependent on labour input, this could be a crucial factor in determining the rate qf rural-urban labour transfer in some economies having a low initial level of per capita agricultural output, such as China.7
Attitudes of early marxists towards urbanization are ambivalent, as a careful review of Marx’s and Engels’ writing suggests (see Kirkby, 1985). It can be argued that socialist states do not have strong attitudes to urbanization per se, at least initially (Forbes and Thrift, 1987; Regulska, 1987). What has shaped the urbanization policy stems mostly from their prime, if not sole concern - rapid industrial output growth.
As high levels of industrial investment and rapid industrialization are frustrated by the accompanying urbanization because of the implied increased consumption or higher costs of the labour transfer (Ofer, 1980; Kirkby, 1985), socialist planners try to joinfly maximize industrialization and minimize urbanization costs. In other words, they try to minimize per capita costs of urbanization, and increase the industrial output per urban resident (Q/UP). This is what Ofer (1976) has called ‘economizing’ on urbanization in socialist economies. Over time, this means accelerating the growth of Q and decelerating the growth of UP, or maximizing the relative growth rate of Q/UP, on condition that the per capita urbanization costs remain unchanged.
4. However, whether Soviet agriculture actually succeeded in providing massive savings for industrialization during the period 1928-37 is a subject of debate (see Millar. 1970; Nove. 1970; Ellman, 1975).
5 . As Lipton (1977) noted, the SGS is, in essence, a more extreme form of the classical growth model based on industrial growth (e.g. Lewis, 1954). The main differences between these two types of model lie in the much higher targets of growth rates and investment rates of the SGS. and the ‘coercive’ manner in which the SGS is executed.
6 . For an examination of this transition in the European socialist countries. see Fallenbuchl (1970). 7. For a detailed treatment of this issue in China, see Chan ( 1 9 8 9 ~ which also examines relationship between
the difficulty in raising the marketed share of grain output and the transfer of labour from the rural sector.
2 80 Kam Wing Chan
Algebraically, r(Q/UP), the relative growth rate of Q/UP, is given by:
r(Q/UP) = r(Q/Li) + r(Li/UP) (Equation 3) because, by definition:
Q/UP = Q/Li * Li/UP.8
Raising r(Q/UP) would mean increasing r(Q/Li) and/or r(Li/UP). Since Li/UP is the reciprocal of the ‘urban multiplier’, UM (= UP/Li = s*u*e), measures to increase Q/UP can be grouped as raising the industrial output-labour ratio, and/or suppressing the value of ‘urban multiplier’. More specifically, it follows from the above that:
(Equation 4)
Owing to the measures to increase r(Q/UP), socialist economies generally have lower urbanization levels (measured by the percentage of population living in urban areas) than those of comparable market economies based on similar per capita GNP (Ofer, 1976). Konrad and Szelenyi (1977) have coined the term ‘under-urbanization’ to describe the pattern of slow urban growth in socialist countries because of the deliberate state policy of underinvesting in urban infrastructure. Conversely, in the absence of effective migration controls, as in some third world countries, the ‘urban’ multiplier’ effect can be much higher, leading to the so-called ‘over-urbanization’ .
r(Q/UP) = r(Q/Li) + r(l/s) + r(l/u) + r(l/e)
Economic growth in China, 1949-82
It is well known that the industrialization strategy the Chinese Communists adopted in the first five-year plan (FFYP, 1953-7) was modelled on the orthodox Soviet growth strategy (the SGS) (see e.g. Chen and Galenson, 1969). Its complement, a highly centralized system of command planning, was also copied. As regards China’s economic development strategies in the post-FFYP era, conventional western wisdom argued that since 1958 Mao had abandoned the SGS and opted for a more balanced growth strategy based on simultaneous development of agriculture and industry (Spulber, 1963; Wheelwright and McFarlane, 1970; Eckstein, 1977; Amin, 1981; Van Ness and Raichur, 1983).9 Recent research, however, has challenged these claims and suggested that the economic strategy adopted by Mao heavily favoured industrial growth and was biased against agriculture (Xue, 1980; Lardy, 1983; Leung, 1987).
Basic components of China’s economic growth strategy Despite Mao’s oft-cited (1956; 1961 -2) critique of Soviet industrialization strategy, the Chinese economic growth strategy throughout the Maoist period included all the macro- economic components of the SGS examined before: the ‘big push’ through sustained high
8. In dynamic analysis, the annual growth rate of A is the sum of the annual growth rates of B and C, given A = B*C. Since:
AtIAo = Bt/Bo * Ct/Co
where 0 and t denote the years. taking the natural logarithm on both sides and dividing them by t give:
In(At/Ao)/t = In(Bt/Bo)/t + In(C,/Co)lt or r(A) =‘r(B) + r(C).
r(A). r(B) and r(C) are the average annual (exponential) growth rates of A. B and C between years 0 and t, respectively.
9. The argument was largely based on Mao’s rhetoric (1956; 1961-2), especially his criticism of the Soviet approaches and his stress on non-material incentives, the Sino-Soviet ideological split and selective official pronouncements which were more supportive of agriculture in the immediate aftermath of the Great Leap Forward.
Economic growth strategies and urbanization policies in China 28 1
accumulation rates; concentrated growth based upon heavy industry; and discriminatory policies against agriculture. Ironically, there is increasing evidence that the Great Leap Forward (GLF), supposedly Mao’s boldest departure from the Soviet model, was even more ‘Stalinist’ than the measures taken by Stalin (examined below). Modifications to the Soviet industrialization strategy only occurred in the non-Maoist post-GLF retrenchment of 1961 -5 and the post-Mao (after 1979) periods. l o
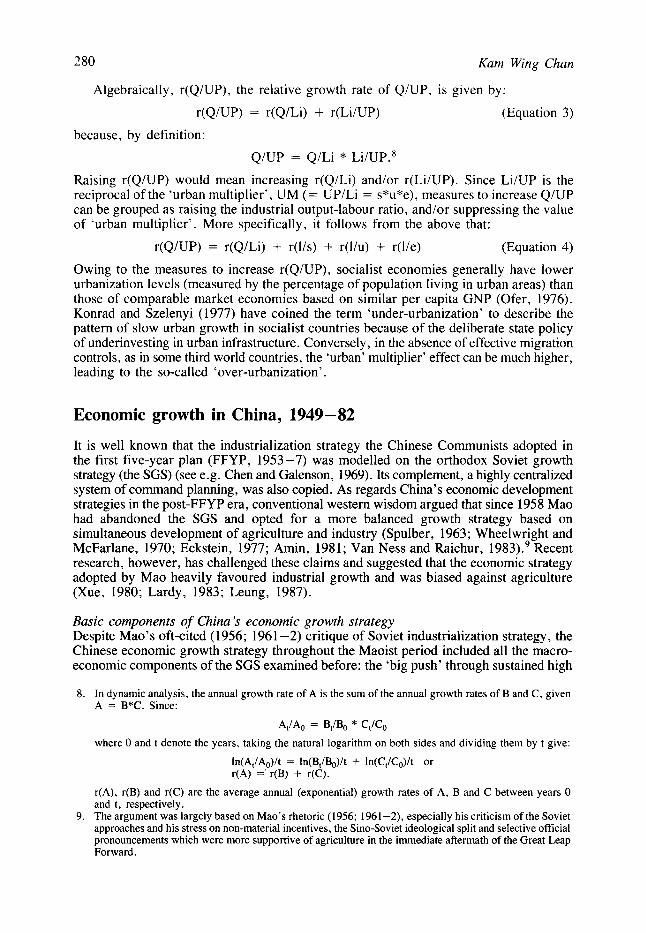
Maximum output growth through high accumulation A fundamental ingredient of the SGS is a high rate of growth based on huge domestic investment. The Chinese government in general has given an overriding commitment to achieving high levels of output growth by devoting a large share of the country’s ‘national income’ (net material product, NMP) to investment at the expense of current consumption and standard of living. The policy of xin shengzhan, hou shenghuo (putting production first, standard of living second) reflects this strong ‘productionist’ mentality. Not only did China begin its FFYP with a comparably high investment rate - averaging about 24.2% of the country’s NMP (Table 2 and Figure 2a), but this rate was also pushed to extremes on many other occasions. In 1958 and 1959 (the GLF), the rate leapt to 33.9% and 43.8% respectively (Wang, 1981). The catastrophe of the GLF forced Chinese leaders to ‘readjust’ and adopt a less extreme investment rate in the period 1961-2. But the tendency for high accumulation soon re-emerged. The rate of investment rebounded to close to the FFYP level, reaching 22.7% in 1963-5. High levels of accumulation (26-33 %) were maintained throughout the post- 1965 period.
A comparison of the investment statistics in Tables 1 and 2 reveals that China has higher accumulation rates than other socialist countries in comparable phases. For example, in the USSR, this rate averaged about 25% for the first 10 five-year plans, with a maximum of 28.1 % (based on five-year averages); but in China, for most of the years since 1949, the investment rate has been above 25 % , with the highest five-year average reaching 33 % (Wang, 1981).
Selected growth based on heavy industry The long-accepted notion that Mao departed from the Soviet lopsided concentration on industrial development does not stand up empirically. Table 2 and Figure 2b show that the allocation of state funds in China is characteristically skewed in favour of heavy industry. Total state investments in ‘agriculture’ , including those in related branches of forestry, water conservancy and meteorology, remained relatively low, which contributed, inter alia, to the slower agricultural growth in the later periods. While agriculture accounted for about 57-68% of the country’s NMP between 1950 and 1984 (SSB, 1986a), it only received a mere 7.1 % of total state capital investments in the FFYP. This percentage increased slightly to 10.5% in 1958 and 1959. Only in the wake of the catastrophic famine was the government forced to come to the aid of agriculture, and investment in agriculture rose to 14.4-24.6% between 1961 and 1964 (Lardy, 1987). Once the agrarian crisis was over, it dwindled to about 10% for the 1966-80 period and to 5.1% in 1981-5.
Industry , particularly heavy industry such as basic metals and machine-building , has received the lion’s share of the state investment funds throughout. During the FFYP period, investments in heavy industry made up 36.1 % of the total, a higher proportion than the FFYP under Stalin in the USSR (cf. Table 1) . During the GLF years of 1958 and 1959,
10. Despite China’s bold economic reforms in recent years, the main features of the SGS, except for the collectivization of agriculture, are still dominant in China’s macroeconomic priorities. Hence. it is not too surprising to find that the FFYP, though well known for its close imitation of the Soviet model, is still regarded by post-Mao Chinese leaders and academics as the ‘golden era’ of relatively ‘balanced’ growth in the Chinese economic development (Y. Chen, 1961; Xue, 1980).
I 1. Average annual output growth rates in 1966-70, 1971-5 and 1975-80 never exceeded that in 1953-7. A similar observation has been made by Perkins and Yusuf (1984: 33).
282 Kam Wing Chan
o/o of NMP
1953- 1958- 1961- 1963- 1966- 1971- 1976- 1981-
1953- 1958- 1963- 1966- 1971- 1976- 1981- 1957 1962 1965 1970 1975 1980 1985
Heavy Industry Agriculture
Figure 2 (above) Accumulation rate, 1953-85; (below) sectoral share of capital investments, 1953-85
Economic growth strategies and urbanization policies in China
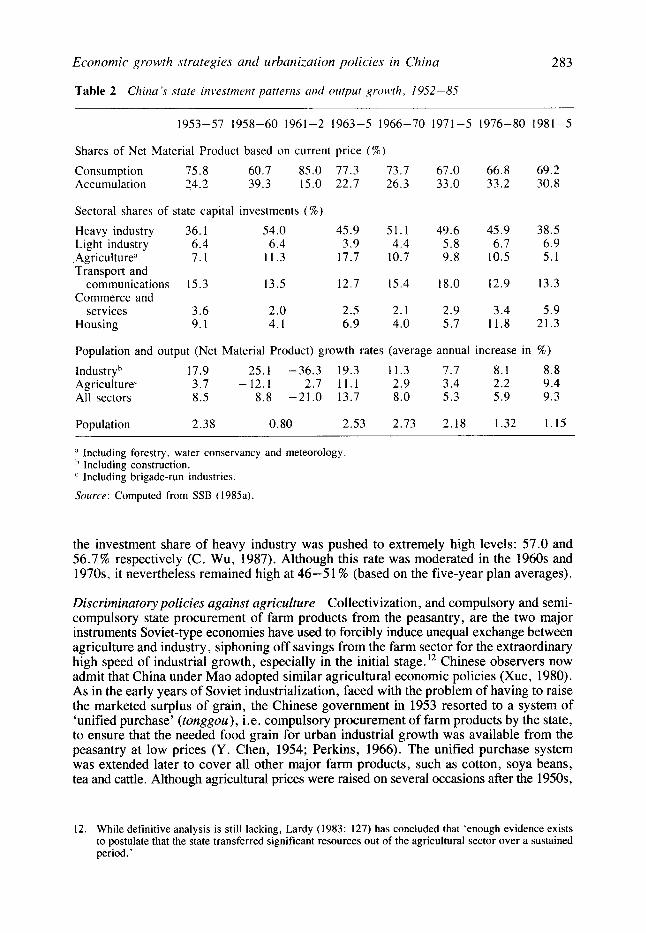
Table 2 Chinu 's state inl.estmmt patterns cind output growth, 1952-85
283
1953-57 1958-60 1961-2 1963-5 1966-70 1971-5 1976-80 1981-5
Shares of Net Material Product based on current price (%)
Consumption 75.8 60.7 85.0 77.3 73.7 67.0 66.8 69.2 Accumulation 24.2 39.3 15.0 22.7 26.3 33.0 33.2 30.8
Sectoral shares of state capital investments (%)
Heavy industry 36.1 54.0 45.9 51.1 49.6 45.9 38.5 Light industry 6.4 6.4 3.9 4.4 5.8 6.7 6.9 .Agriculture" 7.1 11.3 17.7 10.7 9.8 10.5 5.1 Transport and
communications 15.3 13.5 12.7 15.4 18.0 12.9 13.3 Commerce and
services 3.6 2 .o 2.5 2.1 2.9 3.4 5.9 Housing 9.1 4.1 6.9 4.0 5.7 11.8 21.3
Population and output (Net Material Product) growth rates (average annual increase in %) Industryh 17.9 25.1 -36.3 19.3 11.3 7.7 8. I 8.8
All sectors 8.5 8.8 -21.0 13.7 8.0 5.3 5.9 9.3 Agriculture' 3.7 - 12.1 2.7 11 .1 2.9 3.4 2.2 9.4
Population 2.38 0.80 2.53 2.73 2.18 1.32 1.15
a Including forestry, water conservancy and meteorology Including construction. Including brigade-run industries.
Source: Computed from SSB (1985a).
the investment share of heavy industry was pushed to extremely high levels: 57.0 and 56.7% respectively (C. Wu, 1987). Although this rate was moderated in the 1960s and 1970s, it nevertheless remained high at 46-5 1 % (based on the five-year plan averages).
Discriminatory policies against agriculture Collectivization, and compulsory and semi- compulsory state procurement of farm products from the peasantry, are the two major instruments Soviet-type economies have used to forcibly induce unequal exchange between agriculture and industry, siphoning off savings from the farm sector for the extraordinary high speed of industrial growth, especially in the initial stage.'* Chinese observers now admit that China under Mao adopted similar agricultural economic policies (Xue, 1980). As in the early years of Soviet industrialization, faced with the problem of having to raise the marketed surplus of grain, the Chinese government in 1953 resorted to a system of 'unified purchase' (tonggou), i.e. compulsory procurement of farm products by the state, to ensure that the needed food grain for urban industrial growth was available from the peasantry at low prices (Y. Chen, 1954; Perkins, 1966). The unified purchase system was extended later to cover all other major farm products, such as cotton, soya beans, tea and cattle. Although agricultural prices were raised on several occasions after the 1950s,
12. While definitive analysis is still lacking, Lardy (1983: 127) has concluded that 'enough evidence exists to postulate that the state transferred significant resources out of the agricultural sector over a sustained period.'
2 84 Kam Wing Chan
these increases were barely enough to cover the increased costs of production (Tang, 1984; Zhang, 1981).”
Collectivization of the farm sector, beginning in 1952, was basically completed in 1956. In another big push to transform these cooperatives into larger production units, communization was launched in 1957 and achieved by 1959, though the size of the communes was reduced in the early 1960s. As in the USSR, the establishment of communes not only assured a high degree of state control over farm produce, but it was also hoped that it would help raise agricultural output through institutional changes - without increasing the state investment in agriculture (Y. Chen, 1955; Bernstein, 1984). Communes were unpopular among many peasants and were dismantled in the early 1980s under the post- Mao policy.
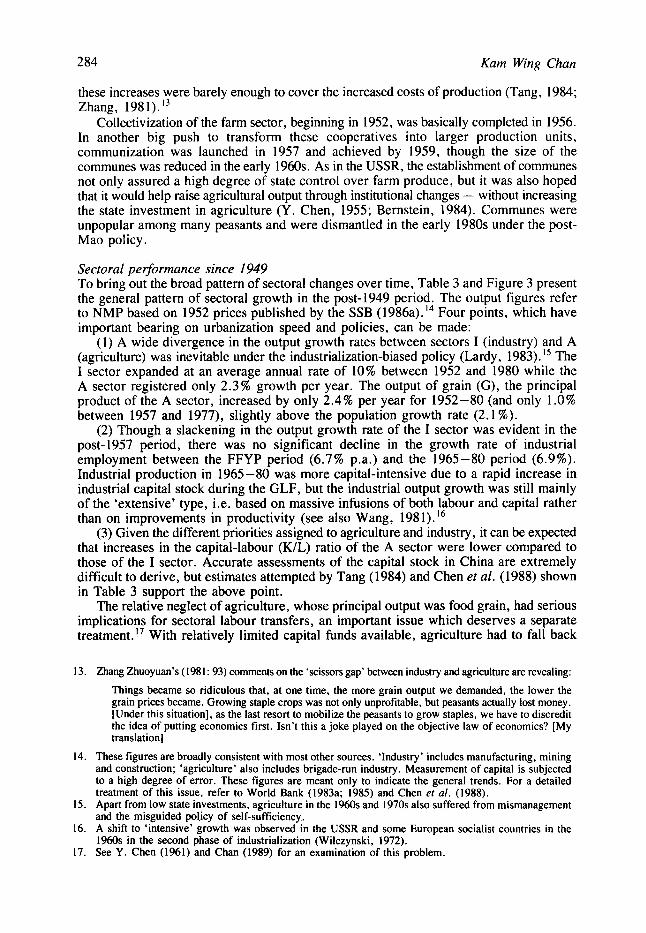
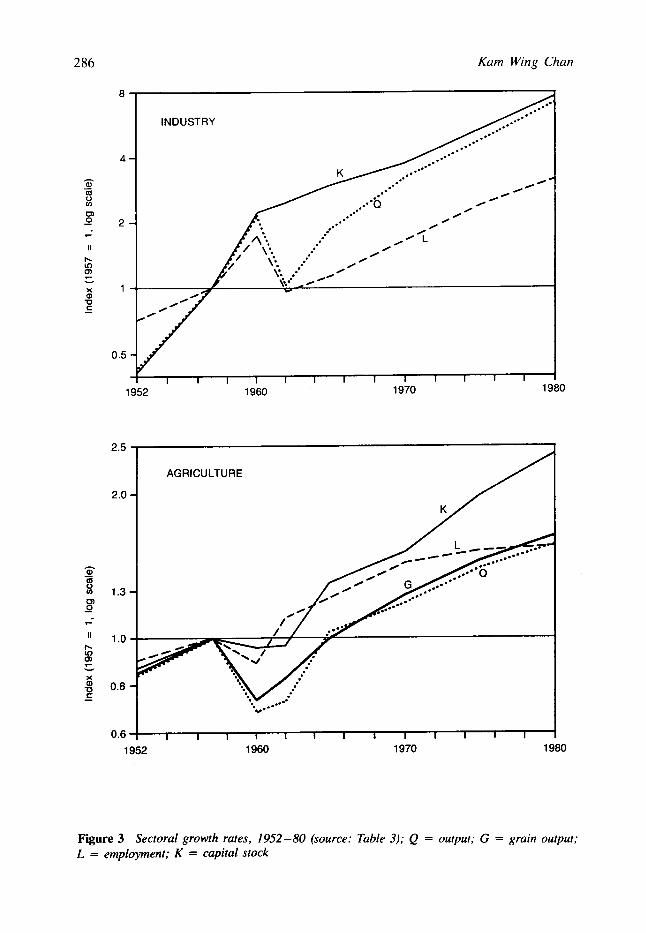
Sectoral pe$ormance since I949 To bring out the broad pattern of sectoral changes over time, Table 3 and Figure 3 present the general pattern of sectoral growth in the post-1949 period. The output figures refer to NMP based on 1952 prices published by the SSB (1986a).14 Four points, which have important bearing on urbanization speed and policies, can be made:
(1) A wide divergence in the output growth rates between sectors I (industry) and A (agriculture) was inevitable under the industrialization-biased policy (Lardy , 1983). Is The I sector expanded at an average annual rate of 10% between 1952 and 1980 while the A sector registered only 2.3% growth per year. The output of grain (G), the principal product of the A sector, increased by only 2.4% per year for 1952-80 (and only 1 .O% between 1957 and 1977), slightly above the population growth rate (2.1 %).
(2) Though a slackening in the output growth rate of the I sector was evident in the post-1957 period, there was no significant decline in the growth rate of industrial employment between the FFYP period (6.7% p.a.) and the 1965-80 period (6.9%). Industrial production in 1965-80 was more capital-intensive due to a rapid increase in industrial capital stock during the GLF, but the industrial output growth was still mainly of the ‘extensive’ type, i.e. based on massive infusions of both labour and capital rather than on improvements in productivity (see also Wang, 1981).16
(3) Given the different priorities assigned to agriculture and industry, it can be expected that increases in the capital-labour (K/L) ratio of the A sector were lower compared to those of the I sector. Accurate assessments of the capital stock in China are extremely difficult to derive, but estimates attempted by Tang (1984) and Chen et al. (1988) shown in Table 3 support the above point.
The relative neglect of agriculture, whose principal output was food grain, had serious implications for sectoral labour transfers, an important issue which deserves a separate treatment. ” With relatively limited capital funds available, agriculture had to fall back
13. Zhang Zhuoyuan’s (1981: 93) comments on the ‘scissors gap’ between industry and agriculture are revealing:
Things became so ridiculous that, at one time, the more grain output we demanded, the lower the grain prices became. Growing staple crops was not only unprofitable, but peasants actually lost money. [Under this situation], as the last resort to mobilize the peasants to grow staples, we have to discredit the idea of putting economics first. Isn’t this a joke played on the objective law of economics? [My translation]
14. These figures are broadly consistent with most other sources. ‘Industry’ includes manufacturing, mining and construction; ‘agriculture’ also includes brigade-run industry. Measurement of capital is subjected to a high degree of error. These figures are meant only to indicate the general trends. For a detailed treatment of this issue, refer to World Bank (1983a; 1985) and Chen et a / . (1988).
15. Apart from low state investments, agriculture in the 1960s and 1970s also suffered from mismanagement and the misguided pol.icy of self-sufficiency.
16. A shift to ‘intensive’ growth was observed in the USSR and some European socialist countries in the 1960s in the second phase of industrialization (Wilczynski, 1972).
17. See Y. Chen (1961) and Chan (1989) for an examination of this problem.

Tab
le 3
Se
ctor
al e
cono
mic
pef
lorm
ance
, 195
2-82
Indu
stry
(I)
Agr
icul
ture
(A
) Y
ear
Q*
L K
QIL
QIK
K/L
Q
G
L K
QJL
GIL
Q/K
KIL
(X 1
0000
) (X
IOOOO)
(X lm
)
(X
100
00) (
X 1
0000
) (X
lm
) (X
100
00)
Abs
olut
e va
lue
1952
13
.6
1531
.0
148.
8 88
.8
1957
33
.2
2142
.0
350.
0 15
5.1
1960
70
.6
3720
.0
783.
7 18
9.7
1962
34
.2
2059
.0
864.
5 16
5.9
1965
60
.9
2408
.0
1032
.5
253.
1 19
70
107.
1 35
18.0
13
10.8
30
4.5
1975
15
7.5
5152
.0
1861
.7
305.
7 19
80
235.
7 68
21.0
26
62.2
34
5.8
1982
25
1.8
7270
.0
2930
.5
346.
4
Inde
x (1
957
= 1
)
1952
0.
41
0.71
0.
43
0.57
19
57
1.00
1.
00
1.00
1.
00
1960
2.
12
1.74
2.
24
1.22
19
62
1.03
0.
96
2.47
1.
07
1965
1.
83
1.12
2.
95
1.63
19
70
3.22
1.
64
3.75
1.
96
1975
4.
74
2.41
5.
32
1.97
19
80
7.09
3.
18
7.61
2.
23
1982
7.
58
3.39
8.
37
2.23
Ann
ual
rate
of
grow
th (
%)
52-5
7 17
.87
6.72
17
.11
11.1
5 57
-75
8.64
4.
88
9.29
3.
77
65-8
0 9.
02
6.94
6.
31
2.08
52
-80
10.1
9 5.
34
10.3
0 4.
85
914.
0 94
9.5
900.
2 39
5.0
590.
2 81
7.2
846.
I 88
5.5
859.
3
0.96
1 .O
O 0.
95
0.42
0.
62
0.86
0.
89
0.93
0.
91
0.76
-0
.64
2.70
-0
.1 I
971.
9 34
.0
163.
9 16
33.9
40
.8
195.
0 21
06.8
28
.4
143.
5 41
98.8
30
.0
160.
0 42
87.7
41
.8
194.
5 37
25.9
48
.4
240.
0 36
13.5
57
.3
284.
5 39
02.9
64
.0
320.
6 40
30.9
76
.8
354.
5
1731
7.0
1931
0.0
I70 1
9.0
2127
8.0
2339
8.0
2781
4.0
2946
0.0
302 1
1 .O
3201
3.0
1129
.2
1308
.4
1245
.5
1260
.4
1710
.3
1989
.3
2606
.0
3183
.3
na
0.59
0.
83
0.84
0.
90
0.86
1.
00
1.00
1.
00
1.00
1.
00
1.29
0.
70
0.74
0.
88
0.95
2.
57
0.73
0.
82
1.10
0.
96
2.62
1.
02
1.00
1.
21
1.31
2.
28
1.18
1.
23
1.44
1.
52
2.21
1.
40
1.46
1.
53
1.99
2.
39
1.57
1.
64
1.56
2.
43
2.47
1.
88
1.82
1.
66
na
10.3
9 3.
66
3.48
2.
18
2.95
4.
41
1.88
2.
10
2.35
3.
83
4.97
2.
26
2.40
1.
99
3.70
-0
.63
2.84
3.
33
1.70
4.
14
19.6
21
.1
16.7
14
. I 17
.9
17.4
19
.5
21.2
24
.0
0.93
I .00
0.79
0.
67
0.84
0.
82
0.92
I .o
o 1.
13
I .48
1.14
0.
27
-0.4
6
94.7
10
1.0
84.3
75
.2
83. I
86.3
96
.6
106.
1 11
0.7
0.94
I .00
0.83
0.
74
0.82
0.
85
0.96
I .0
5 1.
10
I .30
I .63
0.
41
-0.2
5
301.
1 31
2.1
228.
2 23
7.9
244.
3 24
3.2
220.
0 20
1.1
na 0.96
I .o
o 0.
73
0.76
0.
78
0.78
0.
70
0.64
na
0.72
- 1
.94
- 1
.30
- 1
.44
652.
I 67
7.6
73 I .
8 59
2.3
73 I .
O 71
5.2
884.
6 10
53.7
na
0.96
I .O
O I .
08
0.87
I .
08
I .06
1.
31
I .56
na
0.77
I .
48
2.44
1.
71
* Q =
out
put (
NM
P in
bill
ion
RMBY
, 19
52 c
onst
ant p
rice
s); G
= g
rain
out
put (
in m
illio
ns o
f ton
s):
L =
em
ploy
men
t (in
10.000s): K
= e
stim
ates
of
valu
e of
cap
ital
stoc
k (in
100
mill
ion
RMBY
, 19
52 c
onst
ant
pric
es);
na
= d
ata
not
avai
labl
e.
Sour
ces:
Q a
nd G
fro
m S
SB (
1986
a);
L fr
om S
SB (
1987
b); K(1) c
ompu
ted
from
SSB
(19
85b)
and
Che
n ef a/. (
1988
): K
(A)
estim
ates
by
Tang
(19
84).
30
Kmn Wing Chat1
Figure 3 Sectoral growth rates, 1952-80 (source: Table 3); Q = output; G = grain output; L = employment; K = capital stock
Economic growth strategies and urbanization policies in China 287
more and more on the traditional input of labour (Lardy, 1983). In fact, a shift toward more labour-intensive farm production was witnessed during the 1960s and 1970s (Rawski, 1979).’* Growth of labour productivity (Q/L) in the A sector was thus held back: there was hardly any increase in the grain output per agricultural worker, G/L, between 1957 and 1980. This posed a serious constraint on the inter-sectoral labour transfer.IY
A huge and widening gap in labour productivity between the A and I sectors became inevitable. Based on roughly comparable prices, the World Bank ( 1983a) estimated that the sectoral crude labour productivity ratio” of China in 1979 was 6.1. compared to the average of 4.1 for most other third world countries. A similar observation is also made by Wang (1981: 93).
(4) The GLF, widely portrayed as ‘the Chinese road to socialism’ (see e.g. Wheelwright and McFarmalen, 1970) or ‘the alternative to Stalinism’ (e.g. Gray, 1976), has been interpreted as Mao’s refutation of the Soviet growth model. However, judging from the investment and sectoral policies of the GLF, it appears that the GLF was an intensification of the Stalinist model in pursuit of high targets of steel production and high accumulation. In 1958, the party decided to double steel production from 5.35 million tons in 1957 to 10.7 million tons in 1958 (Xue, 1980; He and Wang, 1983). Actual steel output more than tripled between 1957 and 1960 (SSB 1984a). Table 3 also shows that industrial employment and capital stock almost doubled during the same period.
Such a ‘leap’ was premised on heavy extraction of ‘surplus’ from agriculture, where output was projected to increase substantially through institutional changes (i.e. communization and the mobilization of peasants’ ‘enthusiasm and initiatives for socialism’) rather than increases in capital investment. For example, the optimism of the Chinese planners led them to set extremely high grain output targets for 1958, ranging from 375 to 500 million tons, though the production actually turned out to be only about 200 million (Ashton et al., 1984). The level of state grain procurement for 1959 was raised drastically to 40% of the total output (He and Wang, 1983). The extreme squeeze of the farm sector in various aspects put the sector under heavy pressure and at high risk; in some Chinese observers’ words, this is analogous to ‘draining the pond to catch the fish’. Hit by unfavourable climatic conditions in 1959-6 1, the overburdened agricultural sector collapsed, causing widespread hunger and many premature deaths in 1960-2 (Ashton et al., 1984).
Although the GLF may be differentiated from Stalin’s policy of intentionally squeezing the peasantry, the lopsided emphasis on heavy industry and the heightened state domination of the peasantry in the GLF are very close to Stalinist practice (Bernstein, 1984). As Xue Muqiao (1980: 90), a leading Chinese economist-planner, put it: ‘by squeezing out agriculture, which led to serious sectoral imblanaces, [we] committed a bigger mistake than Stalin did.’
Implications for urban growth Industrial employment growth As outlined earlier, industrial output growth in the period 1949-82 was of the ‘extensive’ type (i.e. requiring massive infusions of labour and capital), despite the increase in the capital-labour ratio in industry in the post-1965 period (mainly due to the sudden expansion of industrial capital stock duirng the GLF). As a result, the growth rate of industrial employment, remaining at a relatively high average level of 7% per year throughout the post-1949 period, created enormous pressures for urban growth.
18. It has also been argued that the demand for labour may increase, rather than decrease, in the initial stage of agricultural modernization under certain conditions (Freeman, 1982; Whitney, 1980).
19. One can also argue that rural-urban transfer reduces the population on land and increases rural labour productivity. However, whether such a transfer will jeopardize the overall food output condition in a closed economy depends on the initial level of food surplus and the marginal labour productivity of rural labour in the countryside: see Chan (1989).
20. This refers to [Q(I)/L(I)]/[Q(A)/L(A)], where Q is output and L is labour.

288 Kam Wing Chan
Rural-urban disparifies The relative neglect of agriculture led to divergent output growth rates between agriculture and industry, and a wide gap in sectoral labour productivity and rural-urban disparities. These disparities showed few signs of narrowing between 1957 and 1977 under Maoist policy.” Lardy (1983) and Whyte and Parish (1984) have amply documented the increasing rural-urban disparities in real income and consumption. Estimates by Parish (1981), Rawski (1982) and Lardy (1983) show that in terms of ‘real income’ disparity between the rural and urban populations, the ratio was in the range of 3:6 in 1976/7. To give some comparison, the ratios in most other developing countries in the 1960s and 1970s as provided by Lipton (1977: 430-3) were in the range of 1:2 to 1:3.22
These disparities were mainly reinforced and accentuated by state investment and pricing policies in favour of industry, as well as restrictions on rural-urban migration (Lipton, 1984; Zweig, 1987; Chan, 1988a). The Chinese now admit that the ‘scissors gap’ that characterized Soviet policy also appeared in China under Mao (H. Ma, 1982; K. Chen, 1982). According to the former Ministry of Agriculture’s estimate, by selling overpriced industrial goods to the rural areas and buying underpriced agricultural produce from the peasantry, the government was able to make a huge profit of between 20 to 30 billion yuan in 1978 (cited in Yang and Li, 1981). As the gap between the urban and rural areas, or the ‘migration-gradient’, widened, the ‘natural’ impulse for rural-to-urban migration intensified. Only in the post-Mao period has this gap been narrowed under policies more favourable to agricultural growth (Zweig, 1987).
Urbanization costs Increasing urbanization is ‘costly’ from the point of view of maximizing production for two major reasons, as follows.
(1) Difference in urban and rural consumption and costs In Soviet-type economies, the state serves as the controller of the entire economy, and an increase in consumption naturally cuts into the total funds available for investment. As a result, consumption is suppressed nationwide to make room for accumulation. However, owing to the political clout of the urban population (most of whom belong to the ‘proletariat’, the ‘master’ of the socialist state) and the disparities in agricultural-industrial productivity, urban per capita consumption is still significantly higher than in rural areas. Equally important, residents in urban areas require much higher per capita expenditures to be paid by the state in providing various social services and infrastructural facilities than do their counterparts in the countryside, partly due to the higher quality of service in cities. Table 4 shows the rural-urban differentials in the costs of bringing up a child from birth to age 16 in 1979. On a per capita basis, the state paid about five times as much in the cities as in the countryside. Investments and maintenance costs in the ‘urban infrastructures’ took up a large part of the differentials in per capita expenditure borne by the state between the cities and other types of settlement.23 Since the urban sector is owned and administered by the state, and
2 I . It has been argued that the terms of trade between industry and agriculture moved in favour of agriculture under the Maoist policy (see Nolan and White, 1984; C. Wu, 1987; Bhalla, 1990). The argument is based on a narrowing price differential between industrial and agricultural products using official price indexes. However, given the existence of various kinds of formal and informal rationing and limited coverage of products on which these indexes are based, those prices are not valid indicators of the true exchange relationships. For a detailed treatment refer to Lardy (1983).
22. Given no or less effective control on rural-urban migration and family planning programmes, cities in many third world countries contain more unemployed and non-working people. This tends to depress per capita income in the city.
23. A recent policy by the municipality of Guangzhou (Canton) may give some idea of the magnitude of per capita ‘lifetime’ costs of urban infrastructure in a large city borne by the state. Under a new policy to attract foreign funds to finance urban housing construction, the municipality has recently decided to allow relatives of buyers of homes in Guangzhou paid in foreign currencies to move to the city. The
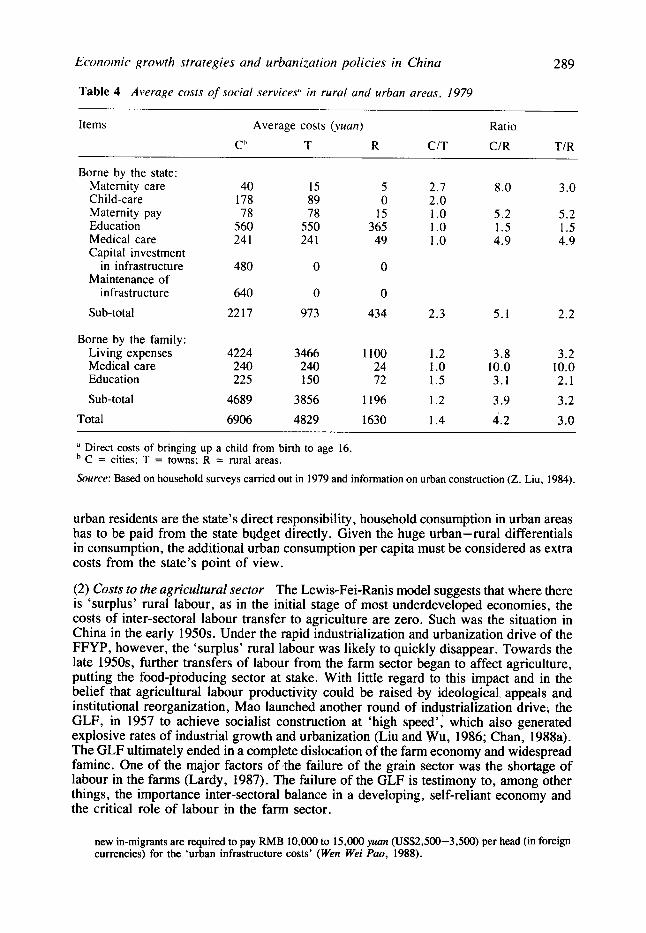
Economic growth strategies and urbanization policies in China 289
Table 4 Average COSIS of social services“ in rural and urban areu , 1979
Items Average costs (yuan) Ratio
Ch T R CIT CIR TIR
Borne by the state: Maternity care Child-care Maternity pay Education Medical care Capital investment
in infrastructure Maintenance of
infrastructure
40 15 5 2.7 8.0 3.0 178 89 0 2 .0 78 78 15 1 .o 5.2 5.2
560 550 365 1 .o 1.5 1.5 24 1 24 1 49 1 .o 4.9 4.9
480 0 0
640 0 0
Sub-total 2217 973 434 2.3 5.1 2.2
Borne by the family: Living expenses 4224 3466 1 1 0 0 I .2 3.8 3.2 Medical care 240 240 24 1 .o 10.0 10.0 Education 225 150 72 1.5 3.1 2.1 Sub-total
Total 4689 3856 1196 1.2 3.9 3.2 6906 4829 1630 1.4 4.2 3.0
a Direct costs of bringing up a child from birth to age 16.
Source: Based on household surveys carried out in 1979 and information on urban construction (Z. Liu, 1984).
C = cities; T = towns; R = rural areas.
urban residents are the state’s direct responsibility, household consumption in urban areas has to be paid from the state budget directly. Given the huge urban-rural differentials in consumption, the additional urban consumption per capita must be considered as extra costs from the state’s point of view.
(2 ) Costs to the agricultural sector The Lewis-Fei-Ranis model suggests that where there is ‘surplus’ rural labour, as in the initial stage of most underdeveloped economies, the costs of inter-sectoral labour transfer to agriculture are zero. Such was the situation in China in the early 1950s. Under the rapid industrialization and urbanization drive of the FFYP, however, the ‘surplus’ rural labour was likely to quickly disappear. Towards the late 1950s, further transfers of labour from the farm sector began to affect agriculture, putting the food-producing sector at stake. With little regard to this impact and in the belief that agricultural labour productivity could be raised by ideological appeals and institutional reorganization, Mao launched another round of indrstrialization drive, the GLF, in 1957 to achieve socialist construction at ‘high speed’, which also generated explosive rates of industrial growth and urbanization (Liu and Wu, 1986; Chan, 1988a). The GLF ultimately ended in a complete dislocation of the farm economy and widespread famine. One of the major factors of the failure of the grain sector was the shortage of labour in the farms (Lardy, 1987). The failure of the GLF is testimony to, among other things, the importance inter-sectoral balance in a developing, self-reliant economy and the critical role of labour in the farm sector.
new inmigrants are required to pay RMB 10,000 to 15,000 yuan (US$2,500-3,500) per head (in foreign currencies) for the ‘urban infrastructure costs’ (Wen Wei Pao, 1988).
290 Kam Wing Chan
Policies to economize on urbanization costs
To jointly maximize industrial output and minimize urbanization costs implies suppressing the growth of per capita urbanization costs, increasing the Q/Li ratio, and/or decreasing the UM value (Equation 3).
Minimizing the growth of per capita urbanization costs Increase in personal consumption in the urban areas during the Maoist era was curbed by a de facto wage freeze and by various forms of rationing of consumer goods and services, although there were increases in mainly work-related benefits (such as medical and child- care. and pension funds) and subsidies for food prices. Between 1957 and 1977, the average wages for workers in the state sector, measured in constant terms, actually declined from 142 yuan to 135 yuan (about US$35) (SSB, 1984a).24 On a per urban resident basis, both direct and indirect grain consumption only increased marginally by 10% over the two decades since 1957 (Lardy, 1983).
A formal urban rationing system has also been in place since 1953. In its full implementation, it covered almost all foodstuffs and major consumer goods, such as cloth and bicycles. Ration coupons were handed out to urban residents registered with the household registration authorities (Government Administration Council, 1953; State Council, 1955). Typically, standards laid down by the central authorities determined monthly or annual quotas for each urban ‘non-agricultural’ resident (Chan and Tsui, 1992). Often, food rations could only be redeemed at the place of household registration. Tied closely to the household registration system, the food rationing system served throughout the 1960s and 1970s as an effective policy tool in controlling population migration.
Other items of urban ‘non-productive’ consumption also suffered from the policy to minimize ‘non-productive’ urban expenditures. Urban housing was neglected, with (mainly urban) housing’s share of total state capital investment remaining low until the late 1970s (Table 2). In the FFYP, the share averaged about 9.1 %; thereafter, it declined to about 5% for the period up to 1975. The average urban resident in China in the late 1970s had a mere 4m2 floor area. A survey of 192 cities in 1978 also indicates that the per capita floor area in those cities actually dropped from 4.5m2 in 1950 to 3.6m2 in 1978 (SSB, 1986b).
The housing problem in the late 1970s was actually more acute than is revealed by these floor area figures, because of the ageing of the housing stock due to a lack of maintenance. In 1979, more than half of all urban residences were described as ‘in urgent need of repair’, and buildings of more than 30 million m2 of floor space were ‘in danger of collapse’. The urban housing shortages became so severe that the Chinese government considered them truly a ‘crisis’ (Lalkaka, 1984). Only after 1979, with the massive infusion of investment in housing, did urban housing conditions start to improve.
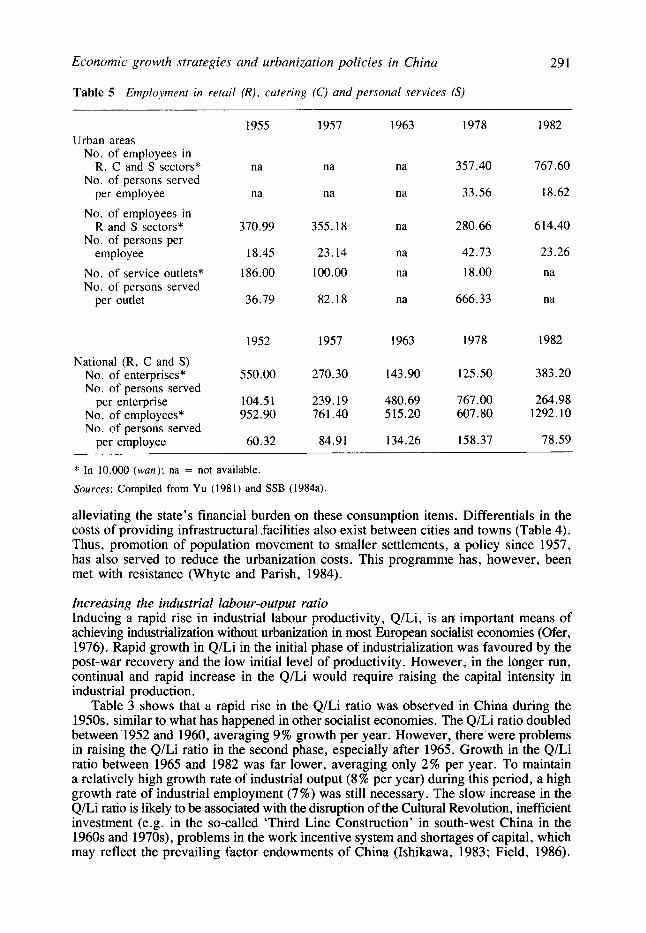
A similar story of neglect can also be detailed for other urban services. Shortages of services of all kinds in cities and towns were commonplace in the pre-1979 era. Deterioration of service quality in cities is most forefully reflected by the decline in the absolute number of workers in the retail and service sectors between 1952 and 1978, despite increases in urban population. This resulted in a drastic jump - from 23 to 43 - in the number of persons served per retail and service employee in the urban areas (Table 5). The consequence of under-provision of service and retail facilities translated into widespread consumer complaints and long queues for consumer goods, a familiar scene in Maoist China (Qui, 1980). The low level of urban service provision also forced urban residents to spend much time outside their regular work hours in the self-provision of these services,2s hence 24. On a per capita basis, there were increases in urban income between 1957 and 1977. attributable mainly
to the rise in the urban labour participation rate. 25. A survey of two large cities in China in the early 1980s. indicates that urban employees spent on average
up to 4-5 hours on household work daily (Liu, 1984).
Economic growth strategies and urbanization policies in China 29 1
Table 5 Employment in retail (R), catering (C) and personal services (S)
1955 1957 1963 1978 1982 Urban areas
No. of employees in R. C and S sectors*
No. of persons served per employee
No. of employees in R and S sectors*
No. of persons per employee
No. of service outlets* No. of persons served
per outlet
357.40
33.56
767.60
18.62
na na na
na na na
280.66
42.73 18.00
666.33
614.40
23.26 na
na
370.99
18.45 186.00
36.79
355.18
23. I4 100.00
82.18
na
na na
na
1957 I963 I978 1982 I952
National (R, C and S) No. of enterprises* No. of persons served
per enterprise No. of employees* No. of persons served
per employee
270.30 143.90 125.50 383.20 550.00
264.98 1292.10
104.51 952.90
239.19 761.40
480.69 515.20
767.00 607.80
134.26 158.37 78.59 60.32 84.91
* In 10.000 (wan); na = not available.
Sources: Compiled from Yu (1981) and SSB (1984a).
alleviating the state’s financial burden on these consumption items. Differentials in the costs of providing infrastructural .facilities also exist between cities and towns (Table 4). Thus, promotion of population movement to smaller settlements, a policy since 1957, has also served to reduce the urbanization costs. This programme has, however, been met with resistance (Whyte and Parish, 1984).
Increasing the industrial labour-output ratio Inducing a rapid rise in industrial labour productivity, Q/Li, is an important means of achieving industrialization without urbanization in most European socialist economies (Ofer, 1976). Rapid growth in Q/Li in the initial phase of industrialization was favoured by the post-war recovery and the low initial level of productivity. However, in the longer run, continual and rapid increase in the Q/Li would require raising the capital intensity in industrial production.
Table 3 shows that a rapid rise in the Q/Li ratio was observed in China during the L950s, similar to what has happened in other socialist economies. The Q/Li ratio doubled between 1952 and 1960, averaging 9% growth per year. However, there were problems in raising the Q/Li ratio in the second phase, especially after 1965. Growth in the Q/Li ratio between 1965 and 1982 was far lower, averaging only 2% per year. To maintain a relatively high growth rate of industrial output (8% per year) during this period, a high growth rate of industrial employment (7%) was still necessary. The slow increase in the Q/Li ratio is likely to be associated with the disruption of the Cultural Revolution, inefficient investment (e.g. in the so-called ‘Third Line Construction’ in south-west China in the 1960s and 1970s), problems in the work incentive system and shortages of capital, which may reflect the prevailing factor endowments of China (Ishikawa, 1983; Field, 1986).
292 Kam Wing Chan
Decreasing the ‘urban multiplier’ Given the problems in raising industrial labour productivity in the post-1965 period and in depressing basic consumption in the urban areas (because the consumption level was already quite low), and the experience of severe urban food shortages in the early 1960s, the rapid expansion of industrial output since the 1960s has concentrated largely on fuller utilization of the urban labour force instead of rapidly increasing the urban population size. These measures focus on reducing the values of ‘e’, ‘u’ and ‘s’ as specified in Equation 4.
Restraints on the freedom of labour and personal mobility Direct controls on personal mobility formed the cornerstone of urbanization-restricting policies. Central to these controls is the household registration (hukou) system, which was restored under communist rule to serve, initially, the purposes of residence registration, and, later, migration controls and food rationing.
From its full implementation in the 1960s and the early 1970s, the household registration system has required every citizen to obtain clearance from the public security bureau before changing residences. To move one’s permanent residence from rural to urban would require the conversion of registration status from ‘agricultural’ to ‘non-agricultural’ (X. Ma, 1987). Such a conversion is granted only when a peasant ‘enters’ the state sector through one of the few channels of labour or military recruitment, or college enrolment (Chan and Xu, 1985). These entries are, however, tightly controlled by both the employment, food rationing and police authorities based on quotas specified in national and local economic plans. Indeed, even marriage to an urbanite generally does not entitle one to a permanent urban residence status (Whyte and Parish, 1984).
In the urban areas, the allocation of food and other necessities, and social services, are directly linked to the household registration. In the pre-1980 period, because of the immense difficulty in obtaining staple foods outside the state-controlled channels, the combination of the household registration system, the food rationing system and policing organizations such as the local security bureaux and neighbourhood committees, formed an effective web in preventing unauthorized in-migration. This system, however, has not been functioning well in the post-Mao period due to the greater availability of food grain free markets.
Direct resettlement of urban residents in the countryside Resettlement campaigns, collectively known as ‘rustication’ in western literature, range from the coercive, direct removal of the urban unemployed to semi-voluntary ‘sending-down’ programmes aiming to ‘re-educate’ intellectuals. These campaigns have the practical effect of cutting down the urban population size.
The rustication programme was initiated in the mid-1950s. Its high tide came in the slump years of the early 196Os, during which about 20 million urban residents were returned to the countryside (Y. Chen, 1961). Rustication was reinstituted during the Cultural Revolution decade (1966-76) under the shngshan xiaxiang programme, designed originally to cope with the urban youth unemployment problem created by the chaos in the urban economy and increases in the number of new entrants to the urban labour force resulting from the relatively higher urban rates of natural increase in the 1 9 5 0 ~ . ~ ~ In the 1970s, however, the programme was more oriented as a means of ‘re-educating’ urban youth,
26. The average number of entrants to the labour force was close to 3 million per year in the late 1960s (Fang and Zhao, 1982).
Economic growth strategies and urbanization policies in China 293
Table 6 Sectoral composition of employment and urbanization
Year Percentage of employment Urb. % Ratios
A* I S N U U/I U/N
1952 1957 1962 1965 1970 1975 1978 1980 1981 1982
83.54 81.23 82.12 81.51 79.91 75.61 70.75 70.29 70.05 68.74
7.39 9.01 7.95 8.40
10.22 13.50 15.24 16.28 16.34 16.26
9.07 9.76 9.93 9.99 9.00 9.32
10.93 11.61 11.64 12.13
16.46 18.77 17.88 18.39 19.22 22.81 26.17 27.89 27.98 28.39
12.50 15.40 17.30 18.00 17.40 17.30 17.90 19.40 20.20 20.80
1.69 1.71 2.18 2.14 1.70 1.28 1.17 1.19 1.24 1.28
0.76 0.82 0.97 0.98 0.91 0.76 0.68 0.70 0.72 0.73
* A = agriculture; I = industry; S = services; N = I+S; U = % of population in urban areas.
Sources: SSB (1986a; 198713).
and during the Cultural Revolution decade, an estimated total of 30 million urban residents were .rusticated (Chan, 1988).27
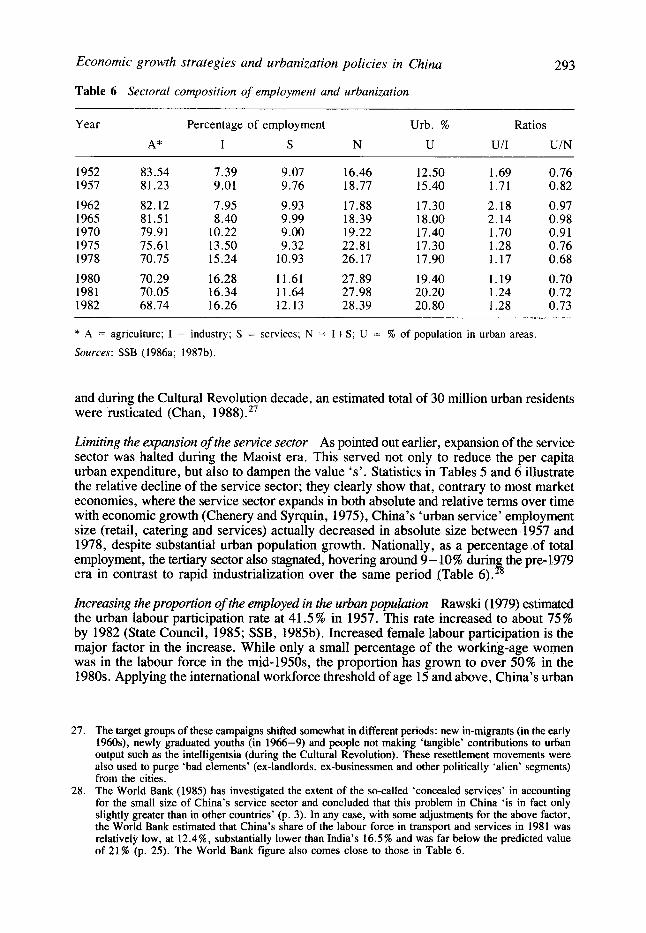
Limiting the expansion of the service sector As pointed out earlier, expansion of the service sector was halted during the Maoist era. This served not only to reduce the per capita urban expenditure, but also to dampen the value ‘s’. Statistics in Tables 5 and 6 illustrate the relative decline of the service sector; they clearly show that, contrary to most market economies, where the service sector expands in both absolute and relative terms over time with economic growth (Chenery and Syrquin, 1975), China’s ‘urban service’ employment size (retail, catering and services) actually decreased in absolute size between 1957 and 1978, despite substantial urban population growth. Nationally, as a percentage of total employment, the tertiary sector also stagnated, hovering around 9- 10% durin the pre-1979 era in contrast to rapid industrialization over the same period (Table 6). B Increasing the proportion of the employed in the urban population Rawski (1979) estimated the urban labour participation rate at 41.5 % in 1957. This rate increased to about 75 % by 1982 (State Council, 1985; SSB, 1985b). Increased female labour participation is the major factor in the increase. While only a small percentage of the working-age women was in the labour force in the mid-l950s, the proportion has grown to over 50% in the 1980s. Applying the international workforce threshold of age 15 and above, China’s urban
27. The target groups of these campaigns shifted somewhat in different periods: new in-migrants (in the early 1960s), newly graduated youths (in 1966-9) and people not making ‘tangible’ contributions to urban output such as the intelligentsia (during the Cultural Revolution). These resettlement movements were also used to purge ‘bad elements’ (ex-landlords, ex-businessmen and other politically ‘alien’ segments) from the cities.
28. The world Bank (1985) has investigated the extent of the so-called ‘concealed services’ in accounting for the small size of China’s service sector and concluded that this problem in China ‘is in fact only slightly greater than in other countries’ (p. 3). In any case, with some adjustments for the above factor, the World Bank estimated that China’s share of the labour force in transport and services in 1981 was relatively low, at 12.4%, substantially lower than India’s 16.5% and was far below the predicted value of 21 % (p. 25). The World Bank figure also comes close to those in Table 6.
294 Kam Wing Chan
female labour participation rate was 67% in 1982, exceeding those of many market economies which also have high rates.29
The size of the non-working population has also been minimized by rigorous urban family planning campaigns since the early 1960s. Following a period of relatively high urban fertility of the ‘post-war baby boom’ in the 1950s, China began to promote family planning in the urban areas in the early 1960s and, later, in the countryside (Banister, 1987). The result - no doubt also aided greatly by the drastic increase in women’s labour participation and the deteriorating urban housing conditions - is significant: the urban total fertility rate declined from about 5-6 in the mid-1950s and the early 1960s to about 1.5 in the mid-1970s and onward (S. Chen, 1983). Considering China’s low per capita income level, such a rapid transition within a couple of decades is impressive. The combined result of declining fertility and increased labour participation has considerably reduced the dependency ratio in urban families. The ratio of non-working persons to working persons fell from 3.29 in 1957 to 2.06 in 1978 and 1.71 in 1983 (SSB, 1986a).
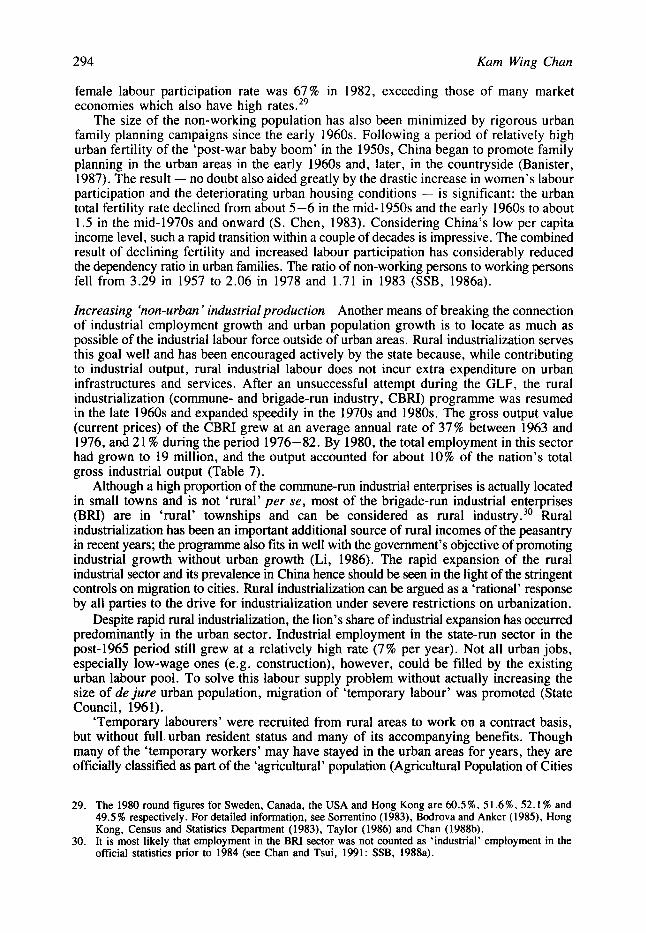
Increasing ‘non-urban ’ industrial production Another means of breaking the connection of industrial employment growth and urban population growth is to locate as much as possible of the industrial labour force outside of urban areas. Rural industrialization serves this goal well and has been encouraged actively by the state because, while contributing to industrial output, rural industrial labour does not incur extra expenditure on urban infrastructures and services. After an unsuccessful attempt during the GLF, the rural industrialization (commune- and brigade-run industry, CBRI) programme was resumed in the late 1960s and expanded speedily in the 1970s and 1980s. The gross output value (current prices) of the CBRI grew at an average annual rate of 37% between 1963 and 1976, and 21 % during the period 1976-82. By 1980, the total employment in this sector had grown to 19 million, and the output accounted for about 10% of the nation’s total gross industrial output (Table 7).
Although a high proportion of the commune-run industrial enterprises is actually located in small towns and is not ‘rural’ per se, most of the brigade-run industrial enterprises (BRI) are in ‘rural’ townships and can be considered as rural indu~try.~’ Rural industrialization has been an important additional source of rural incomes of the peasantry in recent years; the programme also fits in well with the government’s objective of promoting industrial growth without urban growth (Li, 1986). The rapid expansion of the rural industrial sector and its prevalence in China hence should be seen in the light of the stringent controls on migration to cities. Rural industrialization can be argued as a ‘rational’ response by all parties to the drive for industrialization under severe restrictions on urbanization.
Despite rapid rural industrialization, the lion’s share of industrial expansion has occurred predominantly in the urban sector. Industrial employment in the state-run sector in the post-1965 period still grew at a relatively high rate (7% per year). Not all urban jobs, especially low-wage ones (e.g. construction), however, could be filled by the existing urban labour pool. To solve this labour supply problem without actually increasing the size of dejure urban population, migration of ‘temporary labour’ was promoted (State Council, 1961).
‘Temporary labourers’ were recruited from rural areas to work on a contract basis, but without full urban resident status and many of its accompanying benefits. Though many of the ‘temporary workers’ may have stayed in the urban areas for years, they are officially classified as part of the ‘agricultural’ population (Agricultural Population of Cities
29. The 1980 round figures for Sweden, Canada, the USA and Hong Kong are 60.5%. 51.6%. 52. I % and 49.5% respectively. For detailed information, see Sorrentino (1983). Bodrova and Anker (1985). Hong Kong, Census and Statistics Department (1983), Taylor (1986) and Chan (1988b).
30. It is most likely that employment in the BRI sector was not counted as ‘industrial’ employment in the official statistics prior to 1984 (see Chan and Tsui, 1991: SSB, 1988a).
Economic growth strategies and urbanization policies in China
Table 7 Rural industr! (c'otnmune- and brigade-run industry), 1958-80
4 295
Gross output (current prices) Employment
Year (billion vuan) As % of (million) As % of total total
industrial industrial c;' B C + B output C B C + B employment
1958 6.0 n 6.0 5.5 18 n 18 25.4 1961 2.0 n 2.0 1.8 1963 0.4 n 0.4 4.3 1976 12.4 11.9 24.3 7.4 8.2 14.5 1978 8.3 9.1 17.4 28.6 I980 28.7 24.1 52.8 10.3 9.1 10.8 19.9 29.2
Average annual growth rate ( % ) h
1963-76 37.2' 1976-80 21.4' 24.8
i' C = commune-run industrial enterprises: B = brigade-run industrial enterprises: n = negligible (assumed to be zero).
' Based on current prices.
Soirrws: H. Ma (1982): SSB (1985a: 1985b: 1987b).
By use of a compound interest formula.
and Towns, APCT) and are not recognized as the de jure urban population (the Non- agricultural Population of Cities and Towns, NPCT).3' Some 'temporary' labourers commute to work in the urban areas from nearby counties on a daily basis (Zheng et a l . , 1985). The designation of these labourers as part of the APCT makes a great difference financially to the state, which is. responsible for providing services and infrastructure to all de jure urban residents.
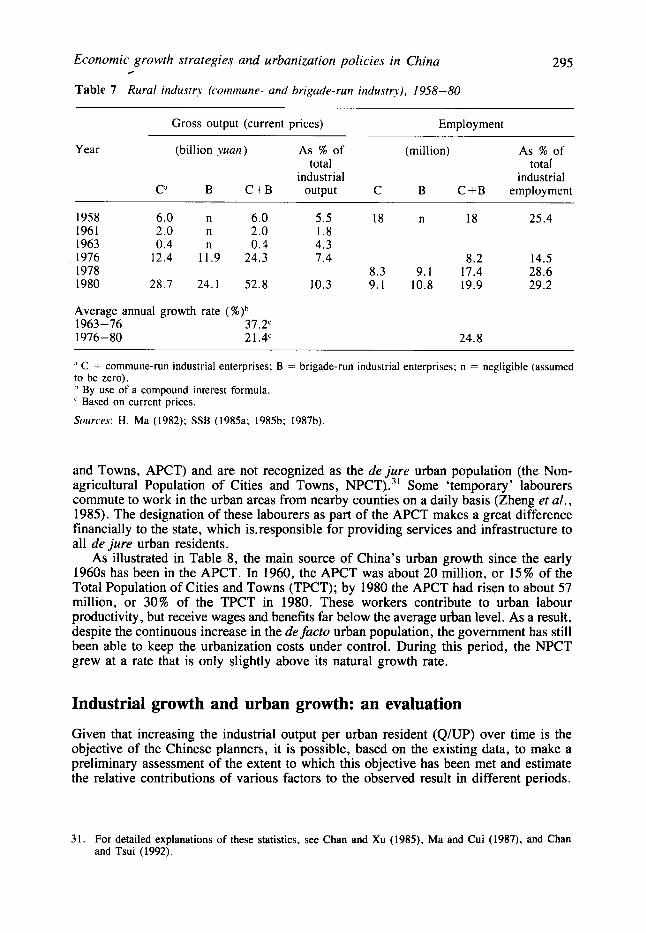
As illustrated in Table 8, the main source of China's urban growth since the early 1960s has been in the APCT. In 1960, the APCT was about 20 million, or 15% of the Total Population of Cities and Towns (TPCT); by 1980 the APCT had risen to about 57 million, or 30% of the TPCT in 1980. These workers contribute to urban labour productivity, but receive wages and benefits far below the average urban level. As a result, despite the continuous increase in the defucto urban population, the government has still been able to keep the urbanization costs under control. During this period, the NPCT grew at a rate that is only slightly above its natural growth rate.
Industrial growth and urban growth: an evaluation
Given that increasing the industrial output per urban resident (Q/UP) over time is the objective of the Chinese planners, it is possible, based on the existing data, to make a preliminary assessment of the extent to which this objective has been met and estimate the relative contributions of various factors to the observed result in different periods.
31. For detailed explanations of these statistics, see Chan and Xu (1985), Ma and Cui (1987), and Chan and Tsui (1992).
296 Kam Wing Chan
Table 8 ‘Agricultural ’ and ‘non-agricultuml ’ urbun population, 1960-83 (in millions)
Population residing in urban areas
Year “on-agricultural’ ‘Agricultural’ Total end (NPCT) (APCT) (TPCT)
Size % of TPCT Size % of TPCT Size
1960 110.92 1965 101.70 1970 100.75 I975 111.71 1980 134.13 1982 142.90 1983 149.60 1965-75:
Absolute increase
Annual growth (million) 10.01
rate (%) 0.94 1 960- 80:
Absolute increase
Annual growth (million) 23.21
rate (%) 0.95
84.8 19.81 78.0 28.75 69.8 43.49 69.7 48.59 70.1 57.27 67.6 68.64 62.0 91.66
19.84
5.39
37.46
5.45
15.1 130.73 22.0 130.45 30.2 144.24 30.3 160.30 29.9 191.40 32.4 211.54 38.0 241.26
29.85
2.08
60.67
1.92
Source: Chan and Xu (1985); SSB (1985a).
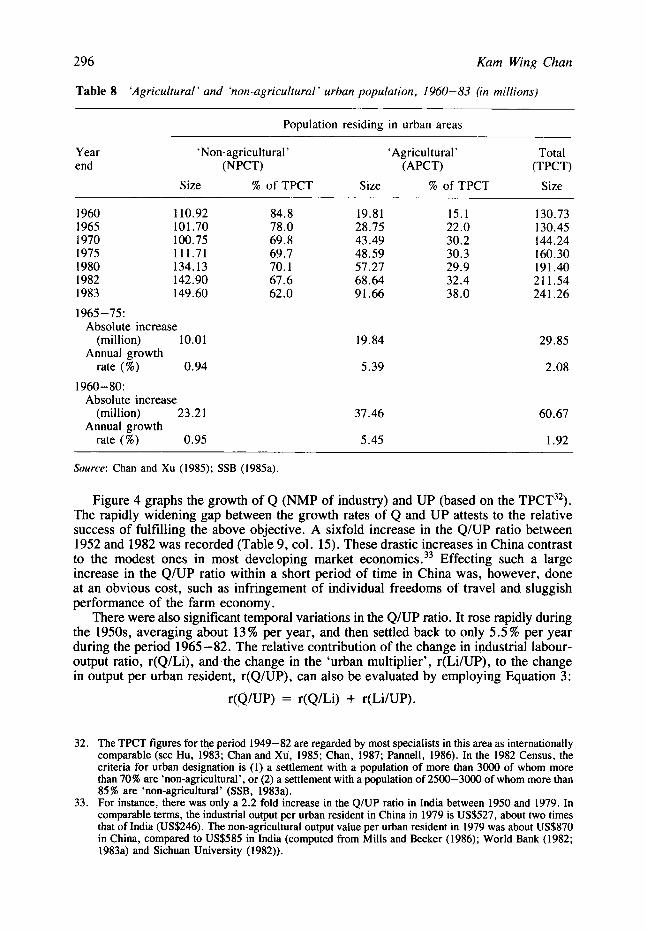
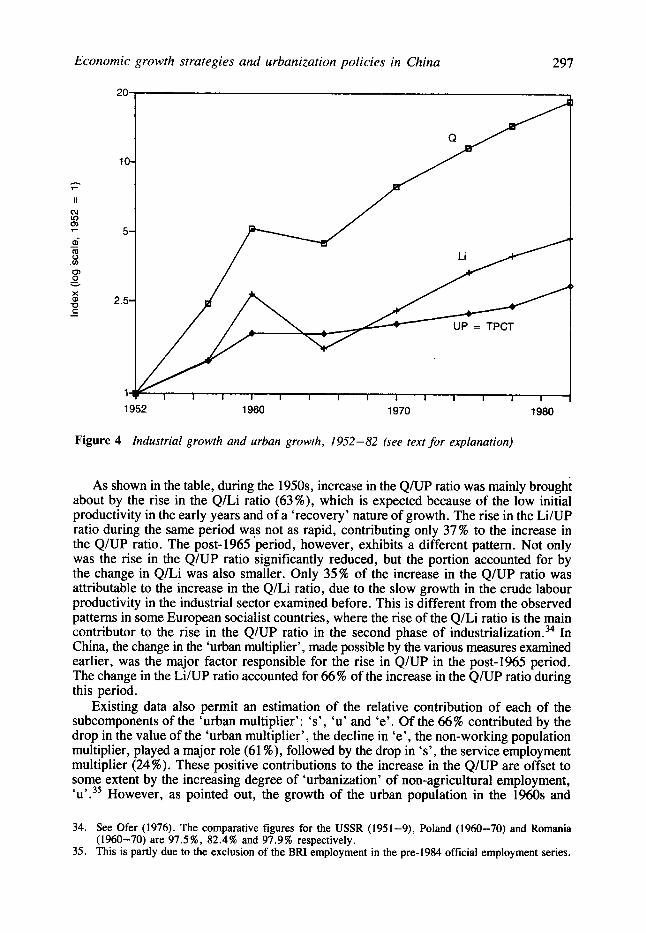
Figure 4 graphs the growth of Q (NMP of industry) and UP (based on the TPCT3*). The rapidly widening gap between the growth rates of Q and UP attests to the relative success of fulfilling the above objective. A sixfold increase in the Q/UP ratio between 1952 and 1982 was recorded (Table 9, col. 15). These drastic increases in China contrast to the modest ones in most developing market economies.33 Effecting such a large increase in the Q/UP ratio within a short period of time in China was, however, done at an obvious cost, such as infringement of individual freedoms of travel and sluggish performance of the farm economy.
There were also significant temporal variations in the Q/UP ratio. It rose rapidly during the 1950s, averaging about 13% per year, and then settled back to only 5 .5% per year during the period 1965-82. The relative contribution of the change in ivdustrial labour- output ratio, r(Q/Li), and the change in the ‘urban multiplier’, r(Li/UP), to the change in output per urban resident, r(Q/UP), can also be evaluated by employing Equation 3:
r(Q/UP) = r(Q/Li) + r(Li/UP).
32. The TPCT figures for the period 1949-82 are regarded by most specialists in this area as internationally comparable (see Hu, 1983; Chan and Xu, 1985; Chan, 1987; Pannell, 1986). In the 1982 Census, the criteria for urban designation is (1) a settlement with a population of more than 3000 of whom more than 70% are ‘non-agricultural’, or (2) a settlement with a population of 2500-3000 of whom more than 85% are ‘non-agricultural’ (SSB, 1983a).
33. For instance, there was only a 2.2 fold increase in the QlUP ratio in India between 1950 and 1979. In comparable terms, the industrial output per urban resident in China in 1979 is US$527, about two times that of India (US$246). The non-agricultural output value per urban resident in 1979 was about US$870 in Chim, compared to US$585 in India (computed from Mills and Becker (1986); World Bank (1982; 1983a) and Sichuan University (1982)).
Economic growth strategies and urbanization policies in China 297
Figure 4 Industrial growth and urban growth, 1952-82 (see text for explanation)
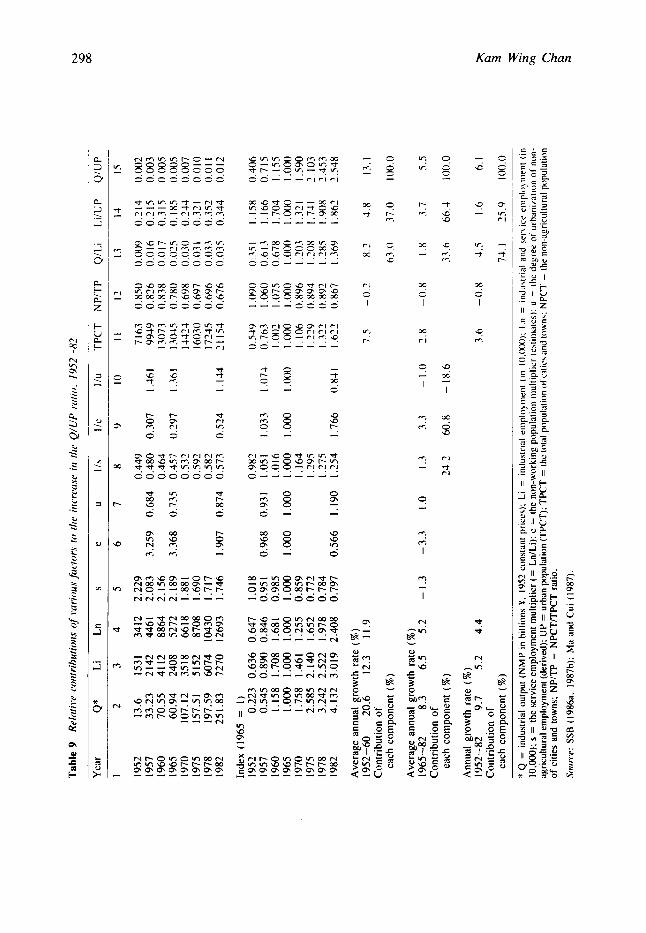
As shown in the table, during the 1950s, increase in the Q/UP ratio was mainly brought about by the rise in the Q/Li ratio (63%), which is expected because of the low initial productivity in the early years and of a ‘recovery’ nature of growth. The rise in the Li/UP ratio during the same period was not as rapid, contributing only 37% to the increase in the Q/UP ratio. The post-1965 period, however, exhibits a different pattern. Not only was the rise in the Q/UP ratio significantly reduced, but the portion accounted for by the change in Q/Li was also smaller. Only 35% of the increase in the Q/UP ratio was attributable to the increase in the Q/Li ratio, due to the slow growth in the crude labour productivity in the industrial sector examined before. This is different from the observed patterns in some European socialist countries, where the rise of the Q/Li ratio is the main contributor to the rise in the Q/UP ratio in the second phase of indu~trialization.~~ In China, the change in the ‘urban multiplier’, made possible by the various measures examined earlier, was the major factor responsible for the rise in Q/UP in the post-1965 period. The change in the Li/UP ratio accounted for 66 % of the increase in the Q/UP ratio during this period.
Existing data also permit an estimation of the relative contribution of each of the subcomponents of the ‘urban multiplier’: ‘s’, ‘u’ and ‘e’. Of the 66% contributed by the drop in the value of the ‘urban multiplier’, the decline in ‘e’, the non-working population multiplier, played a major role (61 %), followed by the drop in ‘s’, the service employment multiplier (24%). These positive contributions to the increase in the Q/UP are offset to some extent by the increasing degree of ‘urbanization’ of non-agricultural employment, L U 9 . 35 However, as pointed out, the growth of the urban population in the 1960s and
34. See Ofer (1976). The comparative figures for the USSR (1951-9), Poland (1960-70) and Romania (1960-70) are 97.5%, 82.4% and 97.9% respectively.
35. This is partly due to the exclusion of the BRI employment in the pre-1984 official employment series.
Tabl
e 9
Rel
trtiw
cor
ztrih
ictio
rrs o
f w
rio
us
jir1,
tor.
s to
rlic
irrc
~rc.t
isc, irr
tlr
t Q
/UP
I.U
I~O
, 195
2-82
Y ei
r Q
* Li
Ln
S
e u
I/?,
IIL'
I/u
TPC
T
1 2
34
5
6 7
8 9
I0
II
I952
13
.6
1531
34
12
2.22
9 0.
449
7163
I9
57
33.2
3 21
42
4461
2.
083
3.25
9 0.
684
0.48
0 0.
307
1.46
1 99
49
1960
70
.55
4112
88
64
2.15
6 0.
464
1307
3 I9
65
60.9
4 24
08
5272
2.
189
3.36
8 0.
735
0.45
7 0.
297
1.36
1 13
045
I970
10
7.12
35
18
6618
1.
881
0.53
2 I4
424
I975
15
7.51
51
52
8708
1.
690
0.59
2 I6
030
I978
19
7.59
60
74
1043
0 1.
717
0.58
2 I7
245
I982
25
1.83
72
70
1269
3 1.
746
1.90
7 0.
874
0.57
3 0.
524
1.14
4 21
154
Inde
x (1
965
= I
) 19
52
0.22
3 0.
636
0.64
7 1.
018
0.98
' 0.
549
1957
0.
545
0.89
0 0.
846
0.95
1 0.
968
0.93
1 1.
051
1.03
3 1.
074
0.76
3 I9
60
1.15
8 1.
708
1.68
1 0.
985
1.01
6 1.
002
I965
1.
Ooo
1.
000
1.00
0 1.
OOo
1.00
0 1.
000
1.00
0 1.
000
1.00
0 1.
000
I970
1.
758
1.46
1 1.
255
0.85
9 I.
I64
I. 10
6 19
75
2.58
5 2.
140
1.65
2 0.
772
1.79
5 I .
229
1978
3.
242
2.52
2 1.
978
0.78
4 1.
275
1.32
2 I9
82
4.13
2 3.
019
2.40
8 0.
797
0.56
6 1.
190
1.25
4 1.
766
0.84
1 1.
622
Ave
rage
ann
ual g
row
th r
ate
(%)
1952
-60
20.6
12
.3
11.9
7.
5 C
ontr
ibut
ion
of
~_
__
_
___
each
com
pone
nt (
%)
Ave
rage
ann
ual g
row
th r
ate
(%)
Con
trib
utio
n of
19
65-8
2 8.
3 6.
5 5.
2 -1
.3
-3.3
1.
0 1.
3 3.
3 - 1
.0
2.8
each
com
pone
nt (
%)
24.2
60
.8
- 1
8.6
Ann
ual g
row
th r
ate
1%)
1952
-82
9.7
5.2
4.4
3.6
Con
trib
utio
n of
ea
ch C
ompo
nent
(%
)
NPi
TP
I2
o.x.
50
0.87
6 0.
838
0.78
0 0.
698
0.69
7 0.
696
0.67
6
1.09
0 1.
060
1.07
5 1 .o
oo
0.89
6 0.
894
0.89
7 0.
X67
-0.2
-0.8
-0.8
Q1l
.i
13
0.0()9
0.0 I
6 0.
0 I7
0.
025
0.03
0 0.
03 I
0.03
3 0.
035
0.35
1 0.
613
0.67
8 1.
000
1.20
3 I .
'OX
I .2x
5 I ,
369
8.2
63.0
I .x
33.6
4.5
74. I
I.i/U
P
14
0.71
4 0.
215
0.31
5 0
. I 85
0.
244
0.32
1 0.
352
0.34
4
~
I. 15
8 1.
166
I ,70
4 1.
000
1.32
1 1.
741
I ,90
8 I .
X62
4.8
37.0
3.7
66.4
I .6
25.9
QlU
P
IS
0.00
2 0,
003
0.00
5 0.
005
0.00
7 0.
0 I 0
0.01
I 0.
012
___-
0.40
6 0.
715
1.15
5 I .o
m
I .59
0 2.
103
2.45
3 2.
548
13. I
100.
0
5.5
100.
0
6. I
100.
0
* Q =
indu
stri
al o
utpu
t (N
MP
in b
illio
ns Y
. I9
52 c
onst
ant
pric
cs):
Li
= i
ndus
tria
l eni
plo)
inen
t (i
n 10
.000
): L
n =
iiid
wtv
ial a
nd s
en ic
e cn
iplo
)inen
t (i
n 10
,OO
O): s
= th
e se
rvic
e em
ploy
men
t mul
tiplie
r (=
Lnl
Li):
c =
the
non-
wor
king
pop
ulat
ion
inul
tiplie
r (c
htin
iate
s): u
= t
he d
egre
e 01
urb
ani/a
tion
of'n
on-
agri
cultu
ral e
mpl
oym
ent (
deri
ved)
: UP
= u
rban
pop
ulat
ion
(TPC
T): T
PCT
= th
c tot
al p
opul
atio
n of
citi
ch an
d to
wn\
: NPC
T - th
e no
n-ag
ricu
ltura
l pop
ulat
ion
of c
itie
s an
d to
wns
: N
PlT
P =
NPC
TlT
PCT
rat
io.
So
irrw
: SSB
(198
6a. 1987b):
Ma
and
Cui
(19
87).
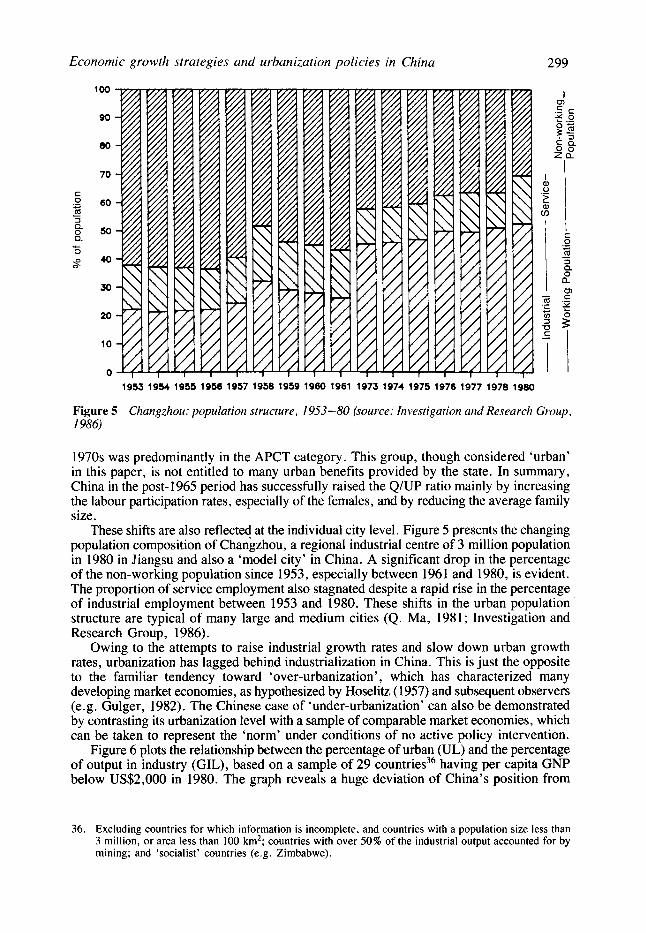
Economic growth strategies and urbanization policies in Chinu 299
v- 0
8
1 0 0
90
80
70
60
50
40
50
20
10
0 1953 1954 1955 1956 1957 1958 1959 1960 1961 1973 1974 1975 1976 1977 1978 1980
Figure 5 Chungzhou: population structure, 1953-80 (source: Investigution und Research Group, 1986)
1970s was predominantly in the APCT category. This group, though considered ‘urban’ in this paper, is not entitled to many urban benefits provided by the state. In summary, China in the post-1965 period has successfully raised the Q/UP ratio mainly by increasing the labour participation rates, especially of the females, and by reducing the average family size.
These shifts are also reflected at the individual city level. Figure 5 presents the changing population composition of Changzhou, a regional industrial centre of 3 million population in 1980 in Jiangsu and also a ‘model city’ in China. A significant drop in the percentage of the non-working population since 1953, especially between 1961 and 1980, is evident. The proportion of service employment also stagnated despite a rapid rise in the percentage of industrial employment between 1953 and 1980. These shifts in the urban population structure are typical of many large and medium cities (Q. Ma, 1981; Investigation and Research Group, 1986).
Owing to the attempts to raise industrial growth rates and slow down urban growth rates, urbanization has lagged behind industrialization in China. This is just the opposite to the familiar tendency toward ‘over-urbanization’ , which has characterized many developing market economies, as hypothesized by Hoselitz (1957) and subsequent observers (e.g. Gulger, 1982). The Chinese case of ‘under-urbanization’ can also be demonstrated by contrasting its urbanization level with a sample of comparable market economies, which can be taken to represent the ‘norm’ under conditions of no active policy intervention.
Figure 6 plots the relationship between the percentage of urban (UL) and the percentage of output in industry (GIL), based on a sample of 29 countries36 having per capita GNP below US$2,000 in 1980. The graph reveals a huge deviation of China’s position from
36. Excluding countries for which information is incomplete, and countries with a population size less than 3 million, or area less than 100 kmz; countries with over 50% of the industrial output accounted for by mining; and ‘socialist’ countries (e.g. Zimbabwe).
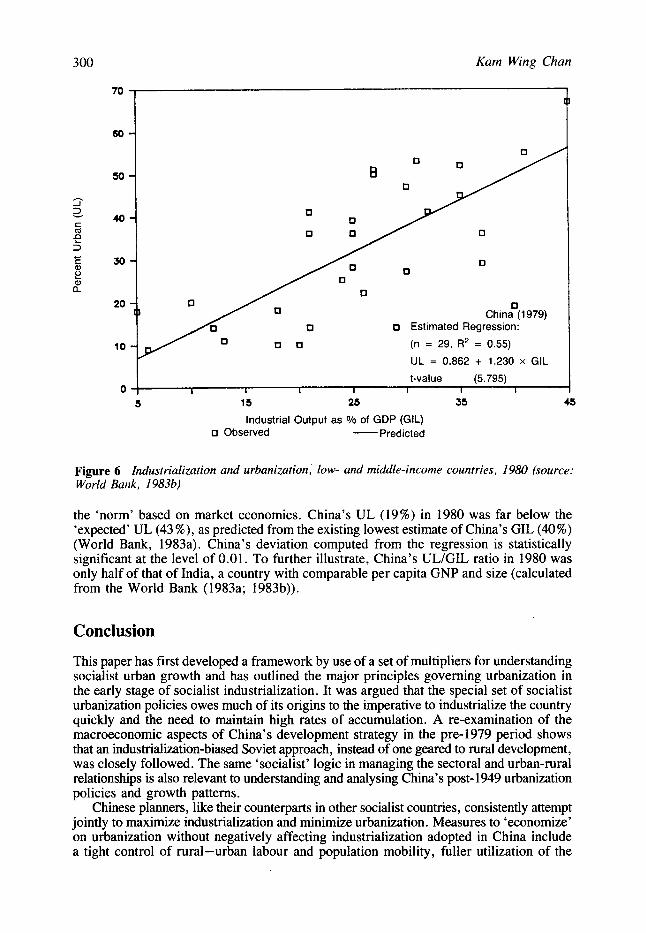
300 Kam Wing Chan
I 0
c Q
3 f!
t-value (5.795) O I I I I I I I I
5 15 25 35 45
industrial Output as Yo of GDP (GIL) Predicted 0 Observed -
Figure 6 Industrialization and urbanization ,’ low- and middle-income countries, I980 (source: World Bank, 19836)
the ‘norm’ based on market economies. China’s UL (19%) in 1980 was far below the ‘expected’ UL (43%), as predicted from the existing lowest estimate of China’s GIL (40%) (World Bank, 1983a). China’s deviation computed from the regression is statistically significant at the level of 0.01. To further illustrate, China’s UL/GIL ratio in 1980 was only half of that of India, a country with comparable per capita GNP and size (calculated from the World Bank (1983a; 1983b)).
Conclusion
This paper has first developed a framework by use of a set of multipliers for understanding socialist urban growth and has outlined the major principles governing urbanization in the early stage of socialist industrialization. It was argued that the special set of socialist urbanization policies owes much of its origins to the imperative to industrialize the country quickly and the need to maintain high rates of accumulation. A re-examination of the macroeconomic aspects of China’s development strategy in the pre- 1979 period shows that an industrialization-biased Soviet approach, instead of one geared to rural development, was closely followed. The same ‘socialist’ logic in managing the sectoral and urban-rural relationships is also relevant to understanding and analysing China’s post- 1949 urbanization policies and growth patterns.
Chinese planners, like their counterparts in other socialist countries, consistently attempt jointly to maximize industrialization and minimize urbanization. Measures to ‘economize’ on urbanization without negatively affecting industrialization adopted in China include a tight control of rural-urban labour and population mobility, fuller utilization of the

Economic growth strategies and urbanization policies in China 30 1
existing urban working-age population, suppression of the expansion of urban service employment and personal consumption in general, promotion of rural industrialization and increased use of urban ‘temporary’ workers. Ironically, in contrast to the previous interpretation of China’s urbanization policies, most of these measures are arguably ‘urban- biased’, similar to those suggested by Lipton (1977). They tend to reinforce the ‘Great Wall’ between town and country.
Measured by the rapid growth in the Q/UP ratio since 1949, China has been highly effective in simultaneously fostering rapid industrial growth and slowing urban growth. Much of the increase in the Q/UP ratio in the post-1965 period was accounted for by the increase in the urban labour participation rate, the rapid decline in urban fertility and the increasing use of urban ‘temporary’ workers. Because of the smaller ‘urban multiplier’ effect with respect to its industrial output or employment, China by the 1970s was relatively ‘under-urbanized’ compared to its level of industrialization or to other developing countries at similar stages. This is just the reverse to the phenomenon of ‘over-urbanization’ in many third world market economies, where similar sets of ‘industrialization-biased’ policies - but without migration controls - have produced ‘excessive’ in-migration to cities and chronic urban unemployment.
Kam Wing Chan, Department of Geography, University of Washington, DP-10, Seattle, WA 98195, USA
References
Amin, S. (1981) Thefuture of Maoism, trans. N. Finkelstein. Monthly Review Press, New York. Ashton, B., K. Hill, A. Piazza and R. Zeitz (1984) Famine in China, 1958-61. Population and
Banister, J. (1987) China s changing population. Stanford University Press, Stanford. Bernstein, T.P. (1984) Stalinism, famine, and Chinese peasants: grain procurements during the
Great Leap Forward. Theory and Society 13.3, 339-77. Berry, B.J.L. (1974) Comparative.urbanisation strategies. In H. Swain and R.D. MacKinnon (eds),
Issues in the management of urban systems, Papers and Proceedings from a IIASA Conference on National Settlement Systems and Strategies, Schloss Laxenburg, Austria.
Bhalla, A.S. (1990) Rural-urban disparities in India and China. World Development 18.8, 1097- 110. Bideleux, R. (1985) Communism and development. Methuen, London. Bodrova, V. and R. Anker (1985) Working women in socialist countries: the fertility connection.
Bornstein, M. (1985) The Soviet centrally planning economy. In M. Bornstein (ed.), Comparative
Chan, K.W. (1987) Further information about China’s urban population statistics: old and new.
- (1988a) Rural-urban migration in China, 1950-82: estimates and analysis. Urban Geography
- (1988b) Urbanization in China, 1949-82: policies, patterns and determinants. Unpublished PhD dissertation, University of Toronto. - (1989) Determinants of urbanization in post-1949: empirical investigations. Paper presented
at the International Conference on Internal Migration and Urbanization in China, Beijing, China, 6-8 December 1989. - and K.Y. Tsui (1992) China s ‘agricultural’ and ‘non-agricultural’ population statistics:
definitions, findings, and comparison. Department of Geography and Geology Occasional Paper no. 1 , University of Hong Kong. - and X. Xu (1985) Urban population growth and urbanization in China since 1949:
reconstructing a baseline. China Quarterly 104, 583-613. Chen, K. (1982) A tentative inquiry into the scissors gap in the rate of exchange between industrial
and agricultural products. Social Sciences in China 3.2, 55-74.
Development Review 10.4, 613-45.
International Labour Office, Geneva.
economic systems, Richard D. Irwin, Homewood.
China Quarterly 109, 104-9.
9.11, 53-84.
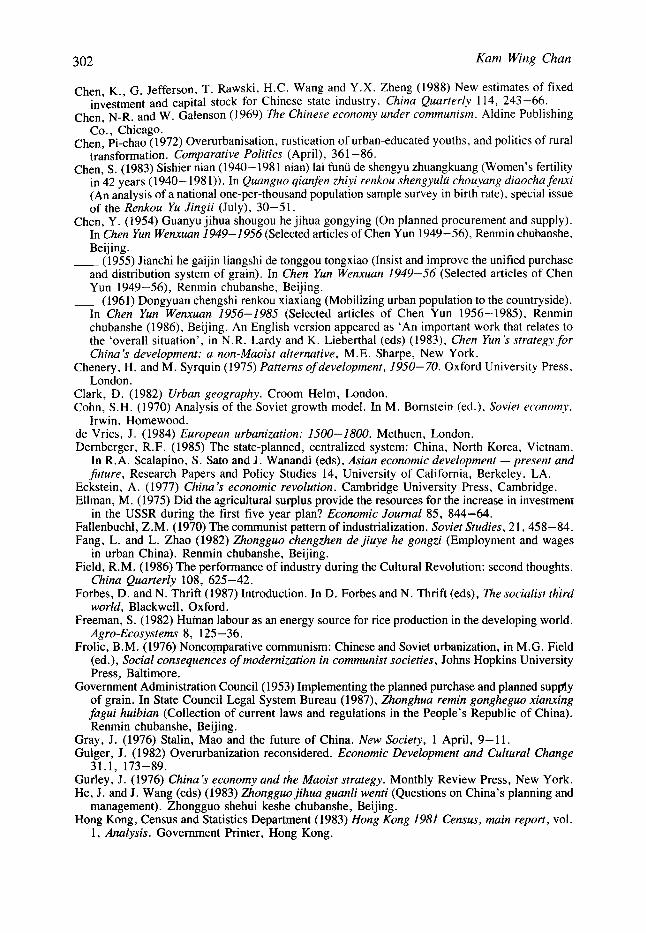
302 Kam Wing Chan
Chen, K., G. Jefferson, T. Rawski, H.C. Wang and Y.X. Zheng (1988) New estimates of fixed investment and capital stock for Chinese state industry. China Quarter/y 114, 243-66.
Chen, N-R. and W. Galenson (1969) 7he Chinese economy under communism. Aldine Publishing Co., Chicago.
Chen, Pi-chao (1972) Overurbanisation, rustication of urban-educated youths, and politics of rural transformation. Comparative Politics (April), 361 -86.
Chen, s. (1983) Sishier nian (1940-1981 nian) lai funu de shengyu zhuangkuang (Women’s fertility in 42 years (1940- 1981)). In Quanguo qianfen zhiyi renkou shengyulii chouvang diaocha fenxi (An analysis of a national one-per-thousand population sample survey in birth rate), special issue of the Renkou Yu Jingii (July), 30-51.
Chen, Y. (1954) Guanyu jihua shougou he jihua gongying (On planned procurement and supply). In Chen Yun Wenxuan 1949-1956 (Selected articles of Chen Yun 1949-56), Renmin chubanshe, Beijing. - (1955) Jianchi he gaijin liangshi de tonggou tongxiao (Insist and improve the unified purchase
and distribution system of grain). In Chen Yun Wenxuan 1949-56 (Selected articles of Chen Yun 1949-56), Renmin chubanshe, Beijing. - (1961) Dongyuan chengshi renkou xiaxiang (Mobilizing urban population to the countryside).
In Chen Yun Wenxuan 1956-1985 (Selected articles of Chen Yun 1956-1985). Renmin chubanshe (1986), Beijing. An English version appeared as ‘An important work that relates to the ‘overall situation’, in N.R. Lardy and K. Lieberthal (eds) (1983). Chen Yun ’s strategy for China s development: a non-Maoist alternative, M.E. Sharpe, New York.
Chenery, H. and M. Syrquin (1975) Patterns of development, 1950-70. Oxford University Press, London.
Clark, D. (1982) Urban geography. Croom Helm, London. Cohn, S.H. (1970) Analysis of the Soviet growth model. In M. Bornstein (ed.). Soviet economy.
de Vries, J. (1984) European urbanization: 1500-1800. Methuen, London. Dernberger, R.F. (1985) The state-planned, centralized system: China, North Korea, Vietnam.
In R.A. Scalapino, S. Sat0 and J . Wanandi (eds), Asian economic development - present and fUture, Research Papers and Policy Studies 14, University of California, Berkeley. LA.
Eckstein, A. (1977) China s economic revolution. Cambridge University Press, Cambridge. Ellman, M. (1975) Did the agricultural surplus provide the resources for the increase in investment
Fallenbuchl, Z.M. (1970) The communist pattern of industrialization. Soviet Studies, 2 1 , 458-84. Fang, L. and L. Zhao (1982) Zhongguo chengzhen de jiuye he gongzi (Employment and wages
in urban China). Renmin chubanshe, Beijing. Field, R.M. (1986) The performance of industry during the Cultural Revolution: second thoughts.
China Quarterly 108, 625-42. Forbes, D. and N. Thrift (1987) Introduction. In D. Forbes and N. Thrift (eds), 7he socialist third
world, Blackwell, Oxford. Freeman, S. (1982) Human labour as an energy source for rice production in the developing world.
Agro-Ecosystems 8, 125-36. Frolic, B.M. (1976) Noncomparative communism: Chinese and Soviet urbanization, in M.G. Field
(ed.), Social consequences of modernization in communist societies, Johns Hopkins University Press, Baltimore.
Government Administration Council (1953) Implementing the planned purchase and planned supply of grain. In State Council Legal System Bureau (1987). Zhonghua remin gongheguo xianxing fagui huibiun (Collection of current laws and regulations in the People’s Republic of China), Renmin chubanshe, Beijing.
Irwin, Homewood.
in the USSR during the first five year plan? Economic Journal 85, 844-64.
Gray, J. (1976) Stalin, Mao and the future of China. New Society, 1 April, 9-11. Gulger, J. (1982) Overurbanization reconsidered. Economic Development and Cultural Change
Gurley, J. (1976) China’s economy and the Maoist strategy. Monthly Review Press, New York. He, J. and J. Wang (eds) (1983) Zhongguojihua guanli wenti (Questions on China’s planning and
Hong Kong, Census and Statistics Department (1983) Hong Kong 1981 Census, main report, vol.
31.1, 173-89.
management). Zhongguo shehui keshe chubanshe, Beijing.
1 , Analysis. Government Printer, Hong Kong.
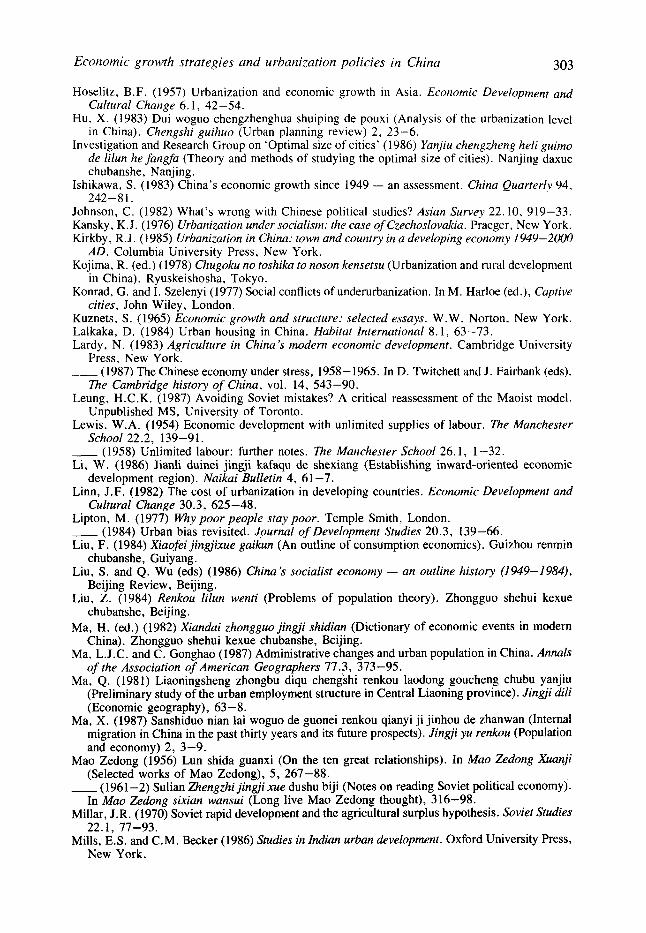
Economic growth strategies and urbanization policies in China 303
Hoselitz, B.F. (1957) Urbanization and economic growth in Asia. Economic Development and Cultural Change 6.1, 42-54.
Hu. X. (1983) Dui woguo chengzhenghua shuiping de pouxi (Analysis of the urbanization level in China). Chengshi guihuo (Urban planning review) 2, 23-6.
Investigation and Research Group on ‘Optimal size of cities’ (1986) Yanjiu chengzheng heli guimo de lilun he fangfa (Theory and methods of studying the optimal size of cities). Nanjing daxue chubanshe, Nanj ing .
Ishikawa, S. (1983) China’s economic growth since 1949 - an assessment. China Quarter/! 94,
Johnson, C. (1982) What’s wrong with Chinese political studies? Asian Survey 22.10, 919-33. Kansky, K.J. (1976) Urbanization under socialism: the case of Czechoslovakia. Praeger, New York. Kirkby, R.J. (1985) Urbanization in China: town and country in a developing economy 1949-2000
Kojima, R. (ed.) (1978) Chugoku no toshika to noson kensetsu (Urbanization and rural development
Konrad, G. and I . Szelenyi (1977) Social conflicts of underurbanization. In M. Harloe (ed.), Captive
Kuznets, S . (1965) Economic growth and structure: selected essays. W.W. Norton, New York. Lalkaka, D. (1984) Urban housing in China. Habitat International 8 .1 , 63-73. Lardy , N. (1983) Agriculture in China s modern economic development. Cambridge University
__ (1987) The Chinese economy under stress, 1958-1965. In D. Twitchett and J . Fairbank (eds),
Leung, H.C.K. (1987) Avoiding Soviet mistakes? A critical reassessment of the Maoist model.
Lewis. W.A. (1954) Economic development with unlimited supplies of labour. f i e Manchester
__ (1958) Unlimited labour: further notes. The Manchester School 26.1, 1-32. Li, W. (1986) Jianli duinei jingji kafaqu de shexiang (Establishing inward-oriented economic
Linn, J.F. (1982) The cost of urbanization in developing countries. Economic Development and
Lipton, M. (1977) Why poor people stay poor. Temple Smith, London. __ (1984) Urban bias revisited. Journal of Development Studies 20.3, 139-66. Liu, F. (1984) Xiaofei jingjixue gaikun (An outline of consumption economics). Guizhou renmin
chubanshe, Guiyang. Liu, S. and Q . Wu (eds) (1986) China’s socialist economy - an outline history (1949-1984),
Beijing Review, Beijing. Liu, Z. (1984) Renkou lilun wenti (Problems of population theory). Zhongguo shehui kexue
chubanshe, Beijing. Ma, H. (ed.) (1982) Xiandai zhongguo jingji shidian (Dictionary of economic events in modern
China). Zhongguo shehui kexue chubanshe, Beijing. Ma, L.J.C. and C. Gonghao (1987) Administrative changes and urban population in China. Annals
of the Association of American Geographers 77.3, 373 -95. Ma, Q. (1981) Liaoningsheng zhongbu diqu chengshi renkou laodong goucheng chubu yanjiu
(Preliminary study of the urban employment structure in Central Liaoning province). Jingji dili (Economic geography), 63-8.
Ma, X. (1987) Sanshiduo nian lai woguo de guonei renkou qianyi ji jinhou de zhanwan (Internal migration in China in the past thirty years and its future prospects). Jingji yu renkou (Population and economy) 2, 3-9.
Mao Zedong (1956) Lun shida guanxi (On the ten great relationships). In Ma0 Zedong Xuanji (Selected works of Mao Zedong), 5, 267-88.
__ (1961 -2) Sulian Zhengzhi jingji xue dushu biji (Notes on reading Soviet political economy). In Ma0 Zedong sixian wansui (Long live Mao Zedong thought), 316-98.
Millar, J.R. (1970) Soviet rapid development and the agricultural surplus hypothesis. Soviet Studies 22.1, 77-93.
Mills, E.S. and C.M. Baker (1986) Studies in Indian urban development. Oxford University Press, New York.
242-8 1.
AD. Columbia University Press, New York.
in China). Ryuskeishosha, Tokyo.
cities, John Wiley, London.
Press, New York.
The Cambridge history of China, vol. 14, 543-90.
Unpublished MS, University of Toronto.
School 22.2, 139-91.
development region). Naikai Bulletin 4, 61 -7.
Cultural Change 30.3, 625-48.
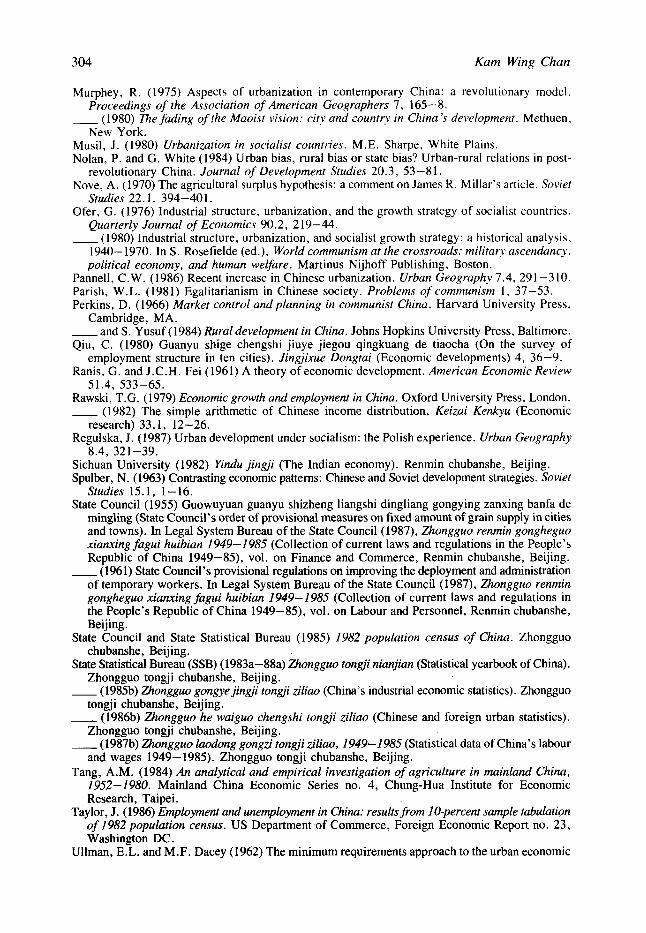
304 Kam Wing Chan
Murphey, R. (1975) Aspects of urbanization in contemporary China: a revolutionary model.
- (1980) irhe fading of the Maoist vision: city and country in China’s development. Methuen.
Musil, J. (1980) Urbanization in socialist countries. M.E. Sharpe, White Plains. Nolan, P. and G. White (1984) Urban bias, rural bias or state bias? Urban-rural relations in post-
revolutionary China. Journal of Development Studies 20.3, 53-81. Nove, A. (1970) The agricultural surplus hypothesis: a comment on James R. Millar’s article. Soviet
Studies 22. I , 394-401. Ofer. G. (1976) lndustrial structure, urbanization, and the growth strategy of socialist countries.
Quarterly Journal of Economics 90.2, 2 19-44. - (1980) Industrial structure, urbanization, and socialist growth strategy: a historical analysis,
1940- 1970. In S . Rosefielde (ed.), World communism at the crossroads: military ascendancy, political economy, and human welfare. Martinus Nijhoff Publishing, Boston.
Pannell, C.W. (1986) Recent increase in Chinese urbanization. Urban Geography 7.4. 291 -310. Parish, W.L. (1981) Egalitarianism in Chinese society. Problems of communism 1. 37-53. Perkins, D. (1966) Market control and planning in communist Chino. Harvard University Press,
__and S . Yusuf (1984) Rural development in China. Johns Hopkins University Press, Baltimore. Qiu, C. (1980) Guanyu shige chengshi jiuye jiegou qingkuang de tiaocha (On the survey of
employment structure in ten cities). Jingiirue Dongtai (Economic developments) 4, 36-9. Ranis, G. and J.C.H. Fei (1961) A theory of economic development. American Economic Review
Rawski, T.G. (1979) Economic growth and employment in China. Oxford University Press, London. - (1982) The simple arithmetic of Chinese income distribution. Keizai Kenkyu (Economic
Regulska, J. (1987) Urban development under socialism: the Polish experience. Urban Geography
Sichuan University (1982) Yindu jingji (The Indian economy). Renmin chubanshe, Beijing. Spulber, N. (1963) Contrasting economic patterns: Chinese and Soviet development strategies. Soviet
Studies 15.1, 1-16. State Council (1955) Guowuyuan guanyu shizheng liangshi dingliang gongying zanxing banfa de
mingling (State Council’s order of provisional measures on fixed amount of grain supply in cities and towns). In Legal System Bureau of the State Council (1987), Zhongguo renmin gongheguo xianxing fagui huibian 1949-1 985 (Collection of current laws and regulations in the People’s Republic of China 1949-85), vol. on Finance and Commerce, Renmin chubanshe, Beijing. - (1961) State Council’s provisional regulations on improving the deployment and administration
of temporary workers. In Legal System Bureau of the State Council (1987), Zhongguo renmin gongheguo xianxing fagui huibian 1949-1985 (Collection of current laws and regulations in the People’s Republic of China 1949-85), vol. on Labour and Personnel, Renmin chubanshe, Beijing.
State Council and State Statistical Bureau (1985) 1982 population census of China. Zhongguo chubanshe, Beij ing .
State Statistical Bureau (SSB) (1983a-88a) Zhongguo tongji nianjian (Statistical yearbook of China). Zhongguo tongji chubanshe, Beijing. - (1985b) Zhongguo gongye jingii tongji ziliao (China’s industrial economic statistics). Zhongguo
tongji chubanshe, Beijing. __ (1986b) Zhongguo he waiguo chengshi tongji ziliao (Chinese and foreign urban statistics).
Zhongguo tongji chubanshe, Beijing. __ (1987b) Zhongguo laodong gongzi tongii ziliao, 1949-1985 (Statistical data of China’s labour
and wages 1949-1985). Zhongguo tongji chubanshe, Beijing. Tang, A.M. (1984) An analytical and empirical investigation of agriculture in mainland China,
1952-1980. Mainland China Economic Series no. 4, Chung-Hua Institute for Economic Research, Taipei.
Taylor, J. (1986) Employment and unemployment in China: resultsfrom 10-percent sample tabulation of 1982 population census. US Department of Commerce, Foreign Economic Report no. 23, Washington DC.
Ullman, E.L. and M.F. Dacey (1962) The minimum requirements approach to the urban economic
Proceedings of the Association of American Geographers 7. 165-8.
New York.
Cambridge, MA.
5 1.4, 533-65.
research) 33.1, 12-26.
8.4, 321-39.
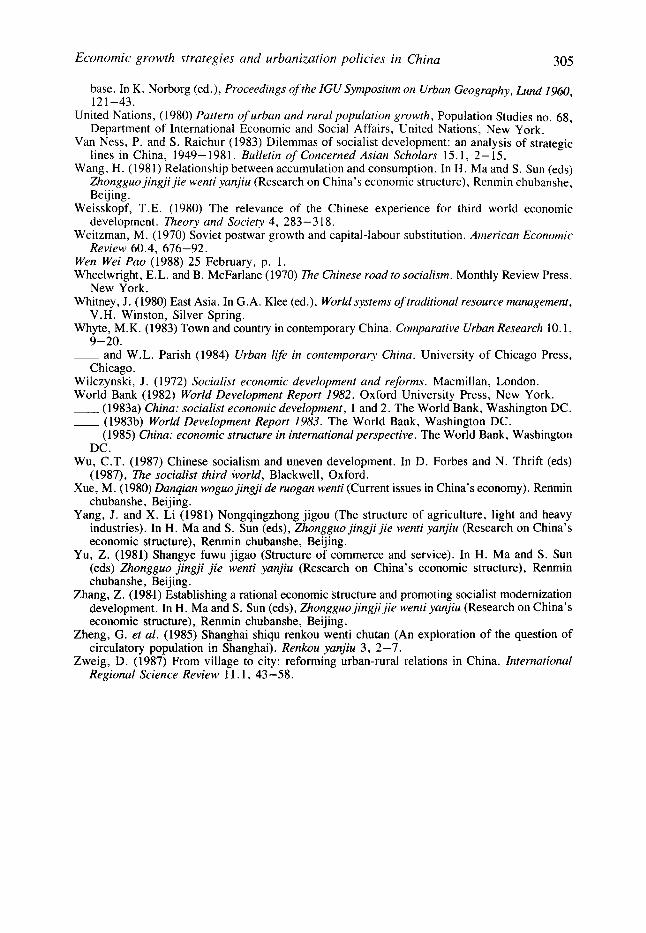
Economic growth strategies and urbanization policies in China 305
base. In K. Norborg (ed.), Proceedings of the IGUSymposium on Urban Geography, Lurid 1960, 12 1-43.
United Nations, (1980) Pattern of urban and rural popularion growth, Population Studies no. 68, Department of International Economic and Social Affairs, United Nations, New Yo&.
Van Ness, P. and S. Raichur (1983) Dilemmas of socialist development: an analysis of strategic lines in China, 1949-1981. Bulletin of Concerned Asian Scholars 15.1, 2-15.
Wang, H. (1981) Relationship between accumulation and consumption. In H. Ma and S. Sun (eds) Zhongguojingji jie wenti yanjiu (Research on China’s economic structure), Renmin chubanshe, Beijing.
Weisskopf, T.E. (1980) The relevance of the Chinese experience for third world economic development. Theory and Society 4, 283-318.
Weitzman, M. (1970) Soviet postwar growth and capital-labour substitution. American Economic Review 60.4, 676-92.
Wen Wei Pa0 (1988) 25 February, p. 1 . Wheelwright, E.L. and B. McFarlane (1970) 77w Chinese road to socialism. Monthly Review Press,
Whitney, J. (1980) East Asia. In G.A. Klee (ed.), World systems of traditional resource management,
Whyte, M.K. (1983) Town and country in contemporary China. Comparative Urban Research 10.1,
~ and W.L. Parish (1984) Urban life in conremporary China. University of Chicago Press,
Wilczynski, J . (1972) Socialist economic development and reforms. Macmillan, London. World Bank (1982) World Development Report 1982. Oxford University Press, New York. - (1983a) China: socialist economic development, 1 and 2. The World Bank, Washington DC. ~ (1983b) World Development Report 1983. The World Bank, Washington DC. ~ (1985) China: economic structure in international perspective. The World Bank, Washington
DC . Wu, C.T. (1987) Chinese socialism and uneven development. In D. Forbes and N. Thrift (eds)
(1987), Zhe socialist third world, Blackwell, Oxford. Xue, M. (1980) Danqian woguo jingji de ruogan wenti (Current issues in China’s economy). Renmin
chubanshe, Beijing. Yang, J. and X. Li (1981) Nongqingzhong jigou (The structure of agriculture, light and heavy
industries). In H. Ma and S. Sun (eds), Zhongguojingji jie wenti yanjiu (Research on China’s economic structure), Renmin chubanshe, Beijing.
Yu, Z. (1981) Shangye fuwu jigao (Structure of commerce and service). In H. Ma and S. Sun (eds) Zhongguo jingji jie wenti yanjiu (Research on China’s economic structure), Renmin chubanshe, Beijing.
Zhang, Z. (1981) Establishing a rational economic structure and promoting socialist modernization development. In H. Ma and S. Sun (eds), Zhongguo jingji jie wenti yanjiu (Research on China’s economic structure), Renmin chubanshe, Beijing.
Zheng, G. et al. (1985) Shanghai shiqu renkou wenti chutan (An exploration of the question of circulatory population in Shanghai). Renkou yanjiu 3, 2-7.
Zweig, D. (1987) From village to city: reforming urban-rural relations in China. International Regional Science Review 1 1. I , 43-58.
New York.
V.H. Winston, Silver Spring.
9-20.
Chicago.