economic growth and poverty reduction in indonesia before and
TRANSCRIPT

WORKING PAPER
Economic Growth and Poverty Reduction in Indonesia Before and After the Asian Financial Crisis
Asep Suryahadi
Gracia Hadiwidjaja
Sudarno Sumarto
JUNE 2012

WORKING PAPER
Economic Growth and Poverty Reduction in Indonesia Before and After the Asian Financial
Crisis
Asep Suryahadi
Gracia Hadiwidjaja
Sudarno Sumarto
Editor
Stephen Girschik
The SMERU Research Institute
Jakarta
June 2012

The findings, views, and interpretations published in this report are those of the authors and should not be attributed to any of the agencies providing financial support to The SMERU Research Institute. For further information on SMERU’s publications, phone: 62-21-31936336; fax: 62-21-31930850; e-mail: [email protected]; or visit www.smeru.or.id.
Suryahadi, Asep Economic Growth and Poverty Reduction in Indonesia Before and After the Asian Financial Crisis / Asep Suryahadi, Gracia
Hadiwidjaja and Sudarno Sumarto. -- Jakarta: SMERU Research Institute, 2012. iii, 20 p. ; 30 cm. -- (SMERU Working Paper, June 2012) ISBN 978-979-3872-96-4
1. Poverty I. SMERU 2. Sectoral Growth II. Suryahadi, Asep 3. Asian financial crisis III. Gracia Hadiwidjaja
362.5/DDC 22

The SMERU Research Institute i
ABSTRACT
Economic Growth and Poverty Reduction in Indonesia Before and After the Asian Financial Crisis
Asep Suryahadi, Gracia Hadiwidjaja, and Sudarno Sumarto∗
This paper assesses the relationship between economic growth and poverty reduction in Indonesia before and after the Asian financial crisis (AFC). Indonesia has a significantly slower poverty reduction post-AFC compared to the pre-AFC era. The trend in the growth elasticity of poverty indicates that the power of each% of economic growth to reduce poverty did not change greatly between the pre and post-AFC time periods. During both these periods, the growth of services sector is the largest contributor to poverty reduction in both rural and urban areas. Post-AFC, industrial sector growth has become largely irrelevant for poverty reduction even though this sector makes up the second largest share of GDP. Meanwhile, the importance of agricultural sector growth for poverty reduction is confined only to rural areas. Finally, the findings suggest that there is a need to promote economic growth in all sectors as the current rates are insufficient to recover to the rates of poverty reduction in the pre-AFC era. Keywords: poverty, sectoral growth, Asian financial crisis, growth elasticity
∗We would like to thank seminar participants at the SMERU Research Institute, Jakarta, for their useful comments and suggestions. We are also grateful to Novita Maizir for assistance in compiling the figures.

The SMERU Research Institute ii
TABLE OF CONTENTS
ABSTRACT i
TABLE OF CONTENTS ii
LIST OF FIGURES iii
I. INTRODUCTION 1
II. SECTORAL STRUCTURE OF THE ECONOMY 2 2.1 Output 2 2.2 Employment 3 2.3 Economic Growth 4
III. POVERTY TRENDS AND PROFILES 6 3.1 Long Term Trends in Poverty 6 3.2 Urban and Rural Poverty 7 3.3 Sectoral Profile of Poverty 8
IV. ECONOMIC GROWTH AND POVERTY REDUCTION 9 4.1 The Growth-Poverty Model 9 4.2 Growth Elasticity of Poverty 11 4.3 Sectoral Contribution to Poverty Reduction 13
V. CONCLUSION AND IMPLICATIONS 15
LIST OF REFERENCES 17
APPENDICES 19

The SMERU Research Institute iii
LIST OF FIGURES Figure 1. National poverty rates, 1976–2010 1
Figure 2. Sectoral GDP share, 1971–2010 (%) 3
Figure 3. Sectoral employment share, 1971–2010 (%) 4
Figure 4. Sectoral economic growth, 1984–2008 (% per year) 5
Figure 5. Urban and rural poverty rate and share of the poor, 1996–2010 (%) 7
Figure 6. Sectoral share of the poor, 1999–2008 (%) 8
Figure 7. Growth elasticity of rural poverty 12
Figure 8. Growth elasticity of urban poverty 13
Figure 9. Sectoral contribution to rural poverty reduction (%) 14
Figure 10. Sectoral contribution to urban poverty reduction (%) 14

The SMERU Research Institute 1
I. INTRODUCTION
In the late 1990s, the Asian economy was hit by one of the worst financial crises in modern history. The crisis, known widely as the Asian financial crisis (AFC) of 1997–1998, had severely impacted on a number of Asian countries and created long lasting effects in those countries. In Indonesia, the AFC first started with the fall of the value of its currency, the rupiah, in mid-1997. Subsequently, the rupiah was devalued by more than 85% within one year. As the crisis worsened, in 1998 the economy contracted by 13.7%, the inflation rate rose to 78%, and in particular food prices escalated by as much as 118%. The economic crisis in Indonesia developed further into a major political upheaval. Protests and mass riots against the incumbent New Order regime exploded in Jakarta and several other cities, which culminated in the resignation of the then President Soeharto in May 1998. Among the most prominent consequences of the AFC in Indonesia was the abrupt escalation of the poverty rate, which increased from 17% in 1996 to 24% in 1999.1 As can be seen in Figure 1, there is a reversal in the poverty trend, which had continuously declined since the official measurement of poverty was initiated in 1976. Even though the economy has recovered relatively quickly, since then Indonesia has experienced a slower pace of poverty reduction compared to the pre-AFC period when the country experienced one of the most rapid reductions in poverty in the world.
Figure 1. National poverty rates, 1976–2010
Source: BPS (various years).
Note: In 1998 BPS revised the method of setting the poverty line. The new method resulted in an increase in the poverty threshold, and the poverty rate in 1996 was adjusted accordingly from 11.3% to 17.3%.
1In this paper, poverty is defined as monetary poverty and measured using the current consumption deficit approach. The poor are those whose per capita household consumption expenditure is below the poverty line.

The SMERU Research Institute 2
During the pre-AFC period, the poverty rate had fallen from around 40.1% in 1976 to 11.3% in 1996, bringing over 30 million people out of poverty despite an increase of 65 million people in the total population (BPS, 2002). This is an average reduction in the poverty rate by around 1.44 percentage points per year. During the post-AFC period, the poverty rate declined from 18.2% in 2002 to 13.3% in 2010, which constitutes an average reduction in the poverty rate by around 0.61 percentage points per year2. This simple calculation clearly shows that the pace of poverty reduction during the post crisis period is much slower than its pace during the pre-crisis period. One prominent hypothesis that has been put forward to explain the slower poverty reduction during the post-AFC era is that Indonesia has experienced a declining growth elasticity of poverty. This refers to the reduction in the poverty rate resulting from 1% economic growth. It has been argued that the drivers of economic growth in Indonesia during the post-AFC era are capital intensive sectors such as mining and telecommunication. This paper aims to assess the empirical evidence of this hypothesis. The analyses are based on a growth-poverty framework, focusing on the levels of sectoral growth as well as sectoral composition in the Indonesian economy. The remainder of this paper is structured as follows. Section two discusses the sectoral structure of the economy. Section three discusses the trends and profile of poverty. Section four evaluates the relationship between growth and poverty reduction. Finally, section five provides the conclusion and derives policy implications from the findings of this study.
II. SECTORAL STRUCTURE OF THE ECONOMY The sectoral structure of an economy can be assessed from the composition of its output or employment. In this paper, the term sector refers to the three largest aggregations of economic activity: agricultural, industrial, and service.3 In Indonesia during the last decade, the agricultural sector has continued to absorb a significant share of labor but contributes the least to the gross domestic product (GDP). Meanwhile the manufacturing sector is the second biggest contributor of GDP, yet has the smallest share of employment compared to the other two sectors. Through the rapid growth of banking and hospitality industries, the service sector now contributes the largest share to both GDP and employment.
2.1 Output In comparison to the industrial and service sectors, the role of the agricultural sector in the Indonesian economy has continuously declined since the end of the 1960s. Figure 2 shows the transformation of output contribution among sectors in terms of GDP between 1971 and 2010. The share of agricultural output has dropped significantly from 46% in 1971 to 25% in 1980, a decline of 21 percentage points in just nine years. Since then the agricultural output contribution has continued to decline to 22% in 1990, 16% in 2000, and stabilized to decrease to only 15% by 2010.
2The 1999 poverty rate data is left out of the calculation as 1999 is not considered to be a normal year due to the peak of the crisis situation.
3The agricultural sector includes food crops, estate crops, animal husbandry, fisheries, and forestry subsectors; the industrial sector includes mining and quarrying and manufacturing subsectors; while the service sector includes electricity, gas and water supplies, construction, trade, hotel and restaurant, transportation and communication, finance, building rental and business, and other service subsectors.

The SMERU Research Institute 3
Figure 2. Sectoral GDP share, 1971–2010 (%)
Source: BPS (various years).
In the early stages of its development, a clear trend of industrialization was observed in the Indonesian economy. Between 1971 and 1980, the share of industrial output more than doubled from 20 to 43%. However, this acceleration soon leveled off and gradually declined back. By 1990 the share of industrial output had fallen to 39%, stabilized at 40% in 2000, and then declined once again to reach 36% in 2010. The deterioration in the last decade can be attributed to the unfavorable business climate for labor intensive manufacturing industries as new labor market regulations introduced after the AFC created higher labor costs (Bird and Manning, 2008; Manning, 2003). The service sectors, on the other hand, have become the leading GDP contributor for decades. After declining from 35% to 32% between 1971 and 1980, the share of the service sector’s output as part of the total GDP has steadily increased reaching 39% in 1990, increasing to 45% in 2000, and continuing to increase to reach 49% by 2010. This means that nowadays around one half of Indonesia’s total output is produced by the service sector.
2.2 Employment Sectoral employment trends more or less mimic the trend in output shares. Figure 3 shows the sectoral structure of employment shares of agriculture, industry, and service sectors between 1971 and 2010. Along with its declining share in GDP, the share of the agricultural sector in employment has also continuously declined, from 67% in 1971 to 41% in 2010. However, the pace of reduction in the employment share of the agricultural sector is much slower than the pace of reduction in its GDP share. As a result, the ratio between the GDP share and the employment share of the agricultural sector has declined from 0.67 in 1971 to only 0.37 in 2010.

The SMERU Research Institute 4
Figure 3. Sectoral employment share, 1971–2010 (%)
Source: BPS (various years).
Meanwhile, the industrial sector increased its employment share in the economy from 9% in 1971 to 17% in 1990. The GDP share of the industrial sector between 1980 and 1990 actually declined, but its employment share continued to increase significantly. This reflects the change in Indonesia’s industrial development strategy in the mid-1980s from capital intensive import substitution to labor intensive export orientation. However, after the Asian financial crisis in 1997/98, the employment share of the industrial sector declined again to 14% in 2000. During the post AFC period, this share stagnated and remained at 14% throughout 2010. In line with its increasing share in the GDP, the share of the service sector in total employment also continuously increased. The share increased significantly from 24 % to 32% during the early development period of 1971–1980. However, when manufacturing employment expanded rapidly during the period of 1980–1990, the employment share of the service sector remained stable and reached 33% in 1990. After the AFC, the share of the service sector in employment expanded rapidly again and reached 42% in 2000. After this period, it still continued to increase but at a considerably slower pace and only reached 45% in 2010.
2.3 Economic Growth
The importance of a sector in an economy is not only related to its share of GDP and employment, but also its role in driving economic growth. Many studies have emphasized the importance of economic growth as the driving force of poverty reduction. In Indonesia, scholars have also attributed the rapid poverty reduction during the pre-AFC period primarily to the strong economic growth at the time (Suryahadi et al., 2011; Timmer, 2004). Prior to the crisis, the Indonesian economy grew remarkably and Indonesia became one of the fastest growing economies in world. In 1969, a five-year development plan was first introduced and under the framework of that plan, Indonesia rose from being one of the poorest countries in the world with per capita income of only US$50 in 1967 (Agrawal, 1996).

The SMERU Research Institute 5
Using constant 1991 US$ values, Hill (1996) estimates that the real GDP per capita increased from $190 in 1965 to $610 in 1991, which constitutes an annual growth of 4.6%. In the late 1990s, however, the AFC brought this stunning growth to a halt. Figure 4 shows sectoral as well as total economic growth during the pre-AFC period (1984–1996), during the AFC itself (1996–1999), and the post-AFC period (1999–2008). Before the onset of the AFC, the Indonesian economy grew on average by 6.83% annually between 1984 and 1996. This was driven mostly by growth in the industrial sector, which grew by 7.25% annually, and the services sector, which grew by 7.18% annually. Meanwhile, the agricultural sector grew slower but still respectable at 4.65% annually.
Figure 4. Sectoral economic growth, 1984–2008 (% per year)
Source: Authors’ calculation based on BPS (various years).
During the AFC period, on the other hand, the agricultural sector was the only sector that did not suffer from a contraction. Between 1996 and 1999, the agricultural sector still managed to record a positive average low growth of 0.15% annually. Meanwhile, the industrial sector suffered from a contraction of -2.97% annually and the services sector suffered the most by contracting -4.63% annually. As a result of this, the Indonesian economy suffered from an average contraction of -3.12% annually during the same period. After the AFC, the services sector returned to its high growth performance and recorded the highest sectoral growth. Meanwhile, the industrial sector lost its role as one of the drivers of economic growth in Indonesia. During the 1999–2008 period the Indonesian economy grew on average by 5.12% annually. This growth was driven mostly by the growth in the service sector, which grew by 6.51% annually. Meanwhile, the industrial sector only grew by 3.91% annually, which is only slightly higher than agricultural sector growth of 3.34% annually.

The SMERU Research Institute 6
III. POVERTY TRENDS AND PROFILES The rapid economic growth that occurred before the AFC resulted in massive poverty reduction. Similarly, other welfare indicators—such as the infant mortality rate, school enrollment rates, and life expectancy at birth—also improved. The AFC that afflicted Indonesia during 1997–1998, however, reversed these improvements in social indicators, which became particularly apparent in a large re-increase in the poverty rate in 1999. After the AFC, the poverty rate resumed its downward trend but the pace was much slower when compared to the pre-AFC period.
3.1 Long Term Trends in Poverty The long term poverty trend in Indonesia is depicted in Figure 1. These poverty rates were calculated by Statistics Indonesia (BPS or Badan Pusat Statistik) using data collected through the National Socioeconomic Survey (Susenas). The BPS used poverty lines that were estimated based on the Food Energy Intake (FIE) method, which is calculated using an expenditure of 2,100 calories worth of food per capita per day, plus some essential non-food allowances. Prior to 2002 the poverty rate was calculated every three years, but starting in 2002 the BPS began calculating the poverty rate every year. Figure 1 clearly shows a downward trend in poverty in Indonesia since data first became available in 1976. However, there is an apparent structural break in the trend around the time of the AFC in 1997/98. The pace of poverty reduction in the post-AFC period is significantly slower compared to the pace during the pre-crisis period. In the pre-AFC, the poverty rate decreased from 40.1% in 1976 to 11.3% in 1996, a reduction of 28.8 percentage points in 20 years or an average of 1.44 percentage point reduction in the poverty rate per year. Leaving aside the volatile period during the AFC, the poverty rate declined from 18.2% in 2002 to 13.3% in 2010, a reduction of 4.9 percentage points in eight years or an average 0.61 percentage point reduction in poverty rate per year. This means that the pace of poverty reduction in the post-AFC period is only 42.5% of its pace during the pre-AFC period. During the whole period from 1976 to 2010, there were only two occasions when the poverty rate increased. The first one was in 1999 due to the AFC, when the poverty rate increased from 17.3% in 1996 (based on the new standard) to 23.4% in 1999. A combination of loss or declining income and hyper-inflation pushed many of the near poor to fall below the poverty line. The second increase in poverty occurred in 2006 due to a government policy increasing the domestic price of fuel by an average of 125% in October 2005 combined with a rice price hike. In Indonesia the price of fuels are fixed by the government with the gap between the international oil price and the domestic retail price being covered by a government subsidy. When the international oil price increased substantially in 2005, the pressure on the government budget became unbearable, forcing the government to reduce the subsidy and thereby increase the domestic fuel price. The subsidy reform measures yielded over US$10 billion in annualized budgetary savings, a portion of which was allocated to renewed programs in health, education, infrastructure as well as an unconditional cash transfer (UCT) scheme. Prior to the October price hike, the

The SMERU Research Institute 7
government had already allocated Rp5 trillion to education, Rp3 trillion to health, and Rp3 trillion to infrastructure. From October 2005 to October 2006, the Government of Indonesia (GOI) distributed quarterly installments of Rp300,000 (about US$30) to over 19 million households, effectively embarking upon the world's largest UCT program. Despite these programs, the ensuing 18% inflation in 2006 still pushed the poverty rate up, increasing it from 15.9% in 2005 to 17.8% in 2006. In addition to this, the ban on imports and a subsequent increase in the domestic price of rice were identified by several authors as the central cause of the increase in the poverty rate between 2005 and 2006 (McCulloch, 2008; Warr, 2011; World Bank, 2006). Despite the introduction of the UCT and an expansion of Raskin benefits around the same time, near poor households were unable to cope with rising price of their single most important consumption good.
3.2 Urban and Rural Poverty The face of poverty in Indonesia is still dominated by rural poverty despite the fact that around one half of the population resides in urban areas nowadays. Figure 5 disaggregates the poverty rates and poor population by rural and urban areas. The figure clearly shows that the poverty rate in rural areas is always substantially higher than in urban areas. The difference in poverty rates between rural and urban areas is always more than 6 percentage points, except in 1998 during the AFC which hit urban areas harder than rural areas (see Wetterberg, Sumarto, and Pritchett 1999). In terms of the share of poor population, Figure 5 shows that around 65% of the poor live in rural areas. This implies that the numbers of the poor population living in rural areas is almost double that of those living in urban areas. However, there is an indication of the urbanization of poverty over time. Although fluctuating slightly, over a longer time period the share of the poor residing in urban areas has increased from 27.7% in 1996 to 35.8% in 2010.
Figure 5. Urban and rural poverty rate and share of the poor, 1996–2010 (%)
Source: BPS (various years).

The SMERU Research Institute 8
3.3 Sectoral Profile of Poverty As shown in the previous section, poverty in Indonesia is a phenomenon found mainly in rural areas. Hence, unsurprisingly, further disaggregation by sector indicates that poverty in Indonesia is very much related to the agricultural sector (Alisjahbana and Manning, 2006). Figure 6 shows the sectoral share of the poor from 1999 to 2008. The figure clearly shows that more than half of the poor in Indonesia have a livelihood in the agricultural sector. Meanwhile, the majority of the rest have a livelihood in the service sector.
Figure 6. Sectoral share of the poor, 1999–2008 (%)
Source: BPS (various years).
Since the 1999 figure was affected by the AFC, which hit the modern sector in urban areas hardest, the trend in sectoral share of poverty is better depicted by comparing the figures from 2002 onward. There is some indication that poverty has been shifting out of agriculture and into other sectors. In 2002, 57.69% of all the poor in Indonesia had a livelihood in the agricultural sector. By 2008, this share had declined to 52.27%. On the other hand, poverty has been rising in the service sector. In 2002, 21.20% of the poor had a livelihood in the service sector. By 2008, this share had substantially increased to 31.84%. This most likely indicates that an increasing proportion of the poor have a livelihood in the informal sector (Alisjahbana and Manning, 2006). Around two thirds of Indonesian labor force work in the informal sector.

The SMERU Research Institute 9
IV. ECONOMIC GROWTH AND POVERTY REDUCTION The previous section illustrates that prior to the AFC Indonesia experienced high economic growth while simultaneously recording rapid poverty reduction. In the post-AFC era, however, the pace of poverty reduction slowed down significantly following a slowing in economic growth. This section assesses the possible causes of this slower poverty reduction by using a growth-poverty model. To achieve this objective, the analysis utilizes results from previous studies to assess the role of different sectors in poverty reduction and estimate the sectoral contribution to poverty reduction.
4.1 The Growth-Poverty Model In the literature on economic growth and poverty, a number of studies have focused on the relationship between the sectoral composition of economic growth and poverty reduction. These studies mainly address the question of what kinds of growth are most beneficial for the poor and, hence, most effective, in reducing poverty. So far these studies have produced mixed results with some claiming that one sector is superior to the others in reducing poverty, while others claim that any growth can assist in reducing poverty. Despite different findings across these studies, there is a general consensus that the sectoral composition of economic growth is important for poverty reduction in addition to the rate of growth itself. Ravallion and Datt (1996) formulate a basic model to estimate the impact of economic growth on poverty as:
εβα ++=•
ydP (1)
where P is the level of the poverty rate and hence dP is the change in the poverty rate, •
y
represents the rate of economic growth (that is Y
dYy =•
, with Y is the level of GDP and dY
is its change), ε is the error term, while α and β are parameters. The parameter of interest
in this model is β , which shows the percentage point change in the poverty rate due to 1%
growth in GDP. In the Indonesian context, Sumarto and Suryahadi (2007) applied this model and developed it into a three-sector model—agriculture, industry, and services—by using province level panel data covering the period of 1984–1999. Suryahadi, Suryadarma, and Sumarto (2009) further developed this work by splitting the three sectors into their urban and rural locations which resulted in the following six-sector model:
dPj = α + βU
AHUj
AyUj
A•
+ βU
IHUj
IyUj
I•
+ βU
SHUj
SyUj
S•
+ βR
AHRj
AyRj
A•
+ βR
IHRj
IyRj
I•
+ βR
SHRj
SyRj
S•
+ γdS j + δPj + µm Emj + ε
(2)

The SMERU Research Institute 10
where the superscript k = A,I,S{ } indexes the agricultural, industrial, and service sector
respectively, while the subscript l = {U,R} indexes the urban and rural location, and k
ljH is
the location and sectoral share of GDP. Meanwhile, dSj is the change in population share in province j, Pj is the initial poverty rate in province j, and Emj is a vector of initial conditions in province j.
In equation (2), ifS
R
I
R
A
R
S
U
I
U
A
U ββββββ ===== , then the location and sectoral composition of economic growth does not influence its impact on poverty. This implies that equation (2) collapses to:
dPj = α + β y•
j + γdS j + δPj + µm Emj + ε (3)
which is an extended version of equation (1). Otherwise, i.e. if equation (2) holds, then the location and sectoral compositions of economic growth do matter because each sectoral growth affects poverty differently. Using this growth-poverty model, Sumarto and Suryahadi (2007) find the dominant role of agricultural sector growth in reducing poverty during the pre-AFC period. Suryahadi, Suryadarma, and Sumarto (2009) extended the data to 2002 and found that the growth of the service sector is the dominant factor in reducing poverty in both urban and rural areas, while agricultural growth remains important but only for reducing rural poverty. Similar studies have also been done in other countries. Ravallion and Datt (1996) found that in the case of India the growth of the agricultural sector has been most effective in reducing poverty. They showed that 85% of the poverty reduction in India was due to agricultural growth. Similarly, De Janvry and Sadoulet (2009) found that rapid agricultural growth in Vietnam opened pathways out of poverty for farming households. Cervantes-Godoy and Dewbre (2010) also claimed that agricultural growth is more important than industrial or service sector growth for poverty reduction since that in poor countries the majority of the poor live in rural areas and are employed in the agricultural sector. Other studies identify other sectors as being more effective in reducing poverty. The findings of Ravallion and Datt (1996) is contradicted by the findings of Quizon and Binswanger (1986, 1989) on this matter. Using a partial equilibrium multimarket model for India, they showed that the agricultural growth effects of the Green Revolution in India did not benefit the rural poor. They showed that the main way to help the poor is to raise non-agricultural incomes. Sarris (2001), however, criticized their analysis as they only considered agricultural incomes and did not take into account spillover effects into non-agricultural incomes. It is quite plausible that initial increases in agricultural incomes helped to raise non-agricultural incomes, which eventually help the poor. On the other hand, Warr and Wang (1999) found that in Taiwan it is the growth of the industrial sector which has the largest impact on poverty reduction. Different still, Warr (2006), by pooling the data from four Southeast Asian countries (Thailand, Indonesia, Malaysia, and the Philippines), found that it is the growth of the service sector which accounts for the largest reduction in poverty in these countries. Hasan and Quibria (2004) found that growth of the sector that has the highest impact on poverty reduction is country specific. For example, while agricultural growth was the most effective factor in poverty reduction in South Asia and Sub-Saharan Africa, poverty reduction

The SMERU Research Institute 11
in East Asia was driven by industrial growth and in Latin America by the growth of the service sector. In Latin America and the Caribbean, agricultural productivity gains did not translate into lower rural poverty rates because these gains were driven by capital and hence created fewer employment opportunities. However, Loayza and Raddatz (2010) argued that even though the poverty reducing sectors differ across regions, they have the same characteristic as labor-intensive sectors. Any sector, therefore, can be the driver of poverty reduction as long as it is labor-intensive. On the other hand, Dollar and Kray (2002) showed that economic growth is primarily associated with an increase in incomes, and therefore any growth will be good for the poor.
4.2 Growth Elasticity of Poverty
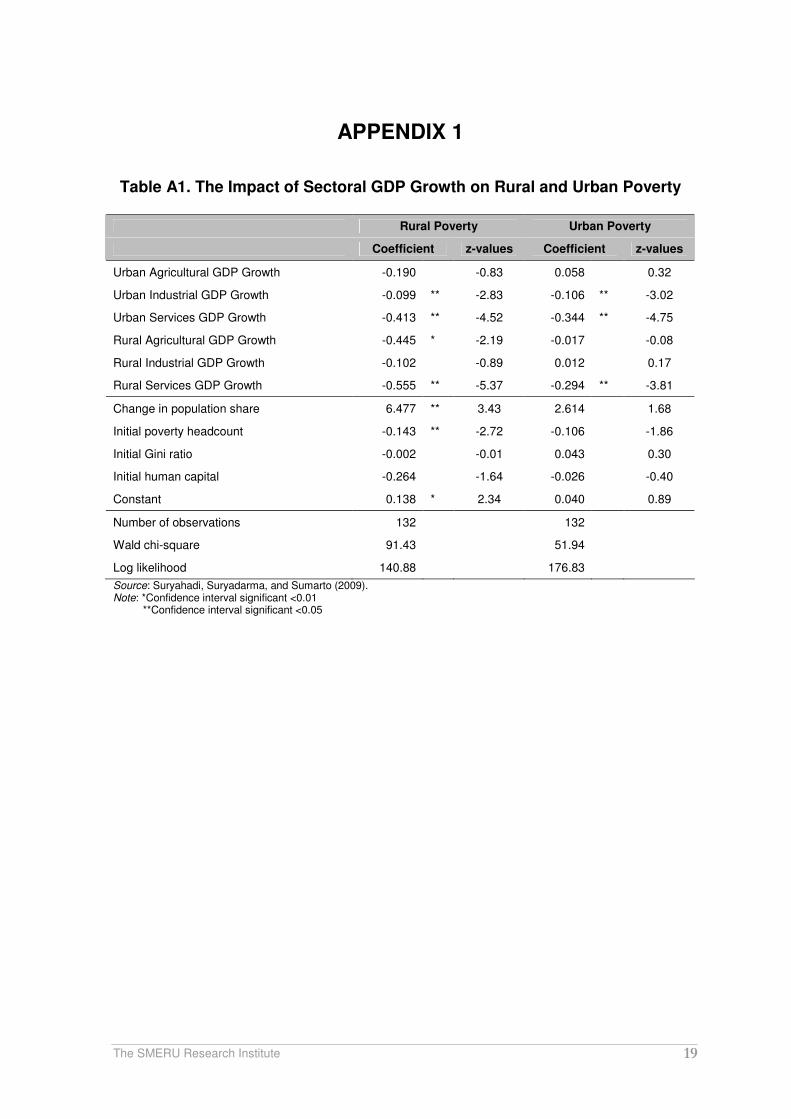
In this paper, the growth elasticity of poverty refers to a percentage point change in poverty as a result of 1% of economic growth. To calculate this elasticity requires estimation of equation (2). However, the coefficients estimated are not the growth elasticity of poverty themselves because the independent variables in equation (2) are sectoral economic growth rates weighted by their share of GDP. This means that the coefficients indicate the percentage point change in poverty rates from a sectoral economic growth equal to 1% multiplied by the inverse of the sector’s GDP share.4 Hence, the growth elasticity of poverty of a sector can be calculated as its estimated coefficient multiplied by its GDP share. Suryahadi, Suryadarma, and Sumarto (2009) estimate for equation (2) using data from 1984 to 2002 separately for rural and urban poverty. Their results are reproduced here in Appendix 1. Meanwhile, Appendix 2 shows the GDP share for each economic sector over time. The coefficients in Appendix 1 show that there are strong cross-sectoral and cross-location effects of growth on poverty. This is consistent with the findings of Suryahadi et al. (2009) on the existence of strong growth linkages and multiplier effects across sectors and locations in Indonesia. Similar phenomena were also found in Vietnam by De Janvry and Sadoulet (2009). Based on the coefficients in Appendix 1 and the GDP sectorial shares in Appendix 2, the growth elasticity of poverty for each sector is calculated by multiplying the corresponding numbers in both appendices. Implicit in this calculation is an assumption that the coefficients in Appendix 1 do not change over the period from 1984–2008. Figure 7 shows the estimated growth elasticity of poverty in rural areas.
4Suppose a sector makes up 25% of the whole economy. Then, the coefficient indicates the percentage point change in the poverty rate due to 1/0.25 or 4% of growth in that sector. Note that 4% multiplied by 25% is equal to 1%.

The SMERU Research Institute 12
Figure 7. Growth elasticity of rural poverty
Source: Authors’ calculation.
Figure 7 shows that the growth elasticity of poverty in rural areas is -0.31, implying that 1% of economic growth reduces rural poverty by 0.31 percentage points. When the period is split into before and after the AFC, surprisingly the post-AFC elasticity, which is -0.37, is actually higher than the pre-AFC elasticity, which is -0.30. This indicates that the change in GDP structure after the AFC does not reduce the power of economic growth in reducing poverty as popularly believed. In fact, it slightly increases. Miranti (2010) also finds that the growth elasticity of poverty in Indonesia was relatively stable during the period 1984–2002. Looking at the growth’s sectoral components, it turns out that growth in the urban service sector has the highest impact on rural poverty with an elasticity of -0.15, followed by the rural service and agricultural sectors, with an elasticity of -0.07 for both sectors, and the urban industrial sector with an elasticity of -0.02. Meanwhile, growth in both the urban agricultural and rural industrial sectors does not have a significant impact on rural poverty. Comparing their elasticity before and after the AFC, the figure shows that the elasticity of growth of urban sectors slightly increases, while that of rural sectors slightly decreases. Figure 8 shows the estimated growth elasticity of poverty in urban areas. Compared to rural poverty, the elasticity of total growth on urban poverty is lower at -0.22. Similar to the elasticity in rural areas, the elasticity in urban areas after the AFC, which is -0.23, is slightly higher than the elasticity before the crisis, which is -0.20.

The SMERU Research Institute 13
Figure 8. Growth elasticity of urban poverty
Source: Authors’ calculation.
Looking at the sectoral components of growth, the urban service sector growth has the highest elasticity in reducing urban poverty with -0.12, followed by the rural service sector with -0.04 and the urban industrial sector with -0.02. Comparing the elasticity before and after the AFC, the elasticity of growth of the urban sectors slightly increases and the elasticity of the rural sectors slightly decreases. The finding that service sector growth plays an important role in reducing poverty in Indonesia is similar to the experience of Latin American countries found by Hasan and Quibria (2004).
4.3 Sectoral Contribution to Poverty Reduction To calculate the contribution of each sector to total poverty reduction, the elasticity estimated in the previous section is multiplied by the actual growth of each sector and compared to the observed total poverty reduction. Figure 9 shows the sectoral contribution to poverty reduction in rural areas. The figure shows that around 55% of poverty reduction in rural areas during the period 1984–2008 can be attributed to the growth of the urban service sector. The remaining 45% is 25% due to the growth of the rural service sector, 11% due to the growth of the rural agricultural sector, and 9% due to the growth of the urban industrial sector. These estimates already account for general equilibrium effects such as urban service sector growth drawing migrants from poor rural areas to relatively richer urban areas and/or the urban service sector growth raising the demand for agricultural goods produced in rural areas.

The SMERU Research Institute 14
Figure 9. Sectoral contribution to rural poverty reduction (%)
Source: Authors’ calculation.
Comparing the time periods before and after the AFC, there is a notable increase in the contribution of the rural service sector from 28% to 41%. On the other hand, the contribution of the urban industrial sector fell significantly from 10% to 2%. This is apparently due to the fall in industrial growth during the post-crisis period (see Figure 3). Meanwhile, the contribution of the urban service sector fell slightly from 49% to 45% and the contribution of the rural agricultural sector fell slightly from 13% to 12%. Figure 10 shows the sectoral contribution to poverty reduction in urban areas. The figure shows that around 67% of urban poverty reduction is due to growth of the urban services sector. Of the remainder, 19% is due to the growth of the rural service sector and 15% is due to the growth of the urban industrial sector.
Figure 10. Sectoral contribution to urban poverty reduction (%)
Source: Authors’ calculation.

The SMERU Research Institute 15
Comparing the time periods before and after the AFC, similar to the case of rural poverty, the contribution of the rural service sector jumped from 23% to 35%, and the contribution of the urban industrial sector fell from 16% to 4%. Meanwhile, the contribution of urban services remained stable at around 61%.
V. CONCLUSION AND IMPLICATIONS This study assesses the relationship between economic growth and poverty reduction in Indonesia before and after the AFC. Indonesia has experienced significantly slower poverty reduction during the post-AFC era compared to the pre-AFC era. In general, there is no evidence that the growth elasticity of poverty, i.e., percentage point reduction in the poverty rate due to 1% economic growth, has declined after the AFC. Therefore, the slower reduction in poverty observed after the AFC is most likely caused by the lower level of economic growth that has occurred during the post-AFC period. It appears that each percent of economic growth of the service sector generates the biggest power to reduce poverty. Combined with the fact that the service sector contributes the largest share to the GDP in the Indonesian economy, the service sector is also the largest contributor to poverty reduction in both rural and urban areas. This implies that any change in the growth level of the service sector will affect the GDP and thus influence poverty reduction significantly. Meanwhile, industrial growth has become largely irrelevant for poverty reduction, mainly due to its underperformance in growth during the post-AFC era. Until now, the industrial sector still makes up the second largest proportion of the GDP after the services sector. Unfortunately, this sector does not absorb as much labor as agricultural and services sectors. In fact, the share of employment in the industrial sector has steadily declined from its peak in the 1990s. The low and declining capacity of the industrial sector to absorb labor perhaps reflects the use of technology that is becoming more capital and skill intensive.
The importance of agricultural sector growth for poverty reduction, meanwhile, is confined only to rural areas. Ultimately, the majority of the poor are employed in the agricultural sector and live in rural areas. As the contribution from the agricultural sector to the GDP has become smaller after the AFC, poverty reduction in Indonesia also slows down. As for the service sector, the contribution of urban service sector growth, which is most effective in reducing poverty, decreases for rural poverty after the AFC. A notable change during the post-AFC period, however, is found in the rising role of growth in the rural service sector, which may be attributed to the development of rural infrastructure that allows for more employment opportunities in the service sector. As a result, growth in the rural service sector now has a higher impact on poverty reduction. The findings of this study indicate that the growth elasticity of poverty did not change greatly between pre and post-AFC. On the other hand, these findings suggest the need to promote economic growth in all sectors as the current levels are proven to be insufficient to recover the rate of poverty reduction that occurred in the pre-AFC era.

The SMERU Research Institute 16
Moreover, attention needs to be focused on the rural economy where the repercussion of mismatching between sectors with the strongest growth and with the largest number of poor is mostly felt. In this case, policymakers need to reduce barriers for rural labor to enter the service sector in addition to promoting the growth of the agricultural sector as a vital sector in the rural economy. Finally, with more and more people moving from rural to urban areas, especially after the AFC, Indonesia needs to develop appropriate policies to anticipate growing urban poverty. Nevertheless, in addition to sustaining high economic growth, a sustainable reduction in poverty requires larger investment in rural areas where the majority of the poor live.

The SMERU Research Institute 17
LIST OF REFERENCES Agrawal, Nisha (1996) ‘The Benefits of Growth for Indonesian Workers’, Country
Department III, East Asia and Pacific Region, The World Bank, paper presented at the Workshop on Economic Reforms and Labour Market Restructuring for Indonesia, April 2–4, Jakarta.
Alisjahbana, Armida S. and Chris Manning (2006) ‘Labour Market Dimensions of Poverty in
Indonesia.’ Bulletin of Indonesian Economic Studies 42 (2): 235–261.
Bird, Kelly and Chris Manning (2008) ‘Minimum Wages and Poverty in a Developing Country: Simulations from Indonesia’s Household Survey.’ World Development 36 (5): 916–933.
BPS (various years), ‘Statistik Indonesia’ [Statistical Yearbook of Indonesia], Jakarta: Badan
Pusat Statistik. BPS (2002) ‘Dasar-dasar Analisis Kemiskinan’ [The Basics of Poverty Analysis], Statistics
Indonesia (BPS) and World Bank Institute, Jakarta: Badan Pusat Statistik. Cervantes-Godoy, Dalila and Joe Dewbre (2010) ‘Economic Importance of Agriculture for Poverty
Reduction.’ OECD Food Agriculture and Fisheries Working Paper No. 23 Paris: OECD. Dollar, David and Aart Kray (2002) ‘Growth is Good for the Poor.’ Journal of Economic Growth
7: 195–225. Hasan, Rana and Quibria, M. G. (2004) ‘Industry Matters for Poverty: A Critique of
Agricultural Fundamentalism.’ Kyklos 57 (2): 253–64. Hill, Hal (1996) The Indonesian Economy Since 1996: Southeast Asia’s Emerging Giant. Cambridge:
Cambridge University Press. Janvry, Alain de and Elisabeth Sadoulet (2009) ‘Agricultural Growth and Poverty Reduction:
Additional Evidence.’ World Bank Research Observer 9 (25): 1–20. Loayza, Norman V. and Claudio Raddatz (2010) ‘The Composition of Growth Matters for
Poverty Alleviation.’ Journal of Development Economics 93 (1): 137–151. Manning, Chris (2003) ‘Labor Policy and Employment Creation: An Emerging Crisis.’
Partnership for Economic Growth-USAID Report No. 110 Jakarta: USAid. McCulloch, Neil (2008) ‘Rice Prices and Poverty in Indonesia.’ Bulletin of Indonesian Economic
Studies 44 (1): 45–63. Miranti, Riyana (2010) ‘Poverty in Indonesia 1984–2002: The Impact of Growth and Changes
in Inequality.’ Bulletin of Indonesian Economic Studies 46 (1): 79-97. Quizon, J. and H. Binswanger (1986) ‘Modeling the Impact of Agricultural Growth and
Government Policy on Income Distribution in India.’ World Bank Economic Review 1(1): 103–148.

The SMERU Research Institute 18
Quizon, J. and H. Binswanger (1989) ‘What can Agriculture Do for the Poorest Rural Groups?’ In The Balance between Agriculture and Industry in Economic Development vol. 4 (Social Effects). I. Adelman and S. Lane (eds.) McMillan Press for the International Economic Association.
Ravallion, Martin, and Gaurav Datt (1996) ‘How Important to India’s Poor Is the Sectoral
Composition of Economic Growth?’ World Bank Economic Review 10 (1): 1–25. Sarris, Alexander H. (2001) ‘The Role of Agriculture in Economic Development and Poverty
Reduction: An Empirical and Conceptual Foundation.’ Paper prepared for the Rural Development Department of the World Bank, Athens: University of Athens.
Sumarto, Sudarno and Asep Suryahadi (2007) ‘Indonesia’. In Beyond Food Production: The Role of
Agriculture in Poverty Reduction. Fabrizio Bresciani and Alberto Valdés (eds.), Food and Agriculture Organization of the United Nations and Edward Elgar, Cheltenham, UK.
Suryahadi, Asep, Daniel Suryadarma, and Sudarno Sumarto (2009), 'The Effects of Location
and Sectoral Components of Economic Growth on Poverty: Evidence from Indonesia.' Journal of Development Economics 89 (1): 109–117.
Suryahadi, Asep, Daniel Suryadarma, Sudarno Sumarto, and Jack Molyneaux (2009), 'Agricultural Demand Linkages and Growth Multipliers in Rural Indonesia.' In Rural Investment Climate in Indonesia. Neil McCulloch (ed.) Singapore: Institute of Southeast Asian Studies.
Suryahadi, Asep, Umbu Reku Raya, Deswanto Marbun, and Athia Yumna (2011) 'Accelerating
Poverty and Vulnerability Reduction: Trends, Opportunities and Constraints.' In Employment, Living Standards and Poverty in Contemporary Indonesia. Chris Manning and Sudarno Sumarto (eds.) Singapore: Institute of Southeast Asian Studies.
Timmer, C. Peter (2004) ‘The Road to Pro-Poor Growth: The Indonesian Experience in
Regional Perspective.’ Bulletin of Indonesian Economic Studies 40 (2): 177–207. Warr, Peter (2006) ‘Poverty and Growth in Southeast Asia.’ ASEAN Economic Bulletin 23 (3):
279–302. Warr, Peter (2011) ‘Poverty, Food Prices and Economic Growth in Southeast Asian
Perspective.’ In Employment, Living Standards and Poverty in Contemporary Indonesia. Chris Manning and Sudarno Sumarto (eds.) Singapore: Institute of Southeast Asian Studies.
Warr, Peter G. and Wen-Thuen Wang (1999) ‘Poverty, Inequality and Economic Growth in
Taiwan.’ In The Political Economy of Development in Taiwan: Essays in Memory of John C. H. Fei. Gustav Ranis and Hu Sheng-Cheng (eds.) London: Edward Elgar.
Wetterberg, Anna, Sudarno Sumarto, and Lant Pritchett (1999) ‘A National Snapshot of the
Social Impact of Indonesia’s .’ Bulletin of Indonesian Economic Studies 35 (3): 145-152. World Bank (2006), ‘Managing Through a Global Downturn.’ East Asia Update. Washington
DC: World Bank East Asia and Pacific Region.
The SMERU Research Institute 19
APPENDIX 1
Table A1. The Impact of Sectoral GDP Growth on Rural and Urban Poverty
Rural Poverty Urban Poverty
Coefficient z-values Coefficient z-values
Urban Agricultural GDP Growth -0.190 -0.83 0.058 0.32
Urban Industrial GDP Growth -0.099 ** -2.83 -0.106 ** -3.02
Urban Services GDP Growth -0.413 ** -4.52 -0.344 ** -4.75
Rural Agricultural GDP Growth -0.445 * -2.19 -0.017 -0.08
Rural Industrial GDP Growth -0.102 -0.89 0.012 0.17
Rural Services GDP Growth -0.555 ** -5.37 -0.294 ** -3.81
Change in population share 6.477 ** 3.43 2.614 1.68
Initial poverty headcount -0.143 ** -2.72 -0.106 -1.86
Initial Gini ratio -0.002 -0.01 0.043 0.30
Initial human capital -0.264 -1.64 -0.026 -0.40
Constant 0.138 * 2.34 0.040 0.89
Number of observations 132 132
Wald chi-square 91.43 51.94
Log likelihood 140.88 176.83
Source: Suryahadi, Suryadarma, and Sumarto (2009). Note: *Confidence interval significant <0.01 **Confidence interval significant <0.05

The SMERU Research Institute 20
APPENDIX 2
Table A2. Sectoral GDP Share in Indonesia 1984–2008
Urban
Agricultural
Urban
Industrial
Urban
Service
Rural
Agricultural
Rural
Industrial
Rural
Service
1984-2002 0.0222 0.2326 0.3619 0.1479 0.1032 0.1321
1984-1996 0.0172 0.2169 0.3418 0.1656 0.1128 0.1457
2002-2008 0.0268 0.2475 0.3861 0.1300 0.0902 0.1193
Source: BPS (various years).

The SMERU Research Institute Phone : +62 21 3193 6336
Fax : +62 21 3193 0850
E-mail : [email protected]
Website: www. smeru. or.id
ISBN: 978 – 979 – 3872 – 96 – 4