economic development potential of … creation of new energy supplies associated with renewable and...
TRANSCRIPT
ECONOMIC DEVELOPMENT POTENTIAL OF CONVENTIONAL AND POTENTIAL ALTERNATIVE ENERGY SOURCES IN APPALACHIAN COUNTIES
Amy Glasmeier, Professor
and Tom Bell, Consulting Geologist
First Draft not to be quoted June 21, 2006
Executive Summary
Appalachia has significant potential to contribute to both national energy independence and to achieve regional import substitution in the energy sector. There are significant opportunities for regional and community-scaled industrial development, especially in the areas of bio-fuels. Major choices exist in the selection of a minimum scale of production for many of the new technologies and energy sources. Technologies in these fields are changing rapidly, thus planning for Appalachia’s energy future is dynamic. The creation of new energy supplies associated with renewable and non-renewable energy sources is likely to generate substantial new employment. Appalachia’s industrial base already contributes major inputs to the wind, solar, biofuels, and other non-fossil fuel energy industries. Estimates of future growth in these sectors are significant and some research suggests thousands of new jobs will be created as these sectors expand in and outside of the region.

Demand for non-renewable resources such as coal, natural gas, and oil is expected to expand assuming energy prices remain high. At the same time, job growth in the fossil fuel sector may be limited by the application of more productive mining practices at existing operations. There is some evidence that Appalachian coal may be at a disadvantage vis a vis western coal due to the higher sulfur content of Appalachian coal, lower production costs of western mines and reductions in the benefit of proximity to eastern power plants given that transportation costs are becoming an ever smaller share of the delivered cost of coal, especially in instances where imported coal can reach recipient power plants in reach of the Mississippi River. In contrast, renewable energy sources may emerge as an important source of regional and local employment and economic development. The mature ethanol, wind and solar industries are likely to expand as economies of scale, improvements in technology and the rising cost of fossil fuels make them more competitive. New industries can be expected to emerge as lignocellulose biorefinery technology is developed. Similarly, methane sources such as municipal waste water, landfill, livestock manure, and mine ventilation air within Appalachia represent as yet untapped sources of jobs and energy production. Carbon sequestration may prove to be an important strategy for reducing the Nation’s CO2 emissions. While there will be growth of employment in technical fields associated with identifying and developing alternative means of sequestering CO2, there may also be job losses associated with the decommissioning of aging production equipment, power plants, and other sources of CO2. Since sequestration technologies are in the research stage, estimates of impacts are impossible at present.

Introduction The Nation faces a significant challenge: reduce dependence on foreign sources of energy while reducing our environmental impact associated with the energy we use. Currently America imports 62% of the oil used in the Nation at a cost of more than $250 billion last year (Department of Energy 2005). In 2002, fossil fuels, which are finite and nonrenewable, supplied 86% of the energy consumed in the United States. As Secretary of Energy Samuel Bodman suggests: “With worldwide demand growing rapidly, and with concern about the environmental impact of greenhouse gases rising, the deployment of clean, reliable sources of energy is clearly in our national interest. “ Secretary of Energy Samuel W. Bodman (http://www.eren.doe.gov/)
Today the Nation is at a crossroads. Growing global demand for fossil fuels, the perception of declining world wide petroleum reserves, and existing geopolitical instability in key energy producing nations is raising the level of uncertainty in global energy markets. Recent spikes in the price of oil reflect this uncertainty and may be the harbinger of a new era of higher energy costs in America and the world. Concurrently, Americans are beginning to accept that Greenhouse gas emissions have to be reduced to ensure that changes in climate are not further exacerbated by human impacts. How do we as a nation develop greater energy independence while reducing our environmental impact?
What Is Energy Independence? HowDo We Achieve It? There are a variety of definitions of energy independence. The spectrum includes achievement of the necessary energy resources to maintain an agreed upon standard of living without disruption. A more encompassing definition emphasizes the development of a life style that uses energy resources in the most efficient and environmentally benign manner possible through a reduction in dependence on fossil fuels and a

commensurate increase in the use of renewable energy resources. In this report, we adopt a working definition of energy independence which follows from the second set or principles. With that perspective in mind, this report examines the existence of energy resources in the Appalachian Region, the prospect of resource utilization across the region, and traces the direct effect of energy industry related economic activity among firms and industries across Appalachia.
Basic Assumptions of this Report For the purposes of this report, we assume that the goal of federal, state and local policy is to reduce dependence on imported energy resources. We further assume that the US will pursue a strategy of energy independence through import substitution to achieve reductions in energy imports. As a recognized economic development strategy, “Import Substitution” focuses on developing the capacity to produce what otherwise would be imported from outside the region. Over time, import substitution can lead to the achievement of economies of scale in activities in which a region or nation chooses to specialize. This two step process can lead to the emergence of competitive advantages that are accompanied by the development of inter-industry linkages and further economic growth. The development of successful Asian economies including Japan, Korea, and Taiwan followed such a path to development starting in the 1950s. This report builds from the knowledge of this experience in considering the effects of a changing energy future for the United States. To pursue an import substitution strategy will require an increase in the production of both non and renewable energy sources that are domestically based. All of these activities will require resources, capital investment, new technology, and investments in human capital. Given this assumption, how do communities and states plan to take maximum advantage of such a national goal as energy independence? Our final assumption is that the Nation will pursue the goal of reducing American contributions to CO2 emissions. From scientific evidence we

know that greenhouse gas emissions are linked to surface and ocean temperature increases, which in turn are thought to be correlated with increased climate variability. Corporations around the world are actively engaged in formulating plans and funding research to reduce CO2 emissions (Environmental Protection Agency [EPA] 2006). Recent reports in the national press underscore the growing significance of this issue in corporate strategic planning. Major national and international oil and gas companies are planning for a world in which fossil fuel consumption will utilize non-CO2 emitting production processes. To pursue this goal will require changing the mix of energy sources we produce and consume while enacting policies that lead to carbon sequestration in many different forms, those known and those still to be developed. This report considers what opportunities exist in the pursuit of energy independence and CO2 reductions for local, state, regional and national economies. It seeks to answer a number of questions, chief among them: How do we plan for an energy future in which the nation is less dependent on fossil fuels and more reliant on renewable energy sources? How do we determine what the economic impacts are of this future? And, how can communities contribute to this alternative energy future through the provision of goods, services, technology and a well-prepared workforce?
Job Estimates Depend on Specifying a Future State of Energy Production This report provides a first cut at understanding the economic implications of an energy future that reduces the Nation’s dependence on imported resources. This type of analysis requires that we specify a state, condition or mix of energy sources we wish to utilize in the future in order to estimate what such a change would mean in terms of the demand for goods and services and in turn the job impacts of such a change. At the same time, to the extent possible, we need to account for not only the benefits associated with a strategy to improve energy independence, but we also must incorporate into our calculus the costs of reducing our carbon footprint. To that end, this paper consists of four

parts.
Outline of the Report • Part one explores a set of scenarios that are used by researchers to
develop estimates of the job impact of various energy consumption and production profiles. This is necessary as we cannot calculate job impacts if we don’t first specify a change in the actions and practices associated with the production and consumption of different combinations of energy resources, both renewable and nonrenewable. Drawing on reports produced by a number of organizations, we discuss alternative futures based on different combinations of energy sources. As part of this discussion, we also briefly examine the issues associated with carbon capture and reductions in US output of CO2.
• Part two examines a range of sectors that are either direct sources
of energy or are inputs to the generation of energy--both conventional non-renewable resources and alternative or renewable resources. This second part consists of a compilation and display of secondary data that illustrates the spatial distribution of energy sources and resources, where possible characteristics about them, and when realistic, a geographic representation of the likelihood of resource development. In other words, we present maps that display a range estimates of where in Appalachia these sources and opportunities are located.
• In part three, we look more closely at three alternative energy
sectors in which extensive analysis of job generation potential has occurred: photovoltaic, wind energy, and biomass. This section examines renewable energy sources nationally, including: solar, wind, and biomass. We then move to the regional level and combine the findings from several studies to identify likely employment impacts in states that are members of the Appalachian region. As part of this discussion, we identify key firms in the states comprising the ARC that produce major manufactured

components used in the production of alternative energies, particularly wind power.
• In part four we identify nine sectors that account for a significant
portion of key components in the alternative energy sectors of wind, solar, and biomass. We highlight these sectors and their employment in ARC states. We also examine the ARC share of total national industry employment in these sectors. We conclude this section with a summary and suggestions of areas of future research.
Caveats This report is not exhaustive nor is every possible energy source explored in detail. With so many promising technologies still in the research stage, it is difficult if not impossible to offer concrete estimates of future job potential for all possible sources. In this report, estimates of job development potential are extremely rough and cannot be generalized. Greater accuracy regarding the job generation potential of these energy sources requires additional data and more systematic and sophisticated estimation techniques. The report also does not explore in detail the job growth potential of non-renewable energy sources. Job estimates associated with the further development of coal require more detailed data. This report offers general information about possible energy options for the Appalachian region.

Part One: Job Implications of a 21st Century National Energy Portfolio: Methods of Estimating Job Impacts of the Growth in Non Renewable and Renewable Energy Sources and the Importance of Carbon Sequestration
Methods Used to Estimate Job Impacts of the Expansion of the Alternative Energy Sector Since 2001, several major studies have been commissioned to examine alternative energy futures and the economic development potential of the expansion of renewable energy sectors, including wind, various forms of biomass and solar. In these studies, two widely used methods are employed to calculate the job impacts of a change in the nation’s energy budget: input-output analysis, which captures the direct, indirect and induced effects of investment in a sector, and analytical models that yield an estimate of the direct job generation from the expansion of a sector based on the implied labor time required to produce industry components. While the first method provides a comprehensive means of estimating total job impacts including potential job losses associated with shifts between sectors and increasing efficiencies provoked by changes within sectors, it is data and computationally intensive. In contrast, an analytical approach to estimation is a simple and transparent means of creating a rough estimate of job generation potential from the expansion of alternative energy industries. For this report, we use the simpler approach as a starting point and recommend that a more comprehensive assessment be considered that employs input-output analysis. For our purposes we illustrate the range of possibilities for growth in the number of jobs in separate industry segments, and investigate the prospect of sectoral growth in states that are currently the locations of alternative energy industry activity. These studies use as a baseline different energy scenarios that calculate the job impacts of future energy

portfolios including higher and lower reliance on fossil fuels. From these differences in energy portfolios, economic impacts can be calculated and then translated first into material inputs, operations and process activities and ultimately into total job impacts. If we isolate different combinations of renewable energy sources for the generation of electrical energy we see that there are considerable differences across the different feed stock combinations. According to some estimates, biomass-related energy generation is predicted to create more long-term jobs compared with other renewable energy sources (Table 1).
Table 1: Comparison of Estimated Employment Associated with Alternative Scenarios in the Production of Energy in the US
Average employment associated with each scenario (jobs)
Scenarios Construction, Manufacturing,
Installation
O&M and Fuel
Processing
Total Employment
20% Renewable Portfolio Standard (RPS) by 2020 (85% biomass, 14% wind, 1% solar PV)
52,533 188,317 240,850
20% Renewable Portfolio Standard (RPS) by 2020 (60% biomass, 37% wind, 3% solar PV)
85,008 91,436 176,444
20% Renewable Portfolio Standard (RPS) by 2020 (40% biomass, 55% wind, 5% solar PV)
111,879 76,139 185,018
Fossil Fuels as Usual to 2020 (50% Coal, 50% Natural Gas)
22,711 63,657 86,369
20% Gas intensive by 2020 (100% Natural Gas)
22,023 61,964 83,987
Comparison of estimated employment created by meeting the equivalent of 20% of current US Electricity demand vian and expansion of fossil or renewables-based electricity generation.

This section provides an overview of job potential in light of the expansion of energy sources non renewable and renewable, and then briefly examines job growth potential at the national level. A discussion of the importance of accounting for carbon sequestration follows.
Job Growth and Fossil Fuels Appalachia’s tremendous reserves of fossil fuels, particularly coal, will be an important component of the nation’s future energy budget, but its exploitation presents significant environmental challenges. Recent data from the US Energy Information Administration (EIA) indicates that fossil fuels will continue to be a major component of the Nation’s energy budget. US consumption of fossil fuels consists of a mix of natural gas, coal and oil. If the price of oil continues to climb, the demand for coal will increase. At the same time, according the EIA, western coal used for the production of electricity has significantly advantages over Appalachian coal due to differences in production cost and sulfur content. In its 2006 report and near term estimates, the EIA reports:
“Appalachian coal production remains nearly flat in the reference case. Although producers in Central Appalachia are well situated geographically to supply coal to new generating capacity in the Southeast, the Appalachian basin has been mined extensively, and production costs have been increasing more rapidly than in other regions. The Eastern Interior coal basin (Illinois, Indiana, and western Kentucky), with extensive reserves of mid- and high-sulfur bituminous coals, does benefit from the new builds of coal-fired generating capacity in the Southeast. Nonetheless, in 2004, approximately 20 plants, many located east of the Mississippi River, used Powder River Basin coal for the first time. “
In terms of job growth, again the EIA reports,
“Most jobs in the U.S. coal industry remain east of the Mississippi River, mainly in the Appalachian region (67 percent in 2004). Most coal production, however, occurs west of the Mississippi River (56

percent in 2004), with the major share from the Powder River Basin. As coal demand increases, pressure to keep prices low will shift more production to mines with higher labor productivity. Large surface mines in the Powder River Basin take advantage of economies of scale, using large earth-moving equipment and combining adjacent mines to increase operating flexibility. Underground mines in the Northern Appalachia and Rocky Mountain supply regions use highly productive and increasingly automated longwall equipment to maximize production while reducing the number of miners required. Additionally, more costly Appalachian coal competes with lower cost imports from Latin America and Asia. http://www.eia.doe.gov/oiaf/aeo/coal.html”
Overall job growth in fossil fuels is projected to be static or to decline over the next ten years (Table 2). This pattern reflects increasing efficiencies in the production of fossil fuels combined with a reduction in yields from domestic oil, coal, and gas fields. Together these industries are not expected to generate significant job gains over the next 20 years.

Table 2. Net projected losses of jobs by fossil fuel and energy generation due
to technological change and decreasing yield of natural resource deposits
Sector Net Job Gain/Loss by 2020
Overall for all sectors of the economy +1,314,000
Coal Mining -23,900
Oil and gas mining -61,400
Oil refining -6,300
Electric utilities -35,100
Natural Gas utilities -26,200 Net projected losses by sector of the economy in comparison to overall projected net gains. Source: Worldwide Fund for Nature.
While fossil fuels will be a major component of Appalachia’s contribution to the nation’s future energy budget, environmental consequences of continued fossil fuel dependence will continue to be significant and therefore will represent only one of many elements required to achieve national energy independence.
Job Growth and Renewable Energy The picture of growth in employment from changes in renewable energy industries is decidedly different from that of fossil fuels. Growing evidence suggests considerable job development potential from the expansion of alternative energy sectors. Kammen et al. (2004) summarized recent reports about job potential from alternative energy industry expansion, highlighting the significant growth potential of wind, solar, and biomass industries (Table 3). Several of these studies suggest that renewable energy creates more jobs than other sources of energy.

Table 3. Renewable Energy Growth in the United States (MW)
Technology
Installed Capacity (Latest Year with Data)
Previous Year Installed Capacity
% Growth from Previous Year
Solar including PV 365 (1998) 334 9%
Wind 3,804 (2001) 2,554 49%
Biomass 7,367 (1998) 7,676 -4%
Geothermal 2,917 (1998) 2,853 2% Source: Wind data from correspondence with Kathy Belyee, American Wind Energy Association. All other data from US Energy Information Administration (EIA). Renewable Energy Annual 1999. Washington DC, March 2000. DOE/EIA-0603(99). Biomass data includes wood and wood waste, straw, digester gas, paper pallets, methane, waste alcohol, tires, fish oils, sludge waste and tall oil. It does not include municipal solid waste and landfill gas.
According to some estimates, given their early stage in the product cycle, renewable energy sources are estimated to generate four times as many new jobs per megawatt of installed capacity as natural gas and 40% more jobs per dollar invested than coal. Thus the job development opportunities are potentially substantial. In these reports, the authors consider three stages in the job generation process: manufacturing, construction, and operations. To the extent possible, we also follow this strategy in reporting job generation potential for the constituent elements of the energy sector under consideration. 1
Carbon Sequestration A discussion of job impacts associated with the expansion of energy production, must take into account the job impacts of the need to reduce CO2 emissions and to capture and sequester that which is produced in
1 Kammen et al. further report that alternative energy industry expansion generates more jobs per megawatt hour compared with conventional energy industry alternatives, due to increasing efficiencies in extractive industries combined with job losses associated with mergers and acquisitions

the consumption of fossil fuels and resulting outputs of other CO2 emitting processes. While the development of the technology to capture and sequester CO2 is still in it infancy, an ability to determine job impacts require that this by-product of energy production and consumption be taken into account alongside of alternative energy scenarios. The US will continue to utilize fossil fuels for the foreseeable future. In the process of mining and utilizing fossil fuels, CO2 is emitted. Like other countries the US is embarking on a path to reduce the nation’s CO2 output. To do so will require the development of new technologies and processes. The job impact of this development will be both positive and negative. Positive change will occur as new techniques and processes are implemented to capture and store CO2 emissions. Negative change will occur as high CO2 emitted processes and technologies are phased out in favor of low emission activities. At present, the majority of technologies being developed to help capture and sequester CO2 are in the development stage. Some are at an advanced stage of development while others are many years off and will require significant investment in research and technology to reach commercial scale. Sequestration is linked to the source point of the CO2 emissions. Almost one third of US emissions are derived from power generation and power plants. Present costs of sequestration are estimated at $100-300/ ton, a sum that must be reduced to $10/ton to be economical. Current research is focusing on identification of novel concepts to control emissions. These are expected to be cost effective taking into account total costs and impacts over the product cycle. This means production through disposal including social and environmental effects comparing local and global levels. In the medium term, projects are testing carbon capture ad re-use alongside existing power plants. Examples in the Netherlands demonstrate the efficacy of such an approach. Plans for the US include carbon capture and injection into existing oil fields to extract otherwise

unrecoverable petroleum. At present, plans and strategies for CO2 capture are in their infancy and the payoff is five to seven years away. Thus, in contemplating the implementation of a new energy future, the costs of sequestration need to be taken into account in order to effectively estimate the job impact over time.
Summary, Part 1 A national energy portfolio that: a) reduces reliance on fossil fuels; b) maximizes the utilization of renewable sources; and c) reduces CO2
emissions will yield a jobs profile significantly enhanced compared with current conditions. The contribution to job generation by different industries will depend on their level of maturity and their position in the product cycle. The fossil fuel industry is mature. Growth in demand is likely to lead to modest direct job generation, but is likely to precipitate process-innovation-related job generation over time. In contrast, widespread commercialization of renewable energy sources is in its infancy. Many renewable energy sources are just being developed and are thus at an early stage in the product cycle. Moderate levels of growth in demand will lead to the expansion of the existing supplier base and lead to the creation of complementary product lines. Significant new growth in demand will not only augment the existing base, but is likely to lead to the development of whole new products, an expansion of the supplier base attendant with this new productive capacity, and the growth of entirely new product-based innovations. Production bottlenecks and the search for efficiencies will further stimulate technological change leading to process innovations. The impact of actions to pursue carbon sequestration will depend on a host of serious short, medium and long term challenges. In the short run, solutions to the problems of sequestration will have direct positive job impacts. Over time, net job impact will reflect gains in the form of new industrial practices set against losses due to retirement of existing capacity.

Part Two: Energy Supplies and their Probability of Utilization in the ARC region This portion of the report is a survey of the conventional and potential alternative energy sources of the 410 Appalachian counties. County potential for each energy resource is assessed in qualitative or semi quantitative terms. None of the values represented below should be used beyond the intent of this report which is to simply rank counties by potential. The qualitative measures are based on subjective break points in a measured value that is strongly correlated with the magnitude of the energy resource under consideration. Many of the underlying values are model results or estimates thus the errors are assumed to be high but systematic thus qualitative and semi-quantitative ranking of counties is justified. The term "resource" used throughout this page is the sum of an energy source but not it's recoverable value. The term "reserve" is used to represent recoverable volumes or masses of an energy commodity at prices and efficiencies that existed at the time of the reserve estimation.
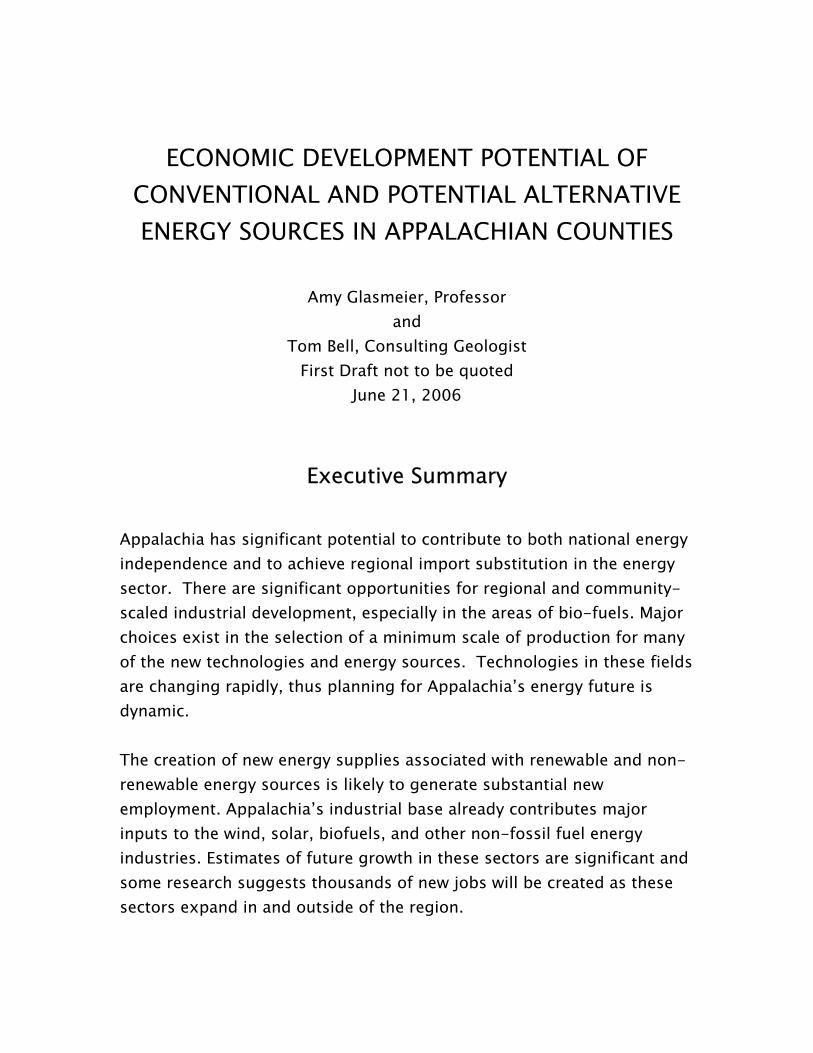
Petroleum Though U.S. commercial production of petroleum for fuel was initially in Appalachia (Pennsylvania), prospects for significantly increasing production in Appalachia are low. Production, reserves, and exploration activity as measured by wells drilled are summarized in the next three graphs. Reserves have increased in the last few years likely to be due to rising prices, not discovery of new sources of petroleum.

Source: Petroleum Technology Transfer Council Appalachian Region Oil and Gas Data
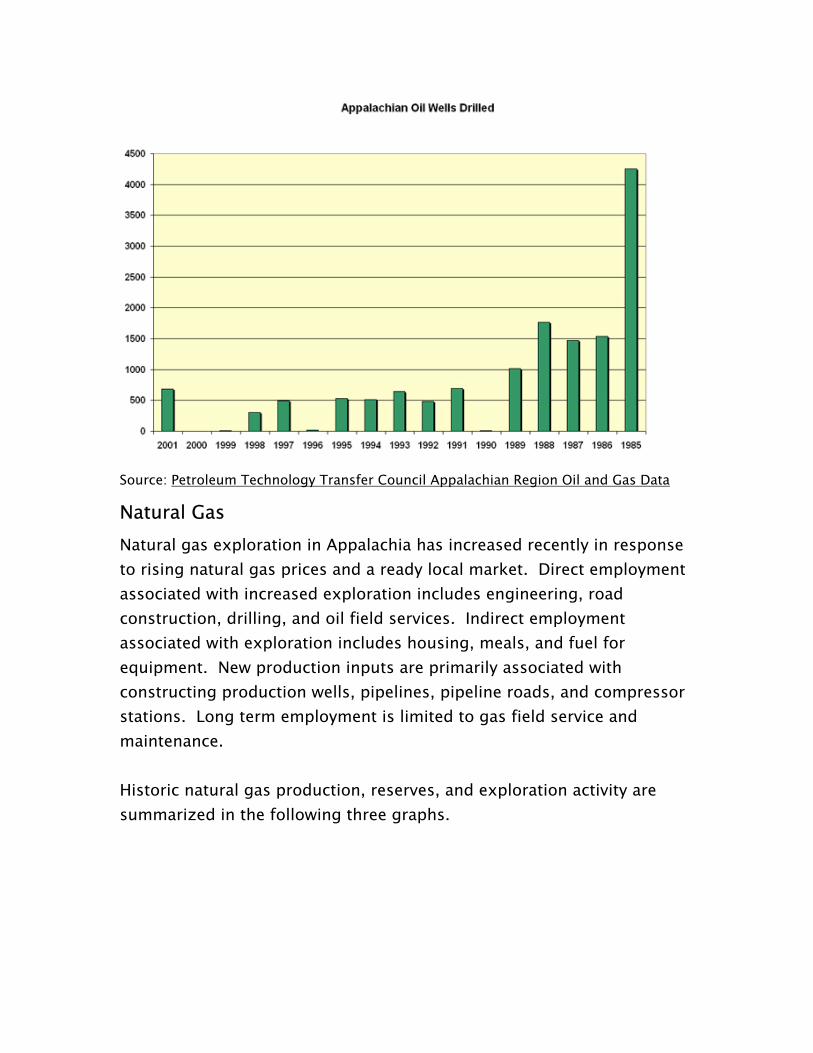
Natural Gas Natural gas exploration in Appalachia has increased recently in response to rising natural gas prices and a ready local market. Direct employment associated with increased exploration includes engineering, road construction, drilling, and oil field services. Indirect employment associated with exploration includes housing, meals, and fuel for equipment. New production inputs are primarily associated with constructing production wells, pipelines, pipeline roads, and compressor stations. Long term employment is limited to gas field service and maintenance. Historic natural gas production, reserves, and exploration activity are summarized in the following three graphs.


Source: Petroleum Technology Transfer Council Appalachian Region Oil and Gas Data
A qualitative assessment of natural gas potential is shown in the following map. Each county was categorized by the average reserve size class as defined by the Energy Information Administration within each county.
Natural Gas Potential Based on EIA Reserve Estimation for 2001
Code Potential Average Reservoir Size Class
Gas Volume Range for Class (million cubic feet)
V. Low 0 and 1 0 -10
Low 2 10.1-100
Mod 3 100.1-1,000
High 4 1,000.1-10,000
V. High 5 10,000.1 - 100,000
Steam Coal Coal has been Appalachia's traditional energy product. Fourteen hundred and seventy five mines produced 3.79 million tons of steam coal in 2003 (most recent year statistics are available) and employed nearly 47,000 people. The cumulative value of all coal produced in Appalachian counties priced as bituminous coal FOB was $10.7 billion dollars (current

2005 dollars). Rising prices and increased productivity through automation have stimulated production, redevelopment of closed mines, and initiation of new mines. The next three maps summarize mines, value and employment for 2003 (most recent data available) by county.


Source: Energy Information Agency
Coalbed Methane Significant resources of coal that are not economic to mine exist in Appalachian counties and may represent a source of energy via in situ coal gasification. Additionally, methane constitutes a small but potentially useful fraction of the ventilation stream from operating mines.

Underground Coal Gasification Underground coal gasification was developed by the Soviets in the 1930's, tried in the United Kingdom in the 1950s, evaluated in the US in the 1970s, and evaluated in Europe during the 1990s. Active research programs exist in all the major coal producing countries. Simple in theory but difficult to put in practice, coal gasification requires injection wells and extraction wells in a coal seam. Controlling the reaction of in situ coal to gas, enhancing coal bed permeability, and maintaining formation pressure are all major challenges. Recent developments in directional (horizontal) drilling may be changing the feasibility of this technology. Little literature is available at US websites and a search of the EIA and NREL websites turned up few relevant references. Leaders in the field appear to be the United Kingdom and Australia.
Ventilation Air Methane Underground coal mines must circulate fresh air to remove flammable and toxic gases released from coal seams during the mining process. As the ventilation air passes through the mine it accumulates carbon dioxide and methane before it is exhausted to the atmosphere. Ventilation air methane (VAM) is the single largest source of industrial methane put in the atmosphere by the United States. VAM can be utilized as a heat source or to generate electrical power using emerging VAM oxidation technologies. EPA has estimated that VAM based methane emissions from US underground coal mines were on the order of 2.5 billion cubic meters in 2000. The Appalachian basin accounted for 73% of all national underground production in 2000 thus approximately 1.8 billion cubic meters of methane was potentially available for energy production in 2000 in the Appalachian Region. This represents a resource of 175 megawatts per year. The approximate distribution of this resource, coal production by Appalachian county was converted to a VAM resource in the following map.

Wind The Appalachian ridges and Lake Erie shoreline constitute a potential economic zone for generating electricity with wind power. Direct employment is heavily weighted to the construction phase as towers, turbines, power lines, and substations are constructed. Long term employment is limited to maintenance. The map below is a qualitative assessment of the wind resources of Appalachian counties based on state level evaluations assembled by the

Department of Energy. Each county was assigned a value based on the presence and areal coverage of class 4 and above wind speed at 50 meters above the ground.

Wind Potential From DOE
Code Potential Max Wind Class Wind Speed at 50 m (mph)
no data - -
Low <4 <15.7
Mod 4 - 5 16.8 - 17.9
High >5 >17.9
Lignocellulose Lignocellulose is a promising feedstock for fuel grade ethanol production. Sources of lignocellulose include wood chips, corn stover (chopped corn stalks), and "bioenergy crops" such as switchgrass and fast growing trees. The National Renewable Energy Laboratory has produced an extensive analysis of current and near term technologies for developing renewable energy sources including ethanol production from lignocellulose. The following analysis of the lignocellulose potential of Appalachian counties is based on a modified inventory of lignocellulose sources by county and a pre-feasibility study of a model biorefinery for ethanol production both produced by NREL. The inventory of lignocellulose resources by county is composed of feedstocks from crop residues, forest residues, urban waste wood, mill residues, and dedicated energy crops. The NREL inventory included switchgrass as its dedicated energy crop and only calculated the amount that could be grown on reclaimed mine land and acreage set aside in the CWRP program. This value has been deleted and a separate value for switchgrass production substituted. The new value is calculated by using the unharvested cropland acreage reported in the 2002 Census of Agriculture multiplied by 5 tonnes/acre/year. This new assumption is justified on the basis of switchgrass as viable in the normal crop rotation cycle and the potential for an incentive program to grow switchgrass on otherwise uncultivated cropland.

Lignocellulose cultivation and local biorefineries to convert it to ethanol represent the single biggest potential gain in local employment and retention of revenue of all energy industries considered in this evaluation. This industry, like coal, depends upon the local labor force to produce the feedstock and if the biorefineries are local, supply the labor force to operate them as well. Local input may account for as much as 60% of the total cost of production. The classification of counties is based on the total tonnage of biomass from all sources and the threshold capacity for a 25 million gallon/year ethanol biorefinery with minimum feedstock input of ~300,000 tons per year presented in the pre-feasibility study produced by NREL. Counties with sufficient lignocellulose potential to support a 25 million gallon per year biorefinery are rated "very high".
Lignocellulose Based Ethanol Potential Based on NREL
Code Potential Tonnes/yr Lignocellulose production V. Low <50,000
Low 50,000 - 100,000
Mod 100,000 - 200,000
High 200,000 - 300,000
V. High >300,000

Biomass Methane Biomass feedstocks can also be used to produce methane, a significant greenhouse gas, but also a potential source of energy. NREL has estimated the annual methane production by county from landfills, wastewater treatment, and livestock manure. Units used in their analysis are tonnes/year methane. This was converted to megawatts. Each methane feedstock (waste water, manure, and landfill) requires a separate

extraction technology though conversion to electricity or direct thermal use is consistent over each of the three sources.
Livestock Manure Livestock manure can be used to produce electricity or heat by anaerobic fermentation. Small scale conversion units are being developed for family farms and larger industrial scale plants for factory farms and feedlots. Cost per animal unit remains high for small scale operations and safety risks handling combustible gas may be significant (Source: Purdue Univ).

Wastewater Treatment
Wastewater treatment plants can produce valuable methane from solid waste by anaerobic fermentation. Methane can be used to produce electricity or burned directly for thermal energy. The wastewater resource was converted from tonnes to megawatts to rank the Appalachian counties mapped.

Landfill Landfill based methane can be converted to electrical energy by several means or used onsite for thermal energy. The EPA lists 326 electrical generation projects proposed or operational nationally as of 2004 and 92 direct use projects proposed or operational. Approximately 65% of the electrical generation projects underway nationally use methane to directly power reciprocating engines (internal combustion engine) to drive a

generator. Gas fired turbines comprise approximately 13% of current electrical generation followed by microturbines (~6%), steam boilers (~5%), cogeneration (~4%), and other means. Direct use employs the heat of burning methane for onsite industrial use. The EPA estimates that each megawatt of landfill energy during the construction phase employs 23 people and generates $1 million in wages and salaries. Source: EPA
Only a very small portion of landfill methane in Appalachian counties is currently being utilized.
Operational Landfill Electrical Generation
State County Capacity (megawatts) PA Lackawanna 6.6
PA Erie 6.1
PA Lycoming 13
PA Bradford 0.8
KY Greenup 3.2
KY Laurel 4.0
TN Anderson 3.2
TN Hamilton 1.0
NC Forsyth 4.6
NY Broome 1.2 Source: EPA

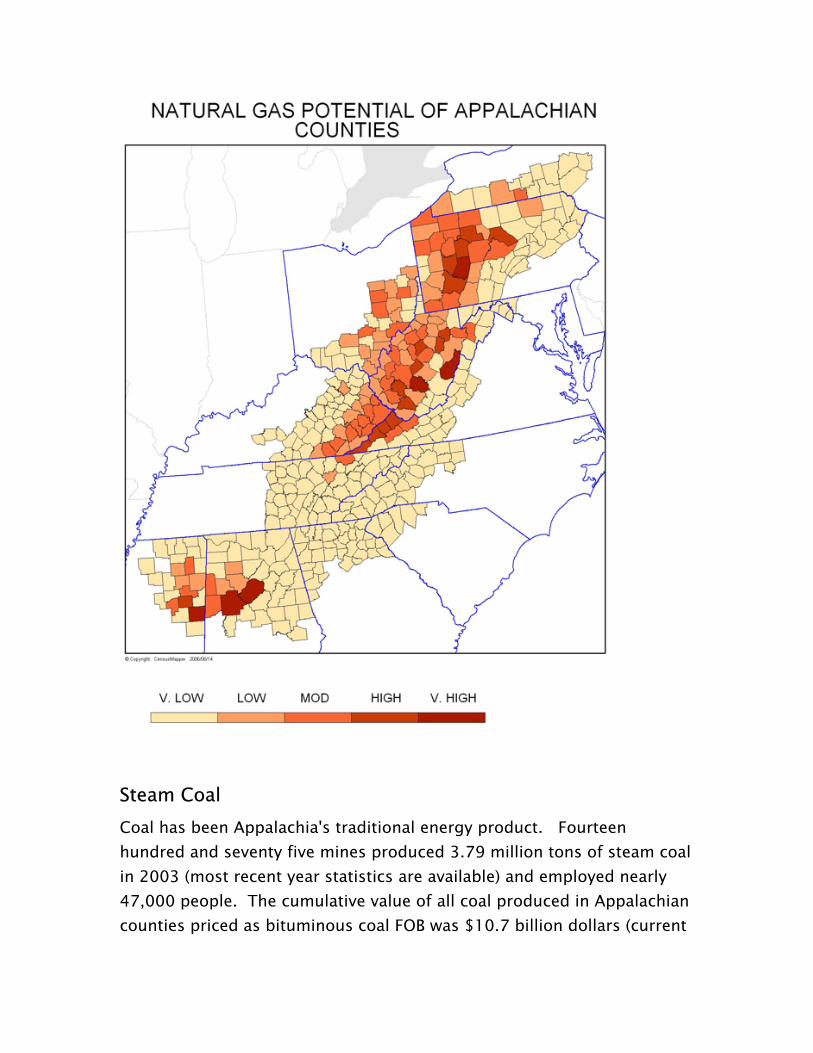
Solar Conversion of solar radiation to electricity by several technologies depends upon factors of scale, angle of incident solar radiation, temperature, cloud cover, and atmospheric clarity. Small scale conversion utilizing fixed orientation flat panel photovoltaic cells serves remote equipment installations, homes and commercial buildings. Solar conversion linked to the power grid utilizes more capital intensive technologies and/or larger
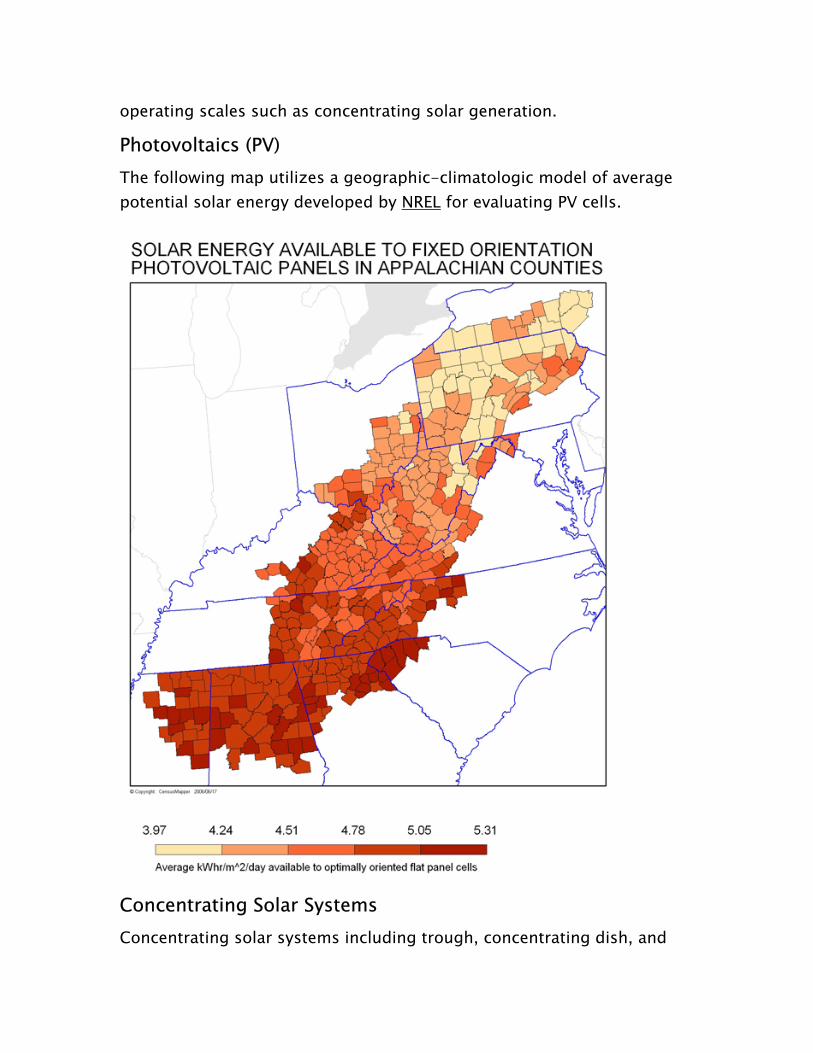
operating scales such as concentrating solar generation.
Photovoltaics (PV) The following map utilizes a geographic-climatologic model of average potential solar energy developed by NREL for evaluating PV cells.
Concentrating Solar Systems Concentrating solar systems including trough, concentrating dish, and

motorized photovoltaic array technologies are necessarily more capital intensive and represent a potential type of commercial power generation in Appalachian counties. The following map displays the solar insolation values available to concentrating solar technologies. Appalachian counties in general are far less attractive than counties in the western United States where solar resources are greater and land costs are lower.

Part Three: Job Potential of Alternative Energy Futures In this section we look closely at three sectors and their job growth potential nationally. Drawing on other studies, the starting point of discussions of growth in these sectors assumes an expansion of energy production using alternative sources. Next, the increase in energy output using alternative sources is translated into growth in demand for key hardware components used in the production of energy (converted into megawatts) for the respective sources: Wind, Solar and biomass. In addition, estimates are made of the number of workers required to construct new energy capacity in the sectors and to operate production facilities once new capacity is added. In turn this increase in demand for inputs and labor is then translated into person hours and ultimately into jobs per increase in megawatt generation. In this assessment we report the general findings of studies produced by various groups, especially the Renewable Energy Policy Project, a consulting firm in Washington, D.C. These studies provide estimates of the number of new jobs that would be created for a finite level of new energy generated employing alternative energy technologies. Given the number of assumptions that have to be made in order to provide an accurate estimate of job generation potential in the ARC region due to an expansion of energy generation from Solar, Wind and biofuels, we do not construct such a computation here. This activity should form the basis of a more detailed research investigation that takes into account the location of firms producing components for these industries and their presence in the ARC region and the potential for installation of productive capacity of these renewable energy sources. At a gross level, in a 2006 study completed for the state of Wisconsin, which compares the national employment impact of an increase in energy production of 74,000 MW by the most prevalent alternative energy sources, the yield was roughly 180,000 gross jobs in the top ten states. Of these, Ohio, New York, Pennsylvania and North Carolina ranked in the

top ten (Table 4). Almost 70,000 of the 180,000 gross jobs anticipated to be generated by the expansion of these sectors is estimated to occur in Appalachian states. This is more than 40 percent of the gross jobs assumed to occur in conjunction with growth of these three sectors.* Thus growth in demand for energy generated using renewable sources has potential to generate significant new jobs in ARC states.
Table 4: Jobs and Investment for 74,000 MW Renewable Energy Development
Location # of
Firms New Jobs
(Wind)
New Jobs
(Solar)
New Jobs (Geothermal)
New Jobs (Biomass)
New Jobs(Total)
CA 5,409 12,830 19,558 3,387 2,481 38,256
TX 3,358 10,024 9,289 1,864 2,869 24,048
IL 2,289 12,013 7,720 1,358 1,550 22,641
OH 2,465 11,937 4,733 2,031 1,813 20,514
NY 1,925 7,415 5,848 3,260 2,653 19,176
PA 2,188 7,841 6,308 1,363 1,564 17,076
IN 1,321 10,079 2,995 1,277 1,345 15,595
WI 1,331 10,079 1,977 815 1,190 14,061
MI 2,050 9,750 2,657 602 914 13,023
NC 1,096 4,391 4,423 1,123 1,480 11,417 Source: Source: REPP Component Manufacturing Wisconsin’s Future in the Renewable Energy Industry, 2006 *Exclusive of Geothermal energy.
Wind Energy Energy from the wind is generated by wind turbines. Turbines are composed of rotors, vanes, gears, and other mechanical and electrical components (Table 5). California and Ohio are the top two parts producers for turbines. Job creation related to wind energy developments looks something like a pyramid; 70% of the potential job creation is in manufacturing the components, 17% in the installation, and 13% in operations and maintenance. New investments in wind technology in turn drives new orders for manufacturing related to all components required

to build a new wind generator. A 2006 report of REPP for the state of Wisconsin uses the following figures to determine the job impacts of increased investment in the sector. According to REPP estimates, every 1,000 megawatts of energy generated by wind requires $1 billion in equipment investment. In rough terms this expansion in energy output is estimated to create 3,000 FTE. An increase of 50,000 MW of energy generated from wind results in 20,000 new jobs in the top 20 component-producing states. Eight of the top 20 states are in Appalachia. Based on Appalachia’s fractional share of existing employment in wind-related parts industries, Appalachian states would likely to gain as much as a third of those jobs (+-7,000). Ohio is expected to gain the second largest number of jobs, behind California. A closer look at the supply base of states’ manufacturing key components for the wind energy industry, as seen in Table 6, shows Appalachia states benefit significantly from the installed base of potential supplier firms and resulting employment.
Table 5. Key Wind Energy Industries
NAICS Code Description
326199 All other plastics products
331511 Iron foundries
332312 Fabricated structural metal
332991 Ball and roller bearings
333412 Industrial and commercial fans and blowers
333611 Turbines and turbine generators and turbine generator sets
333612 Speed changer, industrial
333613 Power transmission equipment
334418 Printed circuits and electronics assemblies
334510 Measuring and controlling devices
335312 Motors and generators
335999 Electronic equipment and components NEC

Table 6. Location of Employment by State, Sectors that Generate Inputs for Wind Energy-related Products
State
3261
99
3315
11
3323
12
3329
91
3334
12
3336
11
3336
12
3336
13
3344
18
3345
19
3353
12
3359
99
Total
OH 47,179 10,650 4,171 4,566 1,140 177 807 1,448 1,352 2,447 4,581 3,195 80,511PA 26,259 4,969 7,009 1,303 316 1,073 815 972 2,413 2,387 2,056 924 50,304NY 19,522 478 2,227 2,205 522 3,276 1,055 1,140 10,411 2,040 1,710 2,690 47,375NC 14,682 385 2,684 2,152 355 1,502 310 1,006 2,098 517 3,312 535 30,229TN 12,817 3,056 2,850 1,615 19 - 17 745 2,156 1,093 3,649 381 28,407AL 8,329 6,401 3,774 784 142 375 22 182 2,223 254 483 245 21,213GA 9,756 1,511 3,073 1,955 155 - 250 94 1,242 554 1,954 253 20,898SC 7,646 440 2,969 6,244 75 1,449 452 125 15 91 721 316 20,532VA 9,009 2,323 3,440 7,724 392 3 424 3 463 406 1,461 504 20,201KY 11,423 412 1,232 601 44 - - 1,104 537 15 2,426 97 17,332MD 5,589 24 597 - 10 3 3 371 363 555 174 271 8,355 WV 1,751 120 566 - - - 49 - 182 75 151 49 3,270 MS 3,357 124 1,430 - - 175 - 209 750 40 3,215 358 9,568 TOTAL 177,319 30,893 36,022 29,149 3,170 8,033 4,204 7,399 24,205 10,464 25,893 9,818 358,195

Table 7. Number of Employees, Partial List of Ohio Counties with Industries contributing to components for Wind energy
OH County 32
6199
3315
11
3323
12
3329
91
3334
12
3336
11
3336
12
3336
13
3344
18
3345
19
3353
12
3359
99
Total
Adams 15 - - - - - - - - - - - 15Allen 75 189 15 - - - - 75 - - 184 - 538 Ashland 404 - - - - - - - - - 35 - 439 Ashtabula 2,573 3 - - - - - - - - - - 2,576Athens 35 - - - - - - - - - - - 35 Auglaize 15 175 - - - - - - - - - - 190 Belmont - - - - - - - - - - - - - Brown - - - - - - - - - - 3 - 3 Butler 788 35 49 - 175 - - 75 69 - 15 - 1,206 Carroll 77 - - - - - - - - - - - 77 Champaign 409 - - - - - - - - - - - 409 Clark 347 - 7 - - - - - - 15 35 7 411 Clemont 235 - 175 - - - - - - 15 - - 425 Clinton 284 35 35 - - - 7 - - - - - 361 Columbiana 799 230 55 - - - - - - - - - 1,084 Coshoctan - 375 3 - - - - - - - - - 378 Crawford 375 - 3 750 - - - - - - - - 1,128 Cuyahoga 1,998 1,031 250 24 175 - 419 504 129 459 589 216 5,794 Darke 359 - - - - - - - - - 35 3 397 Defiance - 1,003 175 - - - - - - - 7 - 1,185

Delaware 37 284 15 - - - - - - - - - 386Erie 752 175 - 1,000 - - - 175 - 49 - - 2,151

A more refined estimate of the region’s job potential can be gleaned from a table that examines jobs in firms in the state of Ohio that produce products considered as potential inputs to wind turbines. While the majority of jobs are concentrated in the most populated counties in the state, nonetheless, spillovers to surrounding counties are likely given the distribution of manufacturing in the state (Table 7). Nineteen counties produce parts related to the Wind products industries. Of those, seven have more than 1000 jobs each or almost 14,000 job. A list of companies in the region that produce inputs for the wind energy industry cover the spectrum of key parts, suggesting that existing establishments have the potential to experience significant increases in demand is a national program is established to expand the production of wind energy nationally, regardless of the location of actual wind capture (Table 8).
Table 8. Companies in Appalachian States Producing Inputs for the Wind Energy Industry
Part Company City/Town State
Bearings
CAB Inc The Dyson Co CAB Inc Hodge Foundry Inc
Lionville Painsville Oakwood Greenville
PA OH GA PA
Brakes Parker Hilliard Corp Afab Tech LLC
Cleveland Elmira Mansfield
OH NY OH
Gearboxes
Cleveland Gear Co Michael Bryne CMFG Canton Drop Forge Peerless Winsmith Inc The Cincinnati Gear Co Hodge Forge Inc
Cleveland Mansfield Canton Springville Cincinnati Greenville
OH OH OH NY OH PA
Generators Hitachi America Motors and Controls Intl
Tarrytown Hazelton
NY PA

HUB CAB Inc Oakwood GA
Nacelle Frame Hodge Foundry Inc CAB Inc.
Greenville Oakwood
PA GA
Pitch Drive Parker Cleveland OH
Power Electronics
ABB Inc Hitachi America Motors and Controls Intl 1st Power.com
Raleigh Tarrytown Hazelton Mansfield
NC NY PA OH
Rotor Blades Owens Corning Toledo OH
Shafts The Dyson Corp CAB Inc
Painsville Oakwood
OH GA
Towers Innovative Metal Products Newmark Inc Thomas and Betts Corp
Kenoza Lake Birmingham Memphis
NY AL TN
Source: Compiled by the autho
Solar Energy Photovoltaic (PV) technologies can be used to convert energy from the sun directly into electricity. As much as 10-20% of the energy from the sun can be converted into electricity using existing photovoltaic technologies. Many parts of the United States particularly areas of the West, where land is relatively inexpensive and population is sparse, have the potential to generate energy sufficient to satisfy a significant portion of local energy needs. Given rising petroleum prices, experts suggest that the solar energy field could grow as much as 30% each year over the next 20 years, increasing installed capacity by more than 300%. Inputs to the Solar energy industry comprise a range of goods from flat panels that absorb solar radiation, to batteries that store the received energy, to wires used in the distribution of the resulting power (Table 9). The job creation potential of expanded photovoltaic energy generation is significant due to the fact that the bulk of new employment occurs in the manufacturing phase of industry development. With known technology, four states in Appalachia are in the top 20 states that manufacture components for the photovoltaic industry (Table 10). Two of the nation’s largest producers of photovoltaic components are in the region: the

Sharp Module Assembly facility in Tennessee and BP Solar in Maryland. States in Appalachia are home to more than 2,000 establishments that produce components used in the photovoltaic industry. A rough estimate of the number of jobs currently in sectors that produce products that are potential inputs to the PV industry is above 180,000 (Table 10). Using the same method of calculating job generation given a specified level of investment, states in Appalachia could experience an increase of up to 25,000 new jobs (Table 11). This constitutes almost a third of jobs in the top 20 states producing parts for the solar energy industry.
Table 9. Key Solar Energy Industries
NAICS Code Description
325211 Plastics material and resin manufacturing
326113 Unlaminated plastic film and sheet manufacturing
327211 Flat glass
331422 Copper wire
332322 Sheet metal work manufacturing
334413 Semiconductors and related devices
334515 Instrument manufacturing for measuring and testing electricity
335313 Switchgear and switchboard apparatus manufacturing
335911 Storage batteries
335931 Current carrying wiring devices manufacturing
335999 Electronic equipment and components NEC

Table 10. Location of Employment in Sectors that Generate Inputs for Solar Energy-Related Products
State
3252
11
3261
13
3272
11
3314
22
3323
22
3344
13
3345
16
3353
13
3359
11
3359
31
3359
99
Total
OH 3,808 2,778 394 - 7,469 1,510 1,929 3,292 943 2,360 3,195 27,678 PA 3,332 2,880 1,336 - 7,239 10,046 899 1,854 2,308 3,302 924 34,120 NY 1,141 1,602 409 245 6,889 10,378 2,313 565 403 2,285 2,700 28,930 NC 2,151 2,150 571 37 3,678 4,190 810 1,698 1,159 3,216 535 20,195 TN 1,033 880 2,127 15 2,188 92 56 1,556 376 414 381 9,118 AL 1,119 236 3 - 2,214 431 264 203 35 1,035 246 5,786 GA 1,343 2,357 3 75 2,930 16 448 1,938 1,859 586 253 11,808 SC 2,452 1,971 375 375 945 - 764 2,058 750 618 316 10,624 VA 238 2,836 - 35 2,772 3,768 300 678 10 123 564 11,324 KY 2,962 780 209 - 1,711 7 17 1,904 924 284 97 8,895 MD 79 416 15 7 1,734 771 564 1,225 5 34 271 5,121 WV 3,349 15 409 175 689 3 116 249 75 3 49 5,132 MS 1,053 483 - - 1,365 - 177 426 375 249 358 4,486
TOTAL 24,060 19,384 5,851 964 41,823 31,212 8,657 17,646 9,222 14,509 9,889 183,217

Table 11.
Location # of
Firms New Jobs
(Wind)
New Jobs
(Solar)
New Jobs (Geothermal)
New Jobs (Biomass)
New Jobs(Total)
CA 4,658 14,147 24,288 3,320 2,848 44,602
TX 2,795 10,000 12,299 1,841 3,281 27,401
IL 1,961 11,303 8,472 1,455 1,715 22,946
OH 2,156 13,215 5,957 1,896 1,854 22,922
PA 1,839 9,029 8,119 1,538 1,832 20,517
NY 1,605 7,876 6,318 3,136 2,683 20,013
IN 1,154 11,186 3,824 1,410 1,524 17,954
WI 1,123 11,335 2,193 845 1,844 16,218
MI 1,817 10,369 2,457 587 1,021 14,435
NC 940 4,897 4,722 1,350 2,005 12,976 Source: Source: REPP Component Manufacturing Wisconsin’s Future in the Renewable Energy Industry, 2006
Biomass Sectors Conversion of plant material, human and animal waste, and trash to direct energy fuels such as methane or ethanol is termed biomass energy. Methane, a natural product of organic decomposition can be burned directly for heat or used to power a gas turbine or internal combustion engine driving a generator to produce electricity. Plant material such as crops rich in sugar or starch can be fermented and distilled to produce ethanol which can then be blended with gasoline. Promising new technologies (lignocellulose biorefineries) form the basis of a potential new industry converting lower cost waste wood and cellulose rich crops like switchgrass or fast growing trees into ethanol. The biomass sector is composed of different subsectors based on the type and origin of the feedstock: conventional fermentation-distillation, lignocellulose, manure methane, wastewater treatment methane, and methane from landfills. Though not strictly a biomass source, ventilation air exhaust from coal mines also yields recoverable methane.

Considerable experimental work is being conducted on biomass to increase energy development. Few studies, however, are looking at ways to convert the energy embedded in different forms of biomass into jobs. According to a national study by REPP of the jobs potential of the expansion of energy production from biomass, as many as 32,000 new jobs could be created with a $5 billion investment in productive technology, including both manufacturing and operations. Of the industries examined in this report, biomass is considered the most likely to generate the largest number of post-manufacturing operations and maintenance jobs (Table 12).
Table 12: Estimated Number of Firms, Investment, New jobs Expansion of Renewable Sources
U.S Firms Investment ($million) New FTE Jobs
Wind 16,480 $24,955.2 159,516
Solar 10,272 $27,849.6 119,277
Geothermal 3,926 $6,133.2 28,934
Biomass 12,020 $5,296.8 32,632
Total 42,698 $64,234.8 340,359 Source: Source: REPP Component Manufacturing Wisconsin’s Future in the Renewable Energy Industry, 2006
Summary In summary, it is evident that states in Appalachia are poised to benefit from alternative energy development. Many states in the region produce components used in the manufacture of three key sectors: wind, solar and biomass. In the next section we look specifically at nine detailed industry groups producing inputs for the wind and solar industries. With more information a similar assessment could be made for the biomass industry. These results highlight the fact that Appalachian states have high concentrations of employment in these key sectors compared with their fraction of employment nationally.

Part Four Exploring the Share of Employment in Key Sectors in the Wind and Solar Energy Sectors, States in the Appalachian Region As a final step in this initial assessment, we isolated nine four-digit industries producing inputs for the wind energy and photovoltaic industries and examined the fraction of their employment found in ARC states. This was compared with the fraction of total national employment accounted for by the 13 states (Table 13). The results indicate that Appalachian states account for, on average, more than 35% of total employment in the sectors (Table 14). Assuming that an increase in the production of energy employing wind and solar technologies would produce demand for inputs from existing suppliers, states in Appalachia would be expected to experience growth of demand and expansion of employment in response to this development. Given that states in the region already account for more than a third of total national employment in key sectors supplying these two energy industries, we can expect that in the short term the region will gain a proportionate share of job growth due to increases in the utilization of solar and wind energy for the generation of electricity (Table 15) . Biofuels production including storage and distribution embodies many of the same attributes as oil and gas production. States in the ARC region are parts and equipment suppliers to the oil and gas industry. Given that the biofuels industry utilizes many of the same inputs to produce, store and transmit energy as the solar and wind and oil and gas industries (Table 14), growth in output of this sector can be expected to generate jobs in the region.

Table 15. Key Sectors in the Wind and Solar Energy Sectors
NAICS Code Description
3324 Boiler manufacturing
3325 Hardware manufacturing
3336 Engine, turbine, & transportation equipment manufacturing
3353 Electrical equipment manufacturing
3345 Measuring devices
3334 Ventilation
3315 Foundries
3326 Plastic and rubber products
3359 Other electrical and communications equipment manufacturing

Table 13. Employment in Key Sectors in the Wind and Solar Energy Sectors, States in the Appalachian Region
State 3324
3325
3336
3353
3345
3334
3315
3326
3359
Total
AL 1,357 843 1,307 773 2,176 2,045 7,932 17,341 2,683 36,457 MD 714 278 1,749 750 12,123 2,042 175 7,791 984 26,606 GA 2,535 1,214 2,158 4,981 3,120 7,014 1,778 27,749 6,681 57,230 KY 1,607 2,077 1,842 3,941 899 4,405 4,302 19,833 2,775 41,681 MS 1,916 1,431 965 4,967 795 4,036 620 9,849 750 25,329 NY 4,167 2,085 6,191 4,817 14,371 6,022 3,314 29,692 7,995 78,654 NC 1,535 2,719 4,198 8,636 4,012 5,577 1,448 39,870 10,559 78,554 OH 10,383 3,459 4,512 9,220 12,316 7,590 19,642 87,554 7,663 162,339 PA 4,963 2,409 1,962 5,359 14,371 5,851 11,038 45,927 11,959 103,839 SC 1,071 534 6,263 3,569 2,669 1,750 928 22,316 4,027 43,127 TN 2,205 3,669 1,562 5,101 3,544 9,543 4,175 32,391 3,207 65,397 VA 1,396 375 687 4,990 9,014 5,152 3,250 24,329 2,055 51,248 WV 455 55 55 347 522 55 375 3,826 375 6,065 US 87,234 56,766 91,856 146,860 403,693 152,354 171,769 921,392 161,228 2,193,152Source: Compiled by the authors

Table 14. % of US Employment in Key Sectors in the Wind and Solar Energy Sectors, States in the Appalachian Region
State 3324
3325
3336
3353
3345
3334
3315
3326
3359
AL 1.56 1.49 1.42 0.38 0.54 1.34 4.62 1.88 1.66MD 0.82 0.49 1.90 0.37 3.00 1.34 0.10 0.85 0.61GA 2.91 2.14 2.35 2.44 0.77 4.60 1.04 3.01 4.14KY 1.84 3.66 2.01 1.93 0.22 2.89 2.50 2.15 1.72MS 2.20 2.52 1.05 2.43 0.20 2.65 0.36 1.07 0.47NY 4.78 3.67 6.74 2.36 3.56 3.95 1.93 3.22 4.96NC 1.76 4.79 4.57 4.23 0.99 3.66 0.84 4.33 6.55OH 11.90 6.09 4.91 4.51 3.05 4.98 11.44 9.50 4.75PA 5.69 4.24 2.14 2.62 3.56 3.84 6.43 4.98 7.42SC 1.23 0.94 6.82 1.75 0.66 1.15 0.54 2.42 2.50TN 2.53 6.46 1.70 2.50 0.88 6.26 2.43 3.52 1.99VA 1.60 0.66 0.75 2.44 2.23 3.38 1.89 2.64 1.27WV 0.52 0.10 0.06 0.17 0.13 0.04 0.22 0.42 0.23Total 39.32 37.25 36.42 28.12 19.80 40.09 34.34 39.99 38.28Source: Compiled by the authors

Summary and Concluding Comments Centrally located within the Nation’s traditional industrial heartland, Appalachian states stand to gain significantly and for the foreseeable future from the expansion of energy and electrical power sources. Demand for non-renewable resources such as coal, natural gas, and oil is expected to expand assuming energy prices remain high. At the same time, job growth in the fossil fuel sector may be limited by the application of more productive mining practices at existing operations. There is some evidence that Appalachian coal may be at a disadvantage vis a vis western coal due to the higher sulfur content of Appalachian coal, lower production costs of western mines and reductions in the benefit of transportation costs which are becoming an ever smaller share of the delivered cost of coal, especially in instances where imported coal can reach recipient power plants along the Mississippi River. While there are certain limits to job growth due strictly to electrical power generation, the region’s coal reserves are an important feedstock for the production of metals, gases, and other industrial products. Sectors producing hardware for the energy industry are likely to experience growth of output in response to new demand for both renewable and non-renewable energy sources. It remains to be seen how the Nation addresses the challenges of carbon sequestration to limit CO2 emissions and how this will impact employment. While there will be growth of employment in technical fields associated with identifying and developing alternative means of sequestering CO2, there also are likely to be job losses associated with the decommissioning of aging production equipment, power plants, and reductions of other sources of CO2. Since the science of sequestration is presently in its infancy, estimates of impacts are limited at present. While federal initiatives to examine a range of short, medium and long term options, none of them are at the point of commercialization.

The creation of new energy supplies associated with renewable energy sources is likely to generate substantial new employment. Appalachia’s industrial base contributes major inputs to wind, solar, biofuels, and other non-fossil fuel sources. Estimates of future growth in these sectors are significant and some research suggests thousands of new jobs will be created as these sectors expand in and outside of the region. The research conducted for this report suggests Appalachia has a significant opportunity to contribute to both national energy independence and to the achievement of regional import substitution in the area of energy. There are significant opportunities for regional and community-scaled industrial development, especially in the areas of bio-fuels. Significant choices exist in the selection of a minimum scale of production for many of the new technologies and energy sources. Technologies in these fields are changing rapidly and dramatically. Thus planning for Appalachia’s energy future is dynamic and subject to change. This report is a first cut at an understanding of the energy potential of the Region. More sophisticated and more cumulative analyses are in order as part of the implementation of an energy blue print. All the evidence suggests Appalachian communities stand to gain from high energy prices, the development of new energy sources and technologies and the creation of solutions to reduce the nation’s CO2 emissions.

References Energy Information Agency. 2006. Annual Energy Outlook 2006 with Projections to 2030. http://www.eia.doe.gov/oiaf/aeo/coal.html Environmental Protection Agency. 2006. Climate Leaders. http://www.epa.gov/stateply/partners/partners/generalmotorscorporation.html Accessed 7/12/06 Renewable Energy Policy Project. 2001. The Work That Goes into Renewable Energy. http://www.repp.org/articles/static/1/binaries/LABOR_FINAL_REV.pdf General Accounting Office. 2004. Renewable Energy: Wind Power’s Contribution to Electrical Energy Generate and Impact on Farms and Communities. http://www.gao.gov/new.items/d04756.pdf Renewable Energy Policy Project. 2001. The Work That Goes Into Renewable Energy. Renewable Energy Policy Project. 2004. Wind Turbine Development: Location of Manufacturing Activity. Renewable Energy Policy Project. 2005. Solar PV Development: Location of Economic Activity. Union of Concerned Scientists. 2004. Renewing America’s Economy. 12 State-Specific Reports. The Apollo Alliance. 2004. New Energy for America. The Apollo Jobs Report: Good Jobs and Energy Independence. US PIRG Education Fund. 2005. Redirecting America 's Energy: The

Economic and Consumer Benefits of Clean Energy Policies. The Council of State Governments. May 2003. Renewable Energy and State Economies http://www.irecusa.org/articles/static/1/1140213597_987094287.html State-Specific Reports Daniel M. Kammen, Kamal Kapadia & Matthias Fripp. April 2004. Putting Renewables to Work: How Many Jobs Can the Clean Energy Industry Generate? The Renewable and Appropriate Energy Laboratory at University of California, Berkeley. Environment California Research & Policy Center. 2003. Renewable Energy and Jobs: Employment Impacts of Developing Markets for Renewables in California . Renewable Energy Policy Project State Report (REPP). 2005. Component Manufactu ing: Ohio’s Future in the Renewable Energy Industryr . Renewable Energy Policy Project State Report (REPP). 2006. Component Manufacturing: Wisconsin’s Future in the Renewable Energy Industry. University of Illinois at Chicago. 2005. The Economic and Environmental Impacts of Clean Energy Development in Illinois Policy Matters Ohio and the Apollo Alliance. 2005. Generating Energy, Generating Jobs Regional Economics Applications Laboratory for the Environmental Law & Policy Center. 2001. Job Jolt: The Economic Impacts of Repowering the Midwest. Dave Algoso and Emily Rusch. 2004. Renewable Work: Job Growth from Renewable Energy Development in the Mid-Atlantic. NJPIRG Law and

Policy Center, Center for Energy, Economic and Environmental Policy at Rutgers. 2004. Economic Impact Analysis of a 20% New Jersey Renewable Portfolio Standard. Global Insight . 2003. Economic Impact Analysis of the Cape Wind Off-Shore Renewable Energy Project, for Cape Wind Associates. Black & Veatch. 2004. Economic Impact of Renewable Energy in Pennsylvania. The Community Foundation for the Alleghenies. Virtus Energy Research Associates. 2002. What Renewable Energy Means to Texas.