economic costs of esrd
Post on 28-Dec-2016
212 views
TRANSCRIPT

ELEVEN Economic
Costs ofESRD
Resist beginnings; the prescription comes too late when the disease has gained strength by long delays. Ovid, Retnedia Amoris
American Journal of Kidney Diseases, Vol 36, No 6, Suppl 2 (December), 2000: pp S163-S176

S i 6 4 · 2 0 0 0 A T L A S O F E S R D I N T H E U N I T E D S T A T E S
Driven predominantly by recent growth in the ESRD patient population, total Medicare expenditures for the ESRD program have been increasing steadily, from $5 billion in 1991 to $12 billion in 1998. The total Medicare ESRD program cost is projected to more than double in the next ten years, surpassing $28 billion by the year 2010 (fig 11.1).
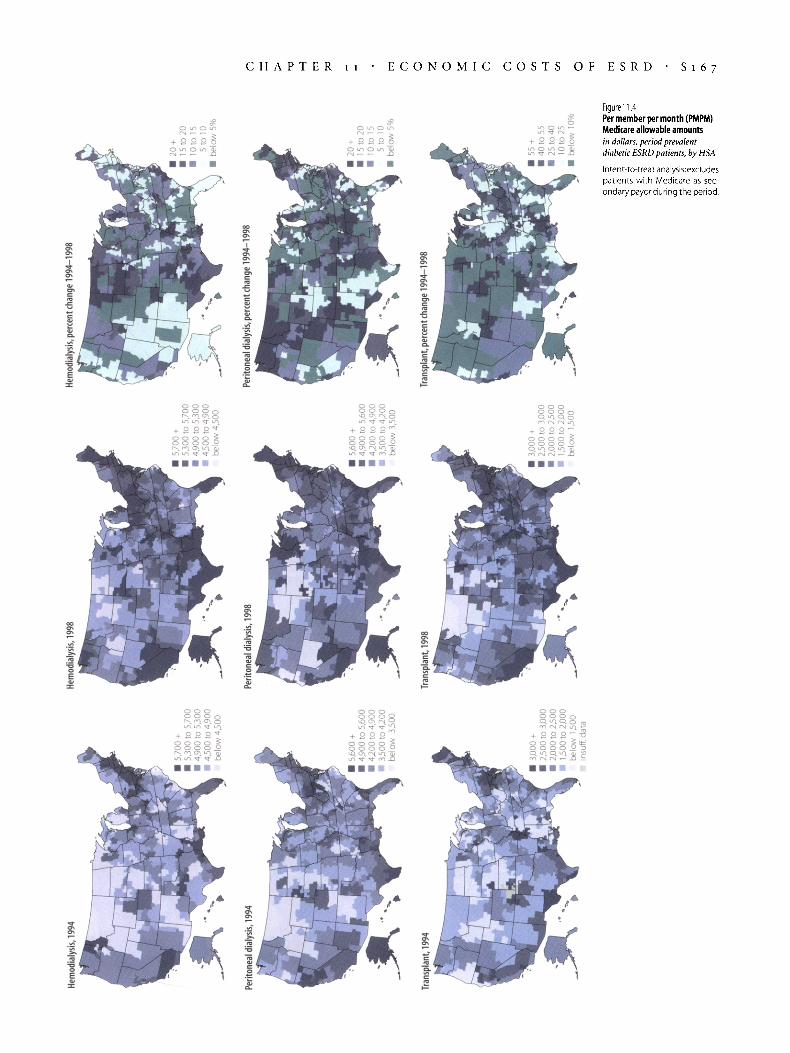
Part A per patient costs, calculated using an in-tent-to treat- model developed by the USRDS (see Appendix A), increased across all treatment modalities from 1994 to 1998—10%, 14%, and 13% for diabetic hemodialysis, peritoneal dialysis, and transplant patients, and 9%, 22%, and 30% for non-diabetic patients on the same modalities (fig 11.2, table 11.1). Increases in physician/supplier
All data underlying the costs (Part B) were highest for diabetic (34%) and non-diabetic (46%) transplant patients (fig 11.3,
figures in this chapter, table 11.2). Geographic representations of Medicare allowable amounts show increases in most
as well as additional related areas of the country for all treatment modalities and for diabetic and non-diabetic patients (fig
data, may be viewed & 11.2—3).
downloaded at Calculated through a method developed by HCFA (see Appendix A for a description), the
www.usrds.org. rate of total admissions per 100 dialysis patient years at risk was stable from 1994 to 1998 (table 11.3). The number of vascular access admissions decreased 17% compared to 1994, while the number of admissions in 1998 increased 10% for diseases of the circulatory system, 23% for respiratory dis
figure 11.1 eases, a n d 2 2 % for i n -Estimated total Medicare costs for ESRD projected to 20W fectious diseases. The
1990 1994 1998 2002 2006 2010
decreasing number of hospital admissions for vascular access is also apparent in Part B spending (fig 11.9), in which the costs of vascular access procedures have increased in the outpatient setting.
Medicare expenditures (also calculated using the HCFA method) for 1994-1998 show an average annual increase of 7.6% but remained relatively steady between 1997 and 1998, with transplant costs decreasing 6.6% (table 11.4). Expenditures per patient year at risk have increased at an average annual rate of 2.1%, but show a decline between 1997 and 1998 for all of the patient groups reported (table 11.5).
A breakdown of expenditures per patient month by hematocrit group shows a clear trend in both hemodialysis and peritoneal dialysis, with costs decreasing as hematocrit levels increase (figs 11.6— 7). Hemodialysis therapy, as measured by the urea reduction ratio (URR), shows a similar trend in which costs decrease as therapy increases (fig 11.8); these costs, however, flatten out at URRs of 70% and above.
Procedures performed by radiologists now account for almost 30% of Part B spending for vascular access services (fig 11.10), and the associated costs have increased accordingly (fig 11.11). Since 1991, costs have also increased dramatically for permanent catheter insertions, angioplasties, vascular access complications, and stents (figs 11.12-14).
Included in this chaptc
♦ Tables of Medicare Part A and B payments by age group and diabetic status, of Medicare ESRD inpatient utilization by diagnosis, and of Medicare ESRD program expenditures
« Maps of PMPM Medicare allowable amounts for diabetic and non-diabetic patients
♦ Graphs of allowable PMPM costs by hematocrit group
♦ Graphs of Part B spending for services and physician specialties, and graphs of total Part A and B payments by modality

C H A P T E R 11 · E C O N O M I C C O S T S O F E S R D · S 1 6 5
50
45
40
35
Diabetic
'Ξ 30 -
25
20
15
10
Non-diabetic
1 Hemodialysis ■ Peritoneal dialysis ■ Transplant
Figure 11.2 Part A Medicare payments dollars per year at risk, period prevaknt ESRD patients
Intent-to-treat ana lysis; excludes patients with Medicare as secondary payor during the period.
Reference: derived from Tables K.4andK.10.
1994 1995 1996 1997 1998 1994 1995 1996 1997
Age 1994 All
0 -19 20-44 45-64 65-74 75 +
1995 All 0 -19 20-44 45-64 65-74 75 +
1996 All 0 -19 20-44 45-64 65-74 75 +
1997 All 0 -19 20-44 45-64 65-74 75 +
1998 All 0 -19 20-44 45-64 65-74 75 +
Hemodialysis Payment ($)
DM 43,685
« 44,677 42,573 44,203 44,929
45,911
* 46,240 44,594 46,535 47,676
49,078
* 48,446 47,663 49,790 51,179
49,419
* 48,030 47,661 50,202 52,280
48,207
* 46,216 47,090 48,813 50,037
NDM 37,993 38,985 35,300 36,200 39,725 40,719
39,845 41,508 36,374 37,786 41,733 43,034
41,675 37,633 37,455 39,532 43,454 45,414
42,176 37,999 37,558 39,735 44,322 45,969
41,571 36,816 37,170 39,522 43,605 44,619
YAR DM
32,799
* 3,303
13,322 11,703 4,466
34,430
« 3,207
13,581 12,557 5,078
38,023
* 3,272
14,669 13,957 6,118
42,318
* 3,328
16,217 15,365 7,400
45,960
* 3,336
17,339 16,635 8,646
NDM 61,078
434 12,476 18,186 16,089 13,893
60,130 316
11,678 17,733 15,752 14,651
61,128 293
11,402 17,798 15,771 15,863
62,815 279
11,537 18,117 15,848 17,034
63,990 266
11,362 18,094 15,942 18,326
Peritoneal dialysis Payment ($)
DM 36,230
* 34,974 36,674 36,557 36,067
40,523
* 39,346 40,564 41,077 41,326
42,414
* 40,145 42,813 42,648 44,507
43,792
* 41,058 43,207 46,010 44,250
41,256
* 38,913 41,573 41,829 41,823
NDM 28,462 30,972 26,873 27,640 29,449 31,904
32,769 35,760 30,737 32,073 33,892 36,059
34,759 37,062 32,466 34,460 35,176 38,528
35,473 32,652 33,371 34,396 37,580 38,496
34,706 32,156 33,432 33,603 35,985 37,286
YAR DM
5,165
» 1,172 2,246 1,421
326
5,134
* 1,077 2,198 1,484
374
5,300
* 979
2,289 1,596
436
5,283
* 890
2,304 1,598
491
4,986
* 790
2,146 1,518
531
NDM 11,040
353 3,187 3,548 2,646 1,306
10,533 266
2,931 3,380 2,540 1,415
10,134 249
2,726 3,228 2,432 1,498
9,565 229
2,534 3,070 2,225 1,507
8,704 183
2,248 2,791 2,013 1,469
Transplant Payment ($)
DM 21,183
* 20,542 21,697 23,792
* 22,792
* 22,588 22,696 25,357
* 24,853
* 24,313 25,372 25,069 20,023
25,292
* 24,228 26,152 26,184 35,840
24,012
* 23,145 24,637 24,959 26,516
NDM 14,428 16,316 14,151 14,421 14,527 15,382
16,515 18,088 16,441 16,378 16,691 13,833
17,936 18,987 18,151 17,796 17,155 17,817
18,601 19,863 18,648 18,914 17,068 16,443
18,728 20,203 18,948 18,634 17,901 17,267
YAR DM
8,417
* 4,495 3,540
371
* 9,188
* 4,700 3,993
483
* 9,801
* 4,790 4,391
598 17
10,366
* 4,826 4,799
709 27
10,878
• 4,809 5,197
830 38
NDM 26,063
1,551 11,635 10,509 2,243
125
28,964 1,681
12,921 11,570 2,635
157
31,288 1,759
13,804 12,504 2,990
231
33,308 1,758
14,532 13,376 3,324
318
35,283 1,752
15,118 14,321 3,694
398
Table 11.1 Part A Medicare payments by age group dollars per year at risk, period prevalent ESRD patients
Intent-to-treat analysis;excludes patients with Medicare as secondary payor during the period.
Reference: derived from Tables K.4andK.10.
* insufficient data YAR = Years at risk

S i 6 6 · 2 0 0 0 A T L A S O F E S R D I N T H E U N I T E D S T A T E S
Figure 11.3 Part B Medicare payments dollars per year at risk, period prevalent ESRD patients
Intent-to-treat ana lysis; excludes patients with Medicare as secondary payor during the period.
Reference: derived from Tables K.4andK.10.
14 Diabetic
12 -
Ϊ5 6
Hemodia lysis Peritoneal dialysis Transplant
Non-diabetic
1995 1996 1997 1995 1996 1997
Table 11.2
Part B Medicare payments by age group dollars per year at risk, period prevalent ESRD patients
Intent-to-treat analysis;excludes patients with Medicare as secondary payor during the period.
Reference: derived from Tables K.4andK.10.
1994
1995
1996
1997
1998
* Insuffic
Age All 0 -19 20-44 45-64 65-74 75 +
Al! 0 -19 20-44 45-64 65-74 75 +
All 0 -19 20-44 45-64 65-74 75 +
All 0-19 20-44 45-64 65-74 75 +
All 0 -19 20-44 45-64 65-74 75 +
ent data Y
Hemodia ly sis Payment ($)
DM 10,966
* 10,642 10,291 11,259 12,463
11,408
* 10,806 10,691 11,797 12,753
11,404
* 10,958 10,798 11,688 12,447
11,239
* 10,834 10,622 11,471 12,297
11,032
* 10,539 10,529 11,296 11,724
NDM 8,751 7,176 6,900 7,995 9,533
10,549
9,102 7,561 7,292 8,256 9,979
10,660
9,182 7,742 7,434 8,322 9,896
10,723
9,025 7,655 7,203 8,136 9,713
10,589
8,813 7,036 7,074 7,980 9,600
10,057
AR - Years at risk
YAR DM
32,799
* 3,303
13,322 11,703 4,466
34,430
* 3,207
13,581 12,557 5,078
38,023
* 3,272
14,669 13,957 6,118
42,318
* 3,328
16,217 15,365 7,400
45,960
* 3,336
17,339 16,635 8,646
NDM 61,078
434 12,476 18,186 16,089 13,893
60,130 316
11,678 17,733 15,752 14,651
61,128 293
11,402 17,798 15,771 15,863
62,815 279
11,537 18,117 15,848 17,034
63,990 266
11,362 18,094 15,942 18,326
Peritoneal dialysis Payment ($)
DM 12,661
* 12,472 12,564 12,957 12,684
12,817
* 13,058 12,519 12,906 13,514
13,060
* 12,901 12,925 13,217 13,556
13,206
* 12,940 12,918 13,717 13,381
13,368
* 12,967 13,164 13,881 13,332
NDM 10,557 11,426 " 9,780 10,750 11,102 10,584
10,645 11,494 9,693
10,740 11,248 11,145
10,828 11,641 9,912
10,657 11,486 11,649
10,843 11,484 9,903
10,521 11,562 11,920
11,098 12,159 10,476 10,413 11,770 12,302
YAR DM
5,165
* 1,172 2,246 1,421
326
5,134
* 1,077 2,198 1,484
374
5,300
* 979
2,289 1,596
436
5,283
* 890
2,304 1,598
491
4,986
* 790
2,146 1,518
531
NDM 11,040
353 3,187 3,548 2,646 1,306
10,533 266
2,931 3,380 2,540 1,415
10,134 249
2,726 3,228 2,432 1,498
9,565 229
2,534 3,070 2,225 1,507
8,704 183
2,248 2,791 2,013 1,469
Transplant Payment ($)
DM 5,076
* 4,922 5,222 5,539
* 5,780
* 5,738 5,799 6,016
* 6,124
* 6,059 6,182 6,134 6,141
6,595
* 6,552 6,639 6,551 8,066
6,801
* 6,607 6,909 7,179 7,374
NDM 3,432 3,164 3,273 3,493 4,038 3,997
4,109 3,838 3,990 4,132 4,633 4,186
4,431 4,080 4,429 4,420 4,605 4,782
4,794 4,396 4,851 4,774 4,840 4,533
5,014 4,569 5,098 4,946
- 5,098 5,158
YAR DM
8,417
* 4,495 3,540
371
* 9,188
* 4,700 3,993
483
* 9,801
* 4,790 4,391
598 17
10,366
* 4,826 4,799
709 27
10,878
* 4,809 5,197
830 38
NDM 26,063
1,551 11,635 10,509 2,243
125
28,964 1,681
12,921 11,570 2,635
157
31,288 1,759
13,804 12,504 2,990
231
33,308 1,758
14,532 13,376 3,324
318
35,283 1,752
15,118 14,321 3,694
398
C H A P T E R 11 · E C O N O M I C C O S T S O F E S R D · S 1 6 7
-Figure 11.4 Per member per month (PMPM) Medicare allowable amounts in dollars, period prevalent diabetic ESRD patients, by HSA
Intent-to-treat analysis;excludes patients with Medicare as secondary payor during the period.
0 0 0 O O O o r>_ rn σ\ 0 U"i" Ι/ί Tj-" LO
+ g o o 't o o o o § o o o o _2 fS. T . 0\ u\ \-ri u-i ^t Tf
0 0 0 O O O o Q. U~L Q. o ΓΟ ΓΝ (M L-
0 0 0 O O O o r>. ΓΤ\ ON o ui Ln -̂ J- LO
+ Q Q Q ^f O O O O 5 O O O O _0 Ν Γ Ο Ο Μ Λ φ u-ϊ iW -=t -Φ -Q
O O O „ O O O O Ό CTi ΓΝ O
0 0 o o o o % o o o o _° "-Q. CJ\ <"S. U\ (Li i n ^ -^- ro -Q
O O O O O O o r o i M i M ι η ^

Hem
odial
ysis,
perc
entc
hang
e199
4-19
98
0"0
:::>
Q>
:::>
~~.~
~a~
~:;s
:o
~.
fD~
:::rQ
>Q
.~
C;;
:Q
>~.
/l)
::J:Ja.~
lOR
·';5i
~~~.
16
e:[
5':=g
5.p
-r;'
Irn
~5'
~"'V:n
:i"~z.!lt'@
R~~·9~
a:l"
...~
eEl"
"!!
.If
v.
"":l
.fj
..2.
...~
::.""
5!::
I9
~...
0
F;S
;e.
~!fg-=a
:J::;a~
~~
~
en 0
00 t-.l o o o :> ..., r' :> en o 'Tl
tTl en :;>;i t:I z c: z..., :r: tTl
en ..., :> ..., tTl
en..., tTl
t:I
Perit
onea
ldial
ysis,
perc
entc
hang
e199
4-19
98
Tran
splan
t,per
cent
chan
ge19
94-1
998
.4,5
00
+•
4,00
0to
4,50
0•
3,50
0to
4,00
0•
3,00
0to
3,50
0be
low
3,00
0*'
IIIin
suff.
data
Perit
onea
ldial
ysis,
1998
Tran
splan
t,199
8Tr
ansp
lant,
1994

CHAPTER 1 1 ECONOMIC COSTS OF E S R D S 1 6 9
Table 113Medicare ESRD inpatient
Genitour. Endocrine I Resp. Infect. utilization by principal diagnosis1994 causes disease metabolic disease disease period prevalent dialysis
Total 207 47 18 10 18 13 9 patients, 1994 & 1998
Excludes patients with MedicareAge as secondary payor during the
Under 15 508 232 44 22 22 26 8 8 5 period.
15 - 24 3,145 167 39 28 17 12 15 10 8 Methods used in this table are25 - 34 10,489 185 39 30 19 10 26 11 9 taken from the HCFA Research35 -44 19,092 177 38 33 18 8 22 10 9 Report on End-Stage Renal Dis-45 - 54 26,096 175 39 38 18 7 19 10 7 ease, 1993-1995 (publication55 -64 37,547 190 43 48 18 7 18 12 8 number 03393). Because these
65 -74 57,746 231 53 65 19 12 17 15 9 methods differ from those used
75+ 36,277 246 60 68 20 15 12 19 11 throughout the rest of the An-nual Data Report,direct campar!-
Female 93,163 218 51 53 20 10 19 13 9 sons to other data should not be
Male 97,737 196 43 50 17 10 17 13 9made.
White 109,548 217 45 57 19 12 19 15 9
Black 72,427 198 51 46 18 8 17 12 9
Native American 2,906 202 44 38 15 10 25 16 10
Asian 5,454 133 33 34 10 6 10 9 5Other/unknown 565 145 38 37 12 10 11 8 7
Primary diagnosis
Diabetes 62,002 243 54 58 18 9 35 13 10
Hypertension 58,027 209 50 61 19 10 11 15 8
Glomeru lonephritis 23,685 166 37 40 18 10 8 12 7
Polycystic kidney 5,779 145 33 32 18 9 7 8 6
Other urologic 3,469 179 48 32 15 20 8 12 8
Other cause 17,487 201 43 38 21 14 10 16 12
Unknown cause 7,914 191 46 44 19 13 10 14 8
Not reported 12,537 165 38 39 15 7 13 11 7
1998Total 238,466 210 39 57 18 9 17 16 11
AgeUnder 15 457 193 36 29 25 23 7 6 1015 - 24 3,070 153 35 30 15 10 10 7 7
25 - 34 10,872 173 35 32 16 8 21 10 11
35 -44 22,383 179 35 37 17 7 20 11 11
45 - 54 34,046 175 34 42 17 6 18 11 9
55 ·64 45,842 193 36 52 17 6 18 13 965 -74 68,484 236 43 70 .18 11 17 18 12
75+ 53,312 251 47 76 18 14 12 23 13
Female 115,047 224 43 60 19 10 18 16 12
Male 123,419 197 36 54 16 9 15 15 10
White 133,544 224 38 63 18 11 18 18 11
Black 89,596 198 42 51 18 7 15 13 11
Native American 4,101 209 42 42 16 10 24 18 10
Asian 7,455 146 30 40 12 5 10 13 7
Other/unknown 3,770 193 43 49 17 7 19 15 10
Primary diagnosisDiabetes 88,436 245 46 65 17 9 31 16 13
Hypertension 64,401 208 40 66 18 9 9 17 10Glomerulonephritis 25,170 167 31 44 17 8 7 14 8
Polycystic kidney 5,747 151 26 37 16 8 6 11 9
Other urologic 4,308 185 39 38 15 20 6 15 10Other cause 21,048 219 38 48 21 14 8 18 16
Unknown cause 8,696 199 39 52 18 13 8 18 10Not reported 20,660 155 29 39 15 5 13 11 8

S 1 7 0 2 0 0 0 ATLAS OF E S R D IN THE UNITED STATES
Table 11.4Medicare ESRD program Percent Average annualexpenditures distribution percent changeperiod prevalent patients Treatment Group 1994 1995 1996 1997 1998 1998 1994-1998
Methods used in this table are Total
taken from the HCFA Research Number of patients 292,981 313,667 335,850 356,949 374,520 100.0 6.3
Report on End-Stage Renal Dis- Total expenditures (millions) 8,277.7 9,227.0 10,343.8 11,081.2 11,108.7 ldo.o 7.6ease, 1993-1995 (publication Inpatient 3,4781 3,779.4 4,196.9 4,SOS.3 4,426.8 398 6.2number 03393). Because these Outpatient 2,841.9 3,186.1 3,632.5 3,855.4 4,028.2 36.3 9.1methods differ from those used Physician/Supplier 1,623.6 1,807.3 1,938.5 2,053.4 2,077.2 18.7 6.4throughout the rest of the An- Home Health 213.1 284.7 342.3 374.3 259.6 2.3 5.1nual Data Report,direct compari- Skilled Nursing 113.4 160.8 223.6 280.8 303.6 2.7 27.9sons to other data should not be
Hospice 7.7 8.5 100 12.0 13.4 0.1 150made.
DialysisNu mber of patients 229,247 247,845 267,239 284,807 299,069 799 6.9
Total expenditures (millions) 7,131.8 8,022.3 9,062.3 9,727.6 9,788.1 100.0 8.2Inpatient 2,665.7 2,949.1 3,325.4 3.602.7 3,554.0 36.3 7.5
Outpatient 2,711.3 3,048.3 3,481.4 3,697.1 3,872.4 396 9.3
Physician/Su pplier 1,446.7 1,605.3 l.722.4 1,808.4 1,823.3 18.6 60
Home Health 191.9 257.2 310.0 339.9 235.1 2.4 5.2
Skilled Nursing 108.9 154.3 213.7 268.3 290.6 3.0 27.8
Hospice 7.3 8.2 9.5 11.0 126 0.1 14.7
TransplantNu mber of patients 10,424 9,729 9,849 9,802 9,800 2.6 -1.5
Total expenditures (millions) 701.2 710.8 731.5 735.0 686.2 100.0 -0.5
Inpatient * 543.5 S41.0 553.2 552.5 517.4 75.4 -1.2
Outpatient 73.7 78.7 84.5 85.8 81.5 119 2.5
Physician/Supplier 78.7 84.4 85.6 88.1 809 11.8 0.7
Home Health 4.8 5.7 6.8 6.7 4.6 0.7 -1.1Skilled Nursing 0.5 1.0 1.5 1.9 1.8 0.3 37.5
Hospice 0.0 0.0 0.0 0.0 0.0 0.0
Functioning GraftNumber of patients 50,889 53,432 55,961 59,486 62,611 16.7 5.3
Total expenditures (millions) 351.8 398.7 445.5 502.8 5178 100.0 10.1
Inpatient 213.8 233.2 257.1 280.9 287.4 55.5 7.7Outpatient 37.2 39.5 44.2 48.8 480 9.3 6.6
Physician/Supplier 82.1 100.6 113.1 1376 153.5 29.6 16.9
Home Health 15.0 20.3 23.5 25.5 18.6 3.6 5.6
Skilled Nursing 3.4 4.8 7.2 9.1 9.6 1.8 29.5
Hospice 0.4 0.4 0.5 0.9 0.7 01 18.8
Graft FailureNumber of patients 2,421 2,661 2,801 2,854 3,040 0.8 5.9
Total expenditures (millions) 92.8 95.3 104.4 1158 116.6 100.0 5.9
Inpatient 55.1 56.2 61.3 69.2 679 58.3 5.4
Outpatient 19.6 19.7 22.4 23.6 26.2 22.5 7.5
Physician/Su ppl ier 16.1 17.0 17.5 19.3 19.4 16.7 4.8
Home Health 1.4 1.6 2.0 2.2 1.3 1.1 -2.1
Skilled Nursing 0.6 0.7 1.2 1.5 1.7 1.5 29.4Hospice 00 00 0.0 0.0 0.0 0.0 33.6
* Includes Estimated Organ Acquisition Cost (S25,OOO per transplant event)

CHAPTER 1 1 ECONOMIC COS T S OF E S R D S 1 7 1
Table 11.5Average annual Medicare ESRD programpercent change expenditures per patient year at
Treatment Group 1994 1995 1996 1997 1998 1994 -1998 risk
Total period prevalent patients
Number of patients 239,036 253,216 270,773 289,394 300,373 5.9 Patients with Medicare as a sec-Total expenditures ($) 41,258 43,247 45,434 46,212 44,800 2.1 ondary payor are excluded.
Inpatient 16,715 17,156 17,898 18,289 17,364 1.0 Methods used in this table are
Outpatient 14,647 15,365 16,370 16,479 16,651 3.3 taken from the HCFA Research
Physician/Supplier 8,193 8,551 8,583 8,606 8,412 0.7 Report on End-Stage Renal Dis-
Home Health 1,079 1,357 1,529 1,585 1,062 -0.4 ease, 1993-1995 (publication
Skilled Nursing 583 777 1,009 1,202 1,255 21.1 number 03393). Because these
Hospice 40 41 45 51 55 8.7methods differ from those usedthroughout the rest of the An-
Dialysisnual Data Report,direct compari-sons to other data should not be
Number of patients 190,900 202,430 216,461 230,478 238,466 5.7 made.Total expenditures ($) 46,371 48,809 51,521 52,650 51,341 2.6
Inpatient 17,316 17,939 18,895 19,493 18,634 1.9Outpatient 17,680 18,572 19,811 20,028 20,335 3.6Physician/Supplier 9,377 9,746 9,780 9,772 9,546 0.4Home Health 1,242 1,563 1,764 1,842 1,234 -0.2Skilled Nursing 707 940 1,216 1,4S5 1,526 21.2Hospice 48 50 54 60 66 86
TransplantNumber of patients 6,185 6,013 6,239 6,400 6,117 -0.3Total expenditures ($) 92,106 95,877 95,908 96,006 93,148 0.3
Inpatient' 68,485 70,372 70,032 69,788 67,232 -0.5Outpatient 11,234 11,945 12,412 12,421 12,593 2.9Physician/Supplier 11,578 12,545 12,257 12,549 12,339 16Home Health 733 869 993 979 709 -D.8Skilled Nursing 76 147 211 269 274 37.8Hospice 0 1 3 0 1
Functioning GraftNumber of patients 39,963 42,715 45,866 . 50,242 53,400 7.5Total expenditures ($) 8,703 9,354 9,737 10,104 9,849 3.1
Inpatient 5,287 5,477 5,616 5,642 5,472 09Outpatient 926 930 970 984 915 -0.3Physician/Supplier 2,022 2,347 2,462 2,760 2,908 9.5Home Health 373 478 519 513 357 -1.1
Skilled Nursing 84 114 160 186 182 21.2Hospice 9 8 11 19 14 10.7
Graft FailureNumber of patients 1,988 2,058 2,207 2,274 2,390 4.7Total expenditures ($) 46,438 45,758 47,622 51,389 49,364 1.5
Inpatient 27,660 26,992 28,018 30,781 28,760 1.0Outpatient 9,781 9,517 10,183 10,473 11,113 3.2Physician/Supplier 7,983 8,102 7,931 8,496 8,186 0.6Home Health 715 787 905 983 548 -6.4Skilled Nursing 292 356 573 647 738 26.1Hospice 7 5 13 9 19 27.8
* Includes Estimated Organ Acquisition Cost ($25,000 per transplant event)

S 1 7 2 2000 ATLAS OF E S R D IN THE UNITED STATES
Figure 11.6Unadjusted allowable permember per month (PMPM)costs by hematocrit grouphemodialysis patients, 1998 7
The percent change from the~
-0
baseline PMPM for a hematocrit § 6
of <27% ($6,944) is noted next::J0
to the green lines. £5,<;
Because the results in figures 011.6-11.8 are not adjusted for ::;;;
4"'-age, gender, race, renal diagno- ::;;;
"'-sis, or hematocrit level/U RR, they Q)
:0 3shou Id be viewed with some '"caution. Financial data tends not
:;.Q
to be normally distributed, and;;;
2-0
mean data is infiuenced by the g(higher cost of outlier patients. ::J
'6''"c:::>
0<27 27-<30 30-<33 33-<36 36+
Hematocrit (%)
Figure 11.7Unadjusted allowable permember per month (PMPM)costs by hematocrit groupperitoneal dialysis patients, 1998 6
The percent change from the -1S
baseline PMPM for a hematocrit §::J
of <27% ($4,918) is noted next 0
to the green lines.£.S:
For further information see the 0 4
article by Collins et al. in the::;;;"'-
American Journal of Kid ney Dis- ::;;;"'- 3
ease, 2000. Q)
:0'":;
.Q 2;;;-0
Q)
t:::J
'6''"c:::>
0<27 27-<30 30-<33 33-<36 36+
Hematocrit (%)
Figure 11.8Unadjusted allowable permember per month (PMPM)costs by urea reduction ratio(URR) 6
hemodialysis patients, 1998 '"-0c
The percent change from the ~ 5::J
baseline PMPM for a URR of 0
<60% ($5,909) is noted next to£.S:
the green lines. 0 4::;;;"'-::;;;"'- 3ll!:0'":;
.Q 2'"-0
g(::J
~C
:::>
0<60 60-<65 65-<70 70-<75 75+
Urea reduction ratio (%)

CHAPTER 11 ECONOMIC COSTS OF ESRD S 1 7 3
80
6001c:i5c:<lJsr
40'0C<lJ~<lJ
Cl.
20
o
Figure 11.9Part Bspending for vascularaccess services by place of serviceESRD patients
_1991_ 1992
_ 1993
_1994
_1995_ 1996
_1997
_1998
Inpatient Outpatient Emergency
o
Figure 11.10Part Bspending for vascularaccess services by physicianspecialty
80 ESRD patients-1991-1992-199360 -1994
01 -1995c:i5 -1996c:<lJ -19975t~ 40 -19980
C<lJUQj
Cl.
20
Surgeon Radiologist Anesthesiologist Nephrologist Other
4
_ Surgery
-.- Radiology_ Anesthesiology_ Nephrology
Figure 11.11Change in Part Bspending forvascular access services byphysician specialtyESRD patients
Value is normalized to 1991 ,andthe natural log of the value isplotted.
1991 1992 1993 1994 1995 1996 1997 1998

S 174 2000 ATLAS OF ESRD IN THE UNITED STATES
1.5
1.0<VOJ
-;0>
-0<V.t:!-;0 0.5E0c05
0.0
Figure 11.12Change in Part Bspending forvascular access insertionsESRD patients
Values are normalized to 1991,and the natural logs are plotted. - Number of patients
__ Permanent internal catheter costs
- Permanent catheter costs_ Temporary catheter costs
-0.5 -L-_-L -'----- -L -'----- ----'- -'---- ----'- -'----~
1991 1992 1993 1994 1995 1996 1997 1998
Figure 11.13Change in Part Bspending forangioplastyESRD patients
Values are normalized to 1991,
and the natural logs are plotted.
8
6
- Number of patients__ Angioplasty costs
1991 1992 1993 1994 1995 1996 1997 1998
Figure 11.14Change in Part Bspending forvascular access complicationsESRD patients
Values are normalized to 1991,and the natural logs are plotted.
08
0.6<VOJ
-;0>
-0<VN
~ 0.4EocoC-J
0.2
_ Number of patients
__ Declot costs
- Revision costs
0.0 --'--- =------'-----------'------'-----------'------'----------'------'-----1991 1992 1993 1994 1995 1996 1997 1998

CHAPTER 11 ECONOMIC COSTS OF ESRD S 1 7 5
2.5
2.0
Q):J
~
'" 1.5Q)to!;0E0
1.0c0S
0.5
0.0
__ Numberofpatients__ 5tent costs
Figure 11.15Change in Part Bspending forstentsESRlJ patients
Values are normalized to 1991,and the natural logs are plotted.
1993 1994 1995 1996 1997 1998
10..L_-L --.L ---l.. ----l L- .L.- -'-- ...L.-_
Figure 11.16Total Medicare Part Apaymentsper patient year at riskby modality
Part Apayments in 1991 ,and thepercent change in payments between 1991 and 1998,areshownin the legend.
As-treated model; patients withMedicare as secondary payor areexcluded.
...
•
•
•
•••••
-- Hemodialysis ($34,277, 29,8%)__ Peritoneal dialysis ($24,173,31.9%)__ Transplant ($11,724,10.4%)
•
-----------.------
50
~ 40~:Jo-5~~ 30."
1991 1992 1993 1994 1995 1996 1997 1998
figure 11,17Total physidan/supplier (Part BIpayments per patient year at riskby modality
14 __ Hemodialysis ($9,059, 4.4%) Part Bpayments in 1991,and the~ __ Peritoneal dialysis ($11,056,20,9%) percent change in payments be-eu
12 __ Transplant ($3,305, 31.5%) tween 1991 and 1998,are shown'0in the legend.-0
~ As-treated model; patients with'S 10 • Medicare as secondary payor are0 •-5 • • • excluded.0.~ 8~
"<iOJQ) 6'"'Q;a-
t: • •Q) 4 • •E - • •'"' •'""'-
1991 1992 1993 1994 1995 1996 1997 1998