economic correlates of populist attitudes: an analysis of ... · economic correlates of populist...
TRANSCRIPT
Economic correlates of populist attitudes: An analysis of nine European countries
Eva Anduiza Guillem Rico
Universitat Autònoma de Barcelona
Work in progress January 2016
Results presented in this paper have been obtained within the project “Living with Hard Times: How Citizens React to Economic Crises and Their Social and Political Consequences” (LIVEWHAT). This project is funded by the European Commission under the 7th Framework Programme (grant agreement no. 613237).
Introduction Despite the recurrent impression that populism is enhanced in times of economic hardship, not much empirical research has actually been done on the antecedents of populist attitudes among voters, and the question of the specific role of economic factors remains open. This paper examines the extent to which economic recession affects individuals’ adoption of populist attitudes in nine European countries in the wake of the Great Recession. The study focuses on explaining individual variation on populist attitudes and not support for populist parties as many previous works have done. Understanding how populist attitudes are forged is fundamental, as these constitute the breeding ground from which vote choice for populist parties may (or may not) result. We distinguish three different, interrelated aspects of economic hardship that are expected to foster the development of populist attitudes at the individual level: vulnerability, deprivation and negative sociotropic perceptions. Our data show large variation in these variables, both across countries and across individuals within countries. We find effects of all these three individual aspects, with some relevant cross-national differences particularly for the effect of the indicators of vulnerability. However the intensity of the effects of these three dimensions of economic hardship is not the same. Our analysis suggests that the main explanation for populist attitudes is not the vulnerability or the economic hardship suffered by the people, but rather the perceptions that citizens have about the economic situation. The paper is structured as follows. First we discuss the choice of populist attitudes as dependent variable within the literature on populism and populist parties vote choice. Second, we present the economic sources of populist resentment and our hypotheses. In section 3 we describe our data and methods. Finally, in section 4 we present the results.

2
Populism, populist attitudes, and support for populist parties One of the major hurdles in the quest for explaining the rise of populism has certainly been the many, sometimes divergent, and often hardly specified meanings that the concept has been given, not only within the academia but also by the media and among political commentators and politicians themselves. Even if authors still disagree on whether it should be thought of as an ideology, a discourse or communicational style, or even as an organizational strategy, a growing consensus is recently emerging around a minimal set of core features that would define populism. These have been succinctly conveyed by Mudde (2004, p. 543) when arguing that populism “considers society to be separated into two relatively homogeneous and antagonistic groups, ‘the pure people’ versus ‘the corrupt elite’, and which argues that politics should be an expression of the volonté générale (general will) of the people” (see also Abts & Rummens, 2007; Albertazzi & McDonnell, 2008; Mény & Surel, 2002; Rooduijn, 2014a; Stanley, 2008). Along this path, Stanley (2008, p. 102) further decomposes populism into four “distinct but interrelated” constitutive elements:
• The existence of two homogeneous units of analysis: ‘the people’ and ‘the elite’. • The positive valorization of ‘the people’ and denigration of ‘the elite’. • The antagonistic relationship between the people and the elite. • The idea of popular sovereignty.
Accordingly, populism is conceived of as a Manichean view that sees politics as the struggle between the worthy people’s commonsense and the harmful, self-serving power elite––a view that is deeply suspicious of any constitutional restraints to the democratic principle and hence advocates for the absolute primacy of popular sovereignty. Such a minimal conceptual core renders populism ideologically ubiquitous (Taggart, 2000). Lacking any true programmatic content, populism does not provide an internally coherent set of specific solutions to the major conflicts present in modern societies. Instead, populist rhetoric is easily attached to different full-fledged ideologies on both sides of the left-right spectrum. Although the populist radical right has proved to be one of the most prolific party families in Europe over the last three decades, other distinct families have recently earned the same qualifier, such as neo-liberal populist parties or social-populist parties, not to mention the diverse crowd of contemporary leftist-populist movements in Latin America (March, 2007; see, e.g., March & Mudde, 2005; Mudde, 2007; Remmer, 2012; Roberts, 2007). Even if this varied collection of political formations display a similar (i.e., populist) discourse––in their antagonistic opposition between the “pure people” and the “corrupt elite” and the vindication of popular sovereignty––they may hold not only different values and policy positions but also rather dissimilar beliefs about the very notions of “people” and “elite” and about the specific social groups that each is made up of (Mudde & Rovira Kaltwasser, 2013). Relatedly, populism is not to be understood as a quality confined to a precise set of allegedly populist parties. Rather, populist rhetoric can be adopted in different degrees by any actor, not only political parties and leaders but also journalists and voters––provided that their discourse complies with the minimal definition. Also mainstream
3
parties might occasionally or even consistently voice populist appeals (see, e.g., Decker & Hartleb, 2007; Deegan-Krause & Haughton, 2009; Jagers & Walgrave, 2007; Pauwels, 2011). Indeed, Mudde’s (2004) claim that Western democracies are witnessing a populist Zeitgeist implies that populism is to some extent spreading beyond the restricted limits of a few unconventional, most often radical political formations. Whenever the focus is, as in the present paper, on the measurement of populism, it is implicitly assumed that populism can vary in degree across actors and over time. Populism is not an “either–or” concept (Pauwels, 2011) and hence is best used as an adjective rather than as a noun, or––in van Kessel’s (2014) terms––as a “descriptor” rather than as a “classifier” (see also Deegan-Krause & Haughton, 2009). This conceptualization of populism has significant implications in terms of research strategy. Most of the existing research on the origins of populism as a mass phenomenon uses vote choice as the dependent variable, taking as a starting point some categorization of parties as populist and non-populist. Leaving aside the debates on how to classify parties as populists, individual populism in the analysis of vote choice is equated with support for populist parties. The allowance for populism to manifest itself in varying degrees, along with its ideological ubiquity, are key to understand why a focus on populist attitudes can help to overcome some limitations of extant research that focuses on populist vote choice. First, the focus on party support forces an artificial dichotomization that leaves out differences of degree in the levels of populism in both the discourse of parties and the attitudes of their voters. The classification of specific parties as populist is imposed to each and every one of their respective voters, while in fact they may have very different degrees of intensity in their populist attitudes. Second, by emphasizing vote choice the focus is placed on the analysis to electoral mobilization, that is, on explaining the electoral performance of specific individual parties or party families, a question for which supply-side factors become particularly relevant (Carter, 2005; Givens, 2005; Koopmans, 2005; Mudde, 2007; van der Brug et al., 2005; van Kessel, 2011, 2013). However populist attitudes can manifest themselves in different ways, not restricted to support for populist parties, including abstention, and mainstream party support (Hooghe et al., 2013). The basic features of a party system may remain untouched amid extensive attitudinal change. Despite its economy being severely hit by the crisis, no populist formation emerged in Ireland in the wake of the Great Recession. Instead, populist discourse diffused across all major parties, particularly those in the opposition (O’Malley & FitzGibbon, 2015). The focus on success cases is likely biasing the results if only a fraction of the phenomenon might be observed and much is left aside. Populist attitudes do not automatically turn into support populist parties. They define the potential electorate, the breeding ground of populist formations, which is mobilized depending on opportunity structures and the agency of political actors. The latter are crucial for explaining electoral success, while demand-side factors become the key concern when it comes to explain citizens’ attitudes. Third, given the chameleonic nature of populism, placing the focus on support for parties adopting so diverse ideological stances makes even more difficult the task to “separate populism from features that might regularly occur together with it, but are not part of it” (Mudde & Rovira Kaltwasser, 2012, p. 2). Host full-fledged ideologies and related issue stances compete with populist attitudes to explain the voters’ support of
4
these parties, obscuring the unique contribution of populism, which is also the common core of all of its political expressions. The fact that populist parties often place themselves on either extreme of the left-right spectrum aggravates the problem. It is hardly surprising that similarity in issue positions between voters and populist radical right parties has been found to be one of the most relevant factors explaining their electoral performance (Ivarsflaten, 2008; van der Brug et al., 2000, 2005). Ultimately, research on support for populist parties and research on populist attitudes address quite different questions, so one cannot serve as a surrogate for the other. By having populism as a defining characteristic of a given party, it is assumed that this component likely contributes to explain its electoral performance. Research on support for the populist radical right, for example, has often had populist attitudes (or some related construct, such as political trust) as an independent variable. We are moving one step backwards, drawing our attention to the explanation of variation in populist attitudes among European public opinion, and with a specific focus on the role of economic hardship as a triggering factor.
Economic sources of populist resentment The role of crisis as a trigger of populist upsurge figures prominently in a number of works inquiring into the nature and origins of populism. In Taggart’s (2004, p. 275) words, “populism is a reaction to a sense of extreme crisis” that “spills over into a critique of politics and into the sense that politics as usual cannot deal with the unusual conditions of crisis”. According to Laclau (2005, pp. 37–38), populism is the result of “a situation in which a plurality of unsatisfied demands and an increasing inability of the institutional system to absorb them differentially co-exist”. In a similar vein, Panizza (2005, p. 11) argues that populism typically emerges out of critical circumstances that produce “a breakdown of social order and the loss of confidence in the political system’s ability to restore it.” The rationale behind such theoretical accounts is thus that the perception of persistent unresponsiveness to popular demands undermines the public’s confidence in the political establishment to the point that it calls into question the whole institutional system’s capacity—and allegedly its resolve—to satisfactorily handle the situation. Largescale economic crises, such as the Great Recession and the sovereign-debt crisis recently experienced by several Eurozone member states, clearly provide the conditions for feelings of dissatisfaction and perceived unresponsiveness of the political elites to spread among citizens. It is worth noting, however, that populist upsurge is not inevitably restricted to times of crisis and structural transformation, as most strongly argued in studies of the Latin American experience (de la Torre, 2000; Knight, 1998). Populist attitudes must be conceived as the result of the interplay of various factors at multiple levels—the economy being but one of them. Even if economic hardship is clearly not a necessary or even a sufficient condition for the emergence of populism, populist attitudes may arguably be nourished by economic crisis. That voters turn against governments in times of economic strain has been long established by the economic voting literature. Continued bad economic performance,

5
often spanning across different governments and incumbent parties and/or concerning decisions taken by previous governments and parties may end up damaging the public’s confidence on the entire political establishment. To the extent that crisis negatively affects the living conditions of citizens, economic crisis breeds dissatisfaction with the elites that are seen as responsible for governing the affairs of the country and ultimately enhances the perceived antagonism between the “people” and the ruling elite, however defined. Indeed, this is one of the working hypotheses guiding Kriesi and Pappas’ (2015) effort examining the impact of the financial crisis on the performance of populist parties in Europe. They find that electoral support for populist formations experienced a moderate but non-negligible increase during the Great Recession. The evolution of populism was yet far from uniform in the countries under scrutiny, the growth being particularly strong in Southern and Central-Eastern Europe and almost nonexistent in Western Europe. Their analyses provide partial empirical support for the hypothesis that populism benefits from economic crisis, as attested by the fact that populist formations did tend to perform better in countries more seriously affected by the global economic downturn—yet with remarkable exceptions to the general trend (Pappas & Kriesi, 2015). The crisis-breeds-populism thesis has gained additional, albeit indirect, empirical backing from other recent work looking at the influence of the Great Recession on related but distinct attitudes such as satisfaction with democracy and trust in political institutions, which experienced dramatic declines over the last decade (Armingeon & Guthmann, 2014; Braun & Tausendpfund, 2014; Cordero & Simón, 2015). Overall, however, extant empirical work concerning the relationship between economic hardship and mass populism remains rather unsystematic, hardly comprehensive, and lends mixed results. A case in point is the effect of unemployment on support for the populist radical right. Whereas several studies have found a positive relationship between unemployment rates and populist electoral performance (Anderson, 1996; Arzheimer, 2009; Givens, 2005; Jackman & Volpert, 1996), some other macro-level studies show no significant association (Lubbers et al., 2002; Lubbers & Scheepers, 2002; Swank & Betz, 2003) or even a weak negative correlation (Arzheimer & Carter, 2006; Knigge, 1998). The apparent contradiction raised by the negative associations found in some studies has been explained by virtue of bad economic conditions providing higher salience to socioeconomic issues, which have been traditionally owned by mainstream parties, over immigration and other debates where populist radical right parties play a more visible role (see Mudde, 2007, p. 206; Rydgren, 2007, p. 250; Bornschier, 2010). Accordingly, the combination issue salience and issue-specific perceptions of party competence would offset or even reverse the influence of economic hardship on citizens’ adherence to populist discourse. Another alternative approach criticizes the conventional understanding on the basis of its tendency to conceive crisis as a purely exogenous factor. To the extent that crises are socially constructed, populism may become a trigger of crisis rather than crisis be a precondition of populism, as the crisis discourse is a key instrument for populist leaders to convey to the public the Manichean worldview that sees politics as an antagonism between the people and the elite (Moffitt, 2015). It is in the interests of populist challengers to fuel the perception of crisis regardless of actual conditions, since their

6
appeal stems from their self-proclaimed ability to fix that very problem. Indeed, the denunciation of a crisis has been found to be one of the most recurrent themes of the populist rhetoric (Rooduijn, 2014a). In our view, this interpretation qualifies but does not detract from the analysis of the influence of crisis on populism, once the definition of crisis is expanded beyond objective indicators to include also subjective perceptions and such perceptions are acknowledged to be affected by factors other than actual conditions. Crises may be real or imaginary, but the sense of threat and emergency they gives rise to may be vividly perceived by a significant portion of the people (Taggart, 2004), and its effects worth inquiring. If a major concern when explaining populist party support, the distinction becomes less of a problem when the focus is on populist attitudes, and it appears as nearly irrelevant when the analysis is set in the aftermath of the unquestionably critical context of the Great Recession. This study conceives three groups of distinct albeit interrelated processes involved in the influence of economic crisis on the formation of populist attitudes, namely: (1) personal vulnerability, (2) objective personal economic decline, and (3) sociotropic perceptions. The first concerns the likelihood that an individual is affected by the crisis, by virtue of her position in the social structure and her membership to given social groups. The second relates to the retrospective deterioration of the objective economic conditions of the individual during, and likely as a direct consequence of, the crisis. The third group involves the individual’s subjective attitudes towards the economy of the country. Our expectations regarding the role of a person’s vulnerability are chiefly informed by “economic interests thesis” as first applied to the radical right to account for electoral support coming from “the losers in the competition over scarce resources and/or those who suffered from some form of relative deprivation” (Eatwell, 2003, p. 53). These typically emphasize the impact of large scale socioeconomic changes and the fears and uncertainties these bring about (Betz, 1994; Kitschelt, 1995; Kriesi et al., 2008). Major changes such as globalization, massive immigration flows, cultural diversity, or European integration have been interpreted to be giving rise to a new conflict opposing winners and losers of modernization, the latter typically comprising groups with lower socioeconomic status (Kriesi et al., 2006, 2008). According to Kriesi (2014), the Great Recession would have only exacerbated the emerging cleavage, further fueling populist radical right, while likely leading to the breakthrough of more overtly class-based, left-wing populist movements. Consequently, we expect that:
Hypothesis 1. The more vulnerable the socioeconomic position of the individual (lower education, lower social class, lower income, unemployed), the higher the level of populist attitudes
Indeed, empirical research has quite consistently found that populist parties, and the radical right in particular, draw disproportionate support from persons with lower income, lower education, and lower occupational status (see for example Lubbers et al., 2002). At the same time, however, a number of works have argued that the radical right does not mobilize by virtue of economic grievances, nor even anti-immigration sentiments elicited by economic concerns, but more uniformly on the basis of immigration policy grievances, which are mainly motivated by cultural and identity

7
concerns (Ivarsflaten, 2005, 2008; Oesch, 2008). In contrast to the economic interests thesis, these accounts claim that it is actually the weight that the radical right voters put on issues such as immigration, crime, and European integration that unites occupational groups with otherwise disparate economic preferences. The influence of crisis through an individual’s socioeconomic position does not only derive from her economic disadvantage but also, and perhaps more importantly, from the threat of deprivation. The threat might not eventually realize but be nonetheless consequential, via the feelings of fear and insecurity it brings about. On the other hand, the material effect of crisis is best gauged in a more direct fashion and retrospectively, as this allows more reliably capturing the depth and pace of the deterioration that characterizes economic crisis among those actually hit by it. Material strain is typically experienced as the inability to keep up with once affordable payments, the reduction in consumption of basic goods and services, being denied access to public social services or benefits, and worsening working conditions or loss of job.
Hypothesis 2. The more an individual’s objective economic conditions (financial, occupational, welfare provision) have worsened by the crisis, the higher the level of populist attitudes
Finally, we expect for any effect the personal economy may have on populism to be largely mediated and in any case outweighed by group-based judgments of economic conditions. A large body of economic voting literature has confirmed the prevalence of sociotropic perceptions, most often related to the state of the national economy, over egotropic, or pocketbook, considerations (Kinder & Kiewiet, 1981). People-centrism is one of the necessary components of the aforementioned definition of populism. If populism actually is the product of a “plurality of unsatisfied demands”, all the more reason for the perception of grievances shared by the community identified as the people, rather than individual economic hardship, to play a paramount role in explaining citizens’ degree of endorsement of populist attitudes. Indeed, Elchardus and Spruyt (2014) find that an individual’s situation economic of vulnerability only indirectly affects populism, via its influence on feelings of relative group deprivation and other sociotropic considerations. Further, as just noted, above crises may be real or artificially constructed by populist leaders, but it is the subjective perceptions of crisis, rather than the picture conveyed by standard macroeconomic figures, that ultimately fuel populism.
Hypothesis 3. The more negative the perceptions of national economic conditions, the higher the level of populist attitudes. Hypothesis 4. We expect socio-tropic perceptions to have the largest effect over populist attitudes (compared to the effect of vulnerability and deprivation)
Data and methods The empirical analysis is based on an online survey jointly conducted in the nine European countries in June of 2015. The samples, recruited by YouGov using the

8
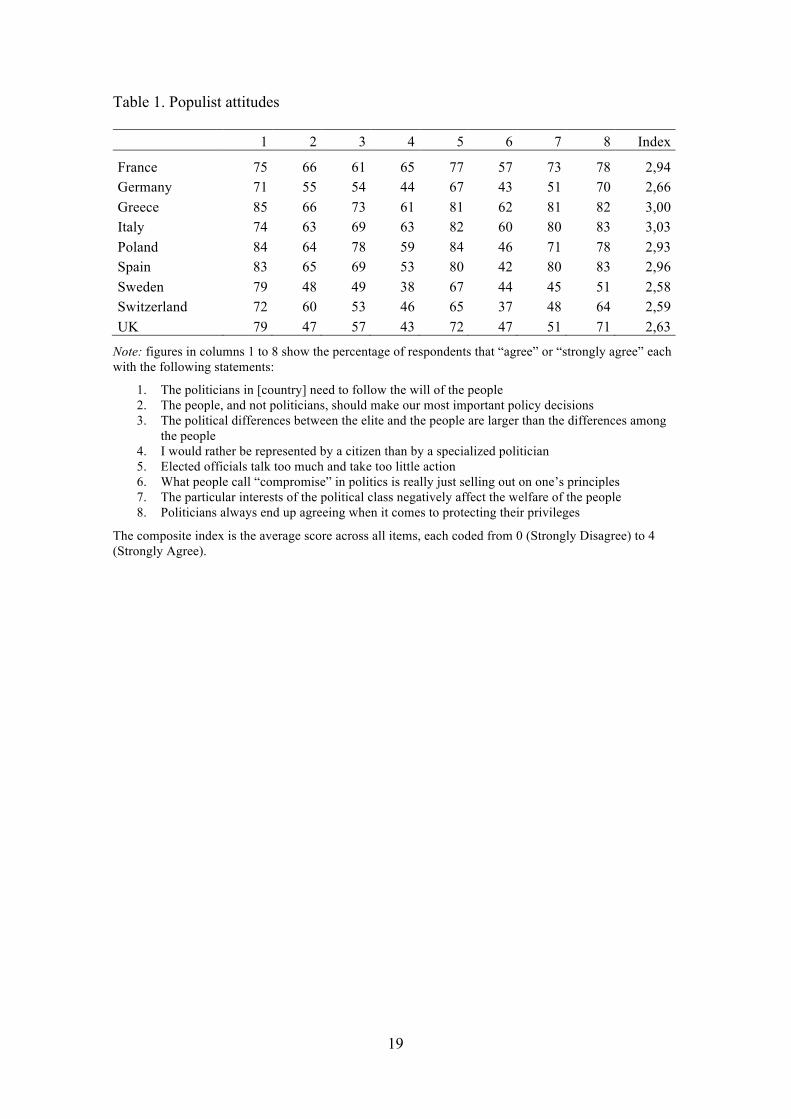
methodologies available in each country, are quota balanced in order to match national population statistics in terms of sex, age, and education level. Following the growing agreement around the definition of populism, in recent years several indicators have been suggested to measure populist attitudes at the individual level (Elchardus & Spruyt, 2014; Rooduijn, 2014b; Stanley, 2011). We adopted an enlarged version of the measure proposed by Akkerman et al. (2014), itself developed from previous efforts by Hawkins and colleagues (Hawkins et al., 2012; Hawkins & Riding, 2010). Our instrument consists of the six items used in their original battery plus two additional items. The eight statements, as shown in Table 1, are designed to tap the core ideas that make up the populist discourse, namely, people-centrism, anti-elitism, the antagonism between the people and the elite, and the primacy of popular sovereignty. Respondents’ agreement with each of the statements was measured using a five-point Likert scale, coded from 0 (Strongly disagree) to 4 (Strongly agree). The internal consistency of the resulting composite scales (mean of scores) is rather good across all countries in survey, with alpha reliabilities varying between 0,82 (Greece) and 0,91 (France). Our specification includes three groups of variables. In the first block we include variables related to vulnerability: education (university, complete secondary and less than secondary), occupational status (unemployed), social class of household’s chief income earner (professional, manager, clerical, commercial, supervisor, skilled manual, unskilled manual, and other) and household income (coded in national deciles). These individual characteristics are expected to condition the extent to which people are vulnerable to the consequences of the economic crisis, and hence we expect them to affect the level of populist attitudes. The first block includes as well standard socio-demographic controls: gender (female), age and its square (to account for the potential curvilinear effect of age), citizenship (non-national). In themselves, however, these variables reflecting vulnerability are not indicators of having necessarily suffered economic hardship as a consequence of the great recession. In the second block we include individual characteristics that reflect precisely the extent to which people have personally suffered negative economic consequences of the crisis. These indicators of deprivation have a financial dimension (having had to reduce consumption in a number of items in the past 5 years), a dimension related to austerity policies (having been denied access to some public social service or benefit) and an occupational dimension (for those that are employed, having experimented a worsening of their working conditions). As a measure of reduced consumption we created a composite index that accounts for reductions in staple foods, recreational activities, use of own car, delay of payments gas, water or electricity bills, delay or default on loans instalments, moved home, sell assets, cut of phone, TV or internet service, not going on holiday or postponing doctor visits or buying medicines. As a measure of being affected by austerity policies we include a variable reflecting if people have, in the past 12 months, been denied a social benefit they think they should have received. As an indicator of the occupational we include and index that summarizes if people have had to take a reduction in pay, accepted a job for which they were overqualified, accepted an additional job, worked shorter hours, worked unpaid extra hours, had work load increased, accepted less convenient working hours, had a deteriorated working environment, had people dismissed in the

9
organization where they work, taken undeclared payments, or had less security in their job. In the third block we include the standard retrospective evaluation of the country’s economic situation based on an 11 point scale where people evaluate whether the economic situation of their country in the past year has become much worse or much better. Since the variables included in the second and third blocks (deprivation and sociotropic perceptions) can be thought to be the result of the variables included in the any of the previous blocks, we include the blocks in sequential steps, and expect the variables in the previous block to have a smaller effect once the next is introduced. In the model that includes sociotropic perceptions we introduce additional controls that may have an influence both on sociotropic perceptions and on populist attitudes: political sophistication,1 left-right identification and being a close to the party or parties in government. All independent variables are coded to run from 0 to 1, except for age (in years). Each model is fit for the overall sample and for each of the individual countries. The overall estimates are obtained including country-level fixed effects. Due to the significant number of missing observations, the income variable is not included in the country models.
Results Populist attitudes Before turning to the results of the analysis it is worth looking at how populist attitudes are distributed in our nine countries. A first glance, the last column of Table 1 shows that citizens in all countries tend to agree with statements that reflect different dimensions of populist attitudes. The neutral position (neither agree nor disagree) is reflected by the 2 on the 0 to 4 scale, and all countries show values higher than 2 in their index of populist attitudes. Our data would thus appear lend support to the claim that “a large pool of potential followers always exists” (Hawkins & Riding, 2010, p. 20) which populist movements can draw on. We can however clearly group countries in two blocks according to their overall level of populist attitudes. Sweden, Switzerland, 1 The four items used to measure political knowledge were the following. A DK option was offered and people could also skip the question. 1. [Picture of Jean Claude Junker] Can you tell who is the person in this picture? José Manuel Durão Barroso, former President of the European Commission; Thorbjørn Jagland, Secretary General of the Council of Europe; Donald Tusk, President of the European Council; Jean Claude Juncker, current President of the European Commission 2. What does public deficit mean? The lack of public service provision; The money the government owes to its creditors; The money the government fails to collect due to tax fraud; The difference between government receipts and government spending 3. Who sets the interest rates applicable in [country of respondent]? The government of [country of respondent]; The International Monetary Fund; The European Central Bank; The Central Bank of [country of respondent]. 4. As a percentage, what do you think is the current unemployment rate in [country of respondent]? [Responses within a 1% of official range were considered correct]

10
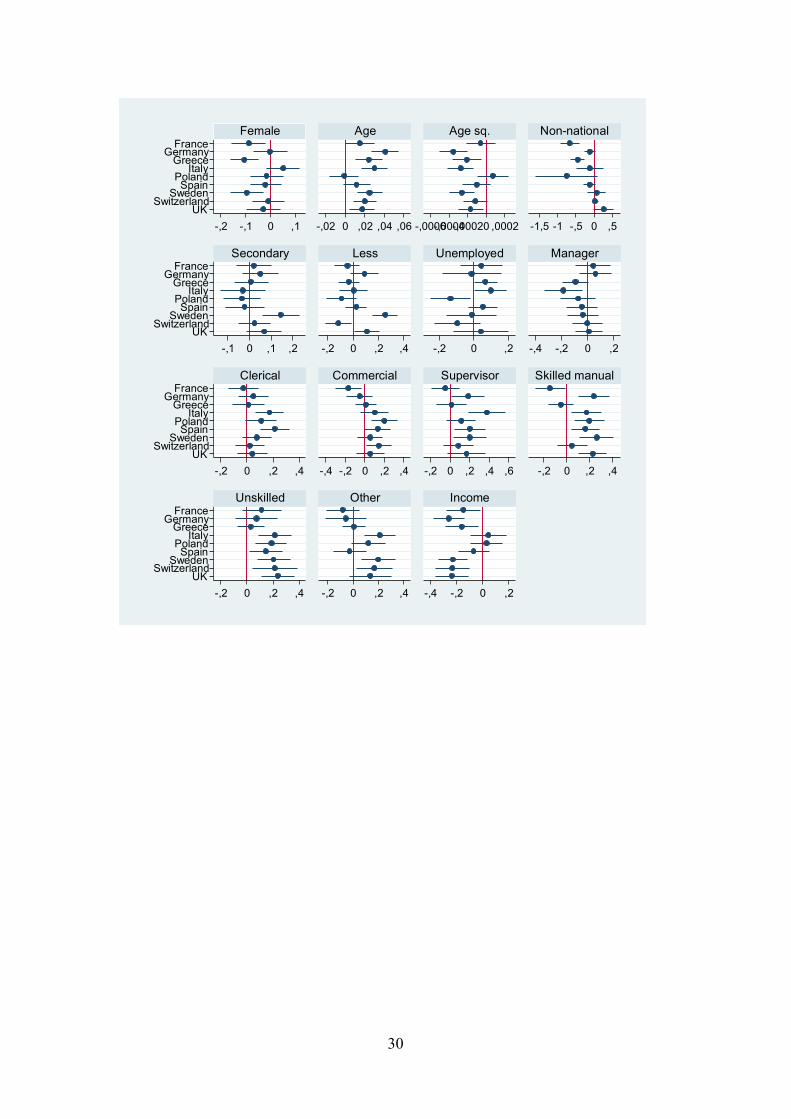
United Kingdom, and Germany show relatively lower levels (between 2,6 and 2,7), while Poland, France, Spain, Greece and Italy show higher levels (between 2,9 and 3). If we look at the different items used to measure populist attitudes we also find that in most cases a majority of people agree or strongly agree with the statements proposed, with a few exceptions. We are then able to have a more nuanced picture. While in Italy and Greece a majority supports all statements, in Sweden only three of them are supported by more than 50% of respondents. Statement 1 seems to obtain the highest levels of support in all countries, including those that score low in the overall index. That is, between 70 and 85% of respondents in all countries think that politicians need to follow the will of the people. Statement 5 displays a similar pattern, but in this case the variation is larger, with 65 to 85% of people agreeing with the view that politicians talk too much and take too little action, a mild critical view of the political elite. Cross-national differences are lager in statements 7 and 8, with a range of variation between 45 and 85%. Countries vary quite a bit in the extent to which they have a truly negative view of their political elites, as expressed by how much they consider that the interests of the political class negatively affect the welfare of the people or that politicians always end up agreeing when it comes to protecting their privileges. The other four statements seem to arise lower levels of overall agreement. Statements 2 and particularly 6 do not get the high levels of support of other statements. Depending on the country, between 47 and 66% of citizens think that people, and not politicians, should decide on important questions. Unsurprisingly, Switzerland has relatively high levels of agreement with this statement, which wards this country off Sweden and the UK, and closer Poland and Italy. Comparing this statement with statement 1 it seems clear that people distinguish between making politicians responsive to their will and wanting citizens to directly decide. A critical view of pluralism also seems to have some significant cross-national variations. Only France, Greece, and Italy show a predominant negative view of compromise, while in the other countries (including Spain) most people do not consider that compromise is just selling one’s principles. Statement 3 aims to reflect the extent to which citizens perceive the people as being something relatively homogeneous and different from the elite. In this case levels of agreement are around 50% in Sweden, Switzerland, Germany and the UK, somewhat higher in France, and significantly higher in Spain, Italy Greece and particularly Poland, where it almost reaches 80%. Statement 4 also presents some significant cross-national variation, at a lower level. In Sweden, UK, Germany and Switzerland people do not predominantly want to be represented by a citizen rather than by a politician. In Spain the percentage barely goes over 50%, while in Poland, France, Greece and Italy about 60% prefer a citizen to represent them. Vulnerability The first model of Table 2 includes the first block of predictors. Figure 1 depicts the effects as estimated in this first step. According to the analysis women, non-nationals and people with higher levels of income and education are less likely to have populist attitudes. Being unemployed does not seem to affect populist attitudes. Clericals, and particularly manual workers (including supervisors) are more likely to have higher

11
levels of populist attitudes. As seen in Figure 2, age shows a typical curvilinear effect were the level of populist attitudes increases remarkably with years of age until a maximum at age 60, and then it remains stable or declines slightly. These general patterns show some cross-national differences, as reported in Table 3 and Figure 3. The effect of being female is negative and significant in Sweden, Greece, Switzerland, and France. It is statistically not significant in all but these four countries, including Italy, the only country where being a woman increases the level of populist attitudes. The effect of age is very similar in all countries, with the only exception of Poland, were age does not affect the presence of populist attitudes. Being a non-national reduces the level of populist attitudes in all countries but the UK and Sweden, although the effect is only significant in France and Spain. Lower levels of education increase populist attitudes clearly only in Sweden and the UK. Being unemployed seems to have different effects depending on the country. In France, Greece, Italy, Spain and the UK it increases populist attitudes (though the effect is not always significant). In Poland and Switzerland the effect of being unemployed is negative and does not reach statistical significance. Being a clerical increases populist attitudes in Italy and Spain, and in most countries so does being supervisor, skilled manual or unskilled. In Greece, and Poland the effects of social class are not statistically significant. In Switzerland only being an unskilled worker seems to matter. Vulnerability in front of the crisis seems to have a complex relationship with populist attitudes. The effect of these indicators of vulnerability is very much conditioned by the context where the individual lives. Deprivation The effects of the personal consequences of the economic crisis are more systematic, and they clearly follow expectations in the analysis of all countries. Model 2 of Table 2 and corresponding Figure 4 show the estimates of the overall model, while the results of the country models are shown in Table 4 and Figure 5. The financial dimension is the most important predictor, always with a positive effect particularly large in the UK and Sweden, and relatively low in Greece and Spain. The austerity dimension shows a significant effect in all countries except Germany, Poland, Sweden and the UK. The occupational dimension is particularly relevant in Germany, Greece and Sweden, and significant in all other countries except UK and Italy. It appears that in countries where more people have been deprived by the great recession, the effect of having been deprived is smaller. This seems to be the case at least for financial consequences. To the extent that more people are deprived, the consequences being personally affected are milder. Sociotropic perceptions Model 3 of Table 2 and Figure 4 show the estimates of the overall model as measures of sociotropic perceptions (plus left right selfplacement, political knowledge and

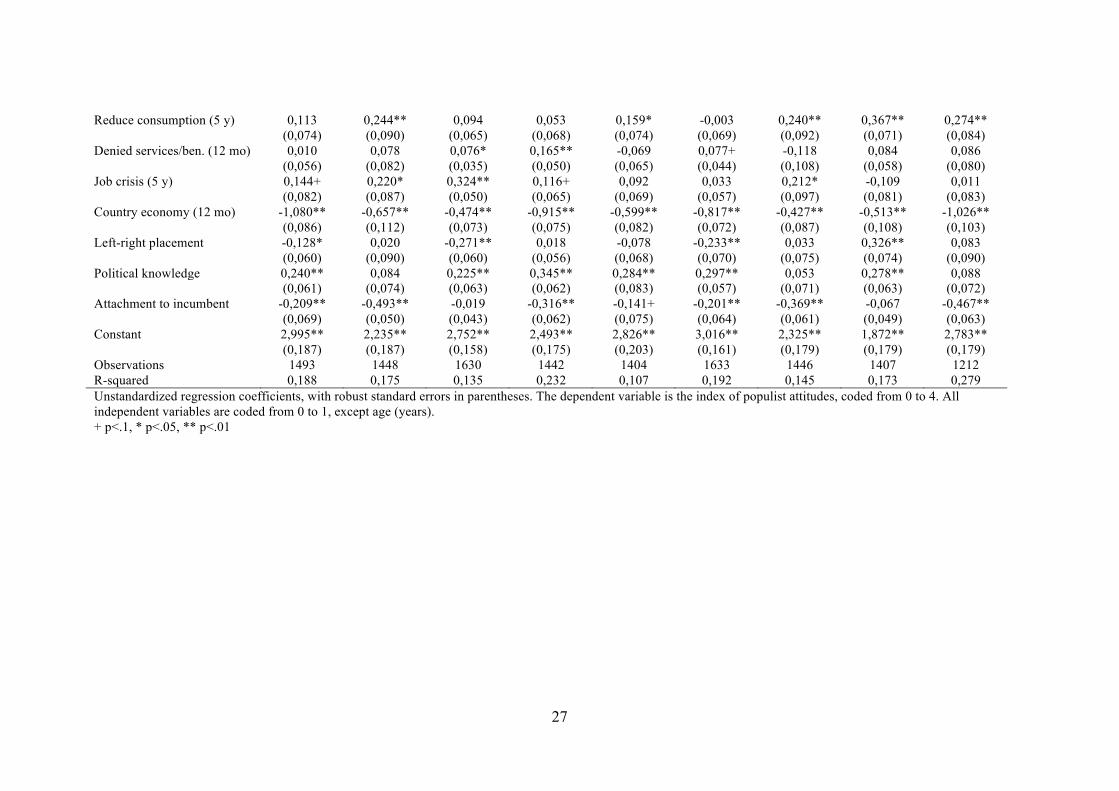
12
attachment to the incumbents are added to the predictors included in the previous steps. Table 5 and Figure 6 contain the results of the country models. Sociotropic perceptions about the crisis have an important effect on populist attitudes. The effect is clearly negative and significant in all countries, stronger than any other marginal effect. Although the controls are not central to our concerns, they show some interesting patterns. As expected, individuals that are close to the party in government are less likely to have populist attitudes, except in Greece and Switzerland where this effect is non significant. Overall, respondents that locate themselves in the left of the ideological scale are more likely to show populist attitudes, but this effect is very contingent on the characteristics of the political context. It is statistically significant only in Greece and Spain and in Switzerland populism is associated with right wing positions. Perhaps surprisingly, higher levels of political knowledge are associated with higher levels of populism. In this case the effect seems to be quite systematic, but it does not reach statistical significance in Germany, Sweden and the UK. Sociotropic perceptions are causally closer to populist attitudes, so naturally they show larger effects. However there are some concerns regarding the causal nature of this relationship. As noted above, the denunciation of a societal crisis is recurrently employed as a rhetorical device by populist leaders. As a consequence, perceptions of national economic conditions might be seen as the result of individuals’ support for populist discourse. In other words, sociotropic evaluations are potentially endogenous to the espousal of populist attitudes, rather than an exogenous factor of these. If so, OLS estimates may overestimate the effects of national economic perceptions on populist attitudes. In order to address endogeneity concerns, we reestimate our last model using instrumental variables. As instruments of sociotropic perceptions of the economy we use household income, an index of individual deprivation and respondents’ retrospective evaluation of their personal economic situation. Individual deprivation is measured using the EPICES score, a composite index of 11 items encompassing multiple dimensions of socioeconomic conditions, including psychological aspects (Sass et al. 2006). The retrospective sociotropic evaluation of the economy is based on an 11 point scale where people evaluate the extent to which their household’s economic situation in the past 12 months has become much worse or much better. The results of the IV estimation are shown in Table 6, along with the OLS estimates of the same model. The results provide further support for the hypothesis that sociotropic perceptions have an effect on populist attitudes. Not only the effect of economic evaluations remains statistically significant when IV is used, it is actually slightly larger than the OLS estimate. Validity tests lend credibility to these estimates. Instruments must meet two basic conditions to be valid: they should be correlated with the endogenous regressor but otherwise uncorrelated with the dependent variable. Our instruments satisfy both assumptions. The first stage statistics (not shown) indicate that the three instrumental variables are jointly relevant and significant (partial R-squared=0,226; p<0,01). Also, none of the instruments have a direct effect on populist attitudes, so they can be safely excluded from the second stage. Finally, the Sargan test further suggests that the overidentifying restrictions are valid (p=0,926).
13
Conclusion Our analyses have shown that economic hardship matters for populist attitudes. While vulnerability and deprivation have modest effects, not present in all countries, sociotropic perceptions of the economy have important effects in all countries analyzed. Our results support the idea that it is not so much the objective economic situation that matters for the development of populist attitudes, but rather the perceptions that there is indeed a critical economic situation. Using an instrumental variable indentification strategy we are able to show that there seems to be indeed a causal relationship between sociotropic perceptions and populist attitudes.
14
References
Abts, K. & Rummens, S. (2007). Populism versus Democracy. Political Studies 55(2): 405–424.
Akkerman, A., Mudde, C. & Zaslove, A. (2014). How Populist Are the People? Measuring Populist Attitudes in Voters. Comparative Political Studies 47(9): 1324–1353.
Albertazzi, D. & McDonnell, D. (2008). Introduction: The sceptre and the spectre. In D. Albertazzi & D. McDonnell (eds.), Twenty-first century populism: the spectre of western European democracy. Houndmills, Basingstoke, Hampshire [England] ; New York: Palgrave Macmillan.
Anderson, C.J. (1996). Economics, politics, and foreigners: Populist party support in Denmark and Norway. Electoral Studies 15(4): 497–511.
Armingeon, K. & Guthmann, K. (2014). Democracy in crisis? The declining support for national democracy in European countries, 2007–2011. European Journal of Political Research 53(3): 423–442.
Arzheimer, K. (2009). Contextual Factors and the Extreme Right Vote in Western Europe, 1980–2002. American Journal of Political Science 53(2): 259–275.
Arzheimer, K. & Carter, E. (2006). Political opportunity structures and right-wing extremist party success. European Journal of Political Research 45(3): 419–443.
Bélanger, É. & Aarts, K. (2006). Explaining the Rise of the LPF: Issues, Discontent, and the 2002 Dutch Election. Acta Politica 41(1): 4–20.
Betz, H.-G. (1994). Radical right-wing populism in Western Europe. New York: St. Martins Press.
Bornschier, S. (2010). Cleavage politics and the populist right: the new cultural conflict in Western Europe. Philadelphia: Temple University Press.
Braun, D. & Tausendpfund, M. (2014). The Impact of the Euro Crisis on Citizens’ Support for the European Union. Journal of European Integration 36(3): 231–245.
Carter, E.L. (2005). The Extreme Right in Western Europe: Success Or Failure? Manchester University Press.
Conover, P.J. & Feldman, S. (1986). Emotional Reactions to the Economy: I’m Mad as Hell and I’m not Going to Take it Anymore. American Journal of Political Science 30(1): 50–78.
Cordero, G. & Simón, P. (2015). Economic Crisis and Support for Democracy in Europe. West European Politics 0(0): 1–21.
15
Decker, F. & Hartleb, F. (2007). Populism on Difficult Terrain: The Right- and Left-Wing Challenger Parties in the Federal Republic of Germany. German Politics 16(4): 434–454.
Deegan-Krause, K. & Haughton, T. (2009). Toward a More Useful Conceptualization of Populism: Types and Degrees of Populist Appeals in the Case of Slovakia. Politics & Policy 37(4): 821–841.
de la Torre, C. (2000). Populist seduction in Latin America: the Ecuadorian experience. Athens: Ohio University Center for International Studies.
Eatwell, R. (2003). Ten Theories of the Extreme Right. In P. Merkl & L. Weinberg (eds.), Right-Wing Extremism in the Twenty-first Century. London: Frank Cass. Retrieved from http://opus.bath.ac.uk/11126/
Elchardus, M. & Spruyt, B. (2014). Populism, Persistent Republicanism and Declinism: An Empirical Analysis of Populism as a Thin Ideology. Government and Opposition FirstView. Retrieved from http://journals.cambridge.org/article_S0017257X1400027X
Givens, T.E. (2005). Voting radical right in Western Europe. New York: Cambridge University Press.
Hawkins, K.A. & Riding, S. (2010, March). Populist attitudes and their correlates among citizens: Survey evidence from the Americas. Presented at the ECPR Workshop ‘Disassembling Populism (and Putting It Back Together Again): Collaborative Empirical Research on Interactions among Populism’s Attributes’, Muenster.
Hawkins, K.A., Riding, S. & Mudde, C. (2012). Measuring Populist Attitudes (Working Paper). Committee on Concepts and Methods, International Political Science Association.
Hooghe, M., Marien, S. & Pauwels, T. (2013). Where Do Distrusting Voters Turn if There is No Viable Exit or Voice Option? The Impact of Political Trust on Electoral Behaviour in the Belgian Regional Elections of June 2009. Government and Opposition 46(02): 245–273.
Ivarsflaten, E. (2005). The vulnerable populist right parties: No economic realignment fuelling their electoral success. European Journal of Political Research 44(3): 465–492.
Ivarsflaten, E. (2008). What Unites Right-Wing Populists in Western Europe? Re-Examining Grievance Mobilization Models in Seven Successful Cases. Comparative Political Studies 41(1): 3–23.
Jackman, R.W. & Volpert, K. (1996). Conditions Favouring Parties of the Extreme Right in Western Europe. British Journal of Political Science 26(04): 501–521.
Jagers, J. & Walgrave, S. (2007). Populism as political communication style: An empirical study of political parties’ discourse in Belgium. European Journal of Political Research 46(3): 319–345.

16
Kayser, M.A. & Peress, M. (2012). Benchmarking across Borders: Electoral Accountability and the Necessity of Comparison. American Political Science Review 106(03): 661–684.
Kinder, D.R. & Kiewiet, D.R. (1981). Sociotropic Politics: The American Case. British Journal of Political Science 11(02): 129–161.
Kitschelt, H. (1995). The radical right in Western Europe: a comparative analysis. Ann Arbor: University of Michigan Press.
Knigge, P. (1998). The ecological correlates of right-wing extremism in Western Europe. European Journal of Political Research 34(2): 249–279.
Knight, A. (1998). Populism and Neo-populism in Latin America, especially Mexico. Journal of Latin American Studies 30(2): 223–248.
Koopmans, R. (ed.). (2005). Contested citizenship: immigration and cultural diversity in Europe. Minneapolis: University of Minnesota Press.
Kriesi, H. (2014). The Populist Challenge. West European Politics 37(2): 361–378.
Kriesi, H., Grande, E., Lachat, R., Dolezal, M., Bornschier, S. & Frey, T. (2006). Globalization and the transformation of the national political space: Six European countries compared. European Journal of Political Research 45(6): 921–956.
Kriesi, H., Grande, E., Lachat, R., Dolezal, M., Bornschier, S. & Frey, T. (2008). West European politics in the age of globalization. Cambridge: Cambridge University Press.
Kriesi, H. & Pappas, T.S. (eds.). (2015). European Populism in the Shadow of the Great Recession. Colchester: ECPR Press.
Laclau, E. (2005). Populism: What’s in a Name? In F. Panizza (ed.), Populism and the mirror of democracy. London ; New York, NY: Verso.
Lubbers, M., Gijsberts, M. & Scheepers, P. (2002). Extreme right-wing voting in Western Europe. European Journal of Political Research 41(3): 345–378.
Lubbers, M. & Scheepers, P. (2002). French Front National voting: a micro and macro perspective. Ethnic and Racial Studies 25(1): 120–149.
March, L. (2007). From Vanguard of the Proletariat to Vox Populi: Left-Populism as a ‘Shadow’ of Contemporary Socialism. SAIS Review of International Affairs 27(1): 63–77.
March, L. & Mudde, C. (2005). What’s Left of the Radical Left? The European Radical Left After 1989: Decline and Mutation. Comparative European Politics 3(1): 23–49.
Mény, Y. & Surel, Y. (2002). The Constitutive Ambiguity of Populism. In Y. Mény & Y. Surel (eds.), Democracies and the Populist Challenge. New York: Palgrave.
17
Moffitt, B. (2015). How to Perform Crisis: A Model for Understanding the Key Role of Crisis in Contemporary Populism. Government and Opposition 50(2): 189–217.
Mudde, C. (2004). The Populist Zeitgeist. Government and Opposition 39(4): 542–563.
Mudde, C. (2007). Populist Radical Right Parties in Europe. Cambridge: Cambridge University Press.
Mudde, C. & Rovira Kaltwasser, C. (2012). Populism and (liberal) democracy: a framework for analysis. In C. Mudde & C. Rovira Kaltwasser (eds.), Populism in Europe and the Americas: threat or corrective for democracy? Cambridge ; New York: Cambridge University Press.
Mudde, C. & Rovira Kaltwasser, C. (2013). Exclusionary vs. Inclusionary Populism: Comparing the Contemporary Europe and Latin America. Government & Opposition 48(2): 147–174.
Oesch, D. (2008). Explaining Workers’ Support for Right-Wing Populist Parties in Western Europe: Evidence from Austria, Belgium, France, Norway, and Switzerland. International Political Science Review 29(3): 349–373.
O’Malley, E. & FitzGibbon, J. (2015). Everywhere and Nowhere: Populism and the Puzzling Non-Reaction to Ireland’s Crises. In H. Kriesi & T. S. Pappas (eds.), European Populism in the Shadow of the Great Recession. Colchester: ECPR Press.
Panizza, F. (2005). Introduction: Populism and the mirror of democracy. In F. Panizza (ed.), Populism and the mirror of democracy. London ; New York, NY: Verso.
Pappas, T.S. & Kriesi, H. (2015). Populism and Crisis: A Fuzzy Relationship. In H. Kriesi & T. S. Pappas (eds.), European Populism in the Shadow of the Great Recession. Colchester: ECPR Press.
Pauwels, T. (2011). Measuring Populism: A Quantitative Text Analysis of Party Literature in Belgium. Journal of Elections, Public Opinion and Parties 21(1): 97–119.
Remmer, K.L. (2012). The Rise of Leftist– Populist Governance in Latin America The Roots of Electoral Change. Comparative Political Studies 45(8): 947–972.
Roberts, K.M. (2007). Latin America’s Populist Revival. SAIS Review of International Affairs 27(1): 3–15.
Rooduijn, M. (2014a). The Nucleus of Populism: In Search of the Lowest Common Denominator. Government and Opposition 49(4): 573–599.
Rooduijn, M. (2014b). Vox populismus: a populist radical right attitude among the public? Nations and Nationalism 20(1): 80–92.
Rydgren, J. (2007). The Sociology of the Radical Right. Annual Review of Sociology 33(1): 241–262.

18
Sass, Catherine, Jean-Jacques Moulin, René Guéguen, Loïc Abric, Virginie Dauphinot, Caroline Dupré, Jean Pierre Giordanella, Florence Girard, Catherine Guenot, and Émilie Labbe. 2006. “Le Score Epices: Un Score Individuel de Précarité. Construction Du Score et Mesure Des Relations Avec Des Données de Santé, Dans Une Population de 197 389 Personnes.” Bulletin Épidémiologique Hebdomadaire 14: 93–96.
Stanley, B. (2008). The thin ideology of populism. Journal of Political Ideologies 13(1): 95–110.
Stanley, B. (2011). Populism, nationalism, or national populism? An analysis of Slovak voting behaviour at the 2010 parliamentary election. Communist and Post-Communist Studies 44(4): 257–270.
Swank, D. & Betz, H.-G. (2003). Globalization, the welfare state and right-wing populism in Western Europe. Socio-Economic Review 1(2): 215–245.
Taggart, P. (2000). Populism. Buckingham [England] ; Philadelphia: Open University Press.
Taggart, P. (2004). Populism and representative politics in contemporary Europe. Journal of Political Ideologies 9(3): 269–288.
van der Brug, W. (2003). How the LPF Fuelled Discontent: Empirical tests of explanations of LPF support. Acta Politica 38(1): 89–106.
van der Brug, W., Fennema, M. & Tillie, J. (2000). Anti-immigrant Parties in Europe: Ideological or Protest Vote? European Journal of Political Research 37(1): 77–102.
van der Brug, W., Fennema, M. & Tillie, J. (2005). Why Some Anti-Immigrant Parties Fail and Others Succeed. Comparative Political Studies 38(5): 537 –573.
van Holsteyn, J.J.M. & Irwin, G.A. (2003). Never a dull moment: Pim Fortuyn and the Dutch parliamentary election of 2002. West European Politics 26(2): 41–66.
van Kessel, S. (2011). Explaining the Electoral Performance of Populist Parties: The Netherlands as a Case Study. Perspectives on European Politics and Society 12: 68–88.
van Kessel, S. (2013). A Matter of Supply and Demand: The Electoral Performance of Populist Parties in Three European Countries. Government and Opposition 48(02): 175–199.
van Kessel, S. (2014). The populist cat-dog: applying the concept of populism to contemporary European party systems. Journal of Political Ideologies 19(1): 99–118.
19
Table 1. Populist attitudes
1 2 3 4 5 6 7 8 Index
France 75 66 61 65 77 57 73 78 2,94 Germany 71 55 54 44 67 43 51 70 2,66 Greece 85 66 73 61 81 62 81 82 3,00 Italy 74 63 69 63 82 60 80 83 3,03 Poland 84 64 78 59 84 46 71 78 2,93 Spain 83 65 69 53 80 42 80 83 2,96 Sweden 79 48 49 38 67 44 45 51 2,58 Switzerland 72 60 53 46 65 37 48 64 2,59 UK 79 47 57 43 72 47 51 71 2,63
Note: figures in columns 1 to 8 show the percentage of respondents that “agree” or “strongly agree” each with the following statements:
1. The politicians in [country] need to follow the will of the people 2. The people, and not politicians, should make our most important policy decisions 3. The political differences between the elite and the people are larger than the differences among
the people 4. I would rather be represented by a citizen than by a specialized politician 5. Elected officials talk too much and take too little action 6. What people call “compromise” in politics is really just selling out on one’s principles 7. The particular interests of the political class negatively affect the welfare of the people 8. Politicians always end up agreeing when it comes to protecting their privileges
The composite index is the average score across all items, each coded from 0 (Strongly Disagree) to 4 (Strongly Agree).

20
Table 2. Explaining populist attitudes in nine countries (1) (2) (3) Female -0,041** -0,040** -0,028* (0,011) (0,011) (0,012) Age 0,022** 0,015** 0,014** (0,002) (0,002) (0,002) Age squared -0,000** -0,000** -0,000** (0,000) (0,000) (0,000) Non-national -0,107** -0,102** -0,096** (0,031) (0,031) (0,033) Education (ref.=University)
Completed secondary 0,029* 0,032* 0,048** (0,014) (0,014) (0,014) Less than secondary 0,022 0,031+ 0,029+ (0,016) (0,016) (0,017)
Unemployed 0,020 -0,005 -0,030 (0,018) (0,018) (0,019) Social class (ref.=professional)
Manager -0,027 -0,034+ -0,019 (0,020) (0,020) (0,020) Clerical 0,085** 0,093** 0,071** (0,019) (0,019) (0,019) Commercial 0,058** 0,054* 0,066** (0,022) (0,022) (0,022) Supervisor 0,138** 0,147** 0,156** (0,027) (0,027) (0,027) Skilled manual 0,112** 0,117** 0,124** (0,022) (0,022) (0,022) Unskilled 0,162** 0,153** 0,132** (0,022) (0,022) (0,023) Other 0,083** 0,107** 0,134** (0,022) (0,022) (0,023)
Household income -0,141** -0,020 -0,005 (0,021) (0,022) (0,023) Reduce consumption (last 5 years) 0,295** 0,167** (0,024) (0,025) Denied services/benefits (12 mo) 0,093** 0,076** (0,018) (0,019) Job crisis (5 y) 0,157** 0,130** (0,023) (0,024) Country economy (last 12 mo) -0,720** (0,028) Left-right placement -0,079** (0,021) Political knowledge 0,215** (0,022) Attachment to incumbent -0,250** (0,018) Country (ref.=UK)
France 0,289** 0,271** 0,184** (0,024) (0,024) (0,026) Germany 0,051* 0,063** 0,103** (0,024) (0,024) (0,025) Sweden -0,085** -0,072** -0,114** (0,024) (0,024) (0,025) Poland 0,292** 0,219** 0,184** (0,024) (0,024) (0,026) Italy 0,396** 0,353** 0,224**

21
(0,024) (0,024) (0,026) Spain 0,301** 0,256** 0,236** (0,024) (0,024) (0,025) Greece 0,307** 0,167** -0,019 (0,024) (0,025) (0,027) Switzerland 0,022 0,008 0,031 (0,025) (0,024) (0,026)
Constant 2,046** 2,009** 2,430** (0,054) (0,054) (0,061) Observations 15669 15398 13119 R-squared 0,097 0,119 0,192 Unstandardized regression coefficients, with robust standard errors in parentheses. The dependent variable is the index of populist attitudes, coded from 0 to 4. All independent variables are coded from 0 to 1, except age (years). + p<.1, * p<.05, ** p<.01

Table 3. Country models (1): Socioeconomic position France Germany Greece Italy Poland Spain Sweden Switzerland UK Female -0,088* -0,002 -0,105** 0,050 -0,016 -0,020 -0,095** -0,009 -0,029 (0,035) (0,035) (0,029) (0,033) (0,034) (0,032) (0,034) (0,033) (0,034) Age 0,015* 0,041** 0,024** 0,030** -0,001 0,012+ 0,025** 0,020** 0,017* (0,008) (0,007) (0,007) (0,007) (0,008) (0,007) (0,007) (0,006) (0,007) Age squared -0,000 -0,000** -0,000** -0,000** 0,000 -0,000 -0,000** -0,000+ -0,000* (0,000) (0,000) (0,000) (0,000) (0,000) (0,000) (0,000) (0,000) (0,000) Non-national -0,663** -0,103 -0,447** -0,115 -0,754+ -0,122 0,067 0,036 0,261+ (0,130) (0,077) (0,098) (0,189) (0,436) (0,086) (0,133) (0,047) (0,142) Education (ref.=University) Completed secondary 0,021 0,050 0,006 -0,030 -0,036 -0,022 0,144** 0,024 0,068+ (0,042) (0,043) (0,040) (0,053) (0,045) (0,046) (0,043) (0,038) (0,041)
Less than secondary -0,045 0,090 -0,031 0,005 -0,091 0,025 0,251** -0,114* 0,108* (0,049) (0,055) (0,042) (0,056) (0,061) (0,042) (0,051) (0,052) (0,051) Unemployed 0,043 -0,013 0,068* 0,099* -0,135* 0,053 -0,012 -0,096 0,041 (0,061) (0,087) (0,034) (0,048) (0,059) (0,042) (0,073) (0,067) (0,082)
Social class (ref.=prof.) Manager 0,041 0,061 -0,093+ -0,185* -0,073 -0,043 -0,034 -0,002 0,010 (0,068) (0,061) (0,051) (0,074) (0,069) (0,060) (0,061) (0,058) (0,053) Clerical -0,026 0,049 0,013 0,173** 0,109+ 0,213** 0,075 0,022 0,042 (0,059) (0,059) (0,063) (0,053) (0,060) (0,056) (0,056) (0,058) (0,060) Commercial -0,168* -0,051 0,012 0,103 0,200** 0,130* 0,053 0,146* 0,054 (0,068) (0,068) (0,056) (0,073) (0,069) (0,065) (0,067) (0,064) (0,073) Supervisor -0,050 0,183* 0,015 0,375** 0,114 0,206** 0,202* 0,086 0,169+ (0,073) (0,087) (0,079) (0,095) (0,075) (0,080) (0,085) (0,077) (0,098) Skilled manual -0,145* 0,238** -0,054 0,173* 0,197** 0,162* 0,262** 0,045 0,226** (0,067) (0,070) (0,056) (0,068) (0,066) (0,063) (0,076) (0,067) (0,063) Unskilled 0,112 0,074 0,029 0,214** 0,187** 0,147* 0,207** 0,212* 0,236** (0,076) (0,081) (0,052) (0,065) (0,061) (0,064) (0,063) (0,087) (0,064) Other -0,081 -0,056 0,007 0,210** 0,121+ -0,028 0,196** 0,165* 0,134 (0,068) (0,082) (0,048) (0,064) (0,067) (0,066) (0,069) (0,073) (0,084)
Household income -0,147* -0,259** -0,162* 0,043 0,029 -0,068 -0,229** -0,233** -0,236** (0,065) (0,060) (0,065) (0,070) (0,061) (0,060) (0,058) (0,066) (0,063) Constant 2,525** 1,668** 2,443** 2,172** 2,758** 2,578** 1,975** 2,042** 2,221** (0,167) (0,161) (0,147) (0,166) (0,168) (0,158) (0,151) (0,146) (0,158)

23
Observations 1837 1703 1874 1774 1763 1819 1702 1660 1533 R-squared 0,071 0,069 0,052 0,050 0,033 0,033 0,085 0,082 0,060 Unstandardized regression coefficients, with robust standard errors in parentheses. The dependent variable is the index of populist attitudes, coded from 0 to 4. All independent variables are coded from 0 to 1, except age (years). + p<.1, * p<.05, ** p<.01

24
Table 4. Country models (2): Adding deprivation France Germany Greece Italy Poland Spain Sweden Switzerland UK Female -0,084* -0,008 -0,093** 0,054 -0,012 -0,014 -0,104** -0,016 -0,040 (0,034) (0,035) (0,029) (0,033) (0,034) (0,032) (0,034) (0,033) (0,034) Age 0,009 0,031** 0,011 0,023** -0,010 0,008 0,017** 0,018** 0,010 (0,008) (0,007) (0,007) (0,007) (0,008) (0,007) (0,007) (0,006) (0,007) Age squared 0,000 -0,000** -0,000 -0,000** 0,000* -0,000 -0,000* -0,000 -0,000 (0,000) (0,000) (0,000) (0,000) (0,000) (0,000) (0,000) (0,000) (0,000) Non-national -0,520** -0,141+ -0,441** -0,130 -0,775+ -0,106 0,042 0,037 0,282* (0,138) (0,077) (0,095) (0,185) (0,433) (0,088) (0,132) (0,046) (0,143) Education (ref.=University)
Completed secondary 0,021 0,062 0,039 -0,021 -0,045 -0,028 0,140** 0,050 0,040 (0,042) (0,043) (0,039) (0,052) (0,045) (0,046) (0,043) (0,038) (0,040) Less than secondary -0,044 0,118* 0,009 0,025 -0,089 0,025 0,259** -0,086+ 0,094+ (0,049) (0,055) (0,042) (0,056) (0,061) (0,042) (0,051) (0,052) (0,051)
Unemployed 0,022 -0,028 0,055 0,048 -0,156** 0,047 -0,020 -0,142* 0,034 (0,062) (0,090) (0,034) (0,048) (0,060) (0,042) (0,075) (0,068) (0,081) Social class (ref.=prof.)
Manager 0,045 0,053 -0,087+ -0,225** -0,077 -0,042 -0,046 -0,019 0,014 (0,067) (0,061) (0,050) (0,073) (0,069) (0,060) (0,061) (0,057) (0,052) Clerical 0,019 0,059 0,002 0,165** 0,110+ 0,210** 0,083 0,020 0,026 (0,059) (0,058) (0,061) (0,053) (0,061) (0,056) (0,056) (0,057) (0,059) Commercial -0,148* -0,064 0,000 0,091 0,172* 0,115+ 0,048 0,127* 0,043 (0,067) (0,067) (0,054) (0,073) (0,069) (0,065) (0,067) (0,064) (0,072) Supervisor -0,018 0,163+ -0,016 0,325** 0,127+ 0,216** 0,193* 0,116 0,205* (0,072) (0,086) (0,077) (0,094) (0,076) (0,080) (0,085) (0,076) (0,097) Skilled manual -0,103 0,217** -0,062 0,173* 0,198** 0,151* 0,262** 0,059 0,230** (0,066) (0,070) (0,055) (0,068) (0,066) (0,063) (0,075) (0,066) (0,061) Unskilled 0,139+ 0,050 -0,019 0,191** 0,185** 0,136* 0,188** 0,208* 0,214** (0,075) (0,081) (0,051) (0,064) (0,061) (0,064) (0,063) (0,087) (0,064) Other -0,018 -0,013 0,045 0,216** 0,140* -0,030 0,178* 0,155* 0,153+ (0,067) (0,082) (0,047) (0,064) (0,067) (0,066) (0,069) (0,072) (0,083)
Household income -0,023 -0,157* -0,028 0,204** 0,118+ 0,023 -0,148* -0,033 -0,122+ (0,069) (0,062) (0,067) (0,073) (0,065) (0,065) (0,062) (0,071) (0,064) Reduce consumption (5 y) 0,223** 0,218* 0,131* 0,364** 0,293** 0,168* 0,321** 0,378** 0,584**

25
(0,074) (0,086) (0,063) (0,068) (0,067) (0,072) (0,084) (0,068) (0,080) Denied services/ben. (12 mo) 0,103+ 0,123 0,116** 0,162** -0,082 0,084+ -0,159 0,164** 0,153* (0,054) (0,078) (0,034) (0,051) (0,059) (0,046) (0,098) (0,053) (0,076) Job crisis (5 y) 0,196* 0,350** 0,311** 0,109 0,141* 0,091 0,258** -0,018 -0,046 (0,081) (0,082) (0,048) (0,066) (0,063) (0,060) (0,092) (0,076) (0,081) Constant 2,455** 1,671** 2,406** 2,070** 2,723** 2,495** 1,982** 1,868** 2,198** (0,167) (0,161) (0,147) (0,165) (0,171) (0,161) (0,153) (0,147) (0,156) Observations 1810 1678 1838 1733 1715 1787 1679 1640 1516 R-squared 0,078 0,098 0,091 0,091 0,053 0,044 0,102 0,111 0,107 Unstandardized regression coefficients, with robust standard errors in parentheses. The dependent variable is the index of populist attitudes, coded from 0 to 4. All independent variables are coded from 0 to 1, except age (years). + p<.1, * p<.05, ** p<.01

26
Table 5. Country models (3): Adding sociotropic perceptions plus controls France Germany Greece Italy Poland Spain Sweden Switzerland UK Female -0,053 -0,005 -0,087** 0,028 -0,019 -0,033 -0,057 0,053 -0,038 (0,035) (0,037) (0,030) (0,033) (0,037) (0,031) (0,038) (0,036) (0,036) Age 0,006 0,024** 0,001 0,023** -0,002 0,007 0,013+ 0,019** 0,008 (0,008) (0,007) (0,007) (0,007) (0,009) (0,007) (0,007) (0,007) (0,007) Age squared -0,000 -0,000* 0,000 -0,000** 0,000 -0,000 -0,000+ -0,000+ -0,000 (0,000) (0,000) (0,000) (0,000) (0,000) (0,000) (0,000) (0,000) (0,000) Non-national -0,508** -0,210* -0,552** -0,193 -0,586 -0,111 -0,004 0,073 0,479** (0,151) (0,082) (0,099) (0,201) (0,492) (0,087) (0,138) (0,051) (0,163) Education (ref.=University)
Completed secondary 0,051 0,076+ 0,056 -0,044 -0,045 -0,025 0,150** 0,039 0,122** (0,041) (0,043) (0,040) (0,050) (0,048) (0,043) (0,045) (0,040) (0,041) Less than secondary -0,016 0,088 -0,008 0,001 -0,082 -0,032 0,257** -0,060 0,118* (0,049) (0,059) (0,043) (0,054) (0,068) (0,041) (0,054) (0,056) (0,054)
Unemployed -0,040 -0,042 0,011 0,012 -0,141* 0,027 -0,052 -0,154* -0,039 (0,066) (0,096) (0,035) (0,047) (0,067) (0,041) (0,087) (0,076) (0,085) Social class chief (ref.=professional)
Manager 0,035 0,141* -0,102* -0,240** -0,129+ -0,005 -0,066 -0,052 0,099+ (0,064) (0,063) (0,050) (0,069) (0,071) (0,056) (0,061) (0,059) (0,051) Clerical 0,070 0,065 0,021 0,097+ 0,098 0,147** 0,008 -0,017 0,011 (0,057) (0,061) (0,063) (0,051) (0,064) (0,052) (0,058) (0,060) (0,060) Commercial -0,036 -0,067 -0,017 0,042 0,149* 0,118+ 0,056 0,163* 0,081 (0,066) (0,071) (0,055) (0,071) (0,076) (0,061) (0,069) (0,067) (0,074) Supervisor 0,001 0,166+ 0,004 0,254** 0,133+ 0,199** 0,211* 0,135+ 0,262** (0,070) (0,091) (0,076) (0,088) (0,079) (0,076) (0,089) (0,079) (0,096) Skilled manual -0,047 0,201** -0,059 0,130+ 0,147* 0,167** 0,250** 0,077 0,255** (0,067) (0,074) (0,056) (0,066) (0,070) (0,059) (0,077) (0,070) (0,064) Unskilled 0,185* 0,080 -0,063 0,115+ 0,171* 0,130* 0,180** 0,250* 0,157* (0,077) (0,087) (0,053) (0,063) (0,066) (0,061) (0,066) (0,102) (0,067) Other 0,034 0,013 0,054 0,210** 0,145* 0,031 0,202** 0,195* 0,191* (0,067) (0,087) (0,048) (0,063) (0,072) (0,064) (0,072) (0,077) (0,086)
Household income 0,009 -0,032 -0,088 0,194** 0,162* 0,003 -0,104 -0,123 -0,086 (0,069) (0,067) (0,068) (0,073) (0,072) (0,062) (0,066) (0,076) (0,067)
27
Reduce consumption (5 y) 0,113 0,244** 0,094 0,053 0,159* -0,003 0,240** 0,367** 0,274** (0,074) (0,090) (0,065) (0,068) (0,074) (0,069) (0,092) (0,071) (0,084) Denied services/ben. (12 mo) 0,010 0,078 0,076* 0,165** -0,069 0,077+ -0,118 0,084 0,086 (0,056) (0,082) (0,035) (0,050) (0,065) (0,044) (0,108) (0,058) (0,080) Job crisis (5 y) 0,144+ 0,220* 0,324** 0,116+ 0,092 0,033 0,212* -0,109 0,011 (0,082) (0,087) (0,050) (0,065) (0,069) (0,057) (0,097) (0,081) (0,083) Country economy (12 mo) -1,080** -0,657** -0,474** -0,915** -0,599** -0,817** -0,427** -0,513** -1,026** (0,086) (0,112) (0,073) (0,075) (0,082) (0,072) (0,087) (0,108) (0,103) Left-right placement -0,128* 0,020 -0,271** 0,018 -0,078 -0,233** 0,033 0,326** 0,083 (0,060) (0,090) (0,060) (0,056) (0,068) (0,070) (0,075) (0,074) (0,090) Political knowledge 0,240** 0,084 0,225** 0,345** 0,284** 0,297** 0,053 0,278** 0,088 (0,061) (0,074) (0,063) (0,062) (0,083) (0,057) (0,071) (0,063) (0,072) Attachment to incumbent -0,209** -0,493** -0,019 -0,316** -0,141+ -0,201** -0,369** -0,067 -0,467** (0,069) (0,050) (0,043) (0,062) (0,075) (0,064) (0,061) (0,049) (0,063) Constant 2,995** 2,235** 2,752** 2,493** 2,826** 3,016** 2,325** 1,872** 2,783** (0,187) (0,187) (0,158) (0,175) (0,203) (0,161) (0,179) (0,179) (0,179) Observations 1493 1448 1630 1442 1404 1633 1446 1407 1212 R-squared 0,188 0,175 0,135 0,232 0,107 0,192 0,145 0,173 0,279 Unstandardized regression coefficients, with robust standard errors in parentheses. The dependent variable is the index of populist attitudes, coded from 0 to 4. All independent variables are coded from 0 to 1, except age (years). + p<.1, * p<.05, ** p<.01
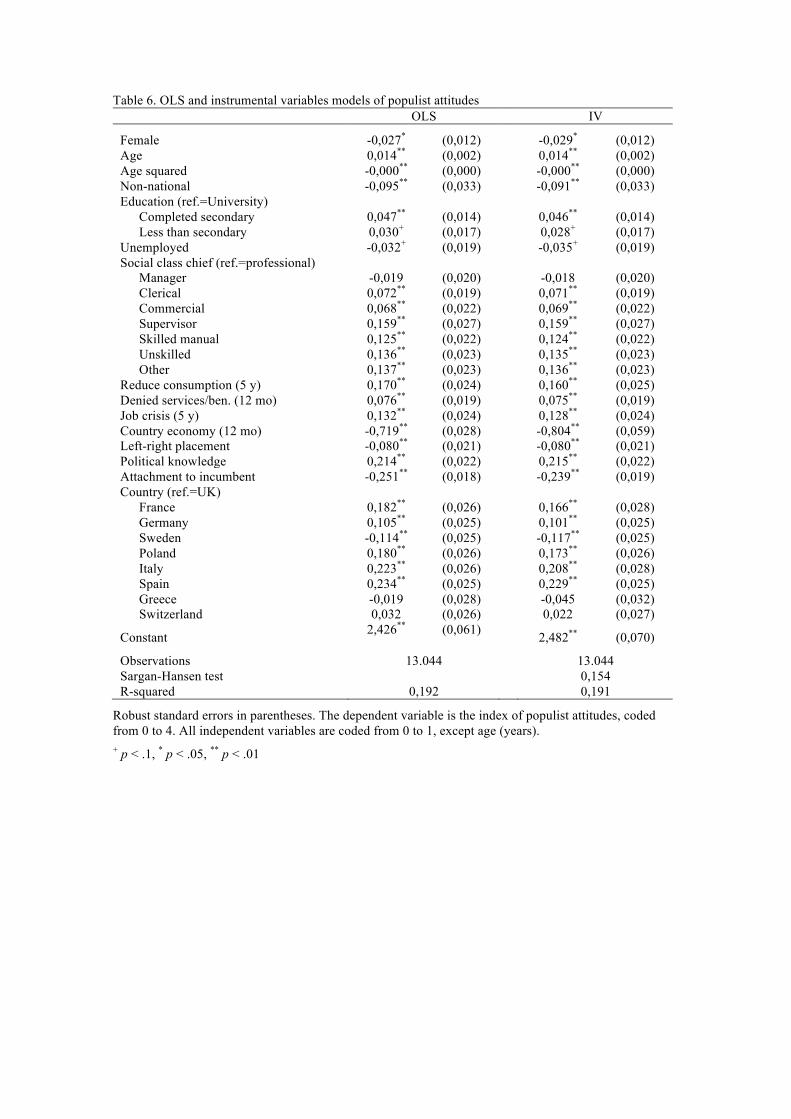
Table 6. OLS and instrumental variables models of populist attitudes OLS IV
Female -0,027* (0,012) -0,029* (0,012) Age 0,014** (0,002) 0,014** (0,002) Age squared -0,000** (0,000) -0,000** (0,000) Non-national -0,095** (0,033) -0,091** (0,033) Education (ref.=University)
Completed secondary 0,047** (0,014) 0,046** (0,014) Less than secondary 0,030+ (0,017) 0,028+ (0,017)
Unemployed -0,032+ (0,019) -0,035+ (0,019) Social class chief (ref.=professional)
Manager -0,019 (0,020) -0,018 (0,020) Clerical 0,072** (0,019) 0,071** (0,019) Commercial 0,068** (0,022) 0,069** (0,022) Supervisor 0,159** (0,027) 0,159** (0,027) Skilled manual 0,125** (0,022) 0,124** (0,022) Unskilled 0,136** (0,023) 0,135** (0,023) Other 0,137** (0,023) 0,136** (0,023)
Reduce consumption (5 y) 0,170** (0,024) 0,160** (0,025) Denied services/ben. (12 mo) 0,076** (0,019) 0,075** (0,019) Job crisis (5 y) 0,132** (0,024) 0,128** (0,024) Country economy (12 mo) -0,719** (0,028) -0,804** (0,059) Left-right placement -0,080** (0,021) -0,080** (0,021) Political knowledge 0,214** (0,022) 0,215** (0,022) Attachment to incumbent -0,251** (0,018) -0,239** (0,019) Country (ref.=UK)
France 0,182** (0,026) 0,166** (0,028) Germany 0,105** (0,025) 0,101** (0,025) Sweden -0,114** (0,025) -0,117** (0,025) Poland 0,180** (0,026) 0,173** (0,026) Italy 0,223** (0,026) 0,208** (0,028) Spain 0,234** (0,025) 0,229** (0,025) Greece -0,019 (0,028) -0,045 (0,032) Switzerland 0,032 (0,026) 0,022 (0,027)
Constant 2,426** (0,061) 2,482** (0,070)
Observations 13.044 13.044 Sargan-Hansen test 0,154 R-squared 0,192 0,191
Robust standard errors in parentheses. The dependent variable is the index of populist attitudes, coded from 0 to 4. All independent variables are coded from 0 to 1, except age (years). + p < .1, * p < .05, ** p < .01

29
Figure 1. Effect of socioeconomic position on populist attitudes
Figure 2. Effect of age on populist attitudes
Figure 3. Effect of socioeconomic position by country
Female
AgeAge sq.
Non-national
SecondaryLess
Unemployed
ManagerClerical
CommercialSupervisor
Skilled manualUnskilled
Other
Income-,4 -,3 -,2 -,1 0 ,1 ,2 ,3 ,4
Model 1
2,5
2,6
2,7
2,8
2,9
3
20 25 30 35 40 45 50 55 60 65 70 75 80Age
30
FranceGermany
GreeceItaly
PolandSpain
SwedenSwitzerland
UK
FranceGermany
GreeceItaly
PolandSpain
SwedenSwitzerland
UK
FranceGermany
GreeceItaly
PolandSpain
SwedenSwitzerland
UK
FranceGermany
GreeceItaly
PolandSpain
SwedenSwitzerland
UK
-,2 -,1 0 ,1 -,02 0 ,02 ,04 ,06 -,0006-,0004-,00020 ,0002 -1,5 -1 -,5 0 ,5
-,1 0 ,1 ,2 -,2 0 ,2 ,4 -,2 0 ,2 -,4 -,2 0 ,2
-,2 0 ,2 ,4 -,4 -,2 0 ,2 ,4 -,2 0 ,2 ,4 ,6 -,2 0 ,2 ,4
-,2 0 ,2 ,4 -,2 0 ,2 ,4 -,4 -,2 0 ,2
Female Age Age sq. Non-national
Secondary Less Unemployed Manager
Clerical Commercial Supervisor Skilled manual
Unskilled Other Income

31
Figure 4. Effect of deprivation and sociotropic perceptions on populist attitudes
Reduced consumption
Denied services/benefits
Job crisis
Country economy
Left-right placement
Political knowledge
Attachment to incumbent
-1 -,8 -,6 -,4 -,2 0 ,2 ,4
Model 2 Model 3

32
Figure 5. Effect of deprivation by country
Figure 6. Effect of sociotropic perceptions and additional controls by country
FranceGermany
GreeceItaly
PolandSpain
SwedenSwitzerland
UK
FranceGermany
GreeceItaly
PolandSpain
SwedenSwitzerland
UK
-,5 0 ,5 1
-,5 0 ,5 1
Reduced consumption Denied services/benefits
Job crisis
FranceGermany
GreeceItaly
PolandSpain
SwedenSwitzerland
UK
FranceGermany
GreeceItaly
PolandSpain
SwedenSwitzerland
UK
-1,5 -1 -,5 0 ,5 -1,5 -1 -,5 0 ,5
Country economy Left-right placement
Political knowledge Attachment to incumbent

33
Figure 7. Country means
ItalyGreece
SpainFrancePoland
GermanyUK
SwitzerlandSweden
ItalyGreece
SpainFrancePoland
GermanyUK
SwitzerlandSweden
2,4 2,6 2,8 3 3,2 2,4 2,6 2,8 3 3,2
Country means Model 1
Model 2 Model 3