economic consequences of high public debt and lessons ... · economic consequences of high public...
TRANSCRIPT
Economic consequences of high public debt and lessons learned from past episodes
ECFIN Workshop, Brussels, 18 January 2018
The views expressed are those of the authors and do not necessarily reflect
those of the ECB.
Presented by Cristina Checherita-Westphal
Pascal Jacquinot
Based on joint work with ESCB WGPF Team
ECB-RESTRICTED
Rubric
www.ecb.europa.eu
2
Overview of presentation ECB-RESTRICTED
1 Introduction
2 Economic consequences of high public debt regimes
3 Debt reduction strategies
4 Conclusions
i. Literature review
ii. Model-based simulations:
- short-term analysis testing the resilience of the economy to shocks
- long-term analysis
i. Past episodes of debt reduction: literature review
ii. Challenges ahead in the EA
Rubric
www.ecb.europa.eu3
1. Introduction
Paper motivation, focus and main findings
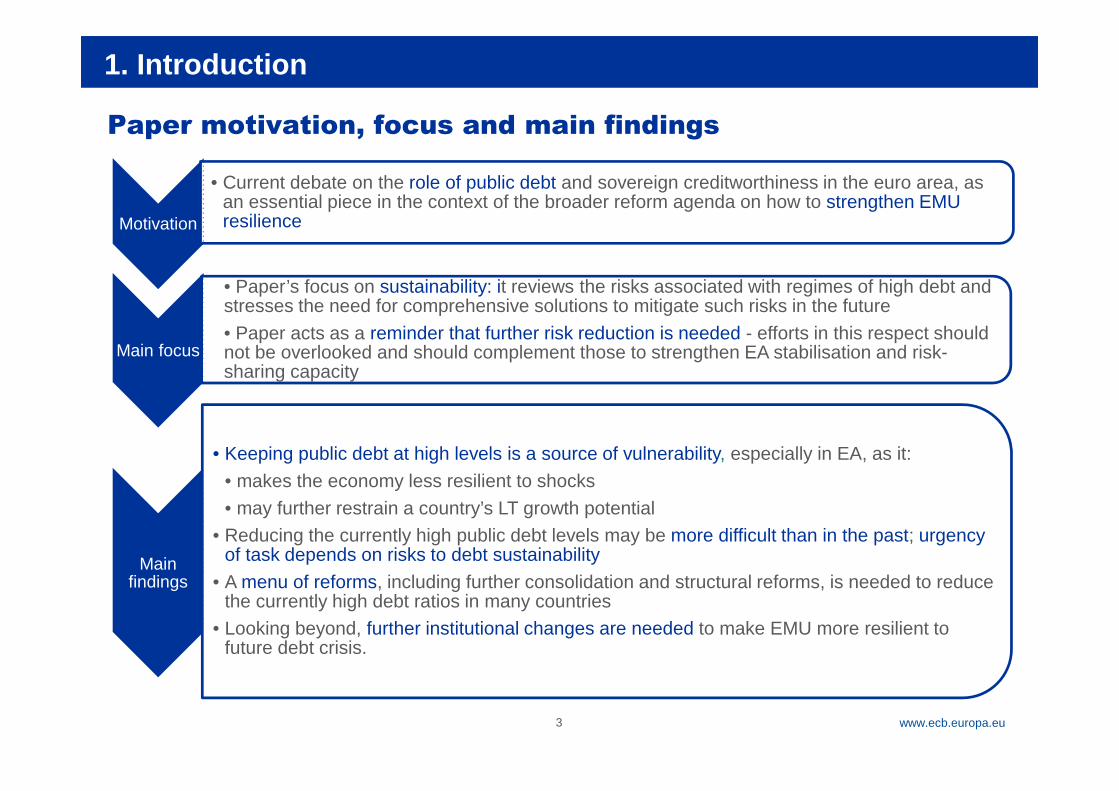
Motivation
• Current debate on the role of public debt and sovereign creditworthiness in the euro area, as an essential piece in the context of the broader reform agenda on how to strengthen EMU resilience
Main focus
• Paper’s focus on sustainability: it reviews the risks associated with regimes of high debt and stresses the need for comprehensive solutions to mitigate such risks in the future
• Paper acts as a reminder that further risk reduction is needed - efforts in this respect should not be overlooked and should complement those to strengthen EA stabilisation and risk-sharing capacity
Main findings
• Keeping public debt at high levels is a source of vulnerability, especially in EA, as it:
• makes the economy less resilient to shocks
• may further restrain a country’s LT growth potential
• Reducing the currently high public debt levels may be more difficult than in the past; urgency of task depends on risks to debt sustainability
• A menu of reforms, including further consolidation and structural reforms, is needed to reduce the currently high debt ratios in many countries
• Looking beyond, further institutional changes are needed to make EMU more resilient to future debt crisis.
Rubric
www.ecb.europa.eu
1. Introduction
4
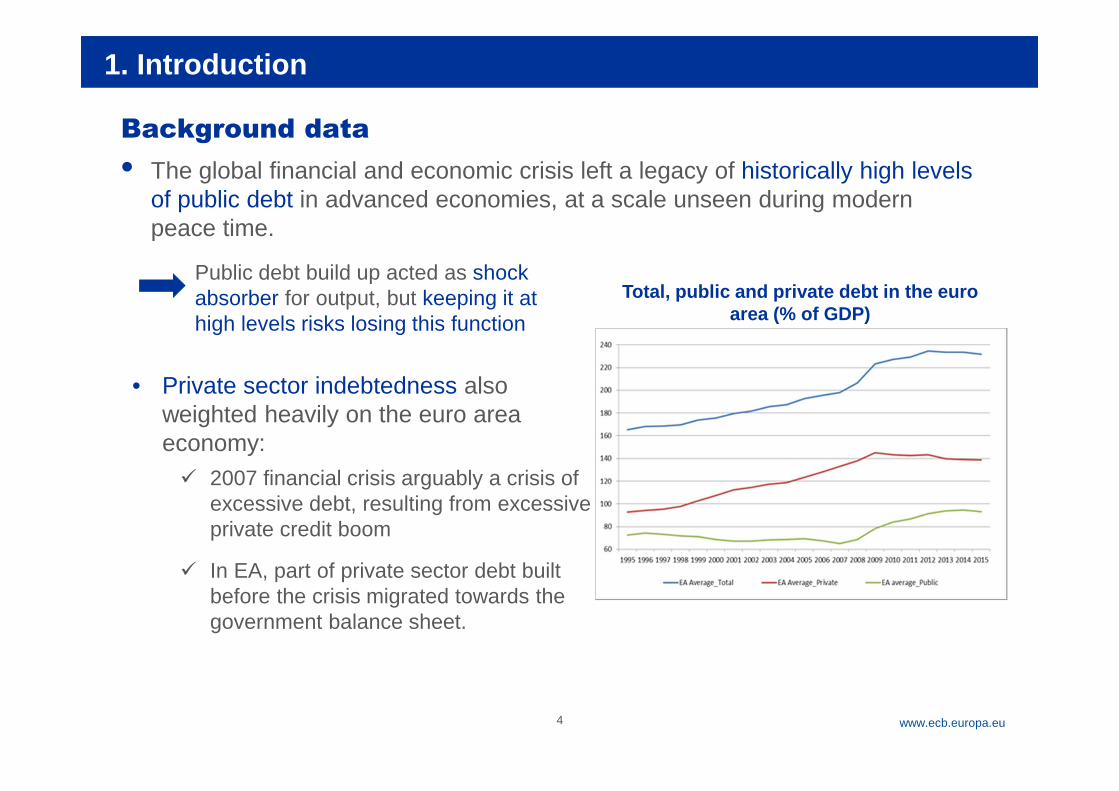
Background data• The global financial and economic crisis left a legacy of historically high levels
of public debt in advanced economies, at a scale unseen during modern peace time.
Public debt build up acted as shock absorber for output, but keeping it at high levels risks losing this function
• Private sector indebtedness also weighted heavily on the euro area economy:
2007 financial crisis arguably a crisis of excessive debt, resulting from excessive private credit boom
In EA, part of private sector debt built before the crisis migrated towards the government balance sheet.
Total, public and private debt in the euro area (% of GDP)
Rubric
www.ecb.europa.eu
1. Introduction
5
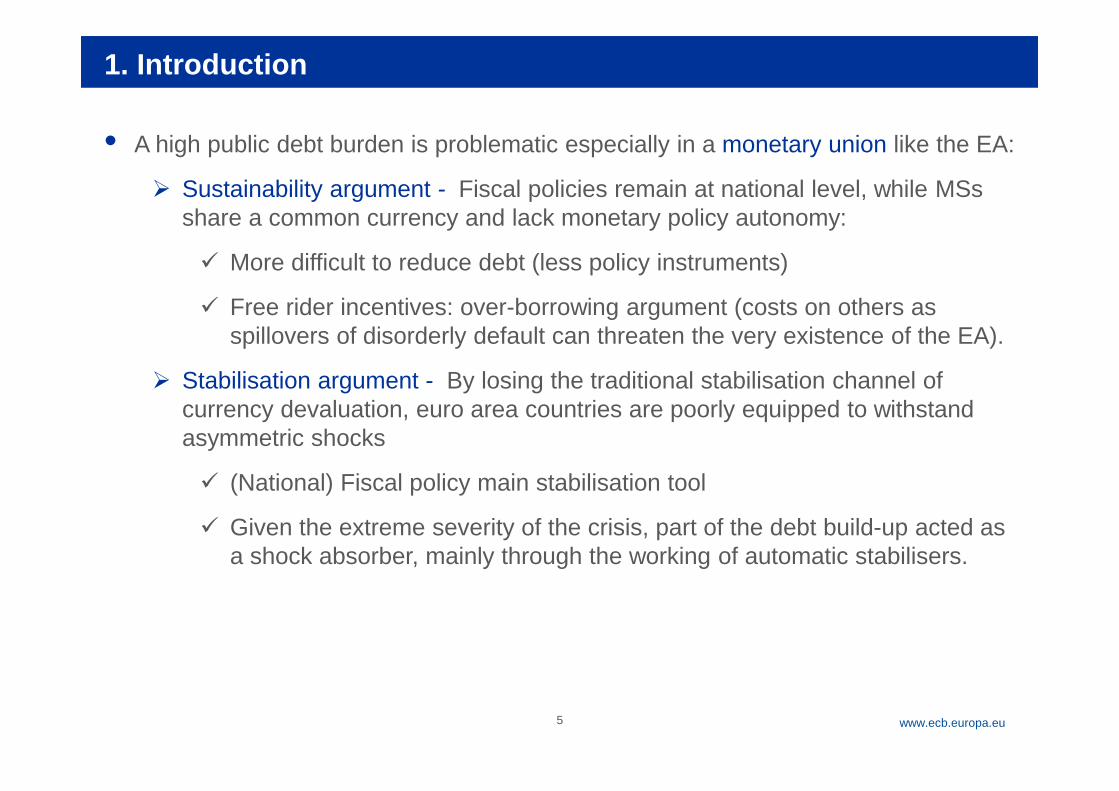
• A high public debt burden is problematic especially in a monetary union like the EA:
Sustainability argument - Fiscal policies remain at national level, while MSs share a common currency and lack monetary policy autonomy:
More difficult to reduce debt (less policy instruments)
Free rider incentives: over-borrowing argument (costs on others as spillovers of disorderly default can threaten the very existence of the EA).
Stabilisation argument - By losing the traditional stabilisation channel of currency devaluation, euro area countries are poorly equipped to withstand asymmetric shocks
(National) Fiscal policy main stabilisation tool
Given the extreme severity of the crisis, part of the debt build-up acted as a shock absorber, mainly through the working of automatic stabilisers.
Rubric
www.ecb.europa.eu
Structure
1 Introduction
6
2 Economic consequences of high public debt regimes
3 Debt reduction strategies
4 Conclusions
i. Literature review
ii. Model-based simulations:
- short-term analysis testing the resilience of the economy to shocks
- long-term analysis
i. Past episodes of debt reduction: literature review
ii. Challenges ahead in the EA
Rubric
www.ecb.europa.eu
2.i. Economic consequences of high public debt – Lit. review
7
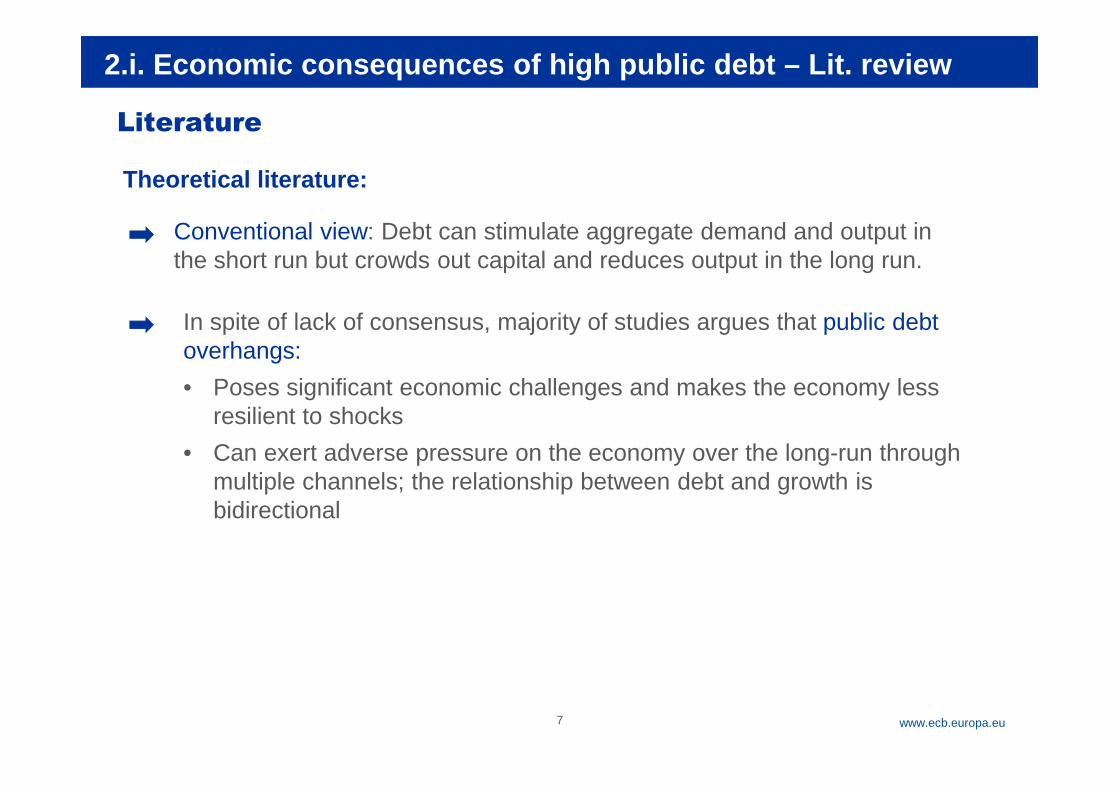
Conventional view: Debt can stimulate aggregate demand and output in the short run but crowds out capital and reduces output in the long run.
In spite of lack of consensus, majority of studies argues that public debt overhangs:
• Poses significant economic challenges and makes the economy less resilient to shocks
• Can exert adverse pressure on the economy over the long-run through multiple channels; the relationship between debt and growth is bidirectional
Theoretical literature:
Literature

Rubric
www.ecb.europa.eu
2.i. Economic consequences of high public debt – Lit. review
8
Empirical literature:
Several empirical studies point to a negative relationship between government debt and subsequent (per capita) real GDP growth, especially beyond a certain threshold, often estimated at around 90% of GDP (85-100%)
Others conclude that there is no universally valid threshold: especially the literature on debt limits (focused on thresholds beyond which government defaults, with country-specific estimates varying widely or depending on multiple model assumptions and states of the economy)
Rubric
www.ecb.europa.eu9
2.ii. Economic consequences of high public debt – Model simulations
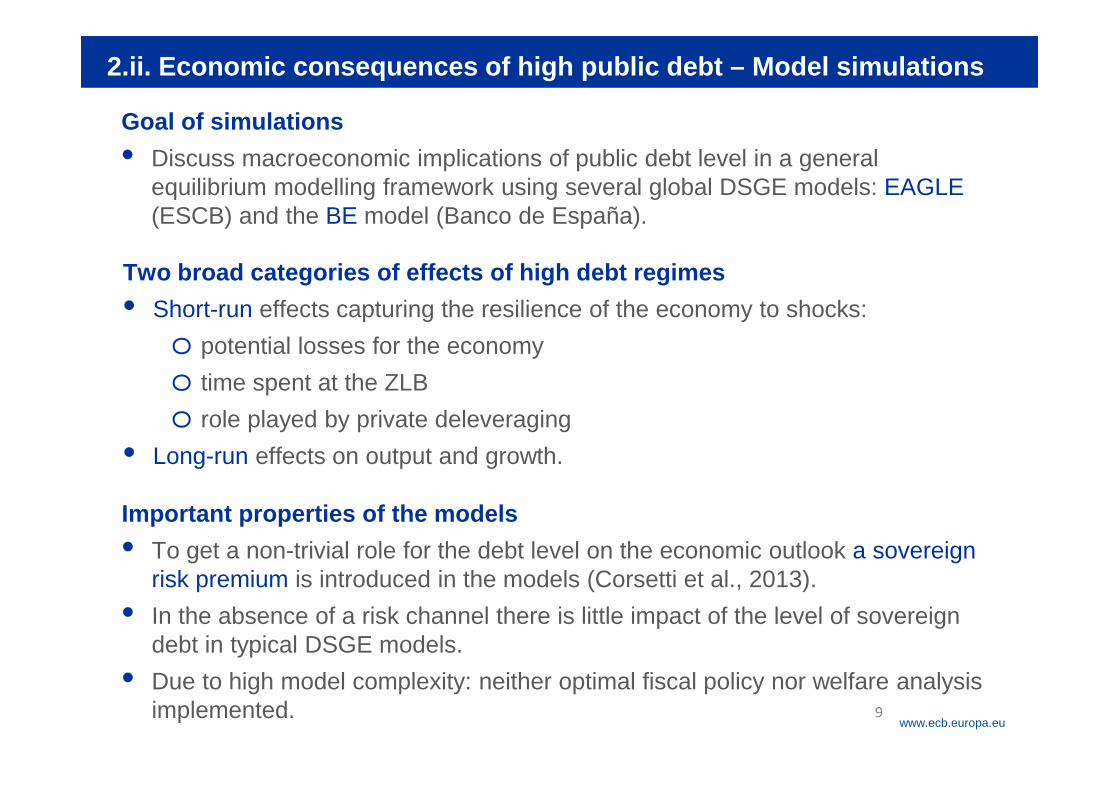
Goal of simulations
• Discuss macroeconomic implications of public debt level in a general equilibrium modelling framework using several global DSGE models: EAGLE(ESCB) and the BE model (Banco de España).
Two broad categories of effects of high debt regimes
• Short-run effects capturing the resilience of the economy to shocks:
o potential losses for the economy
o time spent at the ZLB
o role played by private deleveraging
• Long-run effects on output and growth.
Important properties of the models
• To get a non-trivial role for the debt level on the economic outlook a sovereign risk premium is introduced in the models (Corsetti et al., 2013).
• In the absence of a risk channel there is little impact of the level of sovereign debt in typical DSGE models.
• Due to high model complexity: neither optimal fiscal policy nor welfare analysis implemented.
Rubric
www.ecb.europa.eu
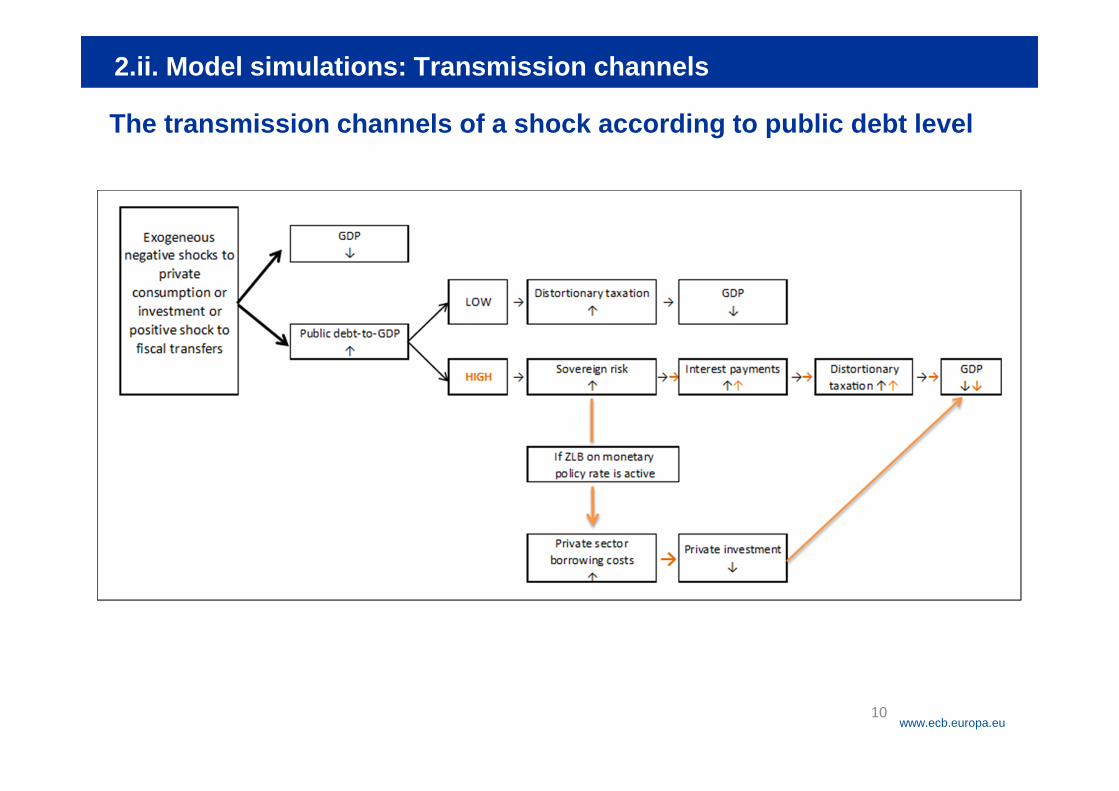
The transmission channels of a shock according to public debt level
10
2.ii. Model simulations: Transmission channels
Rubric
www.ecb.europa.eu
Question: What would be the short-term costs in terms of output losses of a very high level
of debt?
11
2.ii. Model simulations: Short term (EAGLE)
Scenario 1
Shocks:
• Adverse on private consumption
• Adverse on private investment
• Positive on public (lump-sum) transfers (compensatory measure)
Additional information
• Each scenario will be computed for low (60%) and very high (120%) level of debt-to-GDP ratio.
• The fiscal authority uses the labor income tax to stabilize the debt ratio.
• Economic agents fully expect that interest rates will be fixed for a given period of two years.
• Shocks are implemented at the domestic level.
Rubric
www.ecb.europa.eu
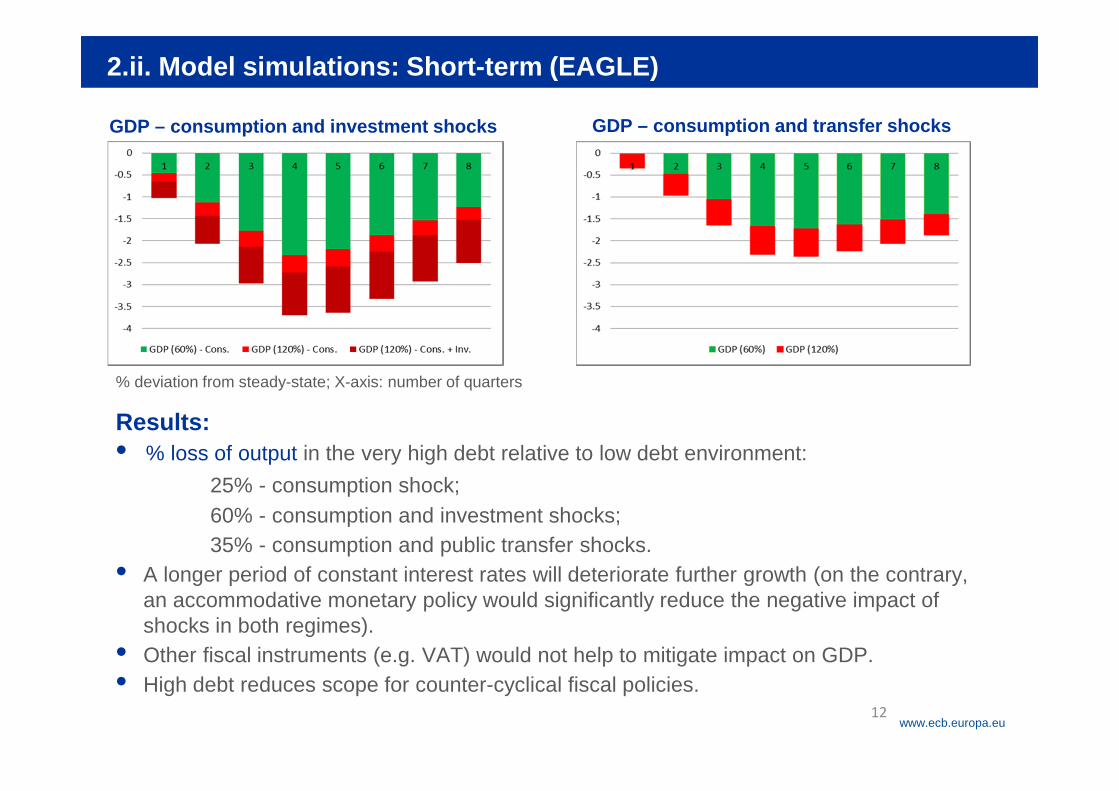
GDP – consumption and investment shocks
12
2.ii. Model simulations: Short-term (EAGLE)
% deviation from steady-state; X-axis: number of quarters
GDP – consumption and transfer shocks
Results:• % loss of output in the very high debt relative to low debt environment:
25% - consumption shock; 60% - consumption and investment shocks;35% - consumption and public transfer shocks.
• A longer period of constant interest rates will deteriorate further growth (on the contrary, an accommodative monetary policy would significantly reduce the negative impact of shocks in both regimes).
• Other fiscal instruments (e.g. VAT) would not help to mitigate impact on GDP.• High debt reduces scope for counter-cyclical fiscal policies.
Rubric
www.ecb.europa.eu
Question: What would be the consequence of adverse shocks when the economy is stuck in
a liquidity trap?
• The monetary authorities follow a Taylor rule in normal times, i.e. when the interest rate the rule delivers is non-negative; otherwise (crisis time), the nominal interest rate equals zero.
• A succession of large unexpected worldwide shocks are run to bring the economy at the ZLB, into the liquidity trap, for around a couple of years.
13
2.ii. Model simulations: Zero lower bound (EAGLE)
Scenario 2
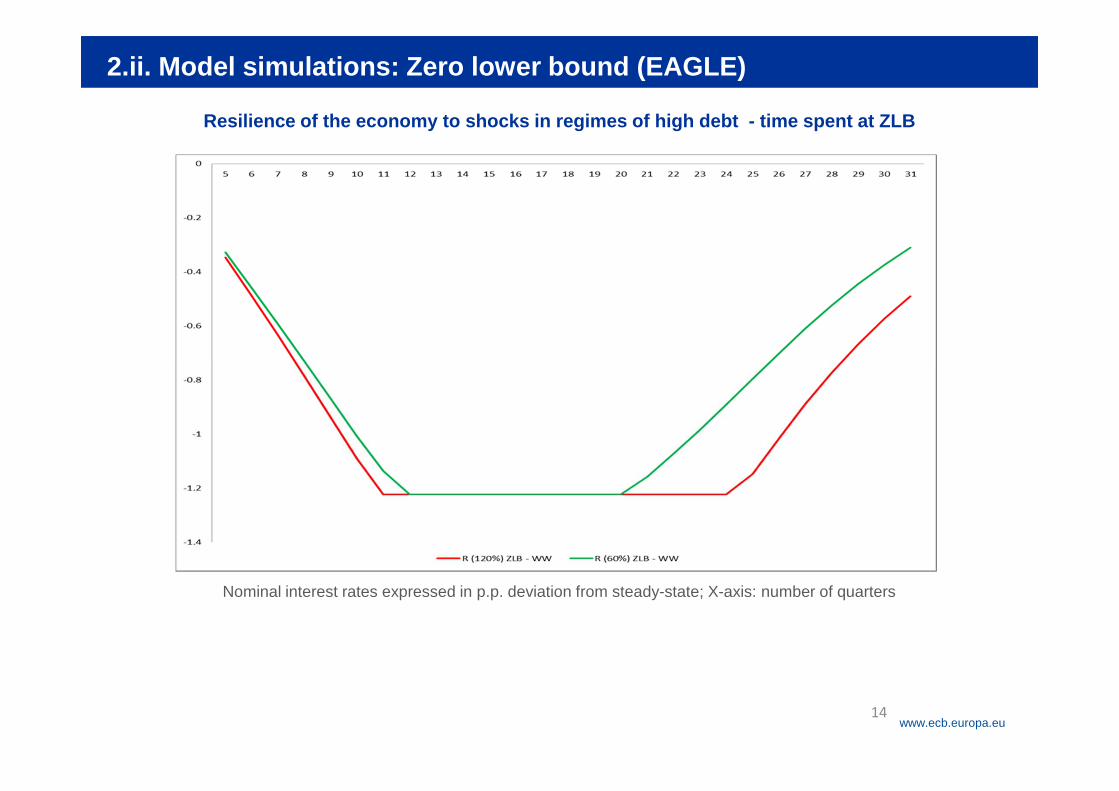
Results:
• An economy exposed to a higher level of debt will be more vulnerable to the ZLB (one year longer in the 120% case compared to the 60% case).
• In case of external adverse shocks, trade spillovers increase the time spent at the ZLB for a economy with high debt.
Rubric
www.ecb.europa.eu14
2.ii. Model simulations: Zero lower bound (EAGLE)
Resilience of the economy to shocks in regimes of high debt - time spent at ZLB
Nominal interest rates expressed in p.p. deviation from steady-state; X-axis: number of quarters
Rubric
www.ecb.europa.eu
Question: What would be the role played by private deleveraging ?
15
2.ii. Model simulations: Private deleveraging (BE)
Scenario 3
• BE model (with borrowing constraints in the private sector)
• Large and persistent shock to bring the economy to the ZLB.
• High debt (75% of GDP) and low debt (25%) considered.
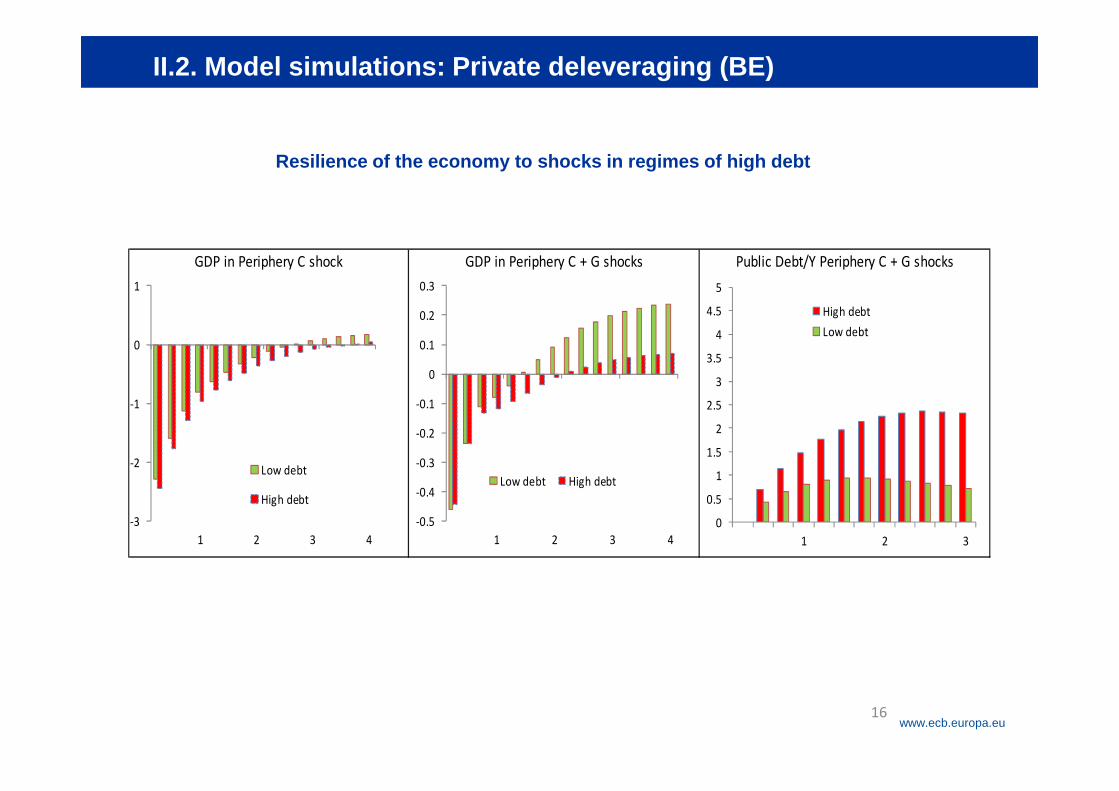
Results:
• Higher public debt exacerbates private sector constraints, through the crowding out of private debt (in the high debt calibration, liquidity constrained agents are even more constrained).
• A fiscal expansion in the high public debt economy turns rapidly more adverse.
• The increase in the risk premium and the associated crowding out of private debt more than compensates the gain from relieving the households’ financial constraint.
Rubric
www.ecb.europa.eu16
• II.2. Model simulations: Private deleveraging (BE)
Resilience of the economy to shocks in regimes of high debt
GDP in Periphery C shock GDP in Periphery C + G shocks Public Debt/Y Periphery C + G shocks
-3
-2
-1
0
1
1 2 3 4
Low debt
High debt
-0.5
-0.4
-0.3
-0.2
-0.1
0
0.1
0.2
0.3
1 2 3 4
Low debt High debt
0
0.5
1
1.5
2
2.5
3
3.5
4
4.5
5
1 2 3
High debtLow debt
Rubric
www.ecb.europa.eu
Structure
1 Introduction
17
2 Economic consequences of high public debt regimes
3 Debt reduction strategies
4 Conclusions
i. Literature review
ii. Model-based simulations:
- short-term analysis testing the resilience of the economy to shocks
- long-term analysis
i. Past episodes of debt reduction: literature review
ii. Challenges ahead in the EA
Rubric
www.ecb.europa.eu
3. Debt reduction strategies
18
• Literature identifies a combination of factors needed for successful debt-reducing episodes
• Fiscal discipline and strong growth are pointed out as the main drivers.
• Not all elements of debt reduction strategies used in the past are likely to be successfully replicated in the euro area.
• Main challenges going forward:
low potential growth
still large consolidation effort needed in some countries and fiscal fatigue;
ageing costs
reversal i-g differential
private sector deleveraging.
Rubric
www.ecb.europa.eu
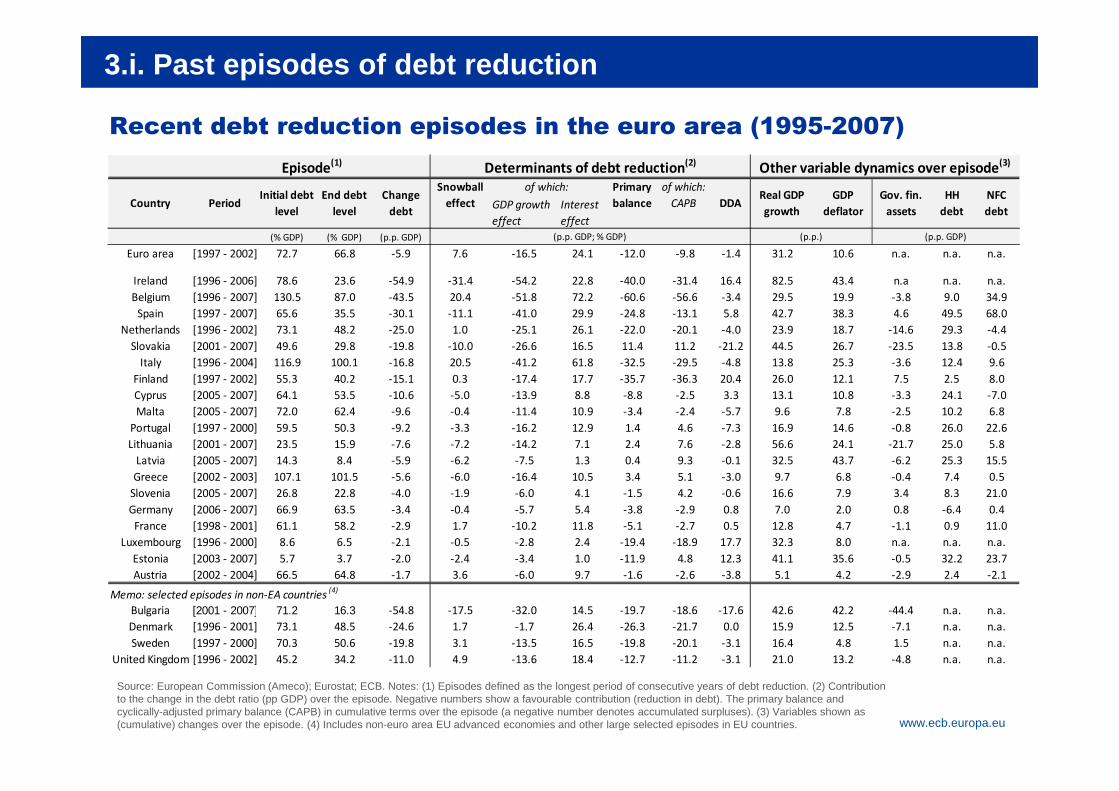
Recent debt reduction episodes in the euro area (1995-2007)
GDP growth effect
Interest effect
(% GDP) (% GDP) (p.p. GDP)
Euro area [1997 - 2002] 72.7 66.8 -5.9 7.6 -16.5 24.1 -12.0 -9.8 -1.4 31.2 10.6 n.a. n.a. n.a.
Ireland [1996 - 2006] 78.6 23.6 -54.9 -31.4 -54.2 22.8 -40.0 -31.4 16.4 82.5 43.4 n.a n.a. n.a.Belgium [1996 - 2007] 130.5 87.0 -43.5 20.4 -51.8 72.2 -60.6 -56.6 -3.4 29.5 19.9 -3.8 9.0 34.9
Spain [1997 - 2007] 65.6 35.5 -30.1 -11.1 -41.0 29.9 -24.8 -13.1 5.8 42.7 38.3 4.6 49.5 68.0Netherlands [1996 - 2002] 73.1 48.2 -25.0 1.0 -25.1 26.1 -22.0 -20.1 -4.0 23.9 18.7 -14.6 29.3 -4.4
Slovakia [2001 - 2007] 49.6 29.8 -19.8 -10.0 -26.6 16.5 11.4 11.2 -21.2 44.5 26.7 -23.5 13.8 -0.5Italy [1996 - 2004] 116.9 100.1 -16.8 20.5 -41.2 61.8 -32.5 -29.5 -4.8 13.8 25.3 -3.6 12.4 9.6
Finland [1997 - 2002] 55.3 40.2 -15.1 0.3 -17.4 17.7 -35.7 -36.3 20.4 26.0 12.1 7.5 2.5 8.0Cyprus [2005 - 2007] 64.1 53.5 -10.6 -5.0 -13.9 8.8 -8.8 -2.5 3.3 13.1 10.8 -3.3 24.1 -7.0Malta [2005 - 2007] 72.0 62.4 -9.6 -0.4 -11.4 10.9 -3.4 -2.4 -5.7 9.6 7.8 -2.5 10.2 6.8
Portugal [1997 - 2000] 59.5 50.3 -9.2 -3.3 -16.2 12.9 1.4 4.6 -7.3 16.9 14.6 -0.8 26.0 22.6Lithuania [2001 - 2007] 23.5 15.9 -7.6 -7.2 -14.2 7.1 2.4 7.6 -2.8 56.6 24.1 -21.7 25.0 5.8
Latvia [2005 - 2007] 14.3 8.4 -5.9 -6.2 -7.5 1.3 0.4 9.3 -0.1 32.5 43.7 -6.2 25.3 15.5Greece [2002 - 2003] 107.1 101.5 -5.6 -6.0 -16.4 10.5 3.4 5.1 -3.0 9.7 6.8 -0.4 7.4 0.5
Slovenia [2005 - 2007] 26.8 22.8 -4.0 -1.9 -6.0 4.1 -1.5 4.2 -0.6 16.6 7.9 3.4 8.3 21.0Germany [2006 - 2007] 66.9 63.5 -3.4 -0.4 -5.7 5.4 -3.8 -2.9 0.8 7.0 2.0 0.8 -6.4 0.4
France [1998 - 2001] 61.1 58.2 -2.9 1.7 -10.2 11.8 -5.1 -2.7 0.5 12.8 4.7 -1.1 0.9 11.0Luxembourg [1996 - 2000] 8.6 6.5 -2.1 -0.5 -2.8 2.4 -19.4 -18.9 17.7 32.3 8.0 n.a. n.a. n.a.
Estonia [2003 - 2007] 5.7 3.7 -2.0 -2.4 -3.4 1.0 -11.9 4.8 12.3 41.1 35.6 -0.5 32.2 23.7Austria [2002 - 2004] 66.5 64.8 -1.7 3.6 -6.0 9.7 -1.6 -2.6 -3.8 5.1 4.2 -2.9 2.4 -2.1
Memo: selected episodes in non-EA countries (4)
Bulgaria [2001 - 2007] 71.2 16.3 -54.8 -17.5 -32.0 14.5 -19.7 -18.6 -17.6 42.6 42.2 -44.4 n.a. n.a.Denmark [1996 - 2001] 73.1 48.5 -24.6 1.7 -1.7 26.4 -26.3 -21.7 0.0 15.9 12.5 -7.1 n.a. n.a.Sweden [1997 - 2000] 70.3 50.6 -19.8 3.1 -13.5 16.5 -19.8 -20.1 -3.1 16.4 4.8 1.5 n.a. n.a.
United Kingdom [1996 - 2002] 45.2 34.2 -11.0 4.9 -13.6 18.4 -12.7 -11.2 -3.1 21.0 13.2 -4.8 n.a. n.a.
PeriodInitial debt
levelEnd debt
levelChange
debt
Episode(1) Determinants of debt reduction(2) Other variable dynamics over episode(3)
(p.p. GDP; % GDP) (p.p.) (p.p. GDP)
of which:Gov. fin.
assetsHH
debtNFC debt
Snowball effect
Primary balance DDA
Real GDP growth
GDP deflator
of which: CAPBCountry
3.i. Past episodes of debt reduction
Source: European Commission (Ameco); Eurostat; ECB. Notes: (1) Episodes defined as the longest period of consecutive years of debt reduction. (2) Contribution to the change in the debt ratio (pp GDP) over the episode. Negative numbers show a favourable contribution (reduction in debt). The primary balance and cyclically-adjusted primary balance (CAPB) in cumulative terms over the episode (a negative number denotes accumulated surpluses). (3) Variables shown as (cumulative) changes over the episode. (4) Includes non-euro area EU advanced economies and other large selected episodes in EU countries.
Rubric
www.ecb.europa.eu
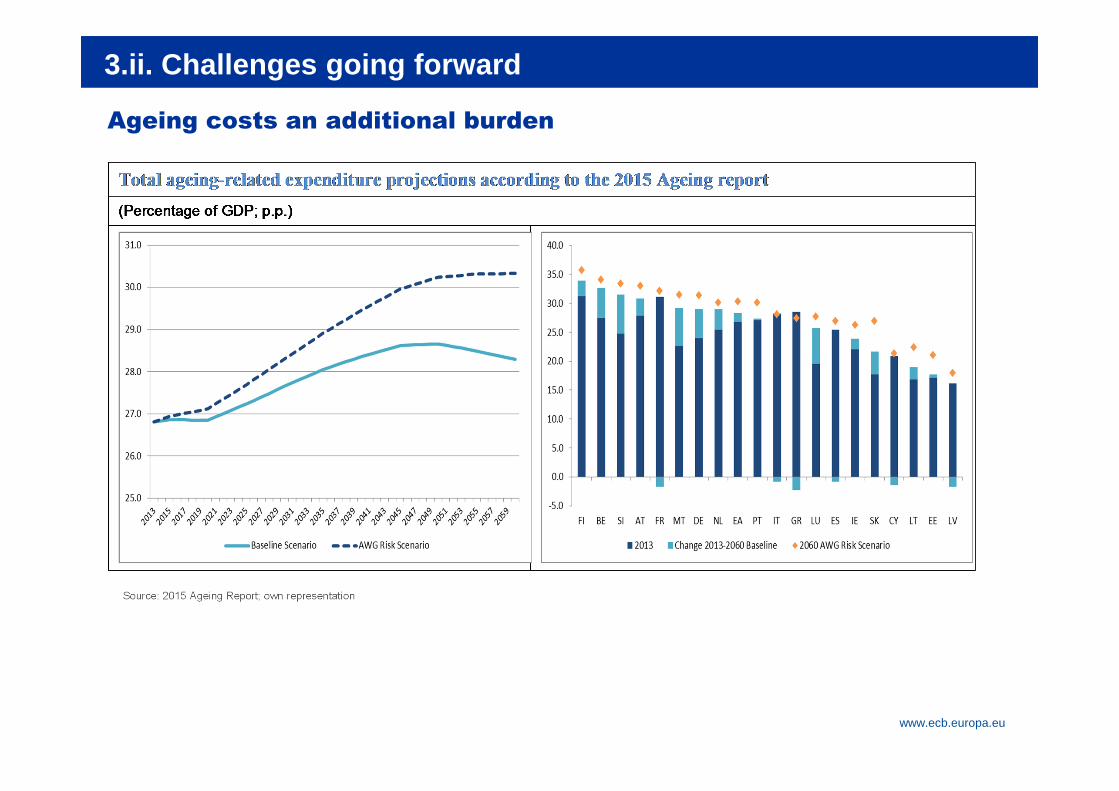
Ageing costs an additional burden
3.ii. Challenges going forward
Source: 2015 Ageing Report; own representation
Rubric
www.ecb.europa.eu
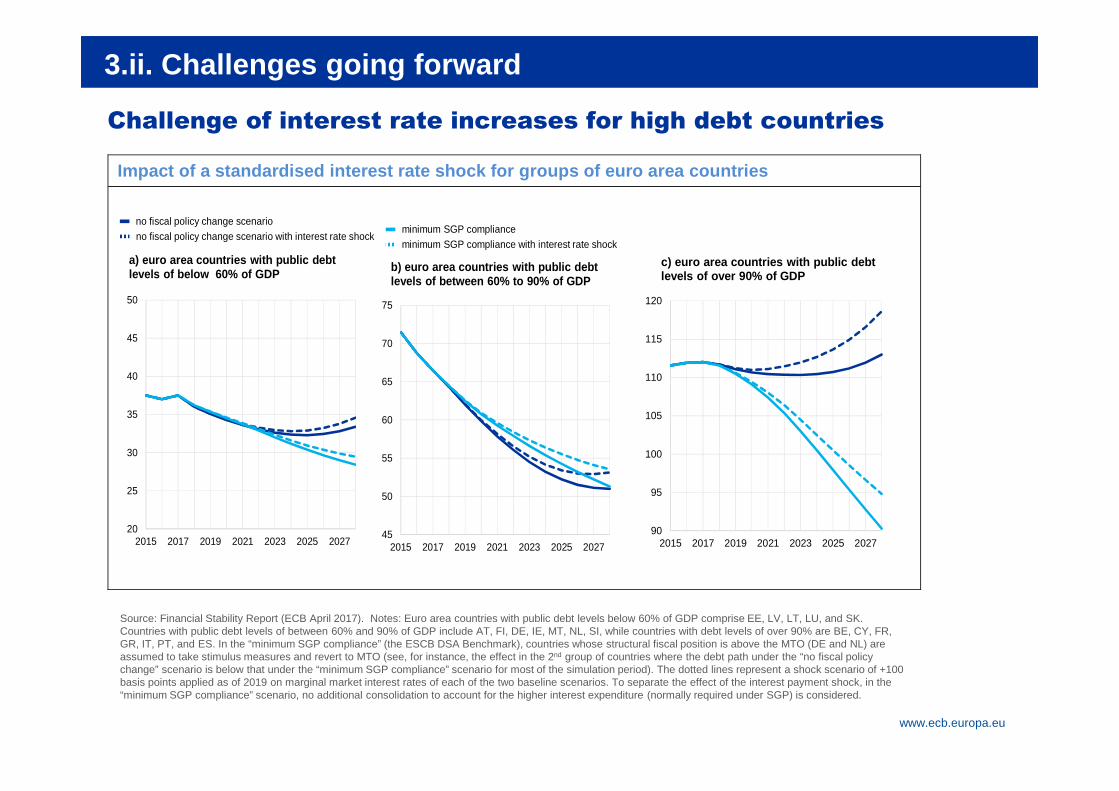
Challenge of interest rate increases for high debt countries
3.ii. Challenges going forward
Source: Financial Stability Report (ECB April 2017). Notes: Euro area countries with public debt levels below 60% of GDP comprise EE, LV, LT, LU, and SK. Countries with public debt levels of between 60% and 90% of GDP include AT, FI, DE, IE, MT, NL, SI, while countries with debt levels of over 90% are BE, CY, FR, GR, IT, PT, and ES. In the “minimum SGP compliance” (the ESCB DSA Benchmark), countries whose structural fiscal position is above the MTO (DE and NL) are assumed to take stimulus measures and revert to MTO (see, for instance, the effect in the 2nd group of countries where the debt path under the “no fiscal policy change” scenario is below that under the “minimum SGP compliance” scenario for most of the simulation period). The dotted lines represent a shock scenario of +100 basis points applied as of 2019 on marginal market interest rates of each of the two baseline scenarios. To separate the effect of the interest payment shock, in the “minimum SGP compliance” scenario, no additional consolidation to account for the higher interest expenditure (normally required under SGP) is considered.
Impact of a standardised interest rate shock for groups of euro area countries
20
25
30
35
40
45
50
2015 2017 2019 2021 2023 2025 2027
no fiscal policy change scenariono fiscal policy change scenario with interest rate shock
a) euro area countries with public debt levels of below 60% of GDP
45
50
55
60
65
70
75
2015 2017 2019 2021 2023 2025 2027
minimum SGP complianceminimum SGP compliance with interest rate shock
b) euro area countries with public debt levels of between 60% to 90% of GDP
90
95
100
105
110
115
120
2015 2017 2019 2021 2023 2025 2027
c) euro area countries with public debt levels of over 90% of GDP
Rubric
www.ecb.europa.eu
Structure
1 Introduction
22
2 Economic consequences of high public debt regimes
3 Debt reduction episodes
4 Conclusions
i. Literature review
ii. Model-based simulations:
- short-term analysis testing the resilience of the economy to shocks
- long-term analysis
i. Past episodes of debt reduction: literature review
ii. Debt reduction strategies for the euro area: challenges ahead
Rubric
www.ecb.europa.eu
Conclusions
23
• Existing evidence underpins the importance of reducing public debt to restore fiscal sustainability and support stronger fundamentals in the euro area:
- While public debt build-up can act as a shock-absorber during crisis times, high public debt poses significant economic challenges and makes the economy less resilient to shocks.
• The DSGE simulations also suggest that high-debt economies
- can lose more output in a crisis,
- may spend more time at the zero-lower bound,
- are more heavily affected by spillover effects,
- face a crowding out of private debt in the short and long run,
- have less scope for counter-cyclical fiscal policy and
- are adversely affected in terms of potential (long-term) output.
Rubric
www.ecb.europa.eu
Conclusions
24
• Various academic works have investigated large past debt reductions and found that a combination of debt-reducing factors was needed:
- Looking ahead, many elements of debt reduction strategies used in the past may not be successfully replicated in the euro area.
- Debt reduction in euro area countries can be achieved at least to some extent through a mix of policies measures, whose urgency depends on risks to debt sustainability.
• Apart from this, more comprehensive institutional changes may be needed in EMU to strengthen market-based discipline for sound fiscal and economic policies and, most importantly, prevent and resolve future debt crisis:
- But depending heavily on government actions and political support.
Rubric
www.ecb.europa.eu
Thank you for your attention!
25