economic benefits of peer- to-peer transport services · economic benefits of peer-to-peer...
TRANSCRIPT
Economic benefits of peer-to-peer transport services
Uber
25 August 2015

Economic benefits of peer-to-peer transport services
Authors:
Amanda Stefansdotter
Carl von Utfall Danielsson
Dr Claus Kastberg Nielsen
Dr Eva Rytter Sunesen
Economic benefits of peer-to-peer transport services
Table of contents
Executive summary 3
1 Introduction: Urban growth and pressured infrastructure creates a need for new solutions 5
2 Immediate effects: More efficient utilisation of capital and slightly higher traffic volumes 11
3 Induced effects: Less car ownership and lower traffic volumes 20
4 Economic effects: Time savings and increased productivity 27
5 Employment effects: Commercialised driving and increased labour supply 33
6 Environmental effects: Lower emissions and freed up space 36
References 40

Economic benefits of peer-to-peer transport services
Economic benefits of peer-to-peer transport services
3
Executive summary
Copenhagen Economics has been commissioned by Uber to estimate the economic impact
of having a well-functioning peer-to-peer transport service in the Nordics within a Mobil-
ity-as-a-Service concept, using Stockholm as a case study. Peer-to-peer transport services
allow citizens (peers) to provide on-demand transport to other citizens (peers) using their
personal vehicles. The idea behind the Mobility-as-a-Service concept is to allow citizens of
a city to purchase their preferred choice of transport using a mix of public (subway, train
or bus) and private (taxi, car, bike) transportation providers. In the ultimate case, citizens
can buy all their transport services from mobility providers.
We conclude that a well-functioning peer-to-peer transport service, within a Mobility-as-
a-Service concept, is likely to create significant economic benefits by changing the
overall composition of demand for transport and thereby influencing traffic flows. In ad-
dition, such a system comes with very low investment costs, unlike many infrastructure
projects with similar effects.
Due to their low costs and ease of use, peer-to-peer transport services are likely to imme-
diately attract demand from other types of transport, and to induce car owners to give up
car ownership, thereby reducing the use of private cars. Under conservative assumptions,
the combined effect reduces the number of daily car trips by up to 37,000 trips (3 per
cent of total) and leads to a reduction of the total number of active cars in Stockholm by
up to 18,000 (5 per cent of total). The former effect lowers traffic intensity and con-
gestion, which in turn decreases time spent in traffic, creating a total value for society of
up to SEK 870 million per year. For example, a commuter travelling by car would save
up to a full working day per year previously spent waiting in traffic.
An effective peer-to-peer transport service therefore generates comparable reductions
in travel time as Förbifart Stockholm, a large infrastructure investment project, but
at a significantly lower price tag. Förbifart Stockholm is expected to generate time savings
at a value of around SEK 600 million per year at a cost of nearly SEK 30 billion. The ef-
fects are also comparable to those of Stockholmsförsöket, the system of conges-
tion charges in Stockholm city. Stockholmsförsöket is (also) expected to generate time
savings of around SEK 600 million, but levies SEK 750 million per year in congestion
charges on drivers.
Well-functioning peer-to-peer transport services are also likely to create new jobs. In the
short run, a peer-to-peer service creates almost 3,000 full-time jobs, as citizens who
normally drive their own car shift to commercial peer-to-peer transport. The new jobs re-
duce unemployment if the jobs are filled by persons having difficulties finding employ-
ment elsewhere. In the long run, labour supply increases for two reasons. First, some citi-
zens with full-time jobs drive peer-to-peer during their spare time, increasing their total
labour supply. Second, the lower traffic intensity reduces congestion and generates time
savings, some of which will be spent working. Overall, a well-functioning peer-to-peer
transport service can in the long run sustain almost 1,000 new full-time jobs in
Economic benefits of peer-to-peer transport services
4
Stockholm. Similar effects can be expected in the other Nordic capitals Oslo, Copenha-
gen and Helsinki, at a scale proportional to their number of inhabitants relative to Stock-
holm.
Finally, well-functioning peer-to-peer transport services are likely to have an impact on
the environment, in particular emissions and land use. Emissions in the form of particle
and CO2 pollution decrease when the number of vehicle trips declines, and since vehicles
in the peer-to-peer fleet are likely to be newer models (with lower emissions) than an av-
erage private vehicle. We estimate, conservatively, that emissions in Stockholm decrease,
at an economic value of up to SEK 200 million. The improved utilisation of vehicles
will also reduce the demand for parking in the city centre. This will free up space in
streets, which can used for other transport purposes. As an example, we estimate that the
space made available from a peer-to-peer could make room for 63 km of new bike
lanes. In addition, it would become easier and less costly to remove snow in Nordic capi-
tals.
The abovementioned effects occur since citizens adjust their transport demand in the
presence of peer-to-peer car transport services. Peer-to-peer transport is attractive to citi-
zens since they imply low prices and low transaction costs.1
Peer-to-peer fares are likely to be 40 to 60 per cent lower than a similar ride in a taxi. The
low costs are made possible by a better utilisation of existing private cars through rides-
haring. Ridesharing enables private citizens to offer a ride against a fare to other citizens
with a transport demand, and enables private citizens in real time to offer rides for a
(lower) fare to other independent citizens who need to go in the same direction.
Peer-to-peer transport implies low transactions costs because riders and passengers are
connected using GPS-based apps. Such apps allow citizens to share their identity, convey
their position, and manage payments, thus facilitating a real-time connection between
people looking for a ride with those who have a spare seat. These features also reduce the
risk normally associated with the taxi industry by letting both parties know in advance
who are involved in the transaction and what the price will be. These features make peer-
to-peer transport feasible and safe, both for drivers and passengers.2
1 A well-functioning peer-to-peer transport service within a Maas concept also implies more choice for passengers. More
choice is generated since passengers can chose transport services of different quality, according to their preferences.
Choices can include different kinds of carpooling and carsharing options, or varying levels of service quality of rides.
Greater choice and diversity enables citizens to get a better match with their preferences and stimulates demand. 2 We assume that peer-to-peer transport services assure that drivers are qualified, that cars are safe, and that passengers are
covered by adequate insurance.
Economic benefits of peer-to-peer transport services
5
Chapter 1
1 Introduction: Urban growth and pressured infrastructure creates a need for new solutions
Metropolitan areas have long attracted citizens who enjoy the benefits of jobs, education,
culture, and social life. Stockholm is not an exception. Each year Stockholm welcomes
36,000 new citizens, and the population of Greater Stockholm is expected to exceed 2.5
million by 2030.3 The growing number of new residents will boost the strong economy of
Stockholm and reinforce its position as a centre of population and economic activity in
Sweden.4
The urban growth creates an increasingly mounting need for basic services such as hous-
ing and transport. Housing supply in Stockholm has long fallen short of demand, and the
need for transport is expected to do the same: Swedish authorities expect demand for
road transport to increase by more than three times (80 per cent) the population growth
(25 per cent) by the end of 2030.5 The surge in demand for transport will inevitably create
problems for both citizens and businesses in Stockholm.
Stockholm has significant congestion and expensive public transport
There is currently a large gap between the demand for transport and the available infra-
structure in Stockholm. Virtually all roads into the city centre are congested in the morn-
ing, with traffic often coming to complete standstills. A citizen with a daily 30-minute
commute (each way) loses more than two working weeks per year in delays. At its current
pace, this number will increase to more than four weeks by 2030.6 Lack of parking space
wastes significant amounts of time for citizens: one study found that as much as 30 per
cent of city-centre traffic is trying to find a parking space at any given time.7 The con-
gested Stockholm traffic means that residents have less time for leisure, work and shop-
ping, and that businesses are less productive.
The City of Stockholm is actively trying to close the gap between transport demand and
supply by investing in large infrastructure projects aimed at improving both public and
private transport. An example is Trafiksatsning Stockholm: a 112 billion SEK (11.7 billion
EUR), multi-modal programme that will create more bus lanes, set up new train lines
(e.g. Citybanan), build new roads (e.g. Norra Länken), and reserve more urban space for
3 Stockholms Handelskammare (2015). 4 Half the Swedish population growth until 2045 takes place in Greater Stockholm. By then Greater Stockholm houses 25 per
cent of the Swedish population, while generating more than 50 per cent of Sweden’s GDP. See European Commission
(2011). 5 The population of Stockholm is forecasted to grow at a rate of 20,000 people per year until 2030. See Trafikanalys (2011). 6 Today, a resident with a daily 30-minute commute (each way) loses 87 hours per year due to congestion, and is expected to
lose 156 hours in 2030 if nothing is done. See Trafikanalys (2011). 7 Roland Berger Strategy Consultants (2014).
Economic benefits of peer-to-peer transport services
6
bike lanes.8 These initiatives aim to facilitate the overall flow of transport and steer de-
mand towards transport modes with lower congestion problems: public transport and
bikes. Despite the magnitude of these investments, however, they are not poised to meet
their objective. When Trafiksatsning Stockholm is complete, average commuters in Stock-
holm are still expected to lose one workweek per year due to congestion in addition to the
two weeks they waste today.9 The projects also put additional pressure on the public fi-
nances of the City of Stockholm; public finances struggling to cope with one of the most
expensive urban transport systems in the world.10
Technology offers new possibilities for peer-to-peer transport
The availability of information technology has opened up new possibilities for transport
planning in large cities. Innovation in the realms of communication technology creates
new ways of connecting things and processes over the web. The growth of smartphone use
and the entry of internet platforms have already transformed several other areas, where
consumption increasingly goes from buying a certain good to buying access to that good:
a notion sometimes branded collaborative consumption.11 Collaborative consumption is
based on an economic model in which people swap, barter, trade, rent or share resources
with each other, and covers areas such as space sharing, co-working, household item
rental, funding and lending, and currency exchange.
Transport systems planned using information technology are often referred to as ITS or
Intelligent Transport Systems.12 An example is the Mobility-as-a-Service (MaaS) concept
developed and promoted by the city of Helsinki.13 The idea behind the Mobility-as-a-Ser-
vice concept is to let citizens of a metropolis purchase all types of transport (by bus, train,
bike, car or boat) from public and private transportation providers. Citizens can choose
comprehensive mobility packages according to their financial capabilities, their preferred
travel modes and preferred choice of booking and payment. The contact between the citi-
zens and the various mobility providers is organised through a GPS-based app. The appli-
cation allows a rider to request a ride with the push of a button and track the car’s pro-
gress toward the requested pickup location.
It is not new to offer citizens access to (public) transport in various packages. One exam-
ple is the SL Access-kort, which provides access to public metro, train, bus and bikes in
Greater Stockholm. What is new is integrating private transport modes such as taxis and
rental cars in the public offer, thereby increasing the possibility to meet largely all of a
user’s needs. What is also new is incorporating peer-to-peer transport services, allowing
citizens (peers) who need a ride with other citizens who are car owners (peers) with an
idle seat in their car. The combination of public and private transport modes makes it eas-
ier to design transport offerings that match users’ individual preferences, and is thus
likely to appeal to more citizens than otherwise. In the ultimate case, citizens buy all
8 www.trafiksatsningstockholm.se. 9 Trafikanalys (2011). 10 See for example http://www.va.se/nyheter/2013/12/16/stockholms-kollektivtrafik-bland-de-dyraste-i-varlden/. 11 See for example Botsman & Rogers (2010). The website www.collaborativeconsumption.com defines Collaborative Con-
sumption as "An economic model based on sharing, swapping, trading, or renting products and services, enabling access
over ownership. It is reinventing not just what we consume but how we consume." See http://www.collaborativeconsump-
tion.com/2013/11/22/the-sharing-economy-lacks-a-shared-definition/ 12 See for example European Commission (2015). 13 Heikkilä (2014).
Economic benefits of peer-to-peer transport services
7
transport services from mobility providers. In this setting, peer-to-peer transport adds a
new brick to the transport system: a solution that encourages private car owners against a
fare to share their car with citizens in need of a ride.
We distinguish between two types of peer-to-peer transport: Sharing without and with at
least another unrelated passenger. Ridesharing with a single passenger means that a pri-
vate driver picks up a customer for a fare14, either on his or her way somewhere, or as a
way to earn money. Ridesharing with another passenger means that the private driver
picks up two or more unrelated customers riding on similar routes. The app matches rid-
ers in real time and assigns them to the same car, provided of course that the first cus-
tomer is interested in sharing the trip. The latter type of ridesharing comes at a lower
price for consumers, but is logistically more complex as you need to match transport de-
mand for specific rides in real time in order to avoid excessive waiting time. A study from
New York finds that ridesharing with several independent customers per ride is techni-
cally realistic for at least 25 per cent of all taxi rides, and that that cumulative trip miles
ideally can be reduced by 40 cent by exploiting the technical potential for ridesharing in
the city.15
Whether a ride is shared with unrelated passengers or not, peer-to-peer transport in-
creases consumers’ mobility choices. With a new choice available, some consumers will
switch to peer-to-peer transport depending on how attractive they see the new transport
mode relative to others.
Low prices, low transaction costs and more choice attracts citizens to peer-
to-peer
We judge that three key features of a peer-to-peer transport service will make it attractive
to citizens: low prices, low transaction costs, and more choice.
Peer-to-peer transport implies low prices. Experiences with peer-to-peer transport show
that ridesharing with a single customer (such as uberPOP16) can be offered at prices that
are at least 40 per cent lower than the taxi prices, while ridesharing with several inde-
pendent passengers (such as the experimental uberPOOL17) can be offered at prices that
are at least 60 per cent lower than taxi. The lower prices stem from the fact that peer-to-
peer transport allows those providing rides to share their spare capacity (of cars), and
consumers to share the cost of the ride by travelling with someone else.
Peer-to-peer transport also implies low transaction costs, primarily facilitated by GPS-
based apps. The technology makes it possible to connect two citizens in real time who can
share identity, rating, location and price in advance. In addition, the technology facilitates
payment transactions. These features assign properties to peer-to-peer transport that very
14 The trip can also include more customers known to each other in advance. To simplify, we use the phrase ‘single passenger’
to signify this kind of trip. 15 Santi el al (2014). 16 uberPOP is a peer-to-peer transport service that allows private citizens (once they and their cars have been approved by
Uber) to offer rides to other citizens against a fare. 17 uberPOOL is a peer-to-peer transport service that allows private citizens to offer rides to more than one other resident rid-
ing on similar routes. uberPOOL is not yet active in Stockholm, but is operated in the US on trial basis.
Economic benefits of peer-to-peer transport services
8
much resembles the properties of using one’s own car (once it is bought). Finally, the in-
formation conveyed through the app reduces many of the problems that have traditionally
plagued the taxi industry.18 The social or public element of the app enables evaluation and
feedback channels that provide a kind of "insurance": unreliable providers and users are
exposed for all market players to see. This lessens the need for regulation and opens up to
more competition in the taxi market, which increases the incentives for taxi companies to
improve their services. Thus, overall market efficiency improves to the benefit of consum-
ers. Peer-to-peer transport, though, also has the potential to increase transaction costs if
uncertainty arises whether peer-to-peer rides are insured, or whether cars and drivers
meet satisfactory minimum standards. If not adequately handled, the result may be lower
demand for peer-to-peer transport.
Peer-to-peer transport allows for more choice because it is possible to define different
qualities of peer-to-peer transport and communicate the identity of these concepts to citi-
zens.19 Examples are the various versions of Uber: uberX, uberBLACK, uberLUX and even
uberBoat. Additionally, the mobile platforms used for peer-to-peer services increase
choice for the individual service, as a customer’s online request for a ride can include a
particular route, and even what music to listen to during the ride. Wider choice is a direct
source of economic welfare gain for consumers.
In summary, peer-to-peer ridesharing within a MaaS concept has the potential to meet
increasing transport needs, and to alleviate some of the pressure on public budgets. Such
a system will also have wider impacts on the economy, environment and employment. Co-
penhagen Economics has been commissioned by Uber to assess these impacts, using
Stockholm as a case study. We do this using standard economic theory, conservative as-
sumptions from a range of – mainly academic – sources, available empirical studies and
statistics for transport patterns in Greater Stockholm in 2014.20
The analysis: A well-functioning peer-to-peer service in Stockholm
The report analyses a scenario where a well-functioning peer-to-peer transport service is
existent in Greater Stockholm. A well-functioning peer-to-peer service is defined as one
where citizens can offer rides to other citizens in their private car for a fare, either with a
single customer, or with several customers on the same route. The system operates under
certain regulated conditions, for example with respect to insurance and safety, but is oth-
erwise unrestricted and can grow in line with demand.
18 The presence of what is called informational asymmetries is one of the main reasons for regulating taxi services. Informa-
tional asymmetries mean that riders cannot compare information on price or service quality before choosing a vehicle, re-
sulting in poor service quality. This issue along with low barriers to entry enabling over-competition, leading to aggressive
and unsafe driver behaviour, poor vehicle maintenance, and congestion has long been an important argument for regulating
the taxi industry (Rayle et al, 2014). Regulatory responses include restrictions on market entry and supply (i.e., medallion
systems), fare regulation, and vehicle and driver safety standards. Today, new technologies can mitigate the asymmetry
problem and reduce the need for regulation as prices are known in advance (also opening for choice), and as the driver and
passenger are known to each other in advance (through rating systems). 19 The availability of different types of peer-to-peer transport makes it easier to match the demand from citizens whose prefer-
ences may change over time and to match demand from citizens with different likes and dislikes towards public and private
transport. 20 This means we calculate all effects as if they would happen immediately i.e. based on current traffic volumes and transport
market shares. The reason for this approach is that a large number of factors play a role for future development, making the
projections of the future very uncertain. In combination with the large number of parameters involved, this would make the
analysis overly complicated.
Economic benefits of peer-to-peer transport services
9
We assume that peer-to-peer services are offered via a GPS-based app used to share the
identity and location of drivers and passengers, and to facilitate payments and driver as-
sessments. The transaction costs of peer-to-peer services are low, as the technology re-
duces the risk for being wrongly charged, enhances the likelihood of getting good service,
and reduces administrative hassle.21 The user costs are also low because peer-to-peer
transport allows those providing rides to share their spare capacity of cars, and consum-
ers to share the cost of the ride by travelling with someone else. The former enables the
existing capital stock to be put into better productive use, which is far from the case to-
day.22
Immediate and induced effects and consequences for economy, employment,
and environment
The low user costs and transaction costs will spur an immediate increase in demand for
peer-to-peer transport, the magnitude of which ultimately depends on the preferences of
citizens of Stockholm. Some citizens will prefer to use peer-to-peer transport instead of
driving their own cars, using public transport and using bikes, and some citizens may
travel more than they did before. The initial transport structure and standard economic
parameters like price elasticities and cross price elasticities of transport are used to calcu-
late immediate effects in chapter 2.
The immediate change in transport demand will lead to further induced changes in
transport structure as citizens now have access to a peer-to-peer transport service, with
properties making it a close substitute to driving one’s own car. The implication is that
some citizens choose against owning their own vehicles, which in turn reduces the use of
personal vehicles and increases the use of other types of transport. The induced conse-
quences for traffic are assessed in chapter 3.
Together, the immediate and induced effects on traffic imply that a typical citizen of
Greater Stockholm will use private vehicles less often and use other transport modes
more often, among them peer-to-peer services. There will be fewer vehicles on the streets
of Stockholm any given day, thus reducing traffic intensity and congestion, which in turn
reduces the amount of time citizens spend in traffic. We will see that changes in conges-
tion and unproductive time spent in traffic can improve labour supply and competition in
Greater Stockholm and thereby give rise to economic benefits for citizens. The economic
value of reduced congestion is assessed in chapter 4.
Peer-to-peer transport will also have an impact on employment, some of which is likely to
be permanent through increases in labour supply. In the short run, employment (in par-
ticular part-time employment) will increase, primarily since commercial drivers will take
over some transport that was previously handled by citizens themselves. The short-run
employment effect may be permanent to the degree that peer-to-peer transport attracts
persons who otherwise are difficult to employ. In the longer run, employment will in-
crease because some of the (part-time) drivers will expand their labour supply over and
21 A ‘well-functioning system’ also implies that it works as if it has been active for a few years, i.e. potential technical problems
relating to the GPS-based app etc. have been solved. 22 Private cars in Stockholm are parked 96 per cent of the day, based on Gullberg (2015).
Economic benefits of peer-to-peer transport services
10
beyond their main job, and because less congestion will free up time, of which some will
be converted into additional labour supply. Employment effects are assessed in chapter 5.
The reduced number of car owners and the more efficient usage of cars mean that de-
mand for parking space within Stockholm will be reduced, freeing up square meters that
can be used for other purposes, such as further investment in infrastructure. The level of
pollution will also go down in Stockholm when time spent in traffic goes down. Environ-
mental effects are assessed in chapter 6.
Economic benefits of peer-to-peer transport services
11
Chapter 2
2 Immediate effects: More efficient utilisation of capital and slightly higher traffic volumes
The introduction of a well-functioning, low-price peer-to-peer transport service will cre-
ate an immediate change in transport patterns in Greater Stockholm. The magnitude of
change depends on the current demand for transport, how much prices are lowered from
the introduction of peer-to-peer, how much citizens trust the availability of peer-to-peer
transport, and how much citizens change their demand for transport in response to lower
prices.
Current transport demand
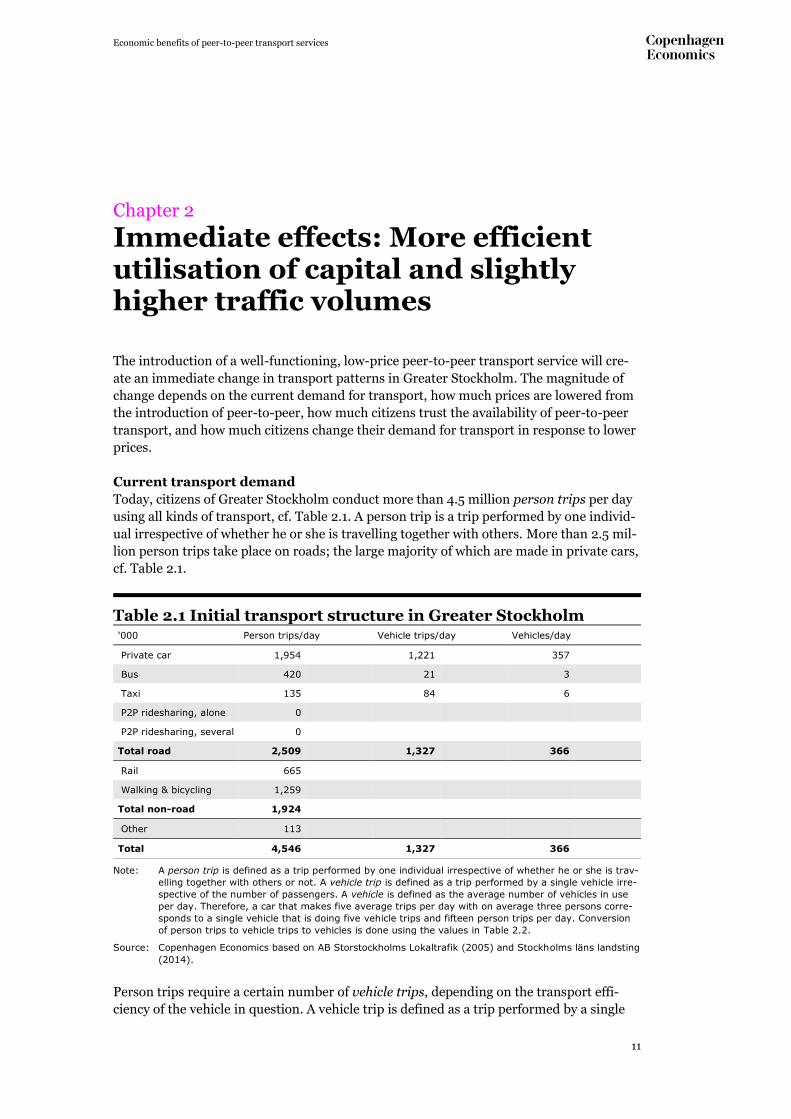
Today, citizens of Greater Stockholm conduct more than 4.5 million person trips per day
using all kinds of transport, cf. Table 2.1. A person trip is a trip performed by one individ-
ual irrespective of whether he or she is travelling together with others. More than 2.5 mil-
lion person trips take place on roads; the large majority of which are made in private cars,
cf. Table 2.1.
Table 2.1 Initial transport structure in Greater Stockholm '000 Person trips/day Vehicle trips/day Vehicles/day
Private car 1,954 1,221 357
Bus 420 21 3
Taxi 135 84 6
P2P ridesharing, alone 0
P2P ridesharing, several 0
Total road 2,509 1,327 366
Rail 665
Walking & bicycling 1,259
Total non-road 1,924
Other 113
Total 4,546 1,327 366
Note: A person trip is defined as a trip performed by one individual irrespective of whether he or she is trav-
elling together with others or not. A vehicle trip is defined as a trip performed by a single vehicle irre-
spective of the number of passengers. A vehicle is defined as the average number of vehicles in use
per day. Therefore, a car that makes five average trips per day with on average three persons corre-
sponds to a single vehicle that is doing five vehicle trips and fifteen person trips per day. Conversion
of person trips to vehicle trips to vehicles is done using the values in Table 2.2.
Source: Copenhagen Economics based on AB Storstockholms Lokaltrafik (2005) and Stockholms läns landsting
(2014).
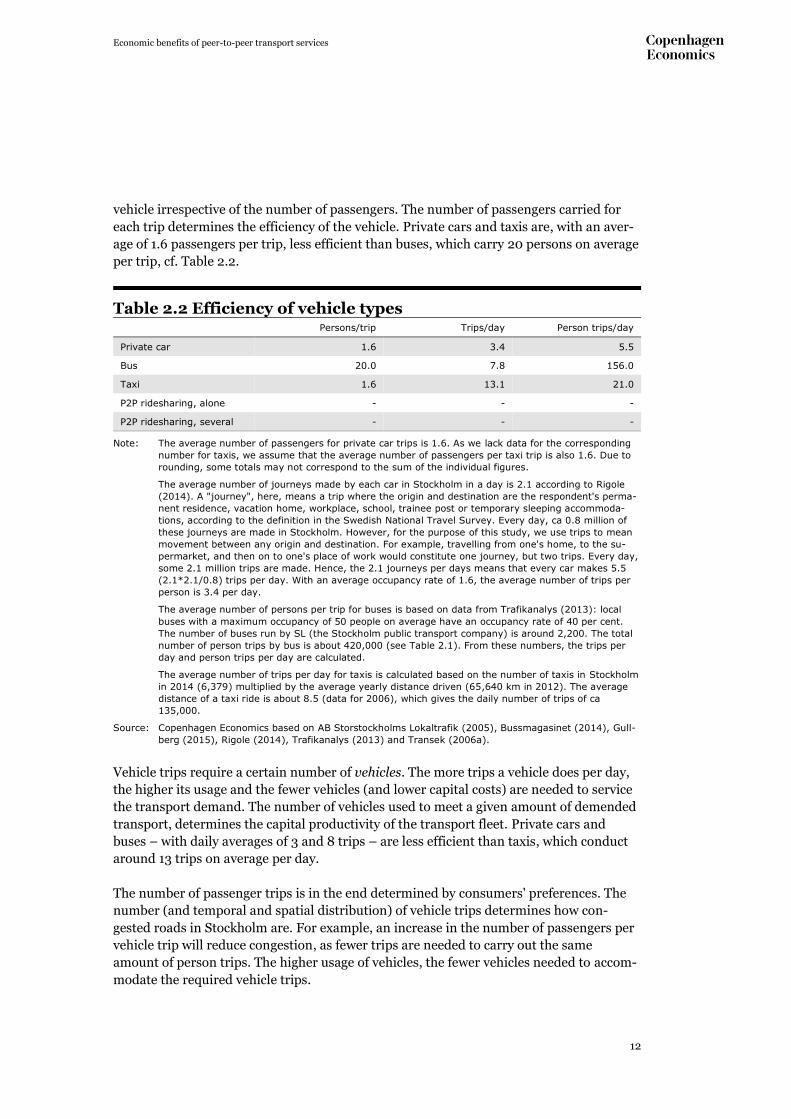
Person trips require a certain number of vehicle trips, depending on the transport effi-
ciency of the vehicle in question. A vehicle trip is defined as a trip performed by a single
Economic benefits of peer-to-peer transport services
12
vehicle irrespective of the number of passengers. The number of passengers carried for
each trip determines the efficiency of the vehicle. Private cars and taxis are, with an aver-
age of 1.6 passengers per trip, less efficient than buses, which carry 20 persons on average
per trip, cf. Table 2.2.
Table 2.2 Efficiency of vehicle types Persons/trip Trips/day Person trips/day
Private car 1.6 3.4 5.5
Bus 20.0 7.8 156.0
Taxi 1.6 13.1 21.0
P2P ridesharing, alone - - -
P2P ridesharing, several - - -
Note: The average number of passengers for private car trips is 1.6. As we lack data for the corresponding
number for taxis, we assume that the average number of passengers per taxi trip is also 1.6. Due to
rounding, some totals may not correspond to the sum of the individual figures.
The average number of journeys made by each car in Stockholm in a day is 2.1 according to Rigole
(2014). A "journey", here, means a trip where the origin and destination are the respondent's perma-
nent residence, vacation home, workplace, school, trainee post or temporary sleeping accommoda-
tions, according to the definition in the Swedish National Travel Survey. Every day, ca 0.8 million of
these journeys are made in Stockholm. However, for the purpose of this study, we use trips to mean
movement between any origin and destination. For example, travelling from one's home, to the su-
permarket, and then on to one's place of work would constitute one journey, but two trips. Every day,
some 2.1 million trips are made. Hence, the 2.1 journeys per days means that every car makes 5.5
(2.1*2.1/0.8) trips per day. With an average occupancy rate of 1.6, the average number of trips per
person is 3.4 per day.
The average number of persons per trip for buses is based on data from Trafikanalys (2013): local
buses with a maximum occupancy of 50 people on average have an occupancy rate of 40 per cent.
The number of buses run by SL (the Stockholm public transport company) is around 2,200. The total
number of person trips by bus is about 420,000 (see Table 2.1). From these numbers, the trips per
day and person trips per day are calculated.
The average number of trips per day for taxis is calculated based on the number of taxis in Stockholm
in 2014 (6,379) multiplied by the average yearly distance driven (65,640 km in 2012). The average
distance of a taxi ride is about 8.5 (data for 2006), which gives the daily number of trips of ca
135,000.
Source: Copenhagen Economics based on AB Storstockholms Lokaltrafik (2005), Bussmagasinet (2014), Gull-
berg (2015), Rigole (2014), Trafikanalys (2013) and Transek (2006a).
Vehicle trips require a certain number of vehicles. The more trips a vehicle does per day,
the higher its usage and the fewer vehicles (and lower capital costs) are needed to service
the transport demand. The number of vehicles used to meet a given amount of demended
transport, determines the capital productivity of the transport fleet. Private cars and
buses – with daily averages of 3 and 8 trips – are less efficient than taxis, which conduct
around 13 trips on average per day.
The number of passenger trips is in the end determined by consumers' preferences. The
number (and temporal and spatial distribution) of vehicle trips determines how con-
gested roads in Stockholm are. For example, an increase in the number of passengers per
vehicle trip will reduce congestion, as fewer trips are needed to carry out the same
amount of person trips. The higher usage of vehicles, the fewer vehicles needed to accom-
modate the required vehicle trips.
Economic benefits of peer-to-peer transport services
13
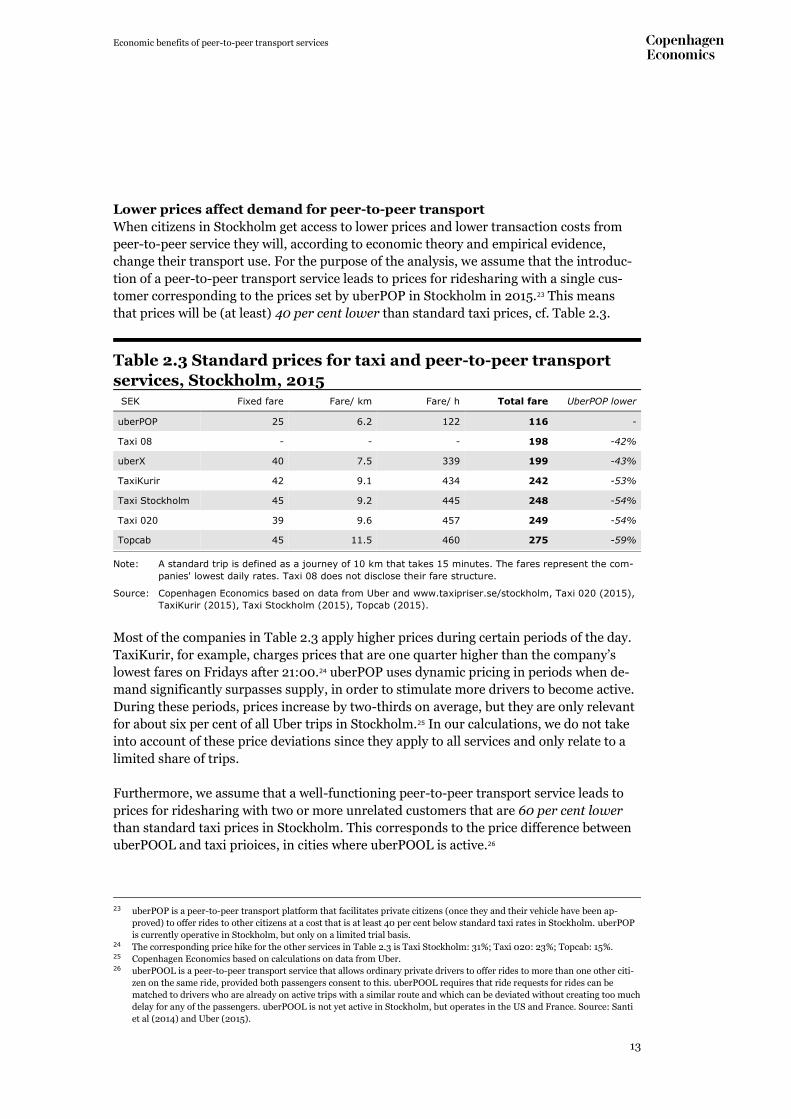
Lower prices affect demand for peer-to-peer transport
When citizens in Stockholm get access to lower prices and lower transaction costs from
peer-to-peer service they will, according to economic theory and empirical evidence,
change their transport use. For the purpose of the analysis, we assume that the introduc-
tion of a peer-to-peer transport service leads to prices for ridesharing with a single cus-
tomer corresponding to the prices set by uberPOP in Stockholm in 2015.23 This means
that prices will be (at least) 40 per cent lower than standard taxi prices, cf. Table 2.3.
Table 2.3 Standard prices for taxi and peer-to-peer transport
services, Stockholm, 2015 SEK Fixed fare Fare/ km Fare/ h Total fare UberPOP lower
uberPOP 25 6.2 122 116 -
Taxi 08 - - - 198 -42%
uberX 40 7.5 339 199 -43%
TaxiKurir 42 9.1 434 242 -53%
Taxi Stockholm 45 9.2 445 248 -54%
Taxi 020 39 9.6 457 249 -54%
Topcab 45 11.5 460 275 -59%
Note: A standard trip is defined as a journey of 10 km that takes 15 minutes. The fares represent the com-
panies' lowest daily rates. Taxi 08 does not disclose their fare structure.
Source: Copenhagen Economics based on data from Uber and www.taxipriser.se/stockholm, Taxi 020 (2015),
TaxiKurir (2015), Taxi Stockholm (2015), Topcab (2015).
Most of the companies in Table 2.3 apply higher prices during certain periods of the day.
TaxiKurir, for example, charges prices that are one quarter higher than the company’s
lowest fares on Fridays after 21:00.24 uberPOP uses dynamic pricing in periods when de-
mand significantly surpasses supply, in order to stimulate more drivers to become active.
During these periods, prices increase by two-thirds on average, but they are only relevant
for about six per cent of all Uber trips in Stockholm.25 In our calculations, we do not take
into account of these price deviations since they apply to all services and only relate to a
limited share of trips.
Furthermore, we assume that a well-functioning peer-to-peer transport service leads to
prices for ridesharing with two or more unrelated customers that are 60 per cent lower
than standard taxi prices in Stockholm. This corresponds to the price difference between
uberPOOL and taxi prioices, in cities where uberPOOL is active.26
23 uberPOP is a peer-to-peer transport platform that facilitates private citizens (once they and their vehicle have been ap-
proved) to offer rides to other citizens at a cost that is at least 40 per cent below standard taxi rates in Stockholm. uberPOP
is currently operative in Stockholm, but only on a limited trial basis. 24 The corresponding price hike for the other services in Table 2.3 is Taxi Stockholm: 31%; Taxi 020: 23%; Topcab: 15%. 25 Copenhagen Economics based on calculations on data from Uber. 26 uberPOOL is a peer-to-peer transport service that allows ordinary private drivers to offer rides to more than one other citi-
zen on the same ride, provided both passengers consent to this. uberPOOL requires that ride requests for rides can be
matched to drivers who are already on active trips with a similar route and which can be deviated without creating too much
delay for any of the passengers. uberPOOL is not yet active in Stockholm, but operates in the US and France. Source: Santi
et al (2014) and Uber (2015).
Economic benefits of peer-to-peer transport services
14
Changes in demand are determined by price- and cross price-elasticities
We use price- and cross price-elasticities27 of demand based on studies from taxi markets
to estimate how the lower price of peer-to-peer will affect transport demand. This is nec-
essary since peer-to-peer transport is a relatively new concept, and, to our best
knowledge, there are no empirical estimates of the effect on demand for peer-to-peer
transport from price changes. We assume instead that the effect of an introduction of
peer-to-peer transport can be compared to a price reduction of 40 to 60 per cent of the
price of taxi.28 This is subject to some consideration. On the one hand, Rayle et al (2014)
describe ridesharing as serving “a previously unmet demand for convenient, point-to-
point urban travel”, and their findings show differences in users and the user experience
between taxi and peer-to-peer.29 On the other hand, the authors state that that ridesharing
and taxis serve a similar market demand. We thus deem using findings from the taxi mar-
ket as the best available option in the absence of further evidence.
We use a price elasticity of -1.4 for ridesharing with a single passenger. This means that
the total demand for ridesharing increases by 14 per cent when the price decreases by 10
per cent. The elasticity is in the medium-to-upper range of the estimated taxi elasticities
for three reasons. First, few studies include the lower transactions costs associated with
peer-to-peer transport. Second, we expect peer-to-peer transport to be attractive in par-
ticular for leisure passengers who have documented larger price sensitivity. Third, the in-
vestigated studies are often performed in settings with (close to) monopoly pricing where
price elasticities tend to be low, cf. Box 2.1.
27 Price elasticities measure how much citizens expand consumption (for example peer-to-peer transport) when prices go
down. An elasticity of for example -1.5 for means that a price reduction of 10 per cent will boost demand by 15 per cent. The
higher is the numerical value of the price elasticity of demand, the more sensitive citizens are to price changes, i.e. the more
they will increase their purchase of the good when the price goes down. Cross-price elasticities measure how much citizens
change consumption of one type of good (for example public transport) when the price of another, similar good (for exam-
ple peer-to-peer transport) changes. 28 Technically, we assume that the total demand for taxi and peer-to-peer transport is determined by the price elasticity of
demand for taxi, here assumed to be -1.4. If the initial demand for taxi is 100 and prices drop by 10 per cent, the final de-
mand for taxi and peer-to-peer transport will be 140. It means that peer-to-peer transport will have a net volume of at least
40. However, substitution will also take place between taxi and peer-to-peer, but we have at this stage no information how
much of demand would shift to peer-to-peer transport from taxi. 29 The study finds that ridesharing wait times were markedly shorter and more consistent than those of taxis. Ridesharing also
differs from traditional taxis due to the efficiency and reliability of the matching platform and pricing mechanisms, along
with the accountability of the rating system.
Economic benefits of peer-to-peer transport services
15
Box 2.1 Own-price elasticities of demand for taxi
The available literature contains a wide range of own-price elasticities for taxi services.
A large literature review by Rose & Hensher (2014) covers studies from Australia,
France, the Netherlands, the UK, and the US, and finds elasticities in the range of -
0.22 to -1.75. However, none of the studies included in the review are recent: only
one uses data from the 2000s. Using sample data from 2012, the authors themselves
estimate elasticities for travelling in Melbourne, Australia with a resulting weighted av-
erage elasticity of -1.04. For the tourism segment, the elasticity is found to be -1.48,
and for the business segment -0.65. Two other – slightly more recent – studies by Liu
(2006) and Ward (2002) find elasticities of -2.05 and -2.67 respectively. Overall, we
find a range of elasticities between -0.22 and -2.67.
We use an own price elasticity of -1.4 for ridesharing with a single passenger, which is
in the medium-to-upper range of elasticities in the literature. There are several rea-
sons for this. First, earlier studies generally do not include effects from the lower
transaction costs that are associated with peer-to-peer transport service compared to
ordinary taxi services. The lower transaction costs indicate that the decline in the im-
plicit prices is larger than the decline in listed prices. Second, we expect peer-to-peer
transport to be attractive in particular for leisure passengers rather than business pas-
sengers. Leisure passengers tend to have significantly higher elasticities, almost three
times as high as business passengers in Rose & Hensher (2014). Third, most of the
empirical studies have been done for monopoly markets or with regulated prices that
are close to monopoly prices. For such markets, the elasticity for demand can easily
be asymmetric: very low for price increases due to nearness to monopoly prices, but
much higher for price reductions as in our case.
Source: Liu (2006), Rose & Hensher (2014) and Ward (2002).
We use a price elasticity for ridesharing with two or more unrelated passengers of -1.0.
This means that the demand for ridesharing will increase by 10 per cent (relative to the
demand for taxi) when the price drops by 10 per cent. The elasticity is lower than for
ridesharing with a single passenger because riders must accept more waiting time and
some loss of privacy by sharing the trip with another person.
Net increase in total person trips due to lower prices
Using the price elasticities described above, we estimate that the introduction of peer-to-
peer would boost total demand for taxi and peer-to-peer from the current 135,000 daily
person trips, to around 216,000 daily person trips. The net increase in daily person trips
would thus be 81,000 trips, or 60 per cent. The increase stems partially from ridesharing
with a single customer, and, to a lesser degree, from ridesharing with several unrelated
customers.30
There are three main sources for the net increase in daily person trips.
First, some of the new person trips would never have happened before, i.e. these are what
we call additional trips resulting from peer-to-peer service. For example, a person may
visit relatives rather than calling them since now there is a low cost, flexible alternative in
30 The introduction of ridesharing with a single customer increases daily person trips by -1.4 % ×- 40% × 135,000 trips =
75,000 trips. The introduction of ridesharing with several unrelated customers increases daily person trips by an additional
-1.0× - 60% × 135,000 - 75,000 trips = 6,000 trips.
Economic benefits of peer-to-peer transport services
16
the form of peer-to-peer transport. Travelers who previously avoided trips to neighbour-
hoods with poor transit access or scarce parking may now consider them accessible and
chose to travel there. The volume of additional trips is determined by the overall price
elasticity of demand for transport (of any kind) in Greater Stockholm. We use an overall
price elasticity for transport of -0.5 per cent.31
Using this price elasticity, we estimate the number of additional rides to amount to
around 27,000 daily person trips. This means that around 27,000 of the 81,000 new
peer-to-peer person trips (about 30 per cent) are additional; i.e. they would not have been
made if a peer-to-peer transport option was not available.
Second, the remaining 54,000 daily peer-to-peer person trips (about 70 per cent) are
made by people who would travel anyway, but with another transport modes. We meas-
ure the propensity to switch between transport options by the so-called cross price elas-
ticities of demand between transport modes. For example, a cross price elasticity of 0.2
for peer-to-peer transport relative to walking indicates that the number of person trips
done by walking will decline by 2 per cent when the price of peer-to-peer transport de-
clines by 10 per cent. High cross price elasticity for two transport modes indicates that
these are close substitutes, and that a price change for one will significantly affect the use
of the other.
We are again in a situation where we have no information about cross price elasticities of
demand for peer-to-peer transport, and instead assume that we can use cross price elas-
ticities of demand for taxi. We use literature based cross price elasticities of +0.35 for pri-
vate cars; +0.2 for bus; +0.07 for subway and +0.10 for walking and biking32, and split the
increase in peer-to-peer daily person trips between these transport modes proportional to
the size of their cross-price elasticities. This means that the largest share of peer-to-peer
travellers would previously have used their private car to travel (elasticity of +0.35), the
second largest gone by bus (elasticity of +0.2) etc.
Third, we need to take into account the substitution from taxi to peer-to-peer transport.
The calculated increase in daily person trips is the net increase and does not capture sub-
stitution from taxi to peer-to-peer. We find it likely that peer-to-peer transport will cap-
ture market shares, but also that taxi and peer-to-peer transport are going to exist side-
by-side as segmented parts of the same transport market.33
31 The overall price elasticity is numerically low since there are little possibilities for substitution. All additional trips must
stem from the fact that no other means of transport were previously attractive enough for those trips to occur. Low overall
elasticities are also supported by empirical evidence as in Fouquet (2012), and consumer responses in the consumer surveys
on the demand response to peer-to-peer transport available, such as Rayle et al. (2014). 32 Based on Liu (2006) and Ward (2002). 33 There is likely also a positive impact on the taxi segment from increased competition, especially in the long run, leading to
lower prices and higher quality. This positive economic effect is not included in our calculations.
Economic benefits of peer-to-peer transport services
17
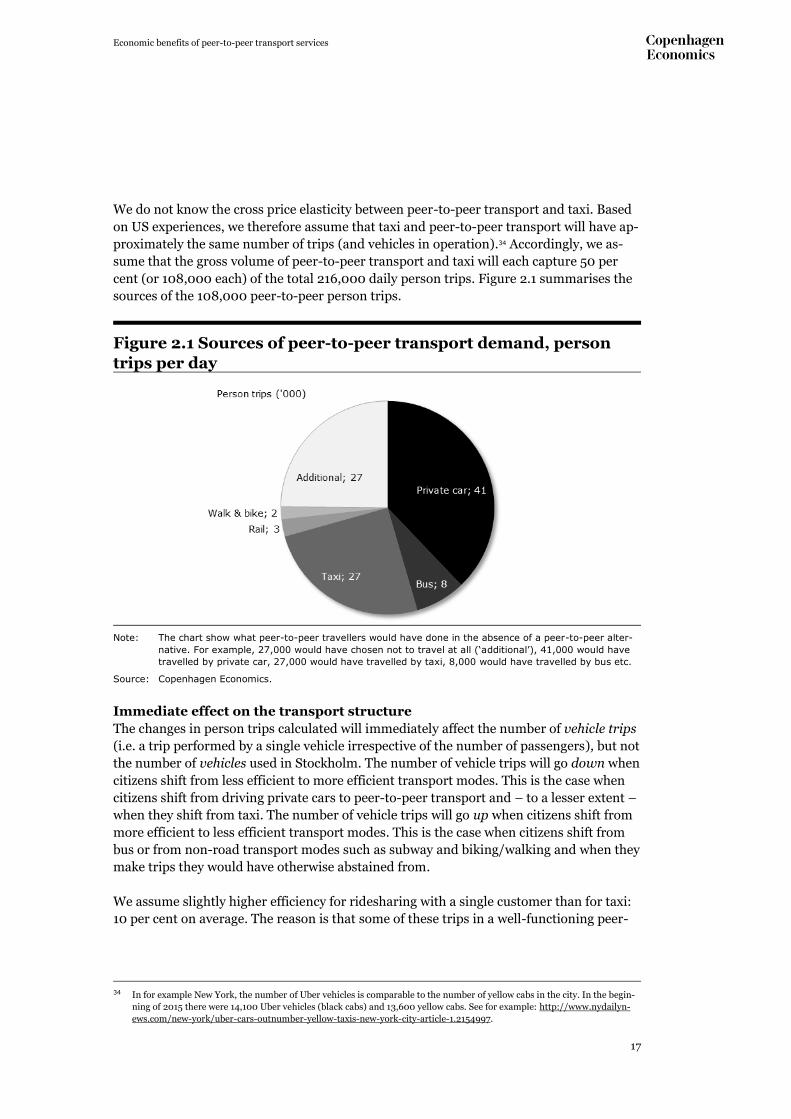
We do not know the cross price elasticity between peer-to-peer transport and taxi. Based
on US experiences, we therefore assume that taxi and peer-to-peer transport will have ap-
proximately the same number of trips (and vehicles in operation).34 Accordingly, we as-
sume that the gross volume of peer-to-peer transport and taxi will each capture 50 per
cent (or 108,000 each) of the total 216,000 daily person trips. Figure 2.1 summarises the
sources of the 108,000 peer-to-peer person trips.
Figure 2.1 Sources of peer-to-peer transport demand, person
trips per day
Note: The chart show what peer-to-peer travellers would have done in the absence of a peer-to-peer alter-
native. For example, 27,000 would have chosen not to travel at all (‘additional’), 41,000 would have
travelled by private car, 27,000 would have travelled by taxi, 8,000 would have travelled by bus etc.
Source: Copenhagen Economics.
Immediate effect on the transport structure
The changes in person trips calculated will immediately affect the number of vehicle trips
(i.e. a trip performed by a single vehicle irrespective of the number of passengers), but not
the number of vehicles used in Stockholm. The number of vehicle trips will go down when
citizens shift from less efficient to more efficient transport modes. This is the case when
citizens shift from driving private cars to peer-to-peer transport and – to a lesser extent –
when they shift from taxi. The number of vehicle trips will go up when citizens shift from
more efficient to less efficient transport modes. This is the case when citizens shift from
bus or from non-road transport modes such as subway and biking/walking and when they
make trips they would have otherwise abstained from.
We assume slightly higher efficiency for ridesharing with a single customer than for taxi:
10 per cent on average. The reason is that some of these trips in a well-functioning peer-
34 In for example New York, the number of Uber vehicles is comparable to the number of yellow cabs in the city. In the begin-
ning of 2015 there were 14,100 Uber vehicles (black cabs) and 13,600 yellow cabs. See for example: http://www.nydailyn-
ews.com/new-york/uber-cars-outnumber-yellow-taxis-new-york-city-article-1.2154997.
Economic benefits of peer-to-peer transport services
18
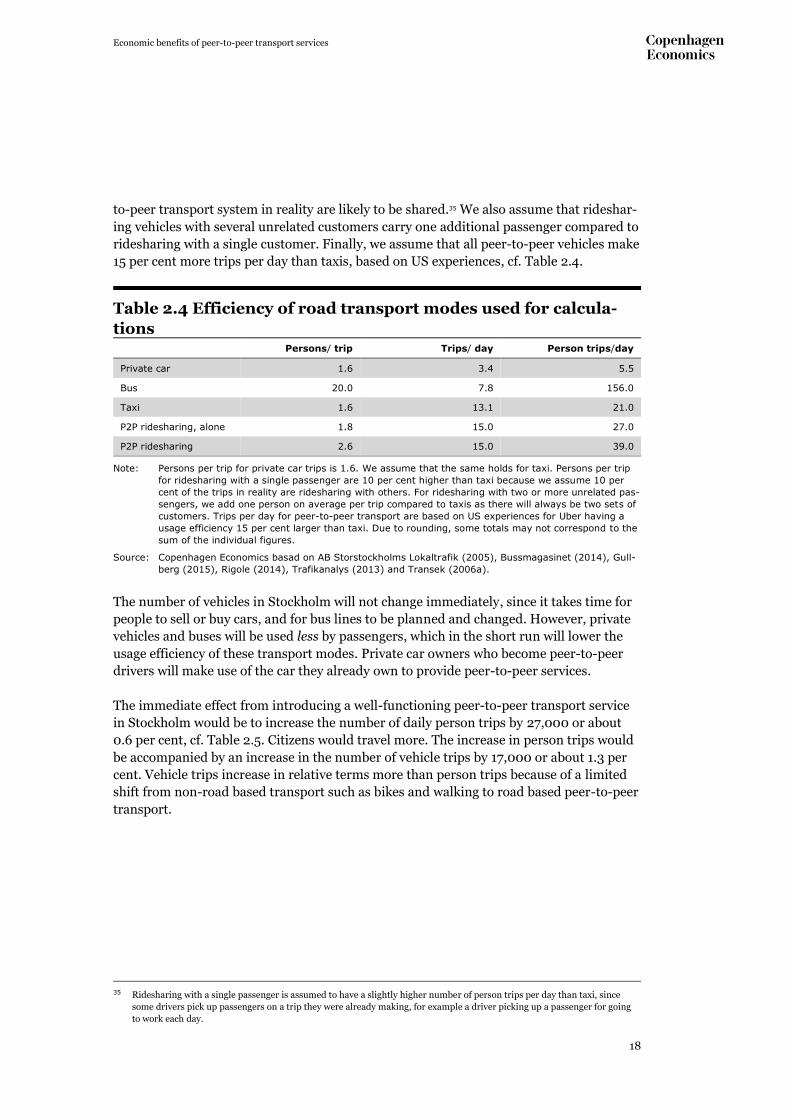
to-peer transport system in reality are likely to be shared.35 We also assume that rideshar-
ing vehicles with several unrelated customers carry one additional passenger compared to
ridesharing with a single customer. Finally, we assume that all peer-to-peer vehicles make
15 per cent more trips per day than taxis, based on US experiences, cf. Table 2.4.
Table 2.4 Efficiency of road transport modes used for calcula-
tions Persons/ trip Trips/ day Person trips/day
Private car 1.6 3.4 5.5
Bus 20.0 7.8 156.0
Taxi 1.6 13.1 21.0
P2P ridesharing, alone 1.8 15.0 27.0
P2P ridesharing 2.6 15.0 39.0
Note: Persons per trip for private car trips is 1.6. We assume that the same holds for taxi. Persons per trip
for ridesharing with a single passenger are 10 per cent higher than taxi because we assume 10 per
cent of the trips in reality are ridesharing with others. For ridesharing with two or more unrelated pas-
sengers, we add one person on average per trip compared to taxis as there will always be two sets of
customers. Trips per day for peer-to-peer transport are based on US experiences for Uber having a
usage efficiency 15 per cent larger than taxi. Due to rounding, some totals may not correspond to the
sum of the individual figures.
Source: Copenhagen Economics basad on AB Storstockholms Lokaltrafik (2005), Bussmagasinet (2014), Gull-
berg (2015), Rigole (2014), Trafikanalys (2013) and Transek (2006a).
The number of vehicles in Stockholm will not change immediately, since it takes time for
people to sell or buy cars, and for bus lines to be planned and changed. However, private
vehicles and buses will be used less by passengers, which in the short run will lower the
usage efficiency of these transport modes. Private car owners who become peer-to-peer
drivers will make use of the car they already own to provide peer-to-peer services.
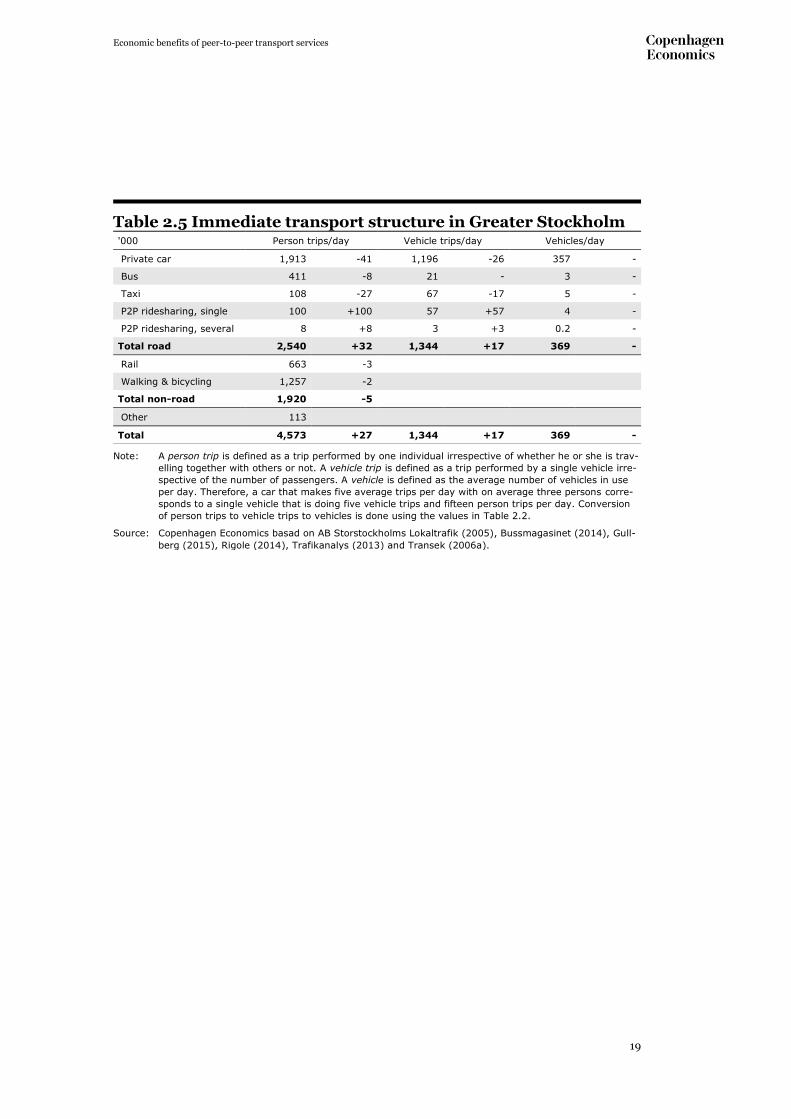
The immediate effect from introducing a well-functioning peer-to-peer transport service
in Stockholm would be to increase the number of daily person trips by 27,000 or about
0.6 per cent, cf. Table 2.5. Citizens would travel more. The increase in person trips would
be accompanied by an increase in the number of vehicle trips by 17,000 or about 1.3 per
cent. Vehicle trips increase in relative terms more than person trips because of a limited
shift from non-road based transport such as bikes and walking to road based peer-to-peer
transport.
35 Ridesharing with a single passenger is assumed to have a slightly higher number of person trips per day than taxi, since
some drivers pick up passengers on a trip they were already making, for example a driver picking up a passenger for going
to work each day.
Economic benefits of peer-to-peer transport services
19
Table 2.5 Immediate transport structure in Greater Stockholm '000 Person trips/day Vehicle trips/day Vehicles/day
Private car 1,913 -41 1,196 -26 357 -
Bus 411 -8 21 - 3 -
Taxi 108 -27 67 -17 5 -
P2P ridesharing, single 100 +100 57 +57 4 -
P2P ridesharing, several 8 +8 3 +3 0.2 -
Total road 2,540 +32 1,344 +17 369 -
Rail 663 -3
Walking & bicycling 1,257 -2
Total non-road 1,920 -5
Other 113
Total 4,573 +27 1,344 +17 369 -
Note: A person trip is defined as a trip performed by one individual irrespective of whether he or she is trav-
elling together with others or not. A vehicle trip is defined as a trip performed by a single vehicle irre-
spective of the number of passengers. A vehicle is defined as the average number of vehicles in use
per day. Therefore, a car that makes five average trips per day with on average three persons corre-
sponds to a single vehicle that is doing five vehicle trips and fifteen person trips per day. Conversion
of person trips to vehicle trips to vehicles is done using the values in Table 2.2.
Source: Copenhagen Economics basad on AB Storstockholms Lokaltrafik (2005), Bussmagasinet (2014), Gull-
berg (2015), Rigole (2014), Trafikanalys (2013) and Transek (2006a).
Economic benefits of peer-to-peer transport services
Chapter 3
3 Induced effects: Less car ownership and lower traffic volumes
The immediate effect of introducing a well-functioning peer-to-peer transport service will
be a slight increase in the number of vehicles on the roads in Greater Stockholm, since
some of those who start using peer-to-peer transport previously did not travel, or trav-
elled by train, bus, bike, or by foot. However, the immediate effects will set in motion fur-
ther induced effects, which has an impact on incentives to own a personal vehicle. Car
ownership or non-ownership has a subsequent impact on how citizens use other transport
modes.
Peer-to-peer transport affects car ownership in two ways
Access to peer-to-peer transport has an impact on car ownership in two, counteracting
ways. First, peer-to-peer transport makes car ownership less attractive because it pro-
vides access to a low-cost, flexible and easily accessible alternative to a private car. Sec-
ond, peer-to-peer transport makes it more attractive to own a car, since citizens can earn
additional income by offering peer-to-peer service with their car.
The first effect is a well-established effect from the empirical literature on carpooling,36
and some very recent peer-to-peer studies. These studies show that by having access to
low-cost, flexible, and easily accessible transport, citizens do not feel the need to invest in,
bear the costs and endure the hassle of owning and maintaining a car. Empirical studies
show that for each carpooling car available, citizens tend to reduce the number of cars
they own by between 9 and 23 cars, cf. Box 3.1. It means that a well-functioning carpool-
ing scheme with 100 cars available would lead to a reduction in the ownership of cars by
between 900 and 2,300 cars, either through disposing of cars that members already own
(shedding) or by postponing decisions to buy new cars (avoiding).
36 Traditional carpooling provides members with access to a car for short-term, and in some cases long-term use. Cars are
distributed throughout a network of locations. Members can access the vehicles at any time with a reservation and are
charged per time and often per mile.
Economic benefits of peer-to-peer transport services
21
Box 3.1 Carsharing reduces ownership of private cars
Access to a joint car reduces ownership of private cars. A study from 2015 conducted
by Trivector found that one carsharing car could cause 4 to 6 private cars to be shed
(i.e. sold or otherwise disposed of), based on an online survey of 7,500 carpool mem-
bers in Stockholm, Gothenburg and Malmö. The same number of cars shed per carpool
vehicle is found by Martin et al (2010). Another study by Lane (2006) found that one
year into a carsharing program in Philadelphia, there was evidence that each carshar-
ing car had reduced the car stock by an average of 23 private cars.
Notably, much of the shift found throughout the studies involved households becoming
carless. Martin, et al (2010) found in a survey of North American carsharing members
that 80 per cent of the sample owned no vehicle after joining carsharing, compared to
62 per cent before joining. Most of this shift was the result of one-car households be-
coming no-car households. A smaller change occurred with two-car households be-
coming one-car households.
Carsharing not only reduces the number of personal vehicles owned across the sam-
ple; it can also deter carless households from ever acquiring a vehicle. Most of the
households that join carsharing are carless: 62 per cent of households joining carshar-
ing owned no vehicle when they joined, while 31 per cent of households owned one
vehicle. That is, some carsharing members who consider buying a car ultimately de-
cide against it and use carsharing instead. A carsharing service in San Francisco com-
pares the purchases of new cars among members in a carpool and non-members. 16
per cent of the members increased their number of cars by one compared to 29 per
cent of the non-members. The results were obtained through surveys in 2003 and
2005.37 Martin, et al (2010) found that the number of avoided purchases of cars for
each carsharing car was 5 to 7.38
Despite the relatively short time period in which peer-to-peer services have been
available, the most recent studies suggest that peer-to-peer transport is affecting car
ownership in the same way as carpooling.
One such study investigates the effect of carsharing services based on a survey of
1000 carsharing users. Carsharing services are defined as services where drivers rent
vehicles commercially or through peer-to-peer networks without going to a traditional
car-rental location. The survey was carried out in ten metropolitan areas in the U.S,
where carsharing services had achieved a degree of scale with respect to fleet size or
number of competitors: Austin, Boston, Chicago, Miami, New York, Portland, San Di-
ego; San Francisco-Oakland, Seattle, and Washington, D.C. The results show that 32
personal vehicle purchases were avoided per each carsharing vehicle. Respondents
name ease of access, convenience and economics as key reasons for using carsharing
instead of using their own car.
Source: AlixPartners (2014), Cervero et al. (2006), Hara Associates Inc. (2013), Lane (2005), Martin et al.
(2010) and Trivector (2015).
The same pattern is found in studies of how the access to public transport affects car own-
ership. There is a wide body of evidence showing that when the accessibility of buses, un-
37 Cervero et al. (2006). 38 Martin et al. (2010).
Economic benefits of peer-to-peer transport services
22
derground services, and light rail increases, people tend to give up their cars or defer pur-
chases.39 Studies for British and French cities have shown that good public transport ac-
cess reduces car ownership, even when socioeconomic factors and population density are
controlled for.40 The quality of transport services is key, however. The quality of public
transport services needs to be high and costs low for car ownership to fall when accessibil-
ity increases.41
Based on these findings we conclude that when alternative means of transport are availa-
ble and accessibility is good, people feel a weaker need to own their own car. As a re-
sponse, some will choose to sell their car or avoid buying a car. For the purpose of the cal-
culations, we assume that the access to a well-functioning peer-to-peer transport service
will have a similar qualitative effect as carpooling and accessible public transport, i.e. in-
ducing citizens to give up ownership of a car. We assume a quantitative effect of a well-
functioning peer-to-peer transport service in the lower-medium range of the estimates
from carpooling studies: in the range of 15 cars shed or avoided for each full-time equiva-
lent peer-to-peer vehicle.42 The 15 shed or avoided cars correspond to the shedding of
around 6 active cars in the calculations we perform.43 This means that a well-functioning
peer-to-peer transport service with 3,000 cars would lead to a reduction in ownership of
owned cars by around 45,000 cars, and of active cars by around 18,000 cars. This former
figure represents about 5 per cent of all owned cars in Greater Stockholm.
This is a conservative approach for several reasons. First, studies that include peer-to-
peer indicate that the quantitative effect is in the upper range of the estimates from the
literature.44 As these are very recent and few, and not from academic sources we chose to
be more conservative than they suggest. Second, most of the studies are recent and cannot
capture the long-term effects on car ownership that are likely to be stronger than the
short-term effect. Third, most of the studies focus on small-scale carpooling and peer-to-
peer transport services within a limited geographical area. A full-scale peer-to-peer
transport service in Greater Stockholm would provide a greater scope for bringing bene-
fits that will reduce the incentive for car ownership. Fourth, the linking of a peer-to-peer
transport service to a MaaS concept with very broad and easily accessible transport op-
tions is likely to provide a very competitive alternative to transport by own car.
Despite these considerations, we have chosen to be conservative about the effect on car
ownership from peer-to-peer transport services for three reasons. First, there is a limited
but realistic countervailing effect in that car owners have the option to earn an income
from being peer-to-peer drivers. This reduces the cost of owning a car ownership and can
thereby stimulate ownership. Second, the number of empirical studies focusing on the ef-
fects of peer-to-peer transport services is (naturally) still limited, and we cannot rule out
39 Goodwin (1992). 40 Crampton (2006). 41 Crampton, (2007). 42 The studies we have reviewed find an estimate of between 9 and 32 cars are shed due to access of peer-to-peer transport
services. We narrow this range down to around 15 cars. 43 By active cars, we men those that are used to meet the demand for vehicle trips in Stockholm every day. As of 2014, there
are around 864,000 registered cars in Stockholm County according to Statistics Sweden. In our calculations, we find that
about 358,000 of those cars, or 41 per cent, are used in a given day. This means that car shedding of 15 cars per peer-to-peer
vehicle for all cars corresponds to 6 (41%) of active cars. 44 AlixPartners (2014).
Economic benefits of peer-to-peer transport services
23
that the effects of peer-to-peer transport have a different effect on car ownership than car-
pooling schemes. Third, current users of carpooling schemes, on which the empirical
studies are based, may not be average citizens and could have a larger disposition for re-
ducing car ownership than the average user of a peer-to-peer transport service.
Fewer private cars leads to less car travel
When car ownership changes, transport usage also changes. In many studies, car owner-
ship has been proven to be a strong driver of total demand for travel by car, cf. Box 3.
That is, when you own a car you tend to travel more overall, especially by car, since it is
convenient and habitual. Studies have also found that when you do not own a car, a larger
share of trips is serviced by walking, biking and public transport.
Box 3.2 Car ownership changes citizens transport use
Car ownership is a decisive factor when making transport decisions, and has been
found to cause an overuse of cars (Barter, 2008). There are several mechanisms that
make cars the transport mode most used by their owners. One such mechanism is the
sheer convenience of having a car on hand, which is found to increase the propensity
to use it for more trips than necessary (Stradling, 2002). Routine travel behaviour can
also cause the overuse of personal cars. Due to a lack of motivation to change rou-
tines, and uncertainties associated with change, most people stick with tried-and-
tested travel routines (Harms, 2003). Such impacts of past behaviour seem strong for
car owners (Thogersen, 2006). Information problems and uncertainty over alterna-
tives are also relevant to people with cars, many of whom rarely need or seek infor-
mation about alternatives (Harms, 2003). Additionally, Simma and Axhausen (2003)
note that people tend to commit themselves to particular travel behaviour through the
ownership of mobility tools such as cars and public transport subscriptions. Finally, the
possession of a car has traditionally been a mobility tool with unrivalled characteristics
such as independence and social status, which have encouraged the desire to own a
car and thus overuse it.
However, Barter (2008) find that these mechanism are reversible. If you do not own a
car, you will use a car less frequently and use other modes of transport more. For ex-
ample, the self-reinforcing behaviour of not owning a car is evident in a carsharing
study in San Francisco, where despite the fact that several new members began driv-
ing instead of traveling by transit, foot, or bicycle, their average daily fuel consump-
tion fell significantly, as they became carsharing members. In fact, carsharing reduced
private car usage by 15 per cent. Additionally, vehicle miles travelled was found to
drop 67 per cent for carsharing members, compared to a 24 per cent increase for non-
members. Moreover, according to Cervero et al. (2006) members began using other
means of transport significantly more, such as public transport and biking. While the
reductions in travelling and fuel consumption did not entirely stem from the tendency
to sell off private cars and forego the purchase of additional ones, it was a large part
of the explanation. The authors conclude that: “CarShare membership was also seen
to be a self-reinforcing behaviour, much like car ownership is for inducing car use.
Membership was associated with reduced car ownership, and reduced car ownership
was associated with more car share use for trips”
Additionally, mobility in the absence of one’s own car has the potential to significantly
improve with a peer-to-peer service. Without a car but with a peer-to-peer option, the
use of your car is not always the preferred option, as people face a more comprehen-
sive set of mobility choices. Peer-to-peer can thus fill the gaps that have previously
Economic benefits of peer-to-peer transport services
24
not been easily be addressed without convenient access to cars, and create a system
where people purchase the optimal transport mix for any given trip.
Source: Barter (2008), Cervero et al (2006), Harms (2003), Litman (2007), Simma & Axhausen (2003),
Stradling (2002), Thogersen (2006).
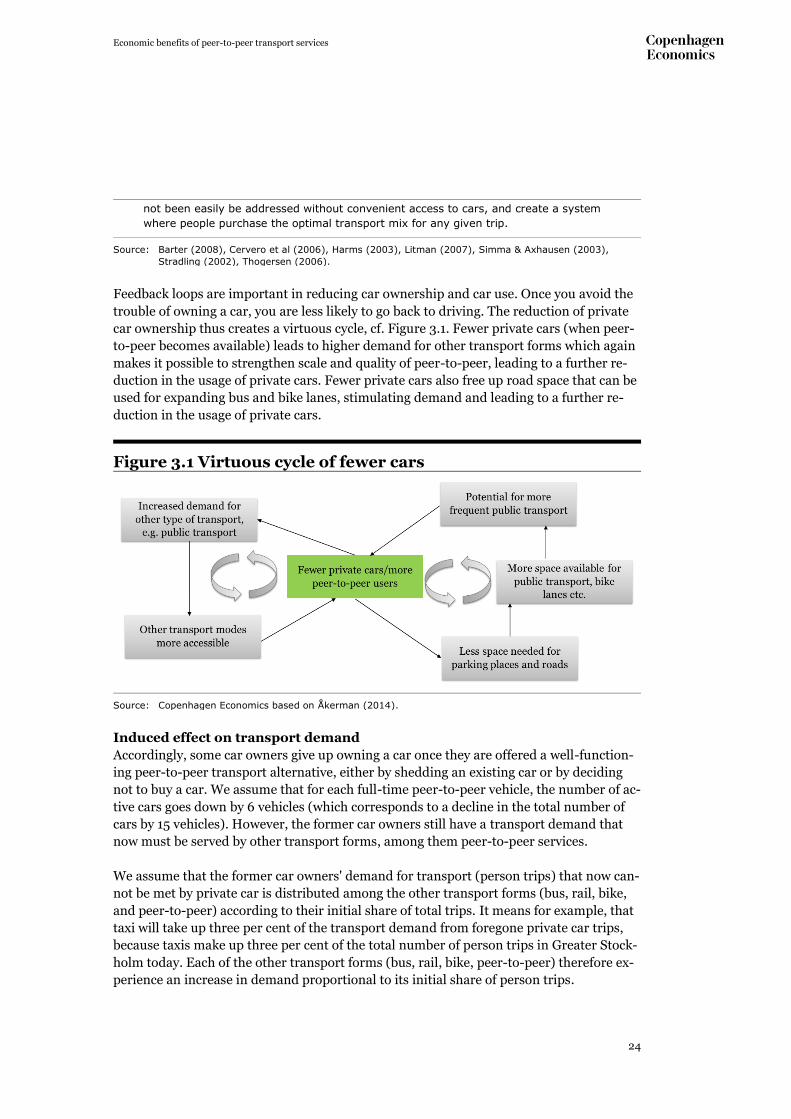
Feedback loops are important in reducing car ownership and car use. Once you avoid the
trouble of owning a car, you are less likely to go back to driving. The reduction of private
car ownership thus creates a virtuous cycle, cf. Figure 3.1. Fewer private cars (when peer-
to-peer becomes available) leads to higher demand for other transport forms which again
makes it possible to strengthen scale and quality of peer-to-peer, leading to a further re-
duction in the usage of private cars. Fewer private cars also free up road space that can be
used for expanding bus and bike lanes, stimulating demand and leading to a further re-
duction in the usage of private cars.
Figure 3.1 Virtuous cycle of fewer cars
Source: Copenhagen Economics based on Åkerman (2014).
Induced effect on transport demand
Accordingly, some car owners give up owning a car once they are offered a well-function-
ing peer-to-peer transport alternative, either by shedding an existing car or by deciding
not to buy a car. We assume that for each full-time peer-to-peer vehicle, the number of ac-
tive cars goes down by 6 vehicles (which corresponds to a decline in the total number of
cars by 15 vehicles). However, the former car owners still have a transport demand that
now must be served by other transport forms, among them peer-to-peer services.
We assume that the former car owners' demand for transport (person trips) that now can-
not be met by private car is distributed among the other transport forms (bus, rail, bike,
and peer-to-peer) according to their initial share of total trips. It means for example, that
taxi will take up three per cent of the transport demand from foregone private car trips,
because taxis make up three per cent of the total number of person trips in Greater Stock-
holm today. Each of the other transport forms (bus, rail, bike, peer-to-peer) therefore ex-
perience an increase in demand proportional to its initial share of person trips.
Economic benefits of peer-to-peer transport services
25
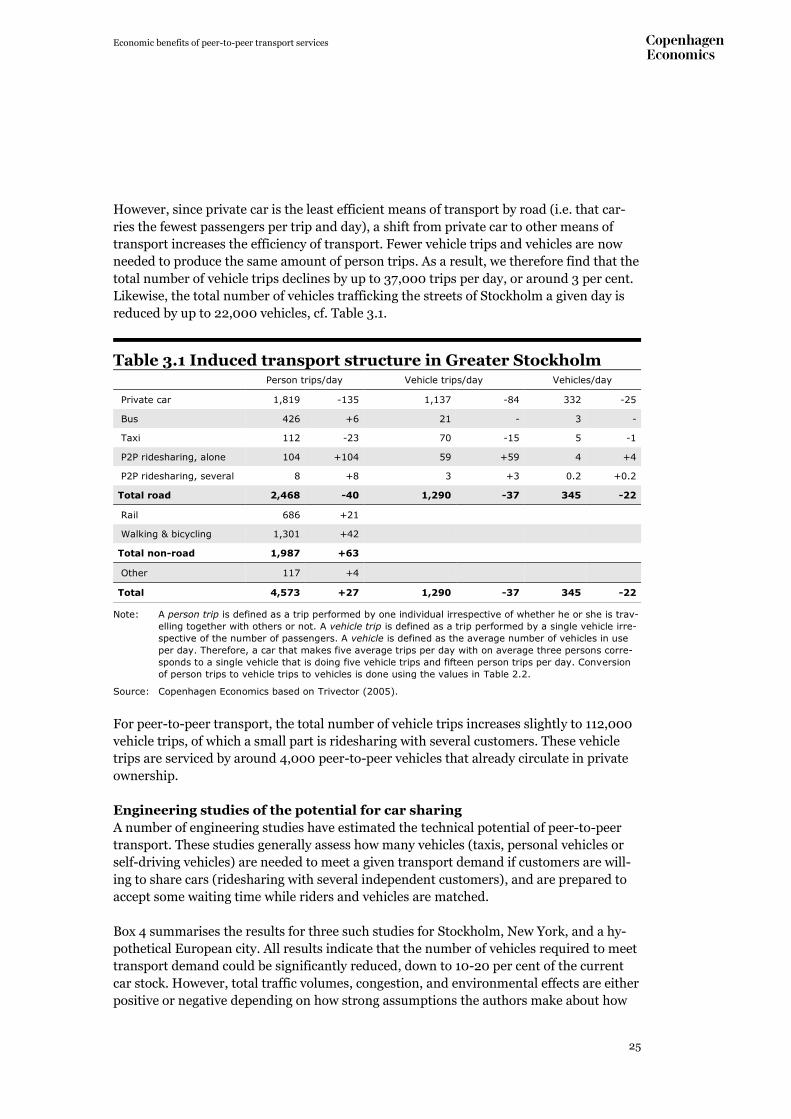
However, since private car is the least efficient means of transport by road (i.e. that car-
ries the fewest passengers per trip and day), a shift from private car to other means of
transport increases the efficiency of transport. Fewer vehicle trips and vehicles are now
needed to produce the same amount of person trips. As a result, we therefore find that the
total number of vehicle trips declines by up to 37,000 trips per day, or around 3 per cent.
Likewise, the total number of vehicles trafficking the streets of Stockholm a given day is
reduced by up to 22,000 vehicles, cf. Table 3.1.
Table 3.1 Induced transport structure in Greater Stockholm Person trips/day Vehicle trips/day Vehicles/day
Private car 1,819 -135 1,137 -84 332 -25
Bus 426 +6 21 - 3 -
Taxi 112 -23 70 -15 5 -1
P2P ridesharing, alone 104 +104 59 +59 4 +4
P2P ridesharing, several 8 +8 3 +3 0.2 +0.2
Total road 2,468 -40 1,290 -37 345 -22
Rail 686 +21
Walking & bicycling 1,301 +42
Total non-road 1,987 +63
Other 117 +4
Total 4,573 +27 1,290 -37 345 -22
Note: A person trip is defined as a trip performed by one individual irrespective of whether he or she is trav-
elling together with others or not. A vehicle trip is defined as a trip performed by a single vehicle irre-
spective of the number of passengers. A vehicle is defined as the average number of vehicles in use
per day. Therefore, a car that makes five average trips per day with on average three persons corre-
sponds to a single vehicle that is doing five vehicle trips and fifteen person trips per day. Conversion
of person trips to vehicle trips to vehicles is done using the values in Table 2.2.
Source: Copenhagen Economics based on Trivector (2005).
For peer-to-peer transport, the total number of vehicle trips increases slightly to 112,000
vehicle trips, of which a small part is ridesharing with several customers. These vehicle
trips are serviced by around 4,000 peer-to-peer vehicles that already circulate in private
ownership.
Engineering studies of the potential for car sharing
A number of engineering studies have estimated the technical potential of peer-to-peer
transport. These studies generally assess how many vehicles (taxis, personal vehicles or
self-driving vehicles) are needed to meet a given transport demand if customers are will-
ing to share cars (ridesharing with several independent customers), and are prepared to
accept some waiting time while riders and vehicles are matched.
Box 4 summarises the results for three such studies for Stockholm, New York, and a hy-
pothetical European city. All results indicate that the number of vehicles required to meet
transport demand could be significantly reduced, down to 10-20 per cent of the current
car stock. However, total traffic volumes, congestion, and environmental effects are either
positive or negative depending on how strong assumptions the authors make about how
Economic benefits of peer-to-peer transport services
26
many rides are shared, and how much waiting time customers are willing to accept. Gen-
erally, to achieve positive environmental effects and reduced congestions, the studies
need to assume that ridesharing with several customers is used to the highest degree pos-
sible independently of personal preferences, as well as the maximum acceptable waiting
time. The main reason is that none of the studies include the changes in transport de-
mand induced by reduced personal car ownership.
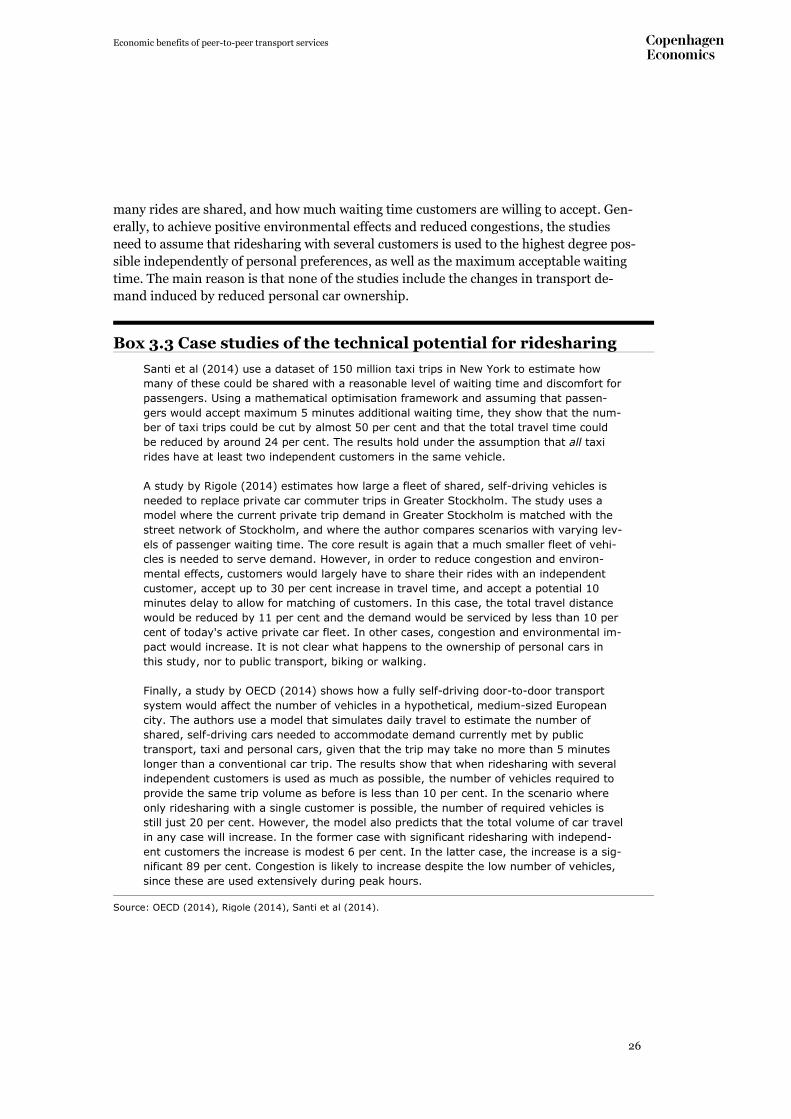
Box 3.3 Case studies of the technical potential for ridesharing
Santi et al (2014) use a dataset of 150 million taxi trips in New York to estimate how
many of these could be shared with a reasonable level of waiting time and discomfort for
passengers. Using a mathematical optimisation framework and assuming that passen-
gers would accept maximum 5 minutes additional waiting time, they show that the num-
ber of taxi trips could be cut by almost 50 per cent and that the total travel time could
be reduced by around 24 per cent. The results hold under the assumption that all taxi
rides have at least two independent customers in the same vehicle.
A study by Rigole (2014) estimates how large a fleet of shared, self-driving vehicles is
needed to replace private car commuter trips in Greater Stockholm. The study uses a
model where the current private trip demand in Greater Stockholm is matched with the
street network of Stockholm, and where the author compares scenarios with varying lev-
els of passenger waiting time. The core result is again that a much smaller fleet of vehi-
cles is needed to serve demand. However, in order to reduce congestion and environ-
mental effects, customers would largely have to share their rides with an independent
customer, accept up to 30 per cent increase in travel time, and accept a potential 10
minutes delay to allow for matching of customers. In this case, the total travel distance
would be reduced by 11 per cent and the demand would be serviced by less than 10 per
cent of today's active private car fleet. In other cases, congestion and environmental im-
pact would increase. It is not clear what happens to the ownership of personal cars in
this study, nor to public transport, biking or walking.
Finally, a study by OECD (2014) shows how a fully self-driving door-to-door transport
system would affect the number of vehicles in a hypothetical, medium-sized European
city. The authors use a model that simulates daily travel to estimate the number of
shared, self-driving cars needed to accommodate demand currently met by public
transport, taxi and personal cars, given that the trip may take no more than 5 minutes
longer than a conventional car trip. The results show that when ridesharing with several
independent customers is used as much as possible, the number of vehicles required to
provide the same trip volume as before is less than 10 per cent. In the scenario where
only ridesharing with a single customer is possible, the number of required vehicles is
still just 20 per cent. However, the model also predicts that the total volume of car travel
in any case will increase. In the former case with significant ridesharing with independ-
ent customers the increase is modest 6 per cent. In the latter case, the increase is a sig-
nificant 89 per cent. Congestion is likely to increase despite the low number of vehicles,
since these are used extensively during peak hours.
Source: OECD (2014), Rigole (2014), Santi et al (2014).
Economic benefits of peer-to-peer transport services
27
Chapter 4
4 Economic effects: Time savings and increased productivity
We have found that the introduction of a well-functioning peer-to-peer transport service
is likely to slightly increase personal travel activity, but it will also change the transport
structure such that travel intensity on roads will decline. On average, there would be
fewer cars on the roads of Stockholm at any given time. Fewer cars will tend to reduce
congestion and therefore reduce the time citizens spend waiting in traffic. This has an
economic value.
We investigate how fewer cars (vehicle trips) in Stockholm affects congestion levels, and
time spent in traffic by citizens, and what economic value this creates. Box 4.1 describes
the calculations and the model used for the first step: calculating the decrease in conges-
tion levels from fewer vehicle trips in Stockholm.
Box 4.1 Calculating congestion levels
In order to calculate how reduced traffic volumes affect congestion in Stockholm, we
need to establish a few things. Consolidated data on traffic habits and regional vol-
umes are not widely available in Stockholm. In 2005, a large-scale travel survey of
Stockholm traffic was conducted in order to measure the effects of the congestion
charges that were introduced the following year. Much of the data below is gathered
from this survey.
First, we need to know when car trips are made; one trip less during rush hour will
reduce congestion more than a trip during outside rush hour. Car trips made on
weekdays spike twice during the day as commuters head to and from work, once in
the morning around 07:00, and once in the evening around 16:00, cf. the figure be-
low.
Source: Copenhagen Economics based on Sika (2007).
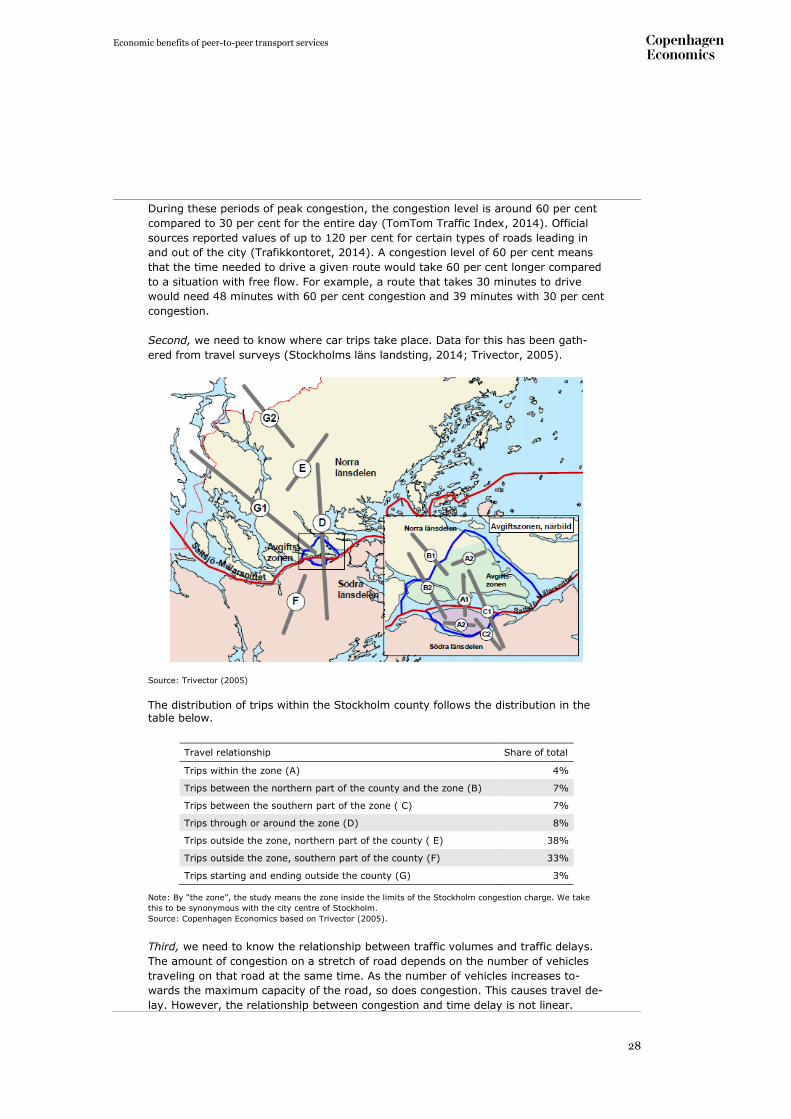
Economic benefits of peer-to-peer transport services
28
During these periods of peak congestion, the congestion level is around 60 per cent
compared to 30 per cent for the entire day (TomTom Traffic Index, 2014). Official
sources reported values of up to 120 per cent for certain types of roads leading in
and out of the city (Trafikkontoret, 2014). A congestion level of 60 per cent means
that the time needed to drive a given route would take 60 per cent longer compared
to a situation with free flow. For example, a route that takes 30 minutes to drive
would need 48 minutes with 60 per cent congestion and 39 minutes with 30 per cent
congestion.
Second, we need to know where car trips take place. Data for this has been gath-
ered from travel surveys (Stockholms läns landsting, 2014; Trivector, 2005).
Source: Trivector (2005)
The distribution of trips within the Stockholm county follows the distribution in the table below.
Note: By “the zone”, the study means the zone inside the limits of the Stockholm congestion charge. We take
this to be synonymous with the city centre of Stockholm.
Source: Copenhagen Economics based on Trivector (2005).
Third, we need to know the relationship between traffic volumes and traffic delays.
The amount of congestion on a stretch of road depends on the number of vehicles
traveling on that road at the same time. As the number of vehicles increases to-
wards the maximum capacity of the road, so does congestion. This causes travel de-
lay. However, the relationship between congestion and time delay is not linear.
Travel relationship Share of total
Trips within the zone (A) 4%
Trips between the northern part of the county and the zone (B) 7%
Trips between the southern part of the zone ( C) 7%
Trips through or around the zone (D) 8%
Trips outside the zone, northern part of the county ( E) 38%
Trips outside the zone, southern part of the county (F) 33%
Trips starting and ending outside the county (G) 3%
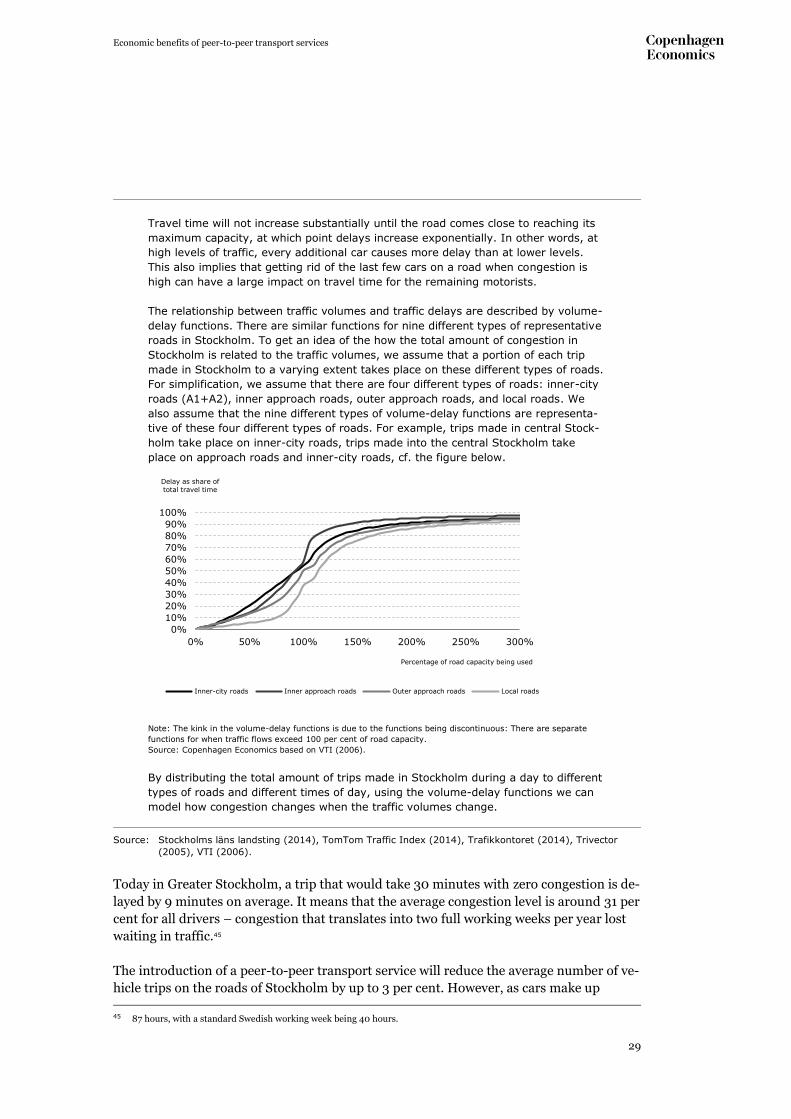
Economic benefits of peer-to-peer transport services
29
Travel time will not increase substantially until the road comes close to reaching its
maximum capacity, at which point delays increase exponentially. In other words, at
high levels of traffic, every additional car causes more delay than at lower levels.
This also implies that getting rid of the last few cars on a road when congestion is
high can have a large impact on travel time for the remaining motorists.
The relationship between traffic volumes and traffic delays are described by volume-
delay functions. There are similar functions for nine different types of representative
roads in Stockholm. To get an idea of the how the total amount of congestion in
Stockholm is related to the traffic volumes, we assume that a portion of each trip
made in Stockholm to a varying extent takes place on these different types of roads.
For simplification, we assume that there are four different types of roads: inner-city
roads (A1+A2), inner approach roads, outer approach roads, and local roads. We
also assume that the nine different types of volume-delay functions are representa-
tive of these four different types of roads. For example, trips made in central Stock-
holm take place on inner-city roads, trips made into the central Stockholm take
place on approach roads and inner-city roads, cf. the figure below.
Note: The kink in the volume-delay functions is due to the functions being discontinuous: There are separate
functions for when traffic flows exceed 100 per cent of road capacity.
Source: Copenhagen Economics based on VTI (2006).
By distributing the total amount of trips made in Stockholm during a day to different
types of roads and different times of day, using the volume-delay functions we can
model how congestion changes when the traffic volumes change.
Source: Stockholms läns landsting (2014), TomTom Traffic Index (2014), Trafikkontoret (2014), Trivector
(2005), VTI (2006).
Today in Greater Stockholm, a trip that would take 30 minutes with zero congestion is de-
layed by 9 minutes on average. It means that the average congestion level is around 31 per
cent for all drivers – congestion that translates into two full working weeks per year lost
waiting in traffic.45
The introduction of a peer-to-peer transport service will reduce the average number of ve-
hicle trips on the roads of Stockholm by up to 3 per cent. However, as cars make up
45 87 hours, with a standard Swedish working week being 40 hours.
0%
10%
20%
30%
40%
50%
60%
70%
80%
90%
100%
0% 50% 100% 150% 200% 250% 300%
Delay as share of
total travel time
Percentage of road capacity being used
Inner-city roads Inner approach roads Outer approach roads Local roads
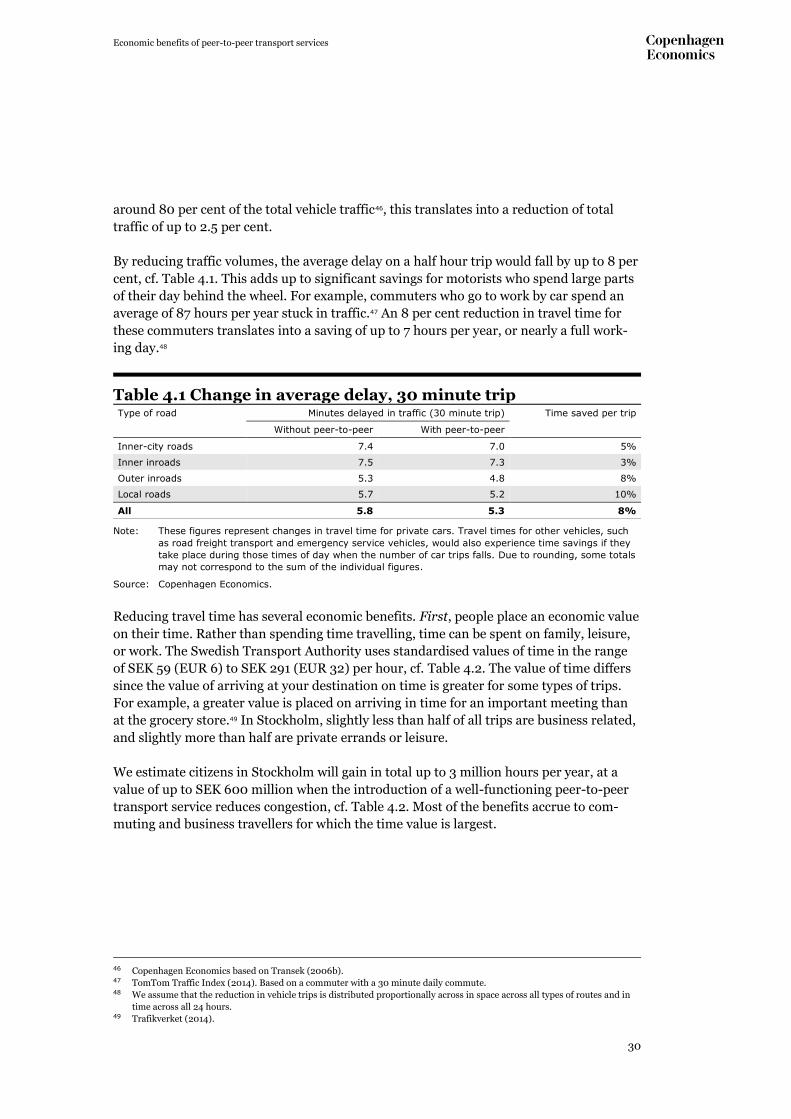
Economic benefits of peer-to-peer transport services
30
around 80 per cent of the total vehicle traffic46, this translates into a reduction of total
traffic of up to 2.5 per cent.
By reducing traffic volumes, the average delay on a half hour trip would fall by up to 8 per
cent, cf. Table 4.1. This adds up to significant savings for motorists who spend large parts
of their day behind the wheel. For example, commuters who go to work by car spend an
average of 87 hours per year stuck in traffic.47 An 8 per cent reduction in travel time for
these commuters translates into a saving of up to 7 hours per year, or nearly a full work-
ing day.48
Table 4.1 Change in average delay, 30 minute trip Type of road Minutes delayed in traffic (30 minute trip) Time saved per trip
Without peer-to-peer With peer-to-peer
Inner-city roads 7.4 7.0 5%
Inner inroads 7.5 7.3 3%
Outer inroads 5.3 4.8 8%
Local roads 5.7 5.2 10%
All 5.8 5.3 8%
Note: These figures represent changes in travel time for private cars. Travel times for other vehicles, such
as road freight transport and emergency service vehicles, would also experience time savings if they
take place during those times of day when the number of car trips falls. Due to rounding, some totals
may not correspond to the sum of the individual figures.
Source: Copenhagen Economics.
Reducing travel time has several economic benefits. First, people place an economic value
on their time. Rather than spending time travelling, time can be spent on family, leisure,
or work. The Swedish Transport Authority uses standardised values of time in the range
of SEK 59 (EUR 6) to SEK 291 (EUR 32) per hour, cf. Table 4.2. The value of time differs
since the value of arriving at your destination on time is greater for some types of trips.
For example, a greater value is placed on arriving in time for an important meeting than
at the grocery store.49 In Stockholm, slightly less than half of all trips are business related,
and slightly more than half are private errands or leisure.
We estimate citizens in Stockholm will gain in total up to 3 million hours per year, at a
value of up to SEK 600 million when the introduction of a well-functioning peer-to-peer
transport service reduces congestion, cf. Table 4.2. Most of the benefits accrue to com-
muting and business travellers for which the time value is largest.
46 Copenhagen Economics based on Transek (2006b). 47 TomTom Traffic Index (2014). Based on a commuter with a 30 minute daily commute. 48 We assume that the reduction in vehicle trips is distributed proportionally across in space across all types of routes and in
time across all 24 hours. 49 Trafikverket (2014).
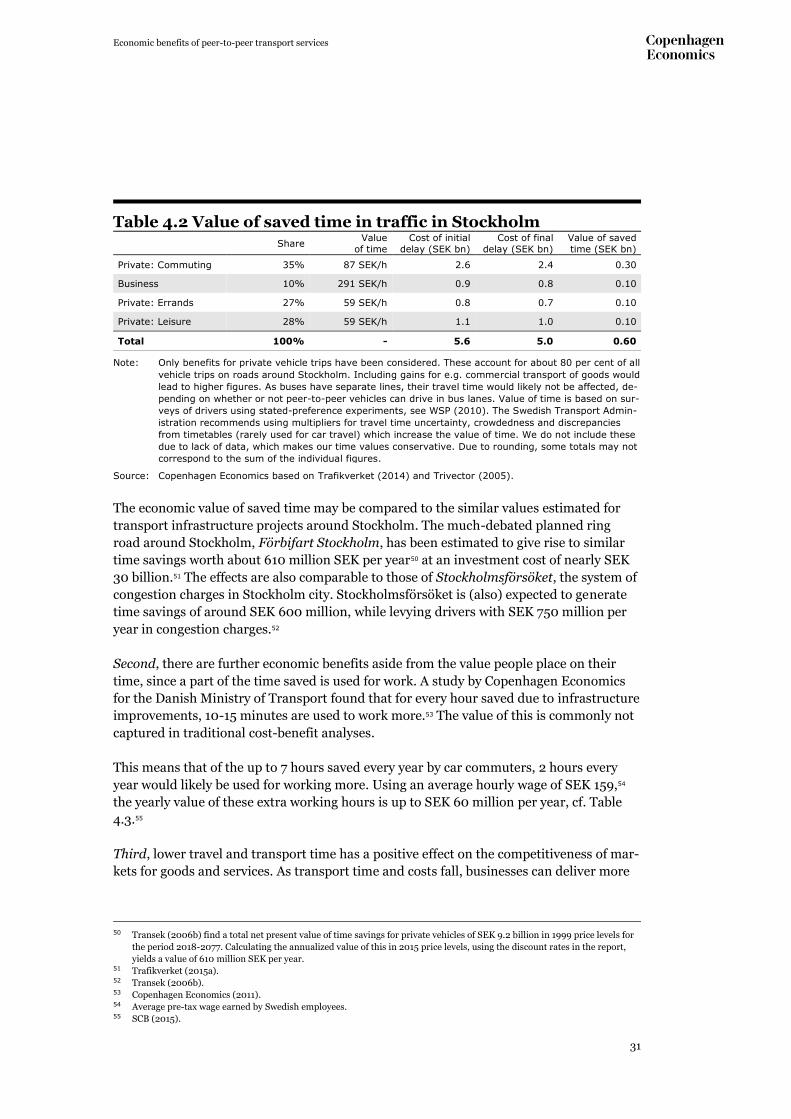
Economic benefits of peer-to-peer transport services
31
Table 4.2 Value of saved time in traffic in Stockholm
Share Value
of time
Cost of initial
delay (SEK bn)
Cost of final
delay (SEK bn)
Value of saved
time (SEK bn)
Private: Commuting 35% 87 SEK/h 2.6 2.4 0.30
Business 10% 291 SEK/h 0.9 0.8 0.10
Private: Errands 27% 59 SEK/h 0.8 0.7 0.10
Private: Leisure 28% 59 SEK/h 1.1 1.0 0.10
Total 100% - 5.6 5.0 0.60
Note: Only benefits for private vehicle trips have been considered. These account for about 80 per cent of all
vehicle trips on roads around Stockholm. Including gains for e.g. commercial transport of goods would
lead to higher figures. As buses have separate lines, their travel time would likely not be affected, de-
pending on whether or not peer-to-peer vehicles can drive in bus lanes. Value of time is based on sur-
veys of drivers using stated-preference experiments, see WSP (2010). The Swedish Transport Admin-
istration recommends using multipliers for travel time uncertainty, crowdedness and discrepancies
from timetables (rarely used for car travel) which increase the value of time. We do not include these
due to lack of data, which makes our time values conservative. Due to rounding, some totals may not
correspond to the sum of the individual figures.
Source: Copenhagen Economics based on Trafikverket (2014) and Trivector (2005).
The economic value of saved time may be compared to the similar values estimated for
transport infrastructure projects around Stockholm. The much-debated planned ring
road around Stockholm, Förbifart Stockholm, has been estimated to give rise to similar
time savings worth about 610 million SEK per year50 at an investment cost of nearly SEK
30 billion.51 The effects are also comparable to those of Stockholmsförsöket, the system of
congestion charges in Stockholm city. Stockholmsförsöket is (also) expected to generate
time savings of around SEK 600 million, while levying drivers with SEK 750 million per
year in congestion charges.52
Second, there are further economic benefits aside from the value people place on their
time, since a part of the time saved is used for work. A study by Copenhagen Economics
for the Danish Ministry of Transport found that for every hour saved due to infrastructure
improvements, 10-15 minutes are used to work more.53 The value of this is commonly not
captured in traditional cost-benefit analyses.
This means that of the up to 7 hours saved every year by car commuters, 2 hours every
year would likely be used for working more. Using an average hourly wage of SEK 159,54
the yearly value of these extra working hours is up to SEK 60 million per year, cf. Table
4.3.55
Third, lower travel and transport time has a positive effect on the competitiveness of mar-
kets for goods and services. As transport time and costs fall, businesses can deliver more
50 Transek (2006b) find a total net present value of time savings for private vehicles of SEK 9.2 billion in 1999 price levels for
the period 2018-2077. Calculating the annualized value of this in 2015 price levels, using the discount rates in the report,
yields a value of 610 million SEK per year. 51 Trafikverket (2015a). 52 Transek (2006b). 53 Copenhagen Economics (2011). 54 Average pre-tax wage earned by Swedish employees. 55 SCB (2015).
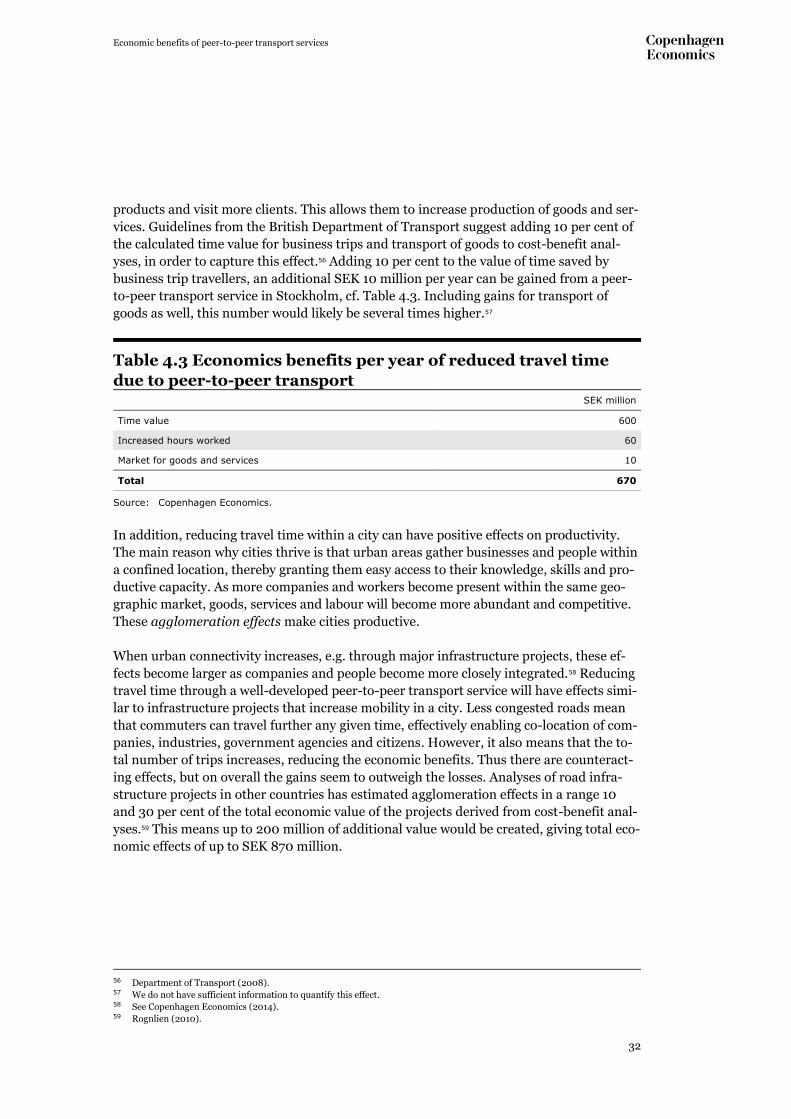
Economic benefits of peer-to-peer transport services
32
products and visit more clients. This allows them to increase production of goods and ser-
vices. Guidelines from the British Department of Transport suggest adding 10 per cent of
the calculated time value for business trips and transport of goods to cost-benefit anal-
yses, in order to capture this effect.56 Adding 10 per cent to the value of time saved by
business trip travellers, an additional SEK 10 million per year can be gained from a peer-
to-peer transport service in Stockholm, cf. Table 4.3. Including gains for transport of
goods as well, this number would likely be several times higher.57
Table 4.3 Economics benefits per year of reduced travel time
due to peer-to-peer transport SEK million
Time value 600
Increased hours worked 60
Market for goods and services 10
Total 670
Source: Copenhagen Economics.
In addition, reducing travel time within a city can have positive effects on productivity.
The main reason why cities thrive is that urban areas gather businesses and people within
a confined location, thereby granting them easy access to their knowledge, skills and pro-
ductive capacity. As more companies and workers become present within the same geo-
graphic market, goods, services and labour will become more abundant and competitive.
These agglomeration effects make cities productive.
When urban connectivity increases, e.g. through major infrastructure projects, these ef-
fects become larger as companies and people become more closely integrated.58 Reducing
travel time through a well-developed peer-to-peer transport service will have effects simi-
lar to infrastructure projects that increase mobility in a city. Less congested roads mean
that commuters can travel further any given time, effectively enabling co-location of com-
panies, industries, government agencies and citizens. However, it also means that the to-
tal number of trips increases, reducing the economic benefits. Thus there are counteract-
ing effects, but on overall the gains seem to outweigh the losses. Analyses of road infra-
structure projects in other countries has estimated agglomeration effects in a range 10
and 30 per cent of the total economic value of the projects derived from cost-benefit anal-
yses.59 This means up to 200 million of additional value would be created, giving total eco-
nomic effects of up to SEK 870 million.
56 Department of Transport (2008). 57 We do not have sufficient information to quantify this effect. 58 See Copenhagen Economics (2014). 59 Rognlien (2010).
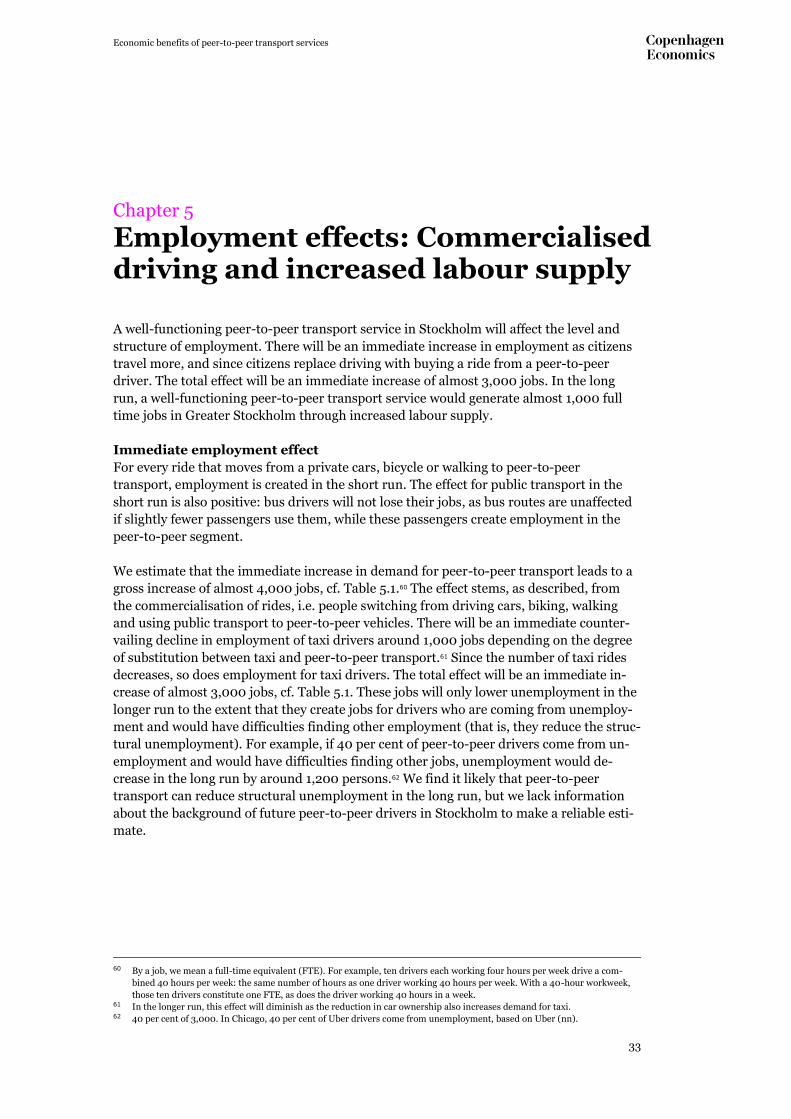
Economic benefits of peer-to-peer transport services
33
Chapter 5
5 Employment effects: Commercialised driving and increased labour supply
A well-functioning peer-to-peer transport service in Stockholm will affect the level and
structure of employment. There will be an immediate increase in employment as citizens
travel more, and since citizens replace driving with buying a ride from a peer-to-peer
driver. The total effect will be an immediate increase of almost 3,000 jobs. In the long
run, a well-functioning peer-to-peer transport service would generate almost 1,000 full
time jobs in Greater Stockholm through increased labour supply.
Immediate employment effect
For every ride that moves from a private cars, bicycle or walking to peer-to-peer
transport, employment is created in the short run. The effect for public transport in the
short run is also positive: bus drivers will not lose their jobs, as bus routes are unaffected
if slightly fewer passengers use them, while these passengers create employment in the
peer-to-peer segment.
We estimate that the immediate increase in demand for peer-to-peer transport leads to a
gross increase of almost 4,000 jobs, cf. Table 5.1.60 The effect stems, as described, from
the commercialisation of rides, i.e. people switching from driving cars, biking, walking
and using public transport to peer-to-peer vehicles. There will be an immediate counter-
vailing decline in employment of taxi drivers around 1,000 jobs depending on the degree
of substitution between taxi and peer-to-peer transport.61 Since the number of taxi rides
decreases, so does employment for taxi drivers. The total effect will be an immediate in-
crease of almost 3,000 jobs, cf. Table 5.1. These jobs will only lower unemployment in the
longer run to the extent that they create jobs for drivers who are coming from unemploy-
ment and would have difficulties finding other employment (that is, they reduce the struc-
tural unemployment). For example, if 40 per cent of peer-to-peer drivers come from un-
employment and would have difficulties finding other jobs, unemployment would de-
crease in the long run by around 1,200 persons.62 We find it likely that peer-to-peer
transport can reduce structural unemployment in the long run, but we lack information
about the background of future peer-to-peer drivers in Stockholm to make a reliable esti-
mate.
60 By a job, we mean a full-time equivalent (FTE). For example, ten drivers each working four hours per week drive a com-
bined 40 hours per week: the same number of hours as one driver working 40 hours per week. With a 40-hour workweek,
those ten drivers constitute one FTE, as does the driver working 40 hours in a week. 61 In the longer run, this effect will diminish as the reduction in car ownership also increases demand for taxi. 62 40 per cent of 3,000. In Chicago, 40 per cent of Uber drivers come from unemployment, based on Uber (nn).
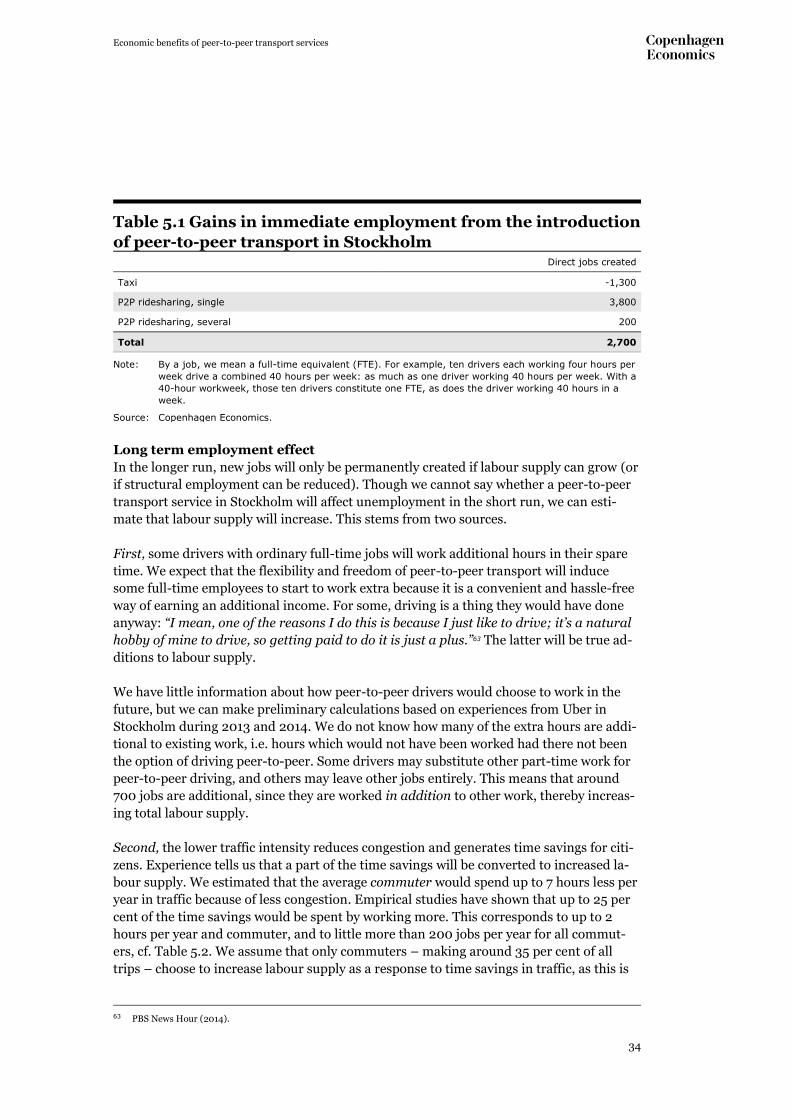
Economic benefits of peer-to-peer transport services
34
Table 5.1 Gains in immediate employment from the introduction
of peer-to-peer transport in Stockholm Direct jobs created
Taxi -1,300
P2P ridesharing, single 3,800
P2P ridesharing, several 200
Total 2,700
Note: By a job, we mean a full-time equivalent (FTE). For example, ten drivers each working four hours per
week drive a combined 40 hours per week: as much as one driver working 40 hours per week. With a
40-hour workweek, those ten drivers constitute one FTE, as does the driver working 40 hours in a
week.
Source: Copenhagen Economics.
Long term employment effect
In the longer run, new jobs will only be permanently created if labour supply can grow (or
if structural employment can be reduced). Though we cannot say whether a peer-to-peer
transport service in Stockholm will affect unemployment in the short run, we can esti-
mate that labour supply will increase. This stems from two sources.
First, some drivers with ordinary full-time jobs will work additional hours in their spare
time. We expect that the flexibility and freedom of peer-to-peer transport will induce
some full-time employees to start to work extra because it is a convenient and hassle-free
way of earning an additional income. For some, driving is a thing they would have done
anyway: “I mean, one of the reasons I do this is because I just like to drive; it’s a natural
hobby of mine to drive, so getting paid to do it is just a plus.”63 The latter will be true ad-
ditions to labour supply.
We have little information about how peer-to-peer drivers would choose to work in the
future, but we can make preliminary calculations based on experiences from Uber in
Stockholm during 2013 and 2014. We do not know how many of the extra hours are addi-
tional to existing work, i.e. hours which would not have been worked had there not been
the option of driving peer-to-peer. Some drivers may substitute other part-time work for
peer-to-peer driving, and others may leave other jobs entirely. This means that around
700 jobs are additional, since they are worked in addition to other work, thereby increas-
ing total labour supply.
Second, the lower traffic intensity reduces congestion and generates time savings for citi-
zens. Experience tells us that a part of the time savings will be converted to increased la-
bour supply. We estimated that the average commuter would spend up to 7 hours less per
year in traffic because of less congestion. Empirical studies have shown that up to 25 per
cent of the time savings would be spent by working more. This corresponds to up to 2
hours per year and commuter, and to little more than 200 jobs per year for all commut-
ers, cf. Table 5.2. We assume that only commuters – making around 35 per cent of all
trips – choose to increase labour supply as a response to time savings in traffic, as this is
63 PBS News Hour (2014).
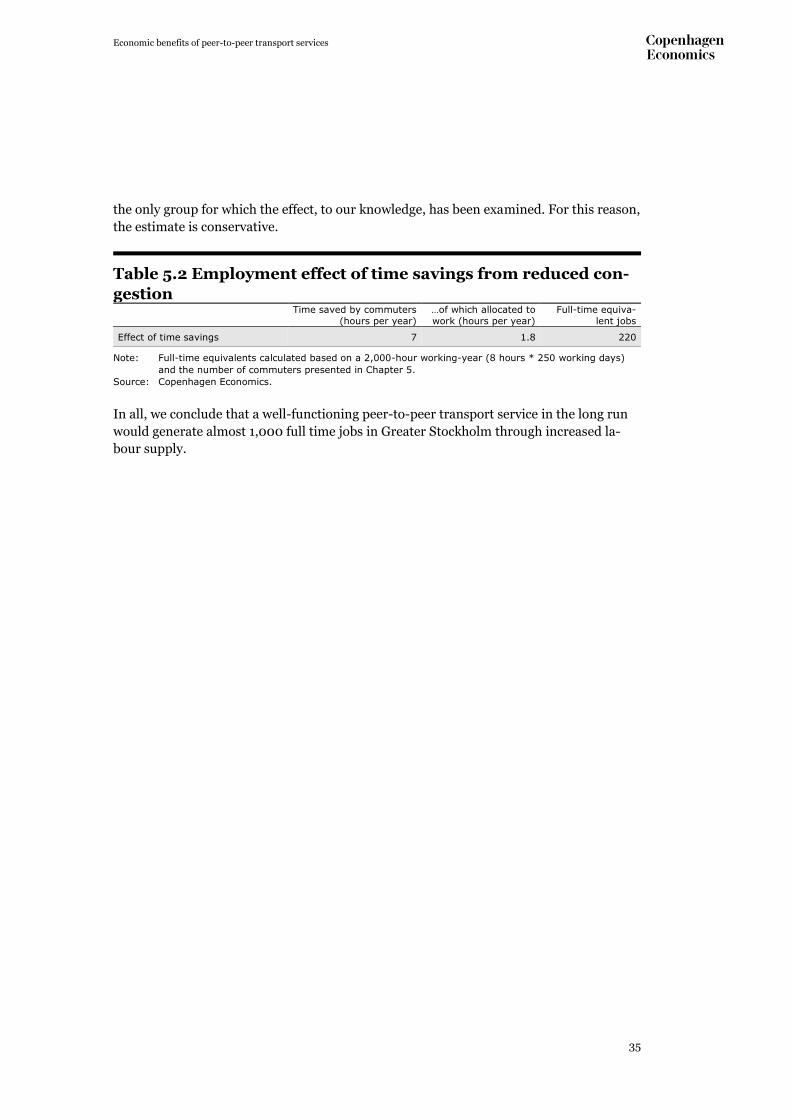
Economic benefits of peer-to-peer transport services
35
the only group for which the effect, to our knowledge, has been examined. For this reason,
the estimate is conservative.
Table 5.2 Employment effect of time savings from reduced con-
gestion
Time saved by commuters
(hours per year)
…of which allocated to
work (hours per year)
Full-time equiva-
lent jobs
Effect of time savings 7 1.8 220
Note: Full-time equivalents calculated based on a 2,000-hour working-year (8 hours * 250 working days)
and the number of commuters presented in Chapter 5.
Source: Copenhagen Economics.
In all, we conclude that a well-functioning peer-to-peer transport service in the long run
would generate almost 1,000 full time jobs in Greater Stockholm through increased la-
bour supply.
Economic benefits of peer-to-peer transport services
36
Chapter 6
6 Environmental effects: Lower emissions and freed up space
A well-functioning peer-to-peer transport service in Stockholm is likely to have an impact
on the environment, both in terms of emissions and land-use. Emissions, in the form of
particle and CO2 pollution, will decrease because the number of vehicle trips declines.
Furthermore, a more intensive use of vehicles means that they will be replaced more of-
ten. This in turn means that that new fuel-saving and emission-reducing technology will
be rolled out quicker, so that the vehicle fleet as a whole will have a lower environmental
footprint. Improving utilisation of vehicles will also reduce the demand for parking in the
city centre. This will free up space in streets that can be used – for example – for other ur-
gent transport purposes.
Effects on emissions of pollutants
Vehicles emit a range of pollutants that are harmful to both public health as well as the lo-
cal and global environment, cf. Box 6.1.
Box 6.1 Effects of emissions from vehicles
Emissions of particulate matter (e.g. PM2.5 and PM1064) from vehicle exhaust from road
and tyre wear are inhaled and cause heart- and respiratory disease. Carbon monoxide
(CO), due to incomplete fuel combustion, reduces human oxygen intake. Hydrocar-
bons (HC) and volatile organic compounds (VOC), unburned fuel released with ex-
hausts, are carcinogenic. Nitrous oxides (NOx), formed when nitrogen from fuel com-
bustion combines with oxygen damage vegetation, contribute to acidification and,
when they react with hydrocarbons, form ozone that destroys crops and weathers his-
toric buildings. Sulphur dioxide (SO2) has many of the same effects as NO. Emissions
of carbon dioxide (CO2) from road transport make up 30 per cent of all greenhouse
gas emissions in Sweden.
Source: Trafikverket (2015b).
Even though the emissions of pollutants have fallen significantly in Sweden over the past
two decades, they still have a significant impact on the environment and human health.65
Environmental quality standards for levels of particulate matter are exceeded on several
of Stockholm’s inner-city streets as well as roads leading into and out of the city.66 The
same holds true for nitrous oxides and ozone. In all, air pollution kills some 5,000 people
in Sweden every year according to the Swedish Environmental Research Institute.67
64 The subscript number represents the diameter of the particles. PM10 are all particles with a diameter of less than 10 micro-
metres. 65 Trafikverket (2015b). 66 Stockholms Stad (2015). 67 IVL (2006).
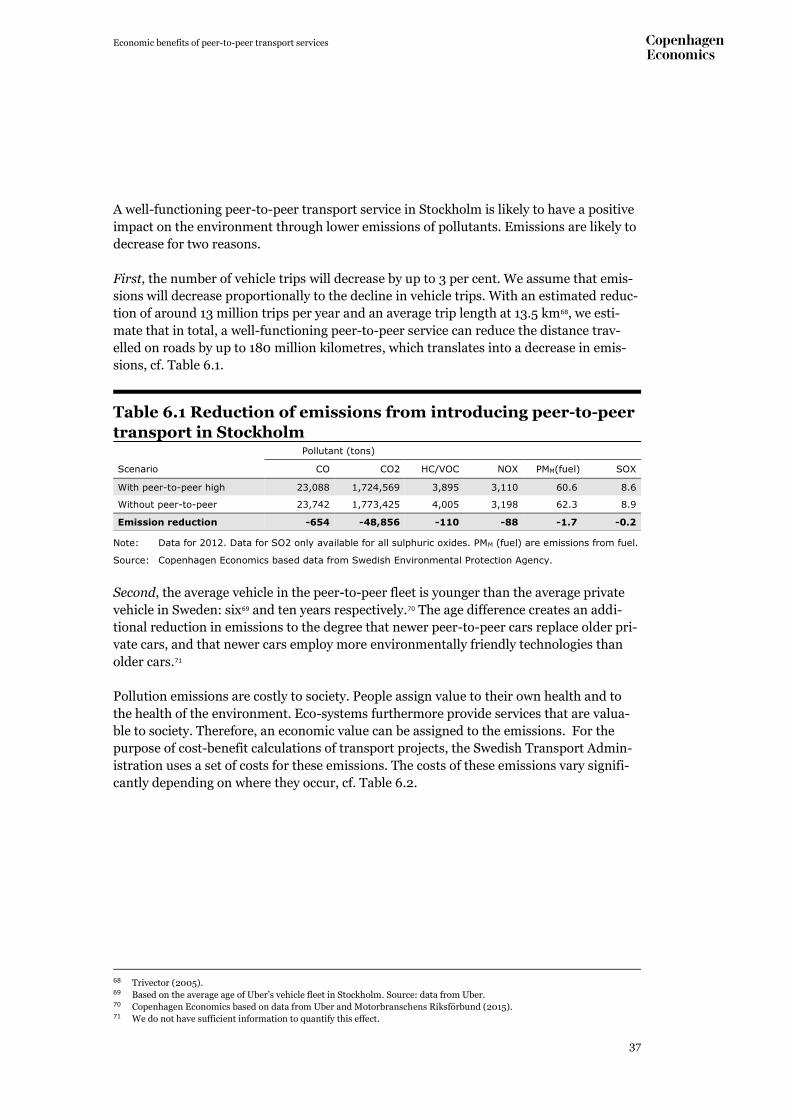
Economic benefits of peer-to-peer transport services
37
A well-functioning peer-to-peer transport service in Stockholm is likely to have a positive
impact on the environment through lower emissions of pollutants. Emissions are likely to
decrease for two reasons.
First, the number of vehicle trips will decrease by up to 3 per cent. We assume that emis-
sions will decrease proportionally to the decline in vehicle trips. With an estimated reduc-
tion of around 13 million trips per year and an average trip length at 13.5 km68, we esti-
mate that in total, a well-functioning peer-to-peer service can reduce the distance trav-
elled on roads by up to 180 million kilometres, which translates into a decrease in emis-
sions, cf. Table 6.1.
Table 6.1 Reduction of emissions from introducing peer-to-peer
transport in Stockholm Pollutant (tons)
Scenario CO CO2 HC/VOC NOX PMM(fuel) SOX
With peer-to-peer high 23,088 1,724,569 3,895 3,110 60.6 8.6
Without peer-to-peer 23,742 1,773,425 4,005 3,198 62.3 8.9
Emission reduction -654 -48,856 -110 -88 -1.7 -0.2
Note: Data for 2012. Data for SO2 only available for all sulphuric oxides. PMM (fuel) are emissions from fuel.
Source: Copenhagen Economics based data from Swedish Environmental Protection Agency.
Second, the average vehicle in the peer-to-peer fleet is younger than the average private
vehicle in Sweden: six69 and ten years respectively.70 The age difference creates an addi-
tional reduction in emissions to the degree that newer peer-to-peer cars replace older pri-
vate cars, and that newer cars employ more environmentally friendly technologies than
older cars.71
Pollution emissions are costly to society. People assign value to their own health and to
the health of the environment. Eco-systems furthermore provide services that are valua-
ble to society. Therefore, an economic value can be assigned to the emissions. For the
purpose of cost-benefit calculations of transport projects, the Swedish Transport Admin-
istration uses a set of costs for these emissions. The costs of these emissions vary signifi-
cantly depending on where they occur, cf. Table 6.2.
68 Trivector (2005). 69 Based on the average age of Uber’s vehicle fleet in Stockholm. Source: data from Uber. 70 Copenhagen Economics based on data from Uber and Motorbranschens Riksförbund (2015). 71 We do not have sufficient information to quantify this effect.
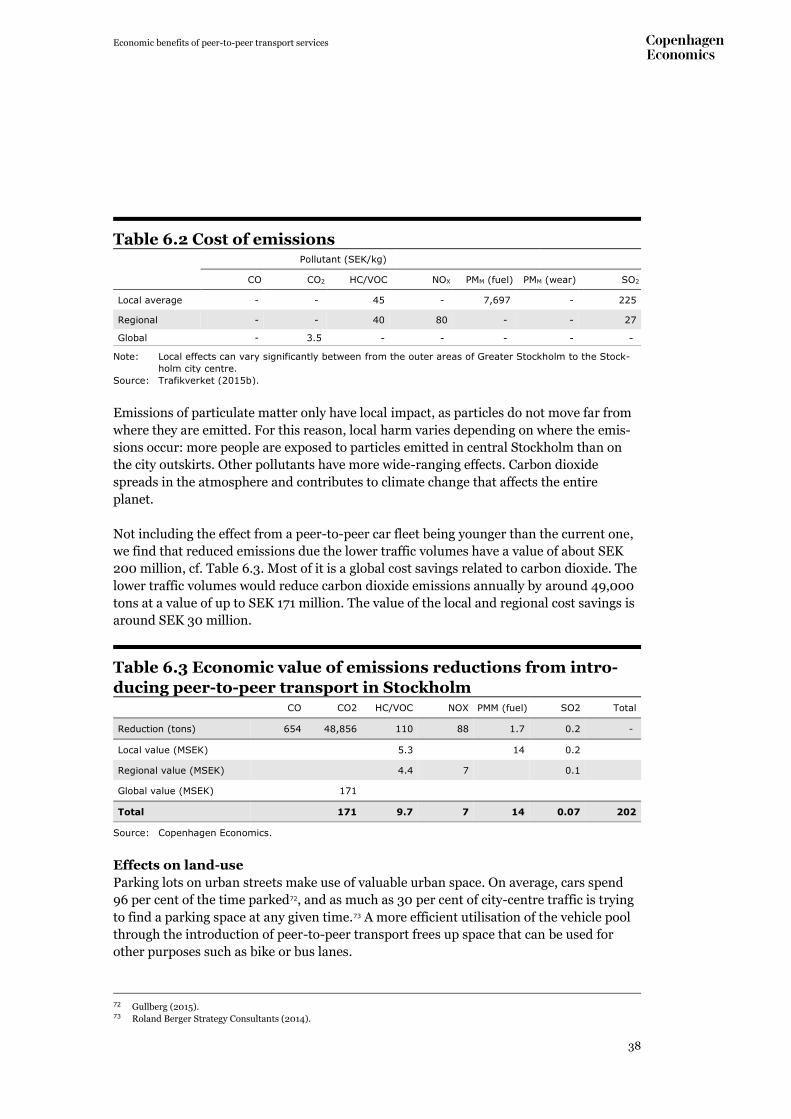
Economic benefits of peer-to-peer transport services
38
Table 6.2 Cost of emissions Pollutant (SEK/kg)
CO CO2 HC/VOC NOX PMM (fuel) PMM (wear) SO2
Local average - - 45 - 7,697 - 225
Regional - - 40 80 - - 27
Global - 3.5 - - - - -
Note: Local effects can vary significantly between from the outer areas of Greater Stockholm to the Stock-
holm city centre.
Source: Trafikverket (2015b).
Emissions of particulate matter only have local impact, as particles do not move far from
where they are emitted. For this reason, local harm varies depending on where the emis-
sions occur: more people are exposed to particles emitted in central Stockholm than on
the city outskirts. Other pollutants have more wide-ranging effects. Carbon dioxide
spreads in the atmosphere and contributes to climate change that affects the entire
planet.
Not including the effect from a peer-to-peer car fleet being younger than the current one,
we find that reduced emissions due the lower traffic volumes have a value of about SEK
200 million, cf. Table 6.3. Most of it is a global cost savings related to carbon dioxide. The
lower traffic volumes would reduce carbon dioxide emissions annually by around 49,000
tons at a value of up to SEK 171 million. The value of the local and regional cost savings is
around SEK 30 million.
Table 6.3 Economic value of emissions reductions from intro-
ducing peer-to-peer transport in Stockholm CO CO2 HC/VOC NOX PMM (fuel) SO2 Total
Reduction (tons) 654 48,856 110 88 1.7 0.2 -
Local value (MSEK) 5.3 14 0.2
Regional value (MSEK) 4.4 7 0.1
Global value (MSEK) 171
Total 171 9.7 7 14 0.07 202
Source: Copenhagen Economics.
Effects on land-use
Parking lots on urban streets make use of valuable urban space. On average, cars spend
96 per cent of the time parked72, and as much as 30 per cent of city-centre traffic is trying
to find a parking space at any given time.73 A more efficient utilisation of the vehicle pool
through the introduction of peer-to-peer transport frees up space that can be used for
other purposes such as bike or bus lanes.
72 Gullberg (2015). 73 Roland Berger Strategy Consultants (2014).
Economic benefits of peer-to-peer transport services
39
The introduction of a well-functioning peer-to-peer transport service reduces the number
of active cars in private ownership by up to 18,000 vehicles, and the number of cars in
Stockholm altogether by 45,000. This corresponds to a decline in the number of private
vehicles by around 5 per cent. While we do not know the total area reserved for parking in
Greater Stockholm, road side parking space in the city of Stockholm occupies 2.5 million
square metres, or 1.3 per cent of the total area of Stockholm.74 This corresponds approxi-
mately to the size of Östermalm, a central area of Stockholm.75
If we assume that the reduction of the number of cars translates into an equal reduction
in the demand for parking space, a 5 per cent reduction in parking space means that an
area corresponding to 63 km bike lanes (two metres wide) could be freed up in Stockholm
City.
The reduced need for parking will also lower the costs of snow mowing and street clean-
ing in Nordic capitals. Snow moving, for example, can carry significant costs. Stockholm
City alone uses between SEK 150 and 300 million per year, depending on the might of
winter. In streets where parking space is converted into bike lanes, Stockholm City can
plough in a single working procedure, and save a second weekly ploughing in the pre-de-
fined period where use of parking spaces is disallowed.
74 The entire area of Stockholm City is 187 million square meters. 75 Gullberg (2015).
Economic benefits of peer-to-peer transport services
40
References
AB Storstockholms Lokaltrafik (2005),“SL-trafiken
före försöket med trängselskatt”, downloaded 20
April 2015, available at: http://www.stockholms-
forsoket.se/upload/Rapporter/Tra-
fik/F%C3%B6re/SL_Slutlig%20f%C3%B6rerap-
port.pdf.
AlixPartners (2014), “Study Indicates Greater Nega-
tive Effect of Car Sharing on Vehicle Purchases”
downloaded 20 April 2015, available at:
http://www.alixpartners.com/en/MediaCen-
ter/PressReleases/tabid/821/articleType/Arti-
cleView/articleId/950/AlixPartners-Study-Indi-
cates-Greater-Negative-Effect-of-Car-Sharing-
on-Vehicle-Purchases.aspx.
Barter, P. (2008), “Car possession as problematic for
urban travel market”.
Botsman, R., & Rogers, R. (2010), “What’s mine is
yours: The rise of collaborative consumption”
New York, NY: Harper Business.
Bussmagasinet (2014), “Kollektivtrafiken kartlagd i
öppen jämförelse – Dalarna i marknadsbotten –
Stockholm i skattetopp”, published 26 March
2014, downloaded 11 May 2015, available at:
http://www.bussmagasinet.se/2014/03/kollek-
tivtrafiken-kartlagd-i-oppen-jamforelse-dalarna-
i-marknadsbotten-stockholm-i-skattetopp.
Cervero R., Golub A., & Nee B. (2006), “San Fran-
cisco City CarShare: Longer-term travel-demand
and car ownership impacts”, Working Paper, In-
stitute of Urban and Regional Development Uni-
versity of California at Berkeley.
Copenhagen Economics (2011), ”Infrastrukturpro-
jekters betydning for arbejdstiden”. Report for
Danish Ministry of Transport.
Economic benefits of peer-to-peer transport services
41
Copenhagen Economics (2014), ”Bredere økonomi-
ske effekter af transportinvesteringer”.
Crampton, G. R. (2006), “Impact on car ownership
of local variation in access to public transport”.
Crampton, G.R. (2007),”Light rail and local car own-
ership: Evidence from five countries”.
Department of Transport (2008), “The additionality
of Wider Economic Benefits in transport ap-
praisal”.
European Commission (2011), ”Cities of tomorrow –
Challenges, Visions, Ways Forward”, Directorate
for Regional Policy, Brussels.
European Commission (2015), “Intelligent Transport
Systems”, downloaded 20 April 2015, available
at: http://ec.europa.eu/research/transport/mul-
timodal/intelligent_transport_systems/in-
dex_en.htm.
Fouquet, R. (2012), “Trends in income and price
elasticities of transport demand (1850- 2010)”
Energy Policy 50.
Goodwin, P. B. (1992), “A review of new demand
elasticities with special reference to short and
long run effect of price changes”. Journal of
Transport Economics and Policy, May 1992, pp.
155-169.
Gullberg, A. (2015), “Här finns den lediga ka-
paciteten i storstadstrafiken”, KTH Centre for
Sustainable Communications.
Hara Associates Inc. (2013), “Best Practices Studies
of Taxi Regulation Managing Taxi Supply” Draft
Report.
Harms, S. (2003), “From routine choice to rational
decision making between mobility alternatives”,
Paper to STRC 3rd Swiss Transport Research
Conference, Monte Verità/Ascona, March 19-21,
2003.
Heikkilä, S. (2014), “Mobility as a Service – A Pro-
posal for Action for the Public Administration –
Case Helsinki”.
IVL (2006), ”Luftföroreningar orsakar mer än 5000
dödsfall per år i Sverige”, downloaded 20 April
2015, available at: http://www.ivl.se/press/ny-
Economic benefits of peer-to-peer transport services
42
heter/nyheter/luftfororeningarorsakarme-
ran5000dodsfallperaris-
verige.5.7df4c4e812d2da6a416800087800.html.
Lane, C. (2005), “PhillyCarShare: First-Year Social
and Mobility Impacts of Carsharing in Philadel-
phia, Pennsylvania”, Transportation Research
Record: Journal of the Transportation Research
Board, pp 158-166.
Litman, T. (2007), “Mobility as a Positional Good:
Implications for Transport Policy and Planning”.
Working Paper, Victoria Transport Policy Insti-
tute.
Liu, G. (2006), “A behavioral model of work-trip
mode choice in Shanghai”, China Economic Re-
view 18 (2007) 456–476.
Martin E., Shaheen S., & Lidicker J. (2010), “Car-
sharing’s Impact on Household Vehicle Holdings:
Results from a North American Shared-Use Vehi-
cle Survey”, Working Paper, Transportation Sus-
tainability Research Centre University of Califor-
nia, Berkeley.
Motorbranschens Riksförbund (2015), ”Hög medel-
ålder på svenska bilar”, downloaded 11 May 2015,
available at: http://mrf.se/NYHETS-
LISTA/2013/H%C3%B6g%20me-
del%C3%A5lder%20p%C3%A5%20bilpar-
ken.aspx.
OECD (2014), “Urban Mobility: System Upgrade –
How shared self-driving cars could change city
traffic”, International Transport Forum, OECD.
PBS News Hour (2014), “What it’s Really Like to be
an Uber Driver”, published 6 October 2014,
downloaded 20 April 2015, available at:
http://www.pbs.org/newshour/making-
sense/what-its-really-like-to-be-an-uber-driver/.
Rayle L., Shaheen S., Chan N., Dai D., & Cervero R.
(2014), “App-Based, On-Demand Ride Services:
Comparing Taxi and Ridesourcing Trips and User
Characteristics in San Francisco”, University of
California, Berkeley Transportation Centre
(UCTC), Working Paper.
Rigole, P.-J. (2014), “Study of a Shared Autonomous
Vehicles Based Mobility Solution in Stockholm”,
Master Thesis, KTH Industrial Ecology.
Economic benefits of peer-to-peer transport services
43
Rognlien, L. (2010), “Wider Economic Impact of
High Speed Rail”, Steer David Gleave, available
at:
http://www.transportmiljo.no/Data/0/36.pdf.
Roland Berger Strategy Consultants (2014), “Shared
mobility – How new businesses are rewriting the
rules of the private transportation game”.
Rose J., & Hensher D. (2014), “Demand for taxi ser-
vices: new elasticity evidence”, Transportation,
Volume 41 (4).
Santi P., Resta G., Szell M., Sobolevsky S., Strogatz
S., & Ratti C. (2014), “Quantifying the benefits of
vehicle pooling with shareability networks” Pro-
ceedings of the National Academy of Sciences,
Vol. 111(37).
SCB (2015), “Genomsnittlig lön för arbetare inom
privat sektor”, downloaded 20 April 2015, avai-
lable at: http://www.scb.se/sv_/Hitta-sta-
tistik/Statistik-efter-amne/Arbetsmarknad/Lo-
ner-och-arbetskostnader/Konjunkturstatistik-
loner-for-privat-sektor-KLP/33495/33502/Arbe-
tare/181719/.
SIKA (2007), ”RES 2005-2006 – Den nationella
resvaneundersökningen”.
Simma A., & Axhausen K.W. (2003), “Commitments
and modal usage – Analysis of German and
Dutch panels”, Transportation Research Record,
1854, 22-31.
Stockholms Handelskammare (2015), "Var fjärde
svensk snart stockholmare", published 24 March
2014, downloaded 11 May 2015, available at:
www.chamber.se/nyheter/var-fjarde-svensk-
snart-stockholmare.htm.
Stockholms läns landsting (2014), “Årsstatistik”,
downloaded 20 April, available at:
2015http://www.trf.sll.se/Statistik/Arsstatistik/.
Stockholms Stad (2015), ”Partiklar”, Updated 27 May
2015, downloaded 14 June 2015, http://miljo-
barometern.stockholm.se/sub.asp?mo=2&dm=2.
Stradling, S., (2002), “Persuading People Out of
Their Cars”, Napier University Professorial Lec-
ture, 27 March 2002.
Economic benefits of peer-to-peer transport services
44
Swedish Environmental Protection Agency, “Utsläpp
i siffror”, downloaded 11 May 2015, available at:
http://utslappisiffror.naturvardsverket.se/Alla-
utslapp-till-luft/.
Taxi 020 (2015), “Priser”, downloaded 20 April 2015,
available at: http://www.taxi020.se/boka-taxi-
020/priser/.
TaxiKurir (2015), ”Våra priser”, downloaded 20 April
2015, available at: http://www.taxiku-
rir.se/orterisverige/stockholm/taxikurirstock-
holm/vara-
priser.4.7017056e11fcce66e6580002397.html.
Taxi Stockholm (2015), “Prislista”, downloaded 20
April 2015, available at: http://www.taxistock-
holm.se/sv/Priser/.
Thogersen, J. (2006), “Understanding repetitive
travel mode choices in a stable context: a panel
study approach”, Transportation Research A, 40
(8): 621-638.
TomTom Traffic Index (2014), “Stockholm”, down-
loaded 20 April 2015, available at:
http://www.tomtom.com/sv_se/trafficin-
dex/#/city/STO.
Topcab (2015), “Prisinformation”, downloaded 20
April 2015, available at: http://www.top-
cab.com/Priser.htm.
Trafikanalys (2011), ”Arbetspendling i storstadsreg-
ioner – en nulägesanalys.” Rapport 2011:3,
Stockholm.
Trafikanalys (2013), ”Fakta om Statistiken”, available
at: trafa.se/PageDocuments/Fakta_om_statisti-
ken.pdf.
Trafikkontoret (2014), “Analys av utvecklingen i
Stockholmstrafiken 2013”, Tjänsteutlåtande.
Trafikverket (2014), ”Samhällsekonomiska principer
och kalkylvärden för transportsektorn: ASEK
5.1.”.
Trafikverket (2015a), ”Frågor och Svar om Förbifart
Stockholm”, downloaded 20 April 2015, available
at: http://www.trafikverket.se/Privat/Pro-
jekt/Stockholm/Forbifart-stockholm/Aktuella-
fragor-om-Forbifart-Stockholm/.
Economic benefits of peer-to-peer transport services
45
Trafikverket (2015b), “Vägtrafikens utsläpp”, down-
loaded 20 April 2015, available at:
http://www.trafikverket.se/Privat/Miljo-och-
halsa/Klimat/Transportsektorns-utslapp/Vagtra-
fikens-utslapp.
Transek (2006a), “Samhällsekonomiska kalkyler för
Nordsydliga förbindelser i Stockholm”.
Transek (2006b), "Samhällsekonomisk analys av
trängselsskatten".
Transportstyrelsen, ”Statistik över körkortsinneha-
vare efter åldersgrupp”, downloaded 20 April
2015, available at: https://www.transportstyrel-
sen.se/sv/vagtrafik/statistik-och-regis-
ter/Vag/Korkort/Statistik-over-korkortsinneha-
vare-efter-alder/.
Trivector (2005), “Resvanor i Stockholms län 2004–
inför utvärderingen av Stockholmsförsöket”.
Trivector (2015), ”Effekt av bilpool på parkeringsbe-
hov, bilinnehav, trafikarbete och emissioner”,
presentation, available at: http://www.tri-
vector.se/fileadmin/uploads/Traffic/Semi-
narier/TF15_2_Bilpooler_Indebetou.pdf.
Uber (nn), “Chicago: An Uber Case Study”
Uber (2015), “Announcing UberPOOL”
http://blog.uber.com/uberPOOL.
VTI (2006), “TU06 – Nya V/D-funktioner för tätort”.
Ward, H. (2002), “Road Congestion Pricing in Eu-
rope: Implications for the United States”.
WSP (2010), ”Trafikanters värdering av tid – Den
nationella tidsvärdesstudien 2007/08”.
Åkerman, J. (2014), ”Parkering, resmönster och kli-
matnytta”, Presentation, downloaded 15 April
2015, available at: http://www.ivl.se/down-
load/18.1acdfdc8146d949da6d50bb/1415962180
698/Jonas+%C3%85kerman+IVL+Parke-
ring,+resm%C3%B6nster+och+klimatnytta.pdf.