economic benefits from air transport in the pacific ocean ... · pacific ocean islands report 2 ......
TRANSCRIPT

Economic Benefits from Air Transport in the Pacific Ocean
Islands
Pacific Ocean Islands report
2
Acknowledgements
Oxford Economics gratefully acknowledge the help that we received from the
International Air Transport Association (IATA) in preparation of this report.
Through a survey conducted by IATA many organisations across the aviation
industry supplied us with data that has formed an integral part of our analysis.
We would like to thank all these organisations for their generosity in supplying
this data, without which this report could not have been written.
A note on the data reported in the report
Unless otherwise stated, the numbers reported in this report relate to the
calendar year 2009.
Oxford Economics 2011
v1.1
Pacific Ocean Islands report
3
Contents
Facts & figures .......................................................................................... 4
1 Enabling long-term economic growth ............................................ 6
1.1 Connectivity ................................................................................................ 6
1.2 Catalytic effects – tourism .......................................................................... 7
1.2.1 Fiji ....................................................................................................... 8
1.2.2 Kiribati ................................................................................................ 8
1.2.3 Papua New Guinea ............................................................................ 9
1.2.4 Solomon Islands ................................................................................ 9
1.2.5 Tonga ............................................................................................... 10
1.2.6 Vanuatu ............................................................................................ 10
1.3 Catalytic effects – trade............................................................................ 11
2 Economic footprint ........................................................................ 12
2.1 The aviation sector and its economic footprint ........................................ 12
2.2 Cook Islands ............................................................................................ 15
2.3 Fiji ............................................................................................................. 16
2.4 Guam........................................................................................................ 17
2.5 Kiribati ...................................................................................................... 18
2.6 Marshall Islands ....................................................................................... 19
2.7 Micronesia ................................................................................................ 20
2.8 Papua New Guinea .................................................................................. 21
2.9 Samoa ...................................................................................................... 22
2.10 Solomon Islands ....................................................................................... 23
2.11 Tonga ....................................................................................................... 24
2.12 Tuvalu....................................................................................................... 25
2.13 Vanuatu .................................................................................................... 26
2.14 Sectoral Breakdown of GDP .................................................................... 27
2.15 Productivity ............................................................................................... 27
3 Conclusion ..................................................................................... 28
Annex: Our methods .............................................................................. 29
Connectivity Index ........................................................................................ 29
Benefits to tourism ........................................................................................ 29
Economic footprint ........................................................................................ 29
Exchange rates ............................................................................................ 30
Passenger and freight volumes .................................................................... 30
Pacific Ocean Islands report
4
Facts & figures
The economic benefits of aviation in the Pacific Ocean Islands
Air transport to and from the Cook Islands, Fiji, Guam, Kiribati, the Marshall Islands, Micronesia, Papua
New Guinea, Samoa, the Solomon Islands, Tonga, Tuvalu and Vanuatu (hereafter referred to collectively
as the Pacific Ocean Islands) creates three distinct types of economic benefit. Typically, studies such as
this focus on the „economic footprint‟ of the industry, measured by its contribution to GDP, jobs and tax
revenues generated by the sector and its supply chain. But the economic value created by the industry is
more than that. The principal benefits are created for the customer, the passenger or shipper using the air
transport service. In addition, the connections created between cities and markets represent an important
infrastructure asset that generates benefits, in the case of the Pacific Ocean Islands, primarily through
enabling the development of their tourism sectors.
1. Aviation’s economic footprint
Contribution to GDP in the Pacific Ocean Islands
The aviation sector contributes $261 million (1.5%) to GDP in the Pacific Ocean Islands region. This total
comprises:
$151 million directly contributed through the output of the aviation sector (airlines, airports and
ground services);
$36 million indirectly contributed through the aviation sector‟s supply chain; and
$74 million contributed through the spending by the employees of the aviation sector and its supply
chain.
Major employer
The aviation sector supports 29,800 (0.9%) jobs in the Pacific Ocean Islands region. This total comprises:
7,700 jobs directly supported by the aviation sector;
9,800 jobs indirectly supported through the aviation sector‟s supply chain; and
12,300 jobs supported through the spending by the employees of the aviation sector and its supply
chain.
Tourism
Through the catalytic effects of tourism, the aviation sector facilitates further benefits to the economies of
the Pacific Ocean Islands, in the region of $1,952 million (11.1%) of GDP and 133,800 (4.1%) jobs. This
total comprises:
$998 million and 63,700 jobs directly supported in the tourism sector;
$660 million and 48,200 jobs indirectly supported through the tourism sector‟s supply chain; and
$294 million and 22,000 jobs supported through the spending by the employees of the tourism sector
and its supply chain.
Including these tourism impacts, the air transport sector supports approximately 12.6% of GDP and 5.0%
of employment in the Pacific Ocean Islands region.
Pacific Ocean Islands report
5
High productivity jobs
The average air transport services employee in the Pacific Ocean Islands region generates $19,572 in
GVA annually, which is nearly four times more productive than the average.
This report describes these channels in more detail.
Section 1 examines the way in which the aviation sector acts as an enabler of long-term economic growth
through connectivity, which helps to boost the catalytic effects of both tourism and trade.
Section 2 analyses the economic footprint of the aviation sector - the airlines and the ground-based
infrastructure - to quantify the value of its output and the jobs it supports in the Pacific Ocean Islands.

Pacific Ocean Islands report
6
1 Enabling long-term economic growth
1.1 Connectivity
The air transport network has been called the Real World Wide Web1. Chart 1.1 gives an idea of how
extensive the air transport network is for the Pacific Ocean Islands. In 2010 there were 60 routes in total
connecting the Pacific Ocean Islands nations with urban agglomerations around the globe. The breakdown
between countries was as follows: the Cook Islands (3); Fiji (8); Guam (18); the Marshall Islands (12); Papua
New Guinea (2); Samoa (1); the Solomon Islands (6); Tonga (3); and Vanuatu (5).
Chart 1.1: Connectivity, 2010 Chart 1.2: Foreign direct investment and
connectivity2
Source : IATA
Source : IATA, Oxford Economics
These linkages represent the „connectivity‟ of the Pacific Ocean Islands with major cities and markets
around the world. Connectivity reflects the range, frequency of service, the economic importance of
destinations and the number of onward connections available through each country‟s aviation network.
Improvements in connectivity achieved in recent decades has brought benefits to users of air transport
services by: reducing time spent in transit, increasing the frequency of service, allowing for shorter waiting
times and better targeting of departure and arrival times; and improving the quality of service, such as
reliability, punctuality and quality of the travel experience.
A number of these city-pair connections have point-to-point services, where passenger flow density is
sufficient to make the economics work. However, many of the city-pair connections that make up the
Pacific Ocean Islands‟ connectivity to overseas markets can only be served by airlines aggregating flows
from a number of origins through a hub airport in order to generate a sufficiently dense flow of passengers.
Improvements in connectivity have been accompanied by a steady fall in the cost of air transport services.
The cost of air transport services, in real terms, has fallen by around 1% a year over the past 40 years,
contributing to the rapid expansion in the volume of trade seen over this period3. Air transport has also
steadily become more competitive relative to other modes of transport. For example, it is estimated that its
1 ‟Aviation – The Real World Wide Web„, by Oxford Economics. Available at http://www.oxfordeconomics.com/samples/airbus.pdf
2 Due to data restrictions, figures are reported for those Islands for which data is available
3 See Swan (2007), „Misunderstandings about Airline Growth‟, Journal of Air Transport Management, 13, 3-8, and Baier and Bergstrand
(2001), „The growth of world trade: tariffs, transport costs and income similarity‟, Journal of International Economics, 53:1, 1-27.
0%
50%
100%
150%
200%
250%
0.0 0.2 0.4 0.6 0.8 1.0 1.2 1.4 1.6
FDI stock as % GDP
Connectivity per $ billion of GDP (PPP)
Fiji
Line of best fit
Papua New Guinea
Solomon
Islands Vanuatu
Pacific Ocean Islands report
7
relative cost has been falling by around 2.5% a year since the 1990s4. As its relative cost has fallen, air
shipments have become increasingly important for international trade.
Apart from the benefits to direct users of air transport services, the largest economic benefit of increased
connectivity comes through its impact on the long term performance of the wider economy. For the Pacific
Ocean Islands, this has been most apparent through the development of their tourism sectors.
Improved connectivity can also enhance an economy‟s performance by making it easier for firms to invest
outside their home country, which is known as foreign direct investment (FDI). Improved connectivity may
favour inward investment as increased passenger traffic and trade that accompanies improved connectivity
can lead to a more favourable environment for foreign firms to operate in. Chart 1.2 plots the total value of
FDI built up in individual countries in relation to their GDP against an index of connectivity (produced by
IATA), that measures the availability of flights, weighted by the importance of each of the destinations
served. The chart shows that countries with higher connectivity (measured relative to their GDP), are in
general more successful at attracting foreign direct investment. This is emphasised by the upward sloping
line that confirms the statistical relationship between greater connectivity and greater FDI.
1.2 Catalytic effects – tourism
Air transport lies at the heart of global business and tourism. Through its speed, convenience and
affordability, air transport has expanded the possiblities of world travel for tourists and business travellers
alike, allowing an ever greater number of people to experience diversity of geography, climate, culture and
markets.
Tourism, predominantly for leisure purposes, makes a significant contribution to the economies of each
Pacific Ocean Island, with foreign visitors spending an estimated $2,294 million in the region in 20095.
Approximately 89% of these visitors travelled by air, implying that foreign visitors arriving by air spent
approximately $2,050 million6.
When only considering the contribution linked to the spending of foreign visitors arriving by air, Oxford
Economics estimates that in 2009 the travel and tourism industry directly employed approximately 63,700
people and supported indirectly through its supply chain a further 48,200 jobs. A further 22,000 people
were supported through the household spending of those people directly and indirectly employed by the
travel and tourism sector.
Through the spending of those foreign visitors who travelled by air, the travel and tourism industry directly
contributed $998 million to the economy of the Pacific Ocean Islands region (GDP), $660 million indirectly
through the output it supports down its supply chain and a further $294 million through the induced effects
of consumer spending.
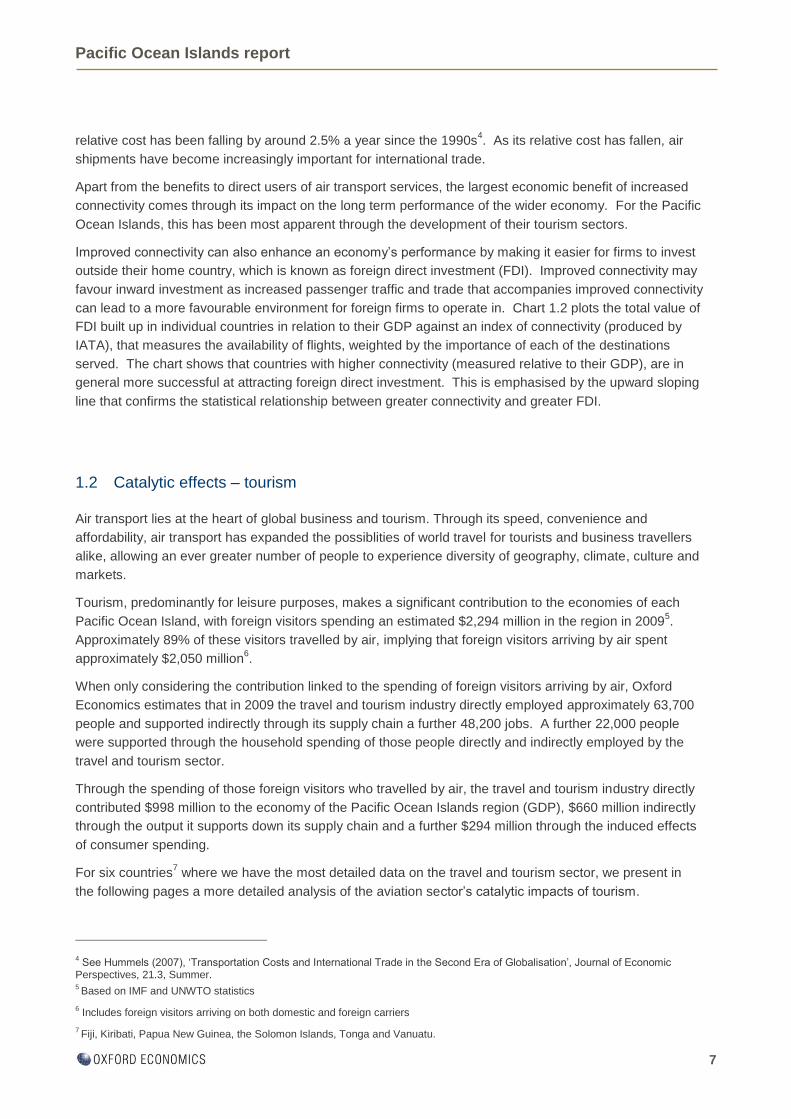
For six countries7 where we have the most detailed data on the travel and tourism sector, we present in
the following pages a more detailed analysis of the aviation sector‟s catalytic impacts of tourism.
4 See Hummels (2007), „Transportation Costs and International Trade in the Second Era of Globalisation‟, Journal of Economic
Perspectives, 21.3, Summer. 5 Based on IMF and UNWTO statistics
6 Includes foreign visitors arriving on both domestic and foreign carriers
7 Fiji, Kiribati, Papua New Guinea, the Solomon Islands, Tonga and Vanuatu.
Pacific Ocean Islands report
8
1.2.1 Fiji
When only considering the contribution linked to the spending of foreign visitors arriving by air, Oxford
Economics estimates that in 2009 the travel and tourism industry contributed approximately FJD 1,358
million to the Fijian economy (24.6% of total GDP) and supported 66,000 jobs. In addition to the direct
impact of the industry, these figures include both the indirect and induced impacts of its locally-based
supply chain and the household spending of those employed both directly and indirectly.
Chart 1.3: Travel and tourism’s contribution to
GDP and Employment in Fiji
Source : Oxford Economics
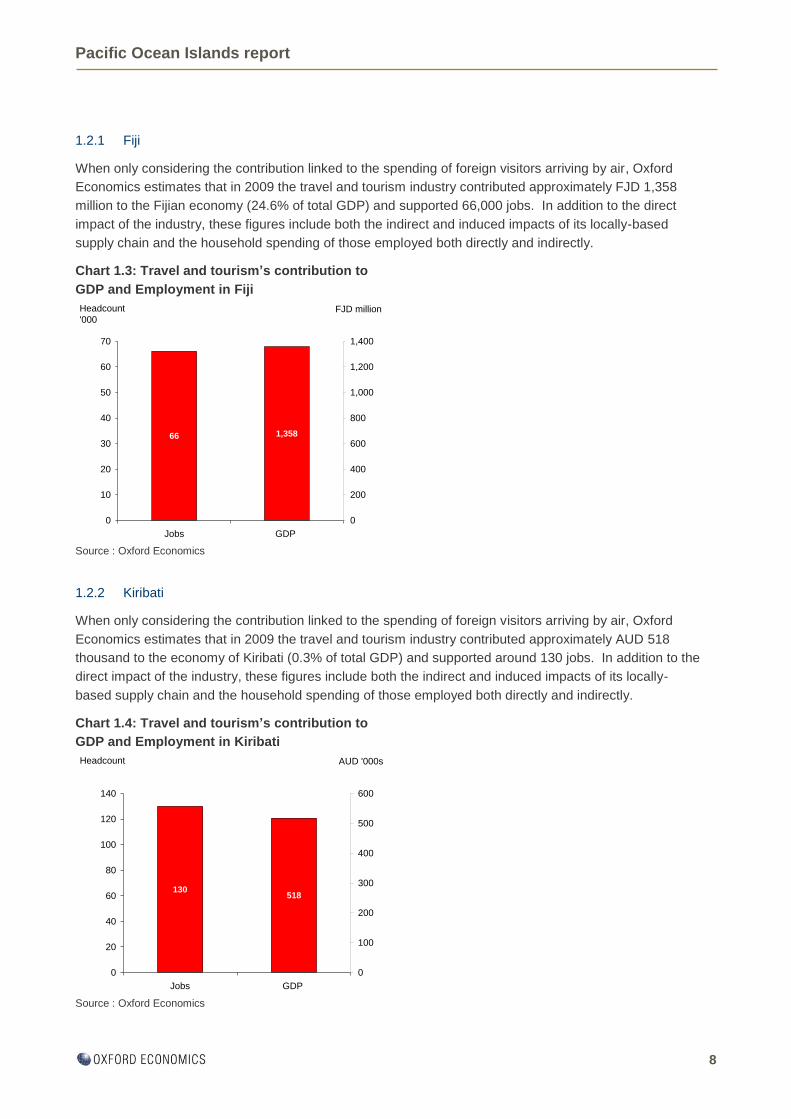
1.2.2 Kiribati
When only considering the contribution linked to the spending of foreign visitors arriving by air, Oxford
Economics estimates that in 2009 the travel and tourism industry contributed approximately AUD 518
thousand to the economy of Kiribati (0.3% of total GDP) and supported around 130 jobs. In addition to the
direct impact of the industry, these figures include both the indirect and induced impacts of its locally-
based supply chain and the household spending of those employed both directly and indirectly.
Chart 1.4: Travel and tourism’s contribution to
GDP and Employment in Kiribati
Source : Oxford Economics
66 1,358
0
10
20
30
40
50
60
70
Jobs GDP
0
200
400
600
800
1,000
1,200
1,400
Headcount
'000FJD million
130518
0
20
40
60
80
100
120
140
Jobs GDP
0
100
200
300
400
500
600
Headcount AUD '000s

Pacific Ocean Islands report
9
1.2.3 Papua New Guinea
When only considering the contribution linked to the spending of foreign visitors arriving by air, Oxford
Economics estimates that in 2009 the travel and tourism industry contributed approximately PGK 3 million
to the economy of Papua New Guinea (0.1% of total GDP) and supported around 300 jobs. In addition to
the direct impact of the industry, these figures include both the indirect and induced impacts of its locally-
based supply chain and the household spending of those employed both directly and indirectly.
Chart 1.5: Travel and tourism’s contribution to
GDP and Employment in Papua New Guinea
Source : Oxford Economics
1.2.4 Solomon Islands
When only considering the contribution linked to the spending of foreign visitors arriving by air, Oxford
Economics estimates that in 2009 the travel and tourism industry contributed approximately SBD 487
million to the economy of the Solomon Islands (8.5% of total GDP) and supported 7,800 jobs. In addition
to the direct impact of the industry, these figures include both the indirect and induced impacts of its
locally-based supply chain and the household spending of those employed both directly and indirectly.
Chart 1.6: Travel and tourism’s contribution to
GDP and Employment in the Solomon Islands
Source : Oxford Economics
300 3.0
0
50
100
150
200
250
300
350
Jobs GDP
0.0
0.5
1.0
1.5
2.0
2.5
3.0
3.5
Headcount PGK million
7.8 487
0
1
2
3
4
5
6
7
8
Jobs GDP
0
50
100
150
200
250
300
350
400
450
500
Headcount
'000SBD million

Pacific Ocean Islands report
10
1.2.5 Tonga
When only considering the contribution linked to the spending of foreign visitors arriving by air, Oxford
Economics estimates that in 2009 the travel and tourism industry contributed approximately TOP 33.2
million to the Tongan economy (5.1% of total GDP) and supported 1,800 jobs. In addition to the direct
impact of the industry, these figures include both the indirect and induced impacts of its locally-based
supply chain and the household spending of those employed both directly and indirectly.
Chart 1.7: Travel and tourism’s contribution to
GDP and Employment in Tonga
Source : Oxford Economics
1.2.6 Vanuatu
When only considering the contribution linked to the spending of foreign visitors arriving by air, Oxford
Economics estimates that in 2009 the travel and tourism industry contributed approximately VUV 12.9
billion to the economy of Vanuatu (19.0% of total GDP) and supported 10,900 jobs. In addition to the
direct impact of the industry, these figures include both the indirect and induced impacts of its locally-
based supply chain and the household spending of those employed both directly and indirectly.
Chart 1.8: Travel and tourism’s contribution to
GDP and Employment in Vanuatu
Source : Oxford Economics
10.9 12.9
0
2
4
6
8
10
12
Jobs GDP
0
2
4
6
8
10
12
14
Headcount
'000VUV billion
1.833.2
0.0
0.2
0.4
0.6
0.8
1.0
1.2
1.4
1.6
1.8
2.0
Jobs GDP
0
5
10
15
20
25
30
35
Headcount
'000TOP million
Pacific Ocean Islands report
11
1.3 Catalytic effects – trade
Compared to other modes of transport, air freight is fast and reliable over great distances. However, these
benefits come with a cost attached. Consequently, it is mostly used to deliver goods that are light,
compact, perishable, time sensitive or that have a high unit value.
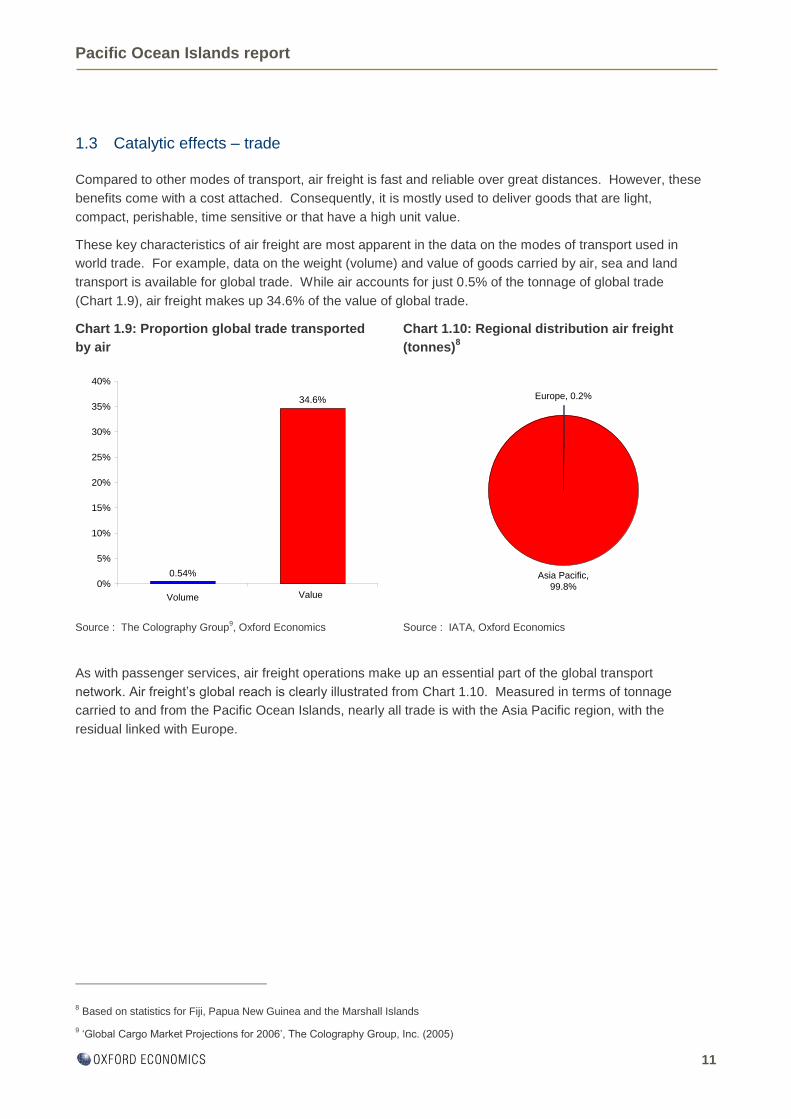
These key characteristics of air freight are most apparent in the data on the modes of transport used in
world trade. For example, data on the weight (volume) and value of goods carried by air, sea and land
transport is available for global trade. While air accounts for just 0.5% of the tonnage of global trade
(Chart 1.9), air freight makes up 34.6% of the value of global trade.
Chart 1.9: Proportion global trade transported
by air
Chart 1.10: Regional distribution air freight
(tonnes)8
Source : The Colography Group9, Oxford Economics Source : IATA, Oxford Economics
As with passenger services, air freight operations make up an essential part of the global transport
network. Air freight‟s global reach is clearly illustrated from Chart 1.10. Measured in terms of tonnage
carried to and from the Pacific Ocean Islands, nearly all trade is with the Asia Pacific region, with the
residual linked with Europe.
8 Based on statistics for Fiji, Papua New Guinea and the Marshall Islands
9 „Global Cargo Market Projections for 2006‟, The Colography Group, Inc. (2005)
0.54%
34.6%
0%
5%
10%
15%
20%
25%
30%
35%
40%
Volume Value
Europe, 0.2%
Asia Pacific,
99.8%
Pacific Ocean Islands report
12
2 Economic footprint
Sections 1 and 2 have looked at the benefits of air transport services for its customers, and the longer-term
benefits that accrue through increasing connectivity. In this section we turn to the domestic resources that
the aviation sector currently deploys to deliver its services, together with the domestic goods and services
consumed by the workers who depend on the sector for their employment. We call the value added and
jobs supported by this economic activity the aviation sector‟s „economic footprint‟.
The resources deployed by the aviation sector are measured by its Gross Value Added (GVA). GVA is
calculated either as the output created by the sector less the cost of purchased inputs (net output
measure), or by the sum of profits and wages (before tax) generated from the sector‟s economic activity
(income measure). The two approaches are equivalent. Using either approach, by adding the GVA of all
firms in the economy, one derives an estimate for the economy‟s overall output (GDP)10
. We refer to this
as the sector‟s direct contribution to GDP.
From this direct contribution, the sector‟s economic footprint is calculated by adding to it the output (and
jobs) supported through two other channels, which we refer to as the indirect and the induced
contributions. The indirect contribution measures the resources deployed by the aviation sector through
using domestically produced goods and services produced by other firms – i.e. the resources used through
its supply chain. The GVA generated through the indirect and direct channels supports jobs both in the
aviation sector and in its supply chain. The workers whose employment depends on this activity in turn
spend their wages on goods and services. The induced contribution is the value of the domestic goods
and services purchased by this workforce. Taken together, these three channels give the aviation sector‟s
economic footprint in terms of GVA and jobs.
The aviation sector contributes to the economy in two other ways. Through the taxes levied on GVA
(recall that it is equal to the sum of profits and wages), the aviation sector supports the public finances, and
the public services that depend on them. Second, through its investment and its use of advanced
technology, the aviation sector generates more GVA per employee than the economy as a whole, raising
the overall productivity of the economy. These issues are discussed at the end of this section.
2.1 The aviation sector and its economic footprint
The sector is comprised of two distinct types of activity:
- Airlines transporting people and freight.
- Ground-based infrastructure that includes the airport facilities, the services provided for
passengers on-site at airports, such as baggage handling, ticketing and retail and catering
services, together with essential services provided off-site, such as air navigation and air
regulation.
The aviation sector supports GDP and the employment in the Pacific Ocean Islands through four distinct
channels. These channels are:
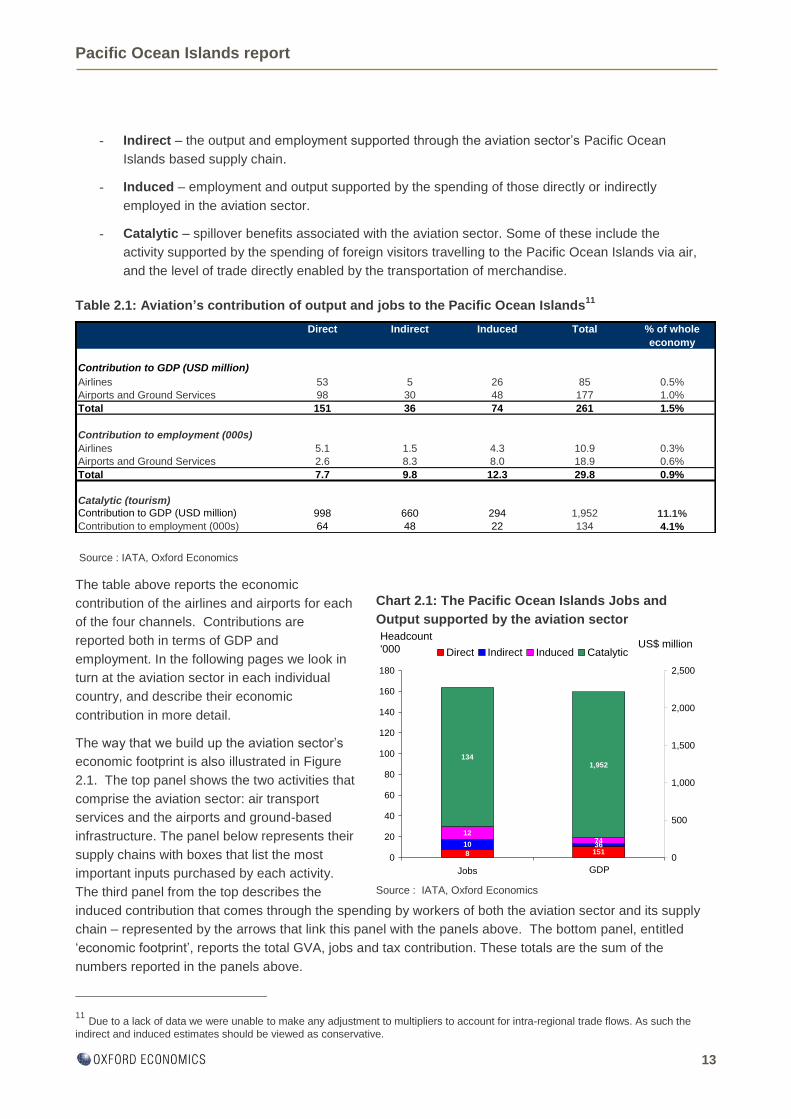
- Direct – the output and employment of the firms in the aviation sector.
10 It is only true to an approximation that GVA is equal to the sum of profit and wages, or that the sum of GVA across firms equals
GDP. The difference in each case, however, is small enough for us to proceed as if the equalities do in fact hold. The differences are explained in the Annex to this report.
Pacific Ocean Islands report
13
- Indirect – the output and employment supported through the aviation sector‟s Pacific Ocean
Islands based supply chain.
- Induced – employment and output supported by the spending of those directly or indirectly
employed in the aviation sector.
- Catalytic – spillover benefits associated with the aviation sector. Some of these include the
activity supported by the spending of foreign visitors travelling to the Pacific Ocean Islands via air,
and the level of trade directly enabled by the transportation of merchandise.
Table 2.1: Aviation’s contribution of output and jobs to the Pacific Ocean Islands11
Source : IATA, Oxford Economics
The table above reports the economic
contribution of the airlines and airports for each
of the four channels. Contributions are
reported both in terms of GDP and
employment. In the following pages we look in
turn at the aviation sector in each individual
country, and describe their economic
contribution in more detail.
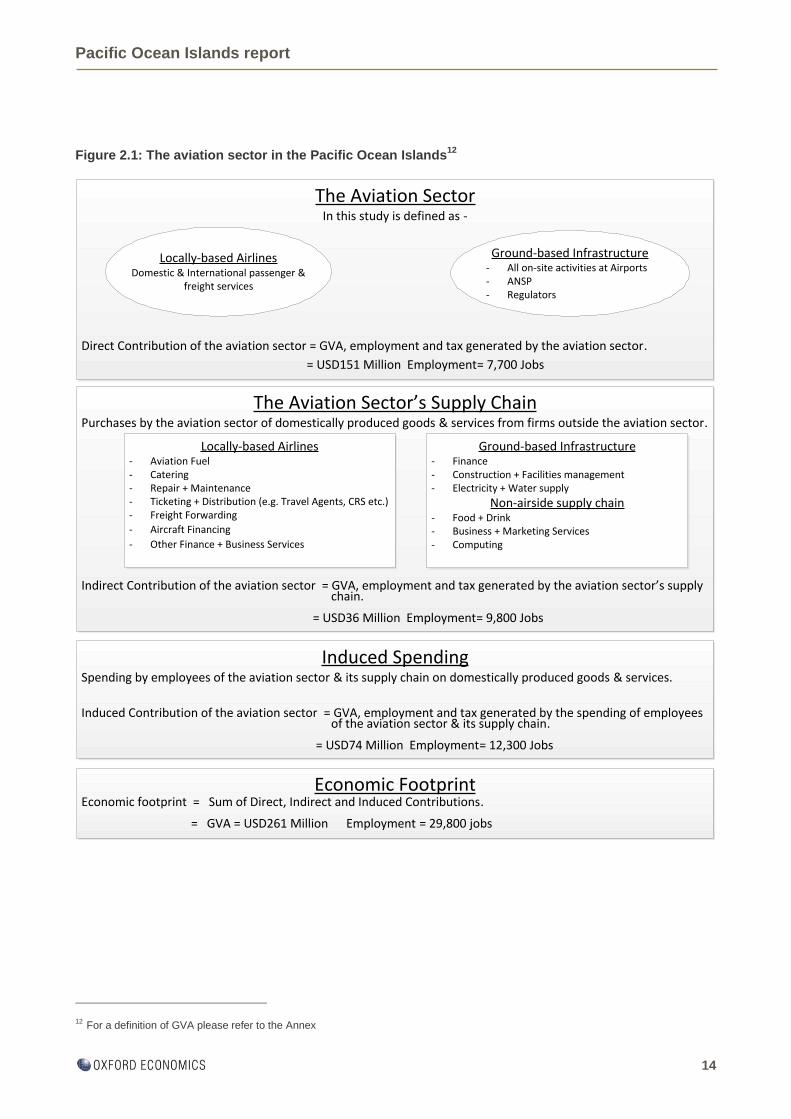
The way that we build up the aviation sector‟s
economic footprint is also illustrated in Figure
2.1. The top panel shows the two activities that
comprise the aviation sector: air transport
services and the airports and ground-based
infrastructure. The panel below represents their
supply chains with boxes that list the most
important inputs purchased by each activity.
The third panel from the top describes the
induced contribution that comes through the spending by workers of both the aviation sector and its supply
chain – represented by the arrows that link this panel with the panels above. The bottom panel, entitled
„economic footprint‟, reports the total GVA, jobs and tax contribution. These totals are the sum of the
numbers reported in the panels above.
11 Due to a lack of data we were unable to make any adjustment to multipliers to account for intra-regional trade flows. As such the
indirect and induced estimates should be viewed as conservative.
Chart 2.1: The Pacific Ocean Islands Jobs and
Output supported by the aviation sector
Source : IATA, Oxford Economics
8
12
134
10151
7436
1,952
0
20
40
60
80
100
120
140
160
180
Jobs
0
500
1,000
1,500
2,000
2,500
Direct Indirect Induced Catalytic
Headcount
'000US$ million
GDP
Direct Indirect Induced Total % of whole
economy
Contribution to GDP (USD million)
Airlines 53 5 26 85 0.5%
Airports and Ground Services 98 30 48 177 1.0%
Total 151 36 74 261 1.5%
Contribution to employment (000s)
Airlines 5.1 1.5 4.3 10.9 0.3%
Airports and Ground Services 2.6 8.3 8.0 18.9 0.6%
Total 7.7 9.8 12.3 29.8 0.9%
Catalytic (tourism)
Contribution to GDP (USD million) 998 660 294 1,952 11.1%
Contribution to employment (000s) 64 48 22 134 4.1%
Pacific Ocean Islands report
14
Figure 2.1: The aviation sector in the Pacific Ocean Islands12
12 For a definition of GVA please refer to the Annex
The Aviation SectorIn this study is defined as -
Locally-based AirlinesDomestic & International passenger &
freight services
Ground-based Infrastructure- All on-site activities at Airports- ANSP- Regulators
Direct Contribution of the aviation sector = GVA, employment and tax generated by the aviation sector.
= USD151 Million Employment= 7,700 Jobs
The Aviation Sector’s Supply ChainPurchases by the aviation sector of domestically produced goods & services from firms outside the aviation sector.
Locally-based Airlines- Aviation Fuel- Catering- Repair + Maintenance- Ticketing + Distribution (e.g. Travel Agents, CRS etc.)- Freight Forwarding
- Aircraft Financing
- Other Finance + Business Services
Ground-based Infrastructure- Finance- Construction + Facilities management - Electricity + Water supply
Non-airside supply chain- Food + Drink- Business + Marketing Services- Computing
Indirect Contribution of the aviation sector = GVA, employment and tax generated by the aviation sector’s supply chain.
= USD36 Million Employment= 9,800 Jobs
Induced SpendingSpending by employees of the aviation sector & its supply chain on domestically produced goods & services.
Induced Contribution of the aviation sector = GVA, employment and tax generated by the spending of employees of the aviation sector & its supply chain.
= USD74 Million Employment= 12,300 Jobs
Economic FootprintEconomic footprint = Sum of Direct, Indirect and Induced Contributions.
= GVA = USD261 Million Employment = 29,800 jobs

Pacific Ocean Islands report
15
2.2 Cook Islands
More than 1,040 scheduled international flights depart the Cook Islands annually, destined for 5 airports
in 4 countries. Domestically, more than 3,500 flights make over 104,000 seats available to passengers
annually, destined to 6 airports.
Among the many reasons that people and businesses use air transport, people rely on it for holidays and
visiting friends and family; while businesses use air transport for meeting clients and for the speedy and
reliable delivery of mail and goods often over great distances. The air transport network, the “Real World
Wide Web”, offers practical, fast and reliable transport across the globe. The regions which travellers fly
to and from underline its global reach (see Chart 2.2).
Airlines need ground-based infrastructure to operate. This infrastructure includes the facilities at
Rarotonga International Airport, the only international airport in the Cook Islands, which directly serve
passengers, such as baggage handling, ticketing, retail and catering outlets. Less visible are the essential
services which are sometimes provided off-site, such as air navigation and air regulation.
Rarotonga International Airport handles approximately 281,000 passengers annually.
Chart 2.2: Regional distribution of scheduled
passenger trips originating in the Cook Islands
Chart 2.3: Jobs and output supported by the
aviation sector in the Cook Islands
Source : IATA Source : IATA, Oxford Economics
Overall, the aviation sector contributes NZD 8.4 million to the economy (3.3% of GDP) and supports
around 260 jobs in the Cook Islands. Included within these figures are the indirect impacts of the
industry‟s locally-based supply chain (including the distribution sector delivering aviation fuel; the catering
sector and the construction industry building or maintaining facilities at airports) and the induced impacts
generated through the household spending of those employed by the sector and its supply chain.
2608.4
0
50
100
150
200
250
300
Jobs GDP
0
1
2
3
4
5
6
7
8
9
Headcount NZD million
Europe, 2%
North America,
5%
Domestic, 20%
Asia and Pacific
Region, 74%
Pacific Ocean Islands report
16
2.3 Fiji
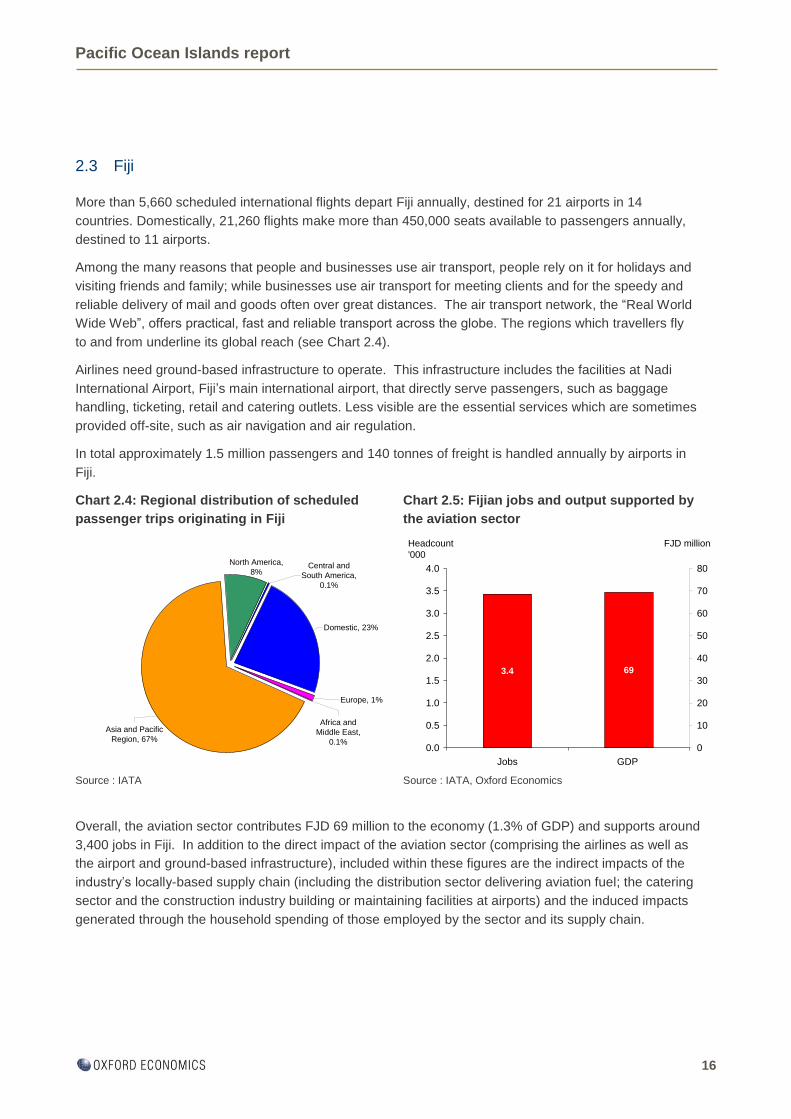
More than 5,660 scheduled international flights depart Fiji annually, destined for 21 airports in 14
countries. Domestically, 21,260 flights make more than 450,000 seats available to passengers annually,
destined to 11 airports.
Among the many reasons that people and businesses use air transport, people rely on it for holidays and
visiting friends and family; while businesses use air transport for meeting clients and for the speedy and
reliable delivery of mail and goods often over great distances. The air transport network, the “Real World
Wide Web”, offers practical, fast and reliable transport across the globe. The regions which travellers fly
to and from underline its global reach (see Chart 2.4).
Airlines need ground-based infrastructure to operate. This infrastructure includes the facilities at Nadi
International Airport, Fiji‟s main international airport, that directly serve passengers, such as baggage
handling, ticketing, retail and catering outlets. Less visible are the essential services which are sometimes
provided off-site, such as air navigation and air regulation.
In total approximately 1.5 million passengers and 140 tonnes of freight is handled annually by airports in
Fiji.
Chart 2.4: Regional distribution of scheduled
passenger trips originating in Fiji
Chart 2.5: Fijian jobs and output supported by
the aviation sector
Source : IATA Source : IATA, Oxford Economics
Overall, the aviation sector contributes FJD 69 million to the economy (1.3% of GDP) and supports around
3,400 jobs in Fiji. In addition to the direct impact of the aviation sector (comprising the airlines as well as
the airport and ground-based infrastructure), included within these figures are the indirect impacts of the
industry‟s locally-based supply chain (including the distribution sector delivering aviation fuel; the catering
sector and the construction industry building or maintaining facilities at airports) and the induced impacts
generated through the household spending of those employed by the sector and its supply chain.
3.4 69
0.0
0.5
1.0
1.5
2.0
2.5
3.0
3.5
4.0
Jobs GDP
0
10
20
30
40
50
60
70
80
Headcount
'000
FJD million
Europe, 1%
Asia and Pacific
Region, 67%
North America,
8%
Africa and
Middle East,
0.1%
Domestic, 23%
Central and
South America,
0.1%
Pacific Ocean Islands report
17
2.4 Guam
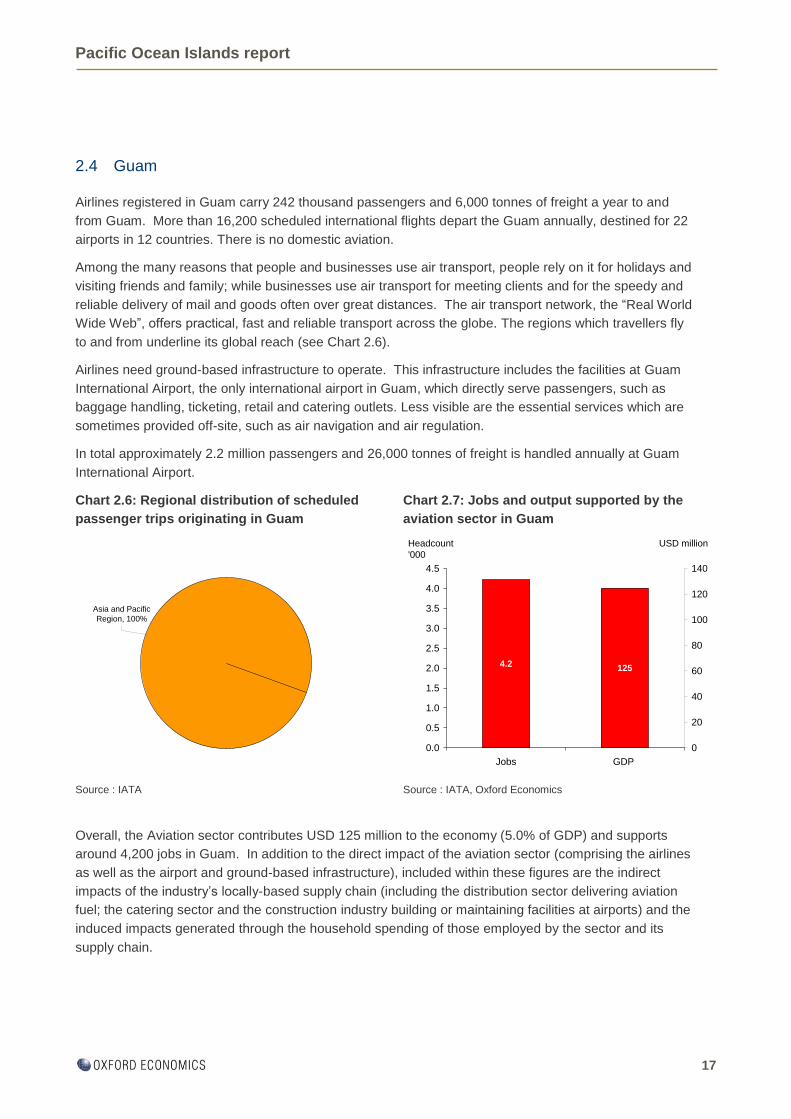
Airlines registered in Guam carry 242 thousand passengers and 6,000 tonnes of freight a year to and
from Guam. More than 16,200 scheduled international flights depart the Guam annually, destined for 22
airports in 12 countries. There is no domestic aviation.
Among the many reasons that people and businesses use air transport, people rely on it for holidays and
visiting friends and family; while businesses use air transport for meeting clients and for the speedy and
reliable delivery of mail and goods often over great distances. The air transport network, the “Real World
Wide Web”, offers practical, fast and reliable transport across the globe. The regions which travellers fly
to and from underline its global reach (see Chart 2.6).
Airlines need ground-based infrastructure to operate. This infrastructure includes the facilities at Guam
International Airport, the only international airport in Guam, which directly serve passengers, such as
baggage handling, ticketing, retail and catering outlets. Less visible are the essential services which are
sometimes provided off-site, such as air navigation and air regulation.
In total approximately 2.2 million passengers and 26,000 tonnes of freight is handled annually at Guam
International Airport.
Chart 2.6: Regional distribution of scheduled
passenger trips originating in Guam
Chart 2.7: Jobs and output supported by the
aviation sector in Guam
Source : IATA Source : IATA, Oxford Economics
Overall, the Aviation sector contributes USD 125 million to the economy (5.0% of GDP) and supports
around 4,200 jobs in Guam. In addition to the direct impact of the aviation sector (comprising the airlines
as well as the airport and ground-based infrastructure), included within these figures are the indirect
impacts of the industry‟s locally-based supply chain (including the distribution sector delivering aviation
fuel; the catering sector and the construction industry building or maintaining facilities at airports) and the
induced impacts generated through the household spending of those employed by the sector and its
supply chain.
Asia and Pacific
Region, 100%
4.2125
0.0
0.5
1.0
1.5
2.0
2.5
3.0
3.5
4.0
4.5
Jobs GDP
0
20
40
60
80
100
120
140
Headcount
'000
USD million
Pacific Ocean Islands report
18
2.5 Kiribati
More than 360 scheduled international flights depart the Kiribati annually, destined for 4 airports in 4
countries. There is no domestic aviation.
Among the many reasons that people and businesses use air transport, people rely on it for holidays and
visiting friends and family; while businesses use air transport for meeting clients and for the speedy and
reliable delivery of mail and goods often over great distances. The air transport network, the “Real World
Wide Web”, offers practical, fast and reliable transport across the globe. The regions which travellers fly
to and from underline its global reach (see Chart 2.8).
Airlines need ground-based infrastructure to operate. This infrastructure includes the facilities at Bonriki
International Airport, the main international airport in Kiribati, which directly serve passengers, such as
baggage handling, ticketing, retail and catering outlets. Less visible are the essential services which are
sometimes provided off-site, such as air navigation and air regulation.
In total approximately 15 thousand passengers are handled annually by airports in Kiribati.
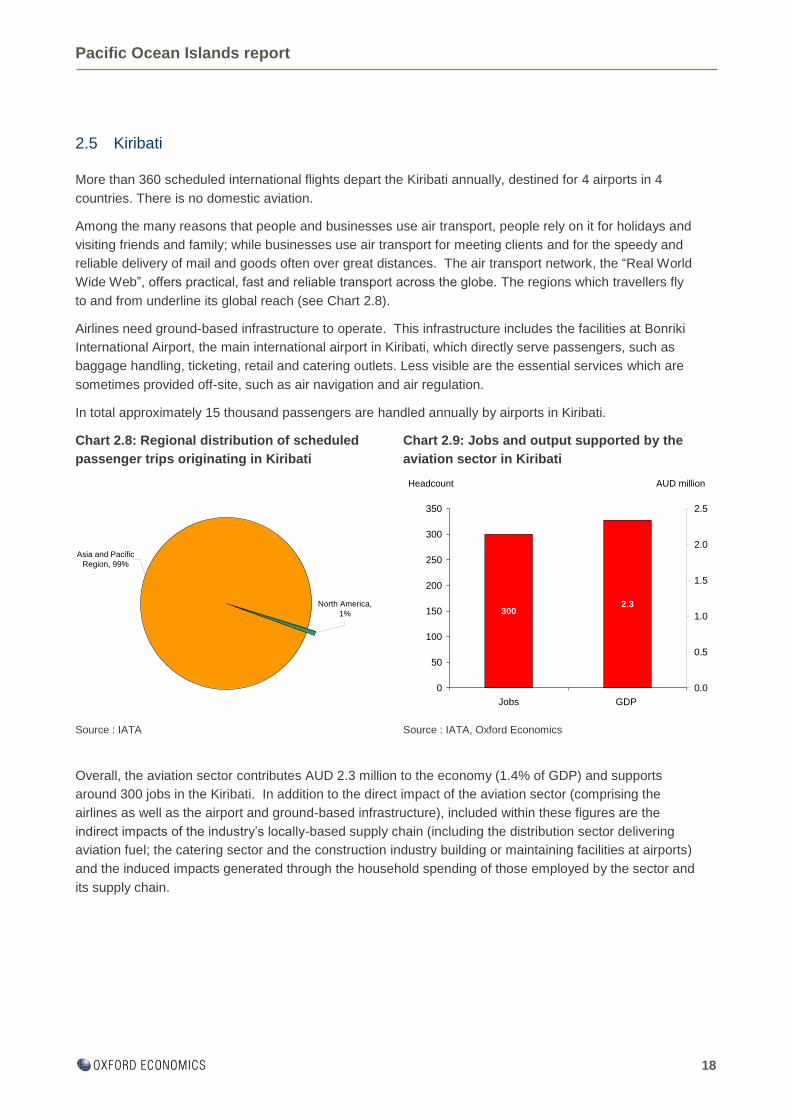
Chart 2.8: Regional distribution of scheduled
passenger trips originating in Kiribati
Chart 2.9: Jobs and output supported by the
aviation sector in Kiribati
Source : IATA Source : IATA, Oxford Economics
Overall, the aviation sector contributes AUD 2.3 million to the economy (1.4% of GDP) and supports
around 300 jobs in the Kiribati. In addition to the direct impact of the aviation sector (comprising the
airlines as well as the airport and ground-based infrastructure), included within these figures are the
indirect impacts of the industry‟s locally-based supply chain (including the distribution sector delivering
aviation fuel; the catering sector and the construction industry building or maintaining facilities at airports)
and the induced impacts generated through the household spending of those employed by the sector and
its supply chain.
3002.3
0
50
100
150
200
250
300
350
Jobs GDP
0.0
0.5
1.0
1.5
2.0
2.5
Headcount AUD million
Asia and Pacific
Region, 99%
North America,
1%

Pacific Ocean Islands report
19
2.6 Marshall Islands
More than 725 scheduled international flights depart the Marshall Islands annually, destined for 4 airports
in 3 countries. Domestically, more than 1,500 flights make over 80,500 seats available to passengers
annually, destined to 7 airports.
Among the many reasons that people and businesses use air transport, people rely on it for holidays and
visiting friends and family; while businesses use air transport for meeting clients and for the speedy and
reliable delivery of mail and goods often over great distances. The air transport network, the “Real World
Wide Web”, offers practical, fast and reliable transport across the globe. The regions which travellers fly
to and from underline its global reach (see Chart 2.10).
Airlines need ground-based infrastructure to operate. This infrastructure includes the facilities at Marshall
Islands International Airport, the only international airport in the Marshall Islands, which directly serve
passengers, such as baggage handling, ticketing, retail and catering outlets. Less visible are the essential
services which are sometimes provided off-site, such as air navigation and air regulation.
In total approximately 96 thousand passengers and 59,000 tonnes of freight is handled annually at
Marshall Islands International Airport.
Chart 2.10: Regional distribution of scheduled
passenger trips originating in the Marshall
Islands
Chart 2.11: Jobs and output supported by the
aviation sector in the Marshall Islands
Source : IATA Source : IATA, Oxford Economics
Overall, the Aviation sector contributes USD 2.6 million to the economy (1.3% of GDP) and supports
around 310 jobs in the Marshall Islands. In addition to the direct impact of the aviation sector (comprising
the airlines as well as the airport and ground-based infrastructure), included within these figures are the
indirect impacts of the industry‟s locally-based supply chain (including the distribution sector delivering
aviation fuel; the catering sector and the construction industry building or maintaining facilities at airports)
and the induced impacts generated through the household spending of those employed by the sector and
its supply chain.
Asia and Pacific
Region, 42%
Domestic, 23%
North America,
35%
310 2.6
0
50
100
150
200
250
300
350
Jobs GDP
0.0
0.5
1.0
1.5
2.0
2.5
3.0
Headcount USD millions
Pacific Ocean Islands report
20
2.7 Micronesia
More than 1,090 scheduled international flights depart Micronesia annually, destined for 4 airports in 3
countries. Domestically, more than 880 flights make over 138,780 seats available to passengers
annually, destined to 3 airports.
Among the many reasons that people and businesses use air transport, people rely on it for holidays and
visiting friends and family; while businesses use air transport for meeting clients and for the speedy and
reliable delivery of mail and goods often over great distances. The air transport network, the “Real World
Wide Web”, offers practical, fast and reliable transport across the globe. The regions which travellers fly
to and from underline its global reach (see Chart 2.12).
Airlines need ground-based infrastructure to operate. This infrastructure includes the facilities at Pohnpei
International Airport, Micronesia‟s main international airport, which directly serve passengers, such as
baggage handling, ticketing, retail and catering outlets. Less visible are the essential services which are
sometimes provided off-site, such as air navigation and air regulation.
In total approximately 174 thousand passengers and 2,000 tonnes of freight is handled annually by
airports in Micronesia.
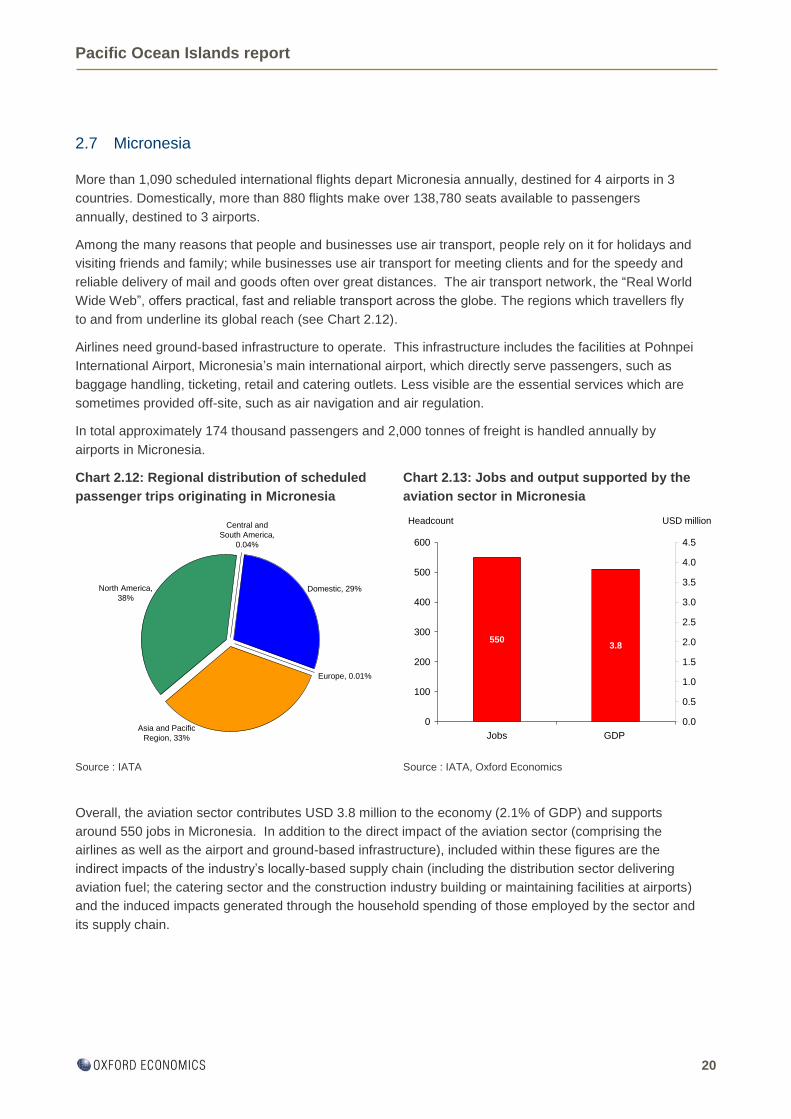
Chart 2.12: Regional distribution of scheduled
passenger trips originating in Micronesia
Chart 2.13: Jobs and output supported by the
aviation sector in Micronesia
Source : IATA Source : IATA, Oxford Economics
Overall, the aviation sector contributes USD 3.8 million to the economy (2.1% of GDP) and supports
around 550 jobs in Micronesia. In addition to the direct impact of the aviation sector (comprising the
airlines as well as the airport and ground-based infrastructure), included within these figures are the
indirect impacts of the industry‟s locally-based supply chain (including the distribution sector delivering
aviation fuel; the catering sector and the construction industry building or maintaining facilities at airports)
and the induced impacts generated through the household spending of those employed by the sector and
its supply chain.
Europe, 0.01%
North America,
38%
Central and
South America,
0.04%
Asia and Pacific
Region, 33%
Domestic, 29%
5503.8
0
100
200
300
400
500
600
Jobs GDP
0.0
0.5
1.0
1.5
2.0
2.5
3.0
3.5
4.0
4.5
Headcount USD million
Pacific Ocean Islands report
21
2.8 Papua New Guinea
More than 3,000 scheduled international flights depart the Papua New Guinea annually, destined for 9
airports in 7 countries. Domestically, more than 38,740 flights make over 2.1 million seats available to
passengers annually, destined to 38 airports.
Among the many reasons that people and businesses use air transport, people rely on it for holidays and
visiting friends and family; while businesses use air transport for meeting clients and for the speedy and
reliable delivery of mail and goods often over great distances. The air transport network, the “Real World
Wide Web”, offers practical, fast and reliable transport across the globe. The regions which travellers fly
to and from underline its global reach (see Chart 2.14).
Airlines need ground-based infrastructure to operate. This infrastructure includes the facilities at Jacksons
International Airport, the only international airport in Papua New Guinea, that directly serve passengers,
such as baggage handling, ticketing, retail and catering outlets. Less visible are the essential services
which are sometimes provided off-site, such as air navigation and air regulation.
In total approximately 1.4 million passengers and 100 tonnes of freight is handled annually at Jacksons
International Airport.
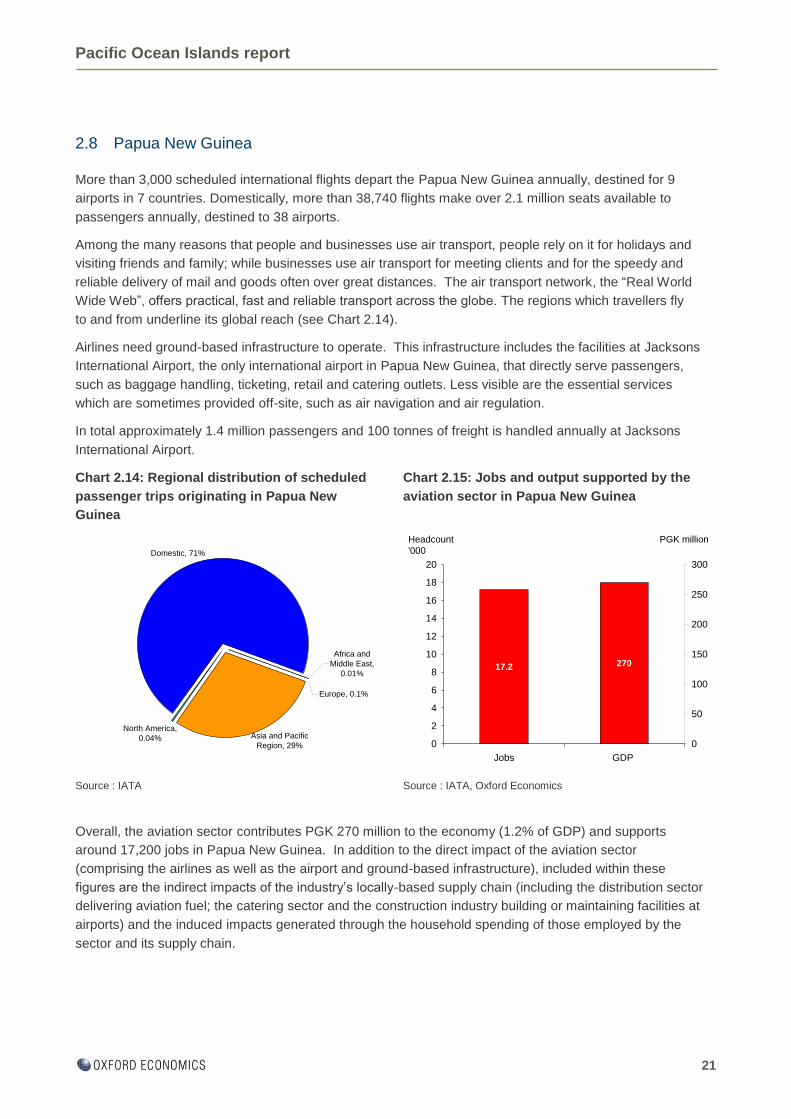
Chart 2.14: Regional distribution of scheduled
passenger trips originating in Papua New
Guinea
Chart 2.15: Jobs and output supported by the
aviation sector in Papua New Guinea
Source : IATA Source : IATA, Oxford Economics
Overall, the aviation sector contributes PGK 270 million to the economy (1.2% of GDP) and supports
around 17,200 jobs in Papua New Guinea. In addition to the direct impact of the aviation sector
(comprising the airlines as well as the airport and ground-based infrastructure), included within these
figures are the indirect impacts of the industry‟s locally-based supply chain (including the distribution sector
delivering aviation fuel; the catering sector and the construction industry building or maintaining facilities at
airports) and the induced impacts generated through the household spending of those employed by the
sector and its supply chain.
17.2 270
0
2
4
6
8
10
12
14
16
18
20
Jobs GDP
0
50
100
150
200
250
300
Headcount
'000
PGK million
Europe, 0.1%
Asia and Pacific
Region, 29%
North America,
0.04%
Africa and
Middle East,
0.01%
Domestic, 71%
Pacific Ocean Islands report
22
2.9 Samoa
More than 3,270 scheduled international flights depart the Samoa annually, destined for 8 airports in 5
countries. Domestically, more than 310 flights make over 5,920 seats available to passengers annually,
destined to 3 airports.
Among the many reasons that people and businesses use air transport, people rely on it for holidays and
visiting friends and family; while businesses use air transport for meeting clients and for the speedy and
reliable delivery of mail and goods often over great distances. The air transport network, the “Real World
Wide Web”, offers practical, fast and reliable transport across the globe. The regions which travellers fly
to and from underline its global reach (see Chart 2.16).
Airlines need ground-based infrastructure to operate. This infrastructure includes the facilities at Faleolo
International Airport, Samoa‟s only international airport, which directly serve passengers, such as baggage
handling, ticketing, retail and catering outlets. Less visible are the essential services which are sometimes
provided off-site, such as air navigation and air regulation.
In total approximately 171 thousand passengers and 1,200 tonnes of freight is handled annually at
Faleolo International Airport.
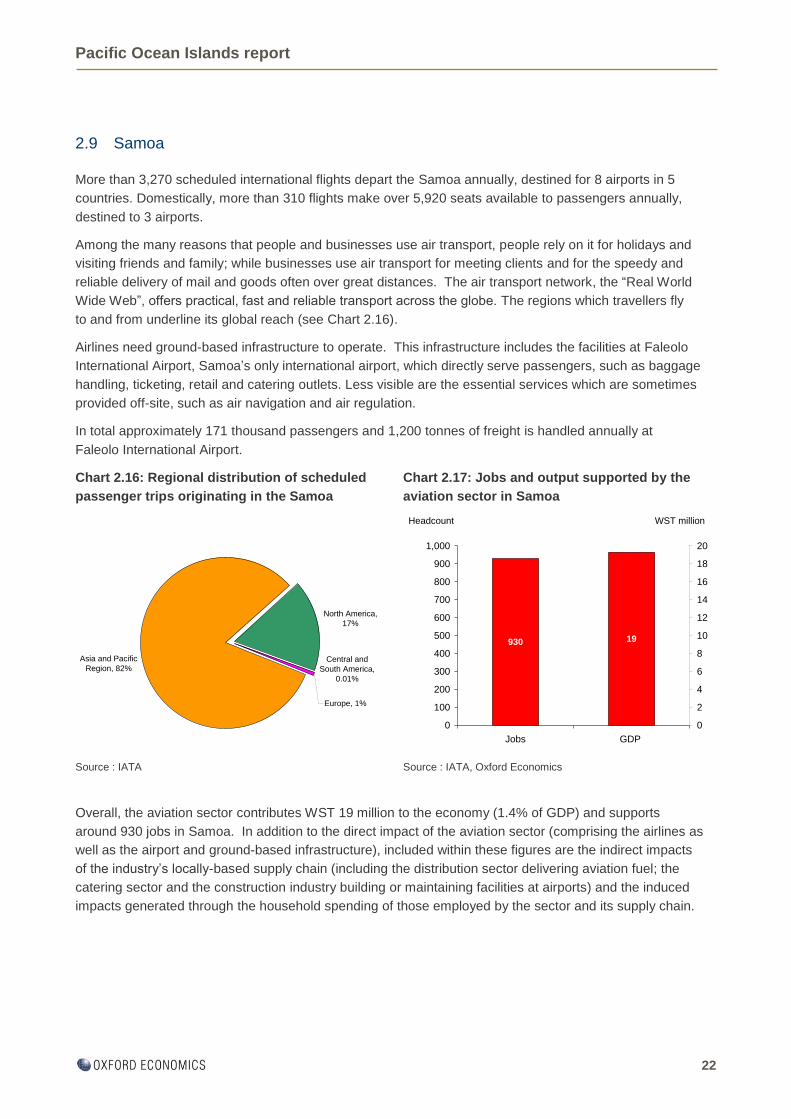
Chart 2.16: Regional distribution of scheduled
passenger trips originating in the Samoa
Chart 2.17: Jobs and output supported by the
aviation sector in Samoa
Source : IATA Source : IATA, Oxford Economics
Overall, the aviation sector contributes WST 19 million to the economy (1.4% of GDP) and supports
around 930 jobs in Samoa. In addition to the direct impact of the aviation sector (comprising the airlines as
well as the airport and ground-based infrastructure), included within these figures are the indirect impacts
of the industry‟s locally-based supply chain (including the distribution sector delivering aviation fuel; the
catering sector and the construction industry building or maintaining facilities at airports) and the induced
impacts generated through the household spending of those employed by the sector and its supply chain.
930 19
0
100
200
300
400
500
600
700
800
900
1,000
Jobs GDP
0
2
4
6
8
10
12
14
16
18
20
Headcount WST million
Europe, 1%
North America,
17%
Central and
South America,
0.01%
Asia and Pacific
Region, 82%
Pacific Ocean Islands report
23
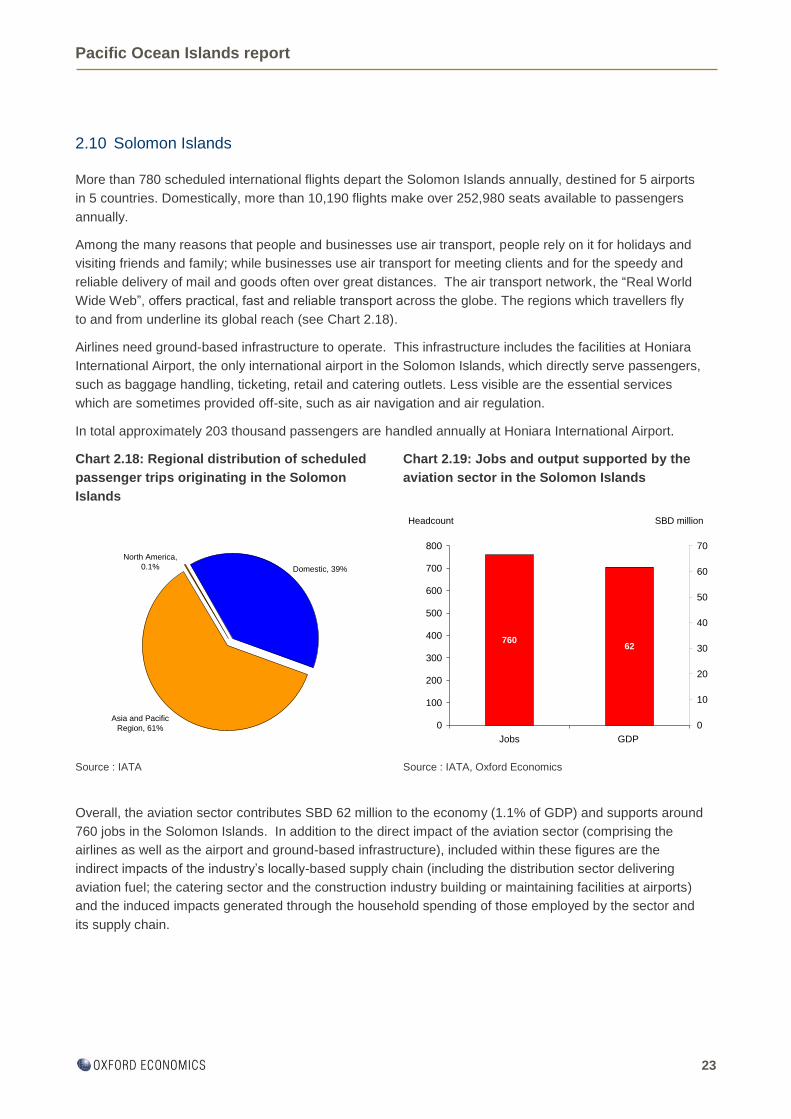
2.10 Solomon Islands
More than 780 scheduled international flights depart the Solomon Islands annually, destined for 5 airports
in 5 countries. Domestically, more than 10,190 flights make over 252,980 seats available to passengers
annually.
Among the many reasons that people and businesses use air transport, people rely on it for holidays and
visiting friends and family; while businesses use air transport for meeting clients and for the speedy and
reliable delivery of mail and goods often over great distances. The air transport network, the “Real World
Wide Web”, offers practical, fast and reliable transport across the globe. The regions which travellers fly
to and from underline its global reach (see Chart 2.18).
Airlines need ground-based infrastructure to operate. This infrastructure includes the facilities at Honiara
International Airport, the only international airport in the Solomon Islands, which directly serve passengers,
such as baggage handling, ticketing, retail and catering outlets. Less visible are the essential services
which are sometimes provided off-site, such as air navigation and air regulation.
In total approximately 203 thousand passengers are handled annually at Honiara International Airport.
Chart 2.18: Regional distribution of scheduled
passenger trips originating in the Solomon
Islands
Chart 2.19: Jobs and output supported by the
aviation sector in the Solomon Islands
Source : IATA Source : IATA, Oxford Economics
Overall, the aviation sector contributes SBD 62 million to the economy (1.1% of GDP) and supports around
760 jobs in the Solomon Islands. In addition to the direct impact of the aviation sector (comprising the
airlines as well as the airport and ground-based infrastructure), included within these figures are the
indirect impacts of the industry‟s locally-based supply chain (including the distribution sector delivering
aviation fuel; the catering sector and the construction industry building or maintaining facilities at airports)
and the induced impacts generated through the household spending of those employed by the sector and
its supply chain.
76062
0
100
200
300
400
500
600
700
800
Jobs GDP
0
10
20
30
40
50
60
70
Headcount SBD million
Asia and Pacific
Region, 61%
Domestic, 39%
North America,
0.1%
Pacific Ocean Islands report
24
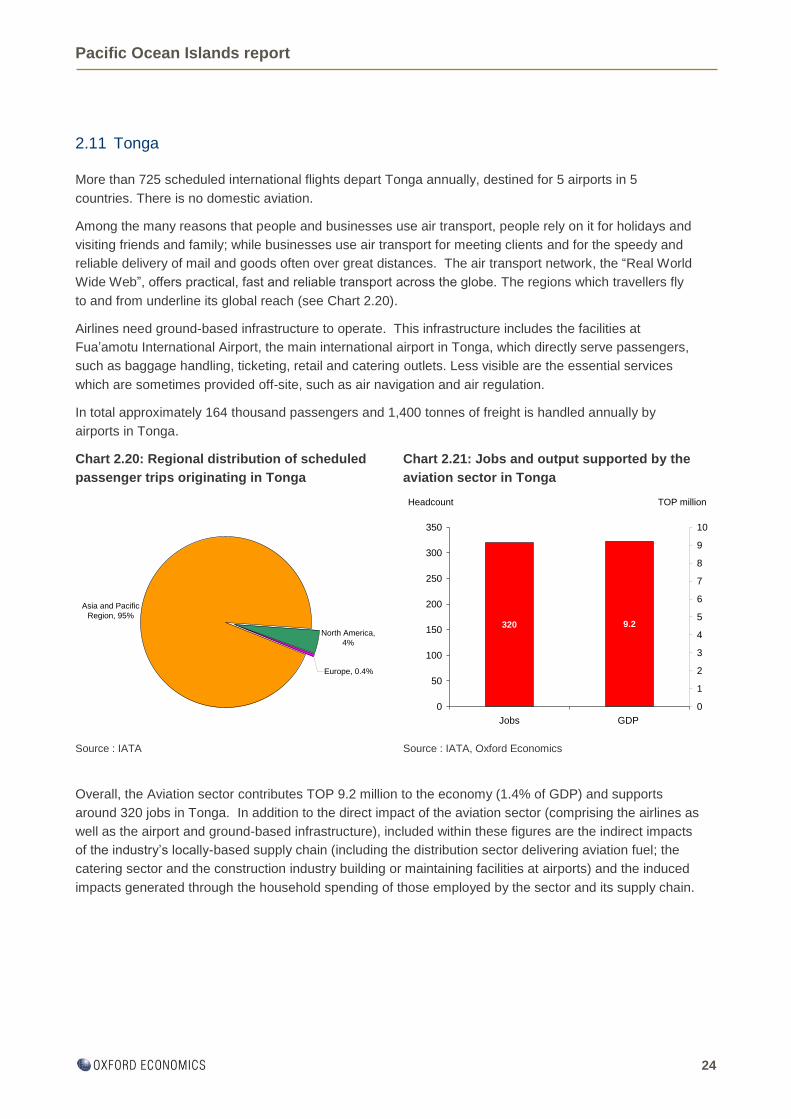
2.11 Tonga
More than 725 scheduled international flights depart Tonga annually, destined for 5 airports in 5
countries. There is no domestic aviation.
Among the many reasons that people and businesses use air transport, people rely on it for holidays and
visiting friends and family; while businesses use air transport for meeting clients and for the speedy and
reliable delivery of mail and goods often over great distances. The air transport network, the “Real World
Wide Web”, offers practical, fast and reliable transport across the globe. The regions which travellers fly
to and from underline its global reach (see Chart 2.20).
Airlines need ground-based infrastructure to operate. This infrastructure includes the facilities at
Fua‟amotu International Airport, the main international airport in Tonga, which directly serve passengers,
such as baggage handling, ticketing, retail and catering outlets. Less visible are the essential services
which are sometimes provided off-site, such as air navigation and air regulation.
In total approximately 164 thousand passengers and 1,400 tonnes of freight is handled annually by
airports in Tonga.
Chart 2.20: Regional distribution of scheduled
passenger trips originating in Tonga
Chart 2.21: Jobs and output supported by the
aviation sector in Tonga
Source : IATA Source : IATA, Oxford Economics
Overall, the Aviation sector contributes TOP 9.2 million to the economy (1.4% of GDP) and supports
around 320 jobs in Tonga. In addition to the direct impact of the aviation sector (comprising the airlines as
well as the airport and ground-based infrastructure), included within these figures are the indirect impacts
of the industry‟s locally-based supply chain (including the distribution sector delivering aviation fuel; the
catering sector and the construction industry building or maintaining facilities at airports) and the induced
impacts generated through the household spending of those employed by the sector and its supply chain.
320 9.2
0
50
100
150
200
250
300
350
Jobs GDP
0
1
2
3
4
5
6
7
8
9
10
Headcount TOP million
Europe, 0.4%
North America,
4%
Asia and Pacific
Region, 95%

Pacific Ocean Islands report
25
2.12 Tuvalu
More than 100 scheduled international flights depart the Tuvalu annually, destined for one airport in one
country. There is no domestic aviation.
Among the many reasons that people and businesses use air transport, people rely on it for holidays and
visiting friends and family; while businesses use air transport for meeting clients and for the speedy and
reliable delivery of mail and goods often over great distances. The air transport network, the “Real World
Wide Web”, offers practical, fast and reliable transport across the globe. The regions which travellers fly
to and from underline its global reach (see Chart 2.22).
Airlines need ground-based infrastructure to operate. This infrastructure includes the facilities at Funafuti
International Airport, the only international airport in Tuvalu, that directly serve passengers, such as
baggage handling, ticketing, retail and catering outlets. Less visible are the essential services which are
sometimes provided off-site, such as air navigation and air regulation.
In total approximately 7 thousand passengers are handled annually at Funafuti International Airport.
Chart 2.22: Regional distribution of scheduled
passenger trips originating in the Tuvalu
Chart 2.23: Jobs and output supported by the
aviation sector in the Tuvalu
Source : IATA Source : IATA, Oxford Economics
Overall, the Aviation sector contributes AUD 5.7 million to the economy (13.4% of GDP) and supports
around 310 jobs in Tuvalu. In addition to the direct impact of the aviation sector (comprising the airlines as
well as the airport and ground-based infrastructure), included within these figures are the indirect impacts
of the industry‟s locally-based supply chain (including the distribution sector delivering aviation fuel; the
catering sector and the construction industry building or maintaining facilities at airports) and the induced
impacts generated through the household spending of those employed by the sector and its supply chain.
3105.7
0
50
100
150
200
250
300
350
Jobs GDP
0
1
2
3
4
5
6
Headcount AUD million
Asia and Pacific
Region, 100%

Pacific Ocean Islands report
26
2.13 Vanuatu
More than 1,400 scheduled international flights depart the Vanuatu annually, destined for 6 airports in 4
countries. Domestically, more than 14,800 flights make over 330,300 seats available to passengers
annually.
Among the many reasons that people and businesses use air transport, people rely on it for holidays and
visiting friends and family; while businesses use air transport for meeting clients and for the speedy and
reliable delivery of mail and goods often over great distances. The air transport network, the “Real World
Wide Web”, offers practical, fast and reliable transport across the globe. The regions which travellers fly
to and from underline its global reach (see Chart 2.24).
Airlines need ground-based infrastructure to operate. This infrastructure includes the facilities at
Bauerfield International Airport, Vanuatu‟s main international airport, that directly serve passengers, such
as baggage handling, ticketing, retail and catering outlets. Less visible are the essential services which are
sometimes provided off-site, such as air navigation and air regulation.
In total approximately 418 thousand passengers and 1,400 tonnes of freight is handled annually at
airports in Vanuatu.
Chart 2.24: Regional distribution of scheduled
passenger trips originating in the Vanuatu
Chart 2.25: Jobs and output supported by the
aviation sector in the Vanuatu
Source : IATA Source : IATA, Oxford Economics
Overall, the aviation sector contributes VUV 1.4 billion to the economy (2.0% of GDP) and supports around
1,200 jobs in Vanuatu. In addition to the direct impact of the aviation sector (comprising the airlines as well
as the airport and ground-based infrastructure), included within these figures are the indirect impacts of the
industry‟s locally-based supply chain (including the distribution sector delivering aviation fuel; the catering
sector and the construction industry building or maintaining facilities at airports) and the induced impacts
generated through the household spending of those employed by the sector and its supply chain.
1.2 1,380
0.0
0.2
0.4
0.6
0.8
1.0
1.2
1.4
Jobs GDP
0
200
400
600
800
1,000
1,200
1,400
1,600
Headcount
'000VUV million
Europe, 0.1%
North America,
0.1% Domestic, 40%
Asia and Pacific
Region, 60%
Pacific Ocean Islands report
27
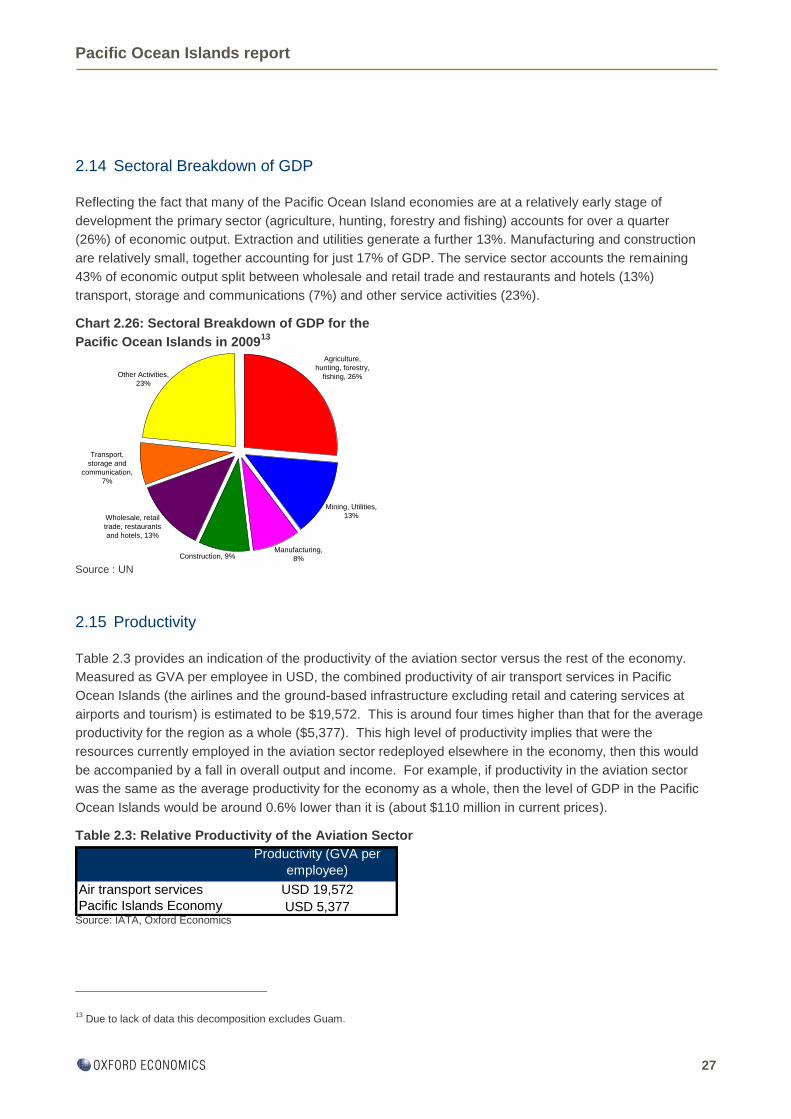
2.14 Sectoral Breakdown of GDP
Reflecting the fact that many of the Pacific Ocean Island economies are at a relatively early stage of
development the primary sector (agriculture, hunting, forestry and fishing) accounts for over a quarter
(26%) of economic output. Extraction and utilities generate a further 13%. Manufacturing and construction
are relatively small, together accounting for just 17% of GDP. The service sector accounts the remaining
43% of economic output split between wholesale and retail trade and restaurants and hotels (13%)
transport, storage and communications (7%) and other service activities (23%).
Chart 2.26: Sectoral Breakdown of GDP for the
Pacific Ocean Islands in 200913
Source : UN
2.15 Productivity
Table 2.3 provides an indication of the productivity of the aviation sector versus the rest of the economy.
Measured as GVA per employee in USD, the combined productivity of air transport services in Pacific
Ocean Islands (the airlines and the ground-based infrastructure excluding retail and catering services at
airports and tourism) is estimated to be $19,572. This is around four times higher than that for the average
productivity for the region as a whole ($5,377). This high level of productivity implies that were the
resources currently employed in the aviation sector redeployed elsewhere in the economy, then this would
be accompanied by a fall in overall output and income. For example, if productivity in the aviation sector
was the same as the average productivity for the economy as a whole, then the level of GDP in the Pacific
Ocean Islands would be around 0.6% lower than it is (about $110 million in current prices).
Table 2.3: Relative Productivity of the Aviation Sector
Source: IATA, Oxford Economics
13 Due to lack of data this decomposition excludes Guam.
Productivity (GVA per
employee)
Air transport services USD 19,572
Pacific Islands Economy USD 5,377
Agriculture,
hunting, forestry,
fishing, 26%
Manufacturing,
8%
Wholesale, retail
trade, restaurants
and hotels, 13%
Other Activities,
23%
Transport,
storage and
communication,
7%
Construction, 9%
Mining, Utilities,
13%
Pacific Ocean Islands report
28
3 Conclusion
This study has described and quantified a number of channels through which aviation in the Pacific Ocean
Islands region generates important economic benefits for its customers and the wider economy.
Studies of this kind usually focus on the „economic footprint‟ of the industry, the GDP and jobs supported
by the industry and its supply chain. We provide the latest estimates for these metrics. But the economic
value created by the industry is more than that. It is not just jobs that are threatened if government policies
are badly designed. The welfare of voting citizens and the effectiveness of infrastructure critical to the
country‟s long-term success are also at risk.
The study has also shown what a critical asset the air transport network is in the Pacific Ocean Islands, to
business and the wider economy. Connectivity between cities and markets boosts productivity and
provides a key infrastructure on which modern globalized businesses depend. Many of these city-pair
connections are dependent on hub airports through which to generate the traffic density necessary to
sustain them. All airlines supplying services at The Pacific Ocean Islands airports contribute to generating
these wider economic benefits, primarily through boosting the tourism sector. These „supply-side‟ benefits
are hard to measure but are easily illustrated by the experience of the volcanic ash cloud, which closed
much of European airspace for a week in early 2010. Travellers were stranded. Globalized supply chains
and just-in-time manufacturing processes came to a halt.
More readily measured is the „economic footprint‟ supported, mostly, by the activities of national airlines.
Domestic-based airlines were responsible for carrying approximately 45% of both passengers and freight.
The wages, profits and tax revenues created by these airlines flows through the domestic economy,
generating multiplier effects on national income or GDP. The economic benefits for the Pacific Ocean
Islands region created by non-domestic airlines are to be found in customer welfare and in the part these
airlines play in providing the connectivity infrastructure between the Pacific Ocean Islands and overseas
cities and markets.
Aviation has a significant footprint in the economies of the Pacific Ocean Islands region, supporting 1.5%
of GDP and 29,800 jobs or 0.9% of the regional workforce. Moreover, the catalytic effect of aviation-
supported tourism generates an additional $1,952 million (11.1% of GDP) and 133,800 jobs.
Also significant is the fact that these are high productivity jobs. The annual value added (or GVA) by each
employee in air transport services in the Pacific Ocean Islands region is $19,572, almost four times higher
than the average of $5,377.
All together these points demonstrate that aviation provides significant economic benefits to the economies
of the Pacific Ocean Islands and its citizens, some of which are unique and essential to the operation of
modern economies.
Pacific Ocean Islands report
29
Annex: Our methods
Connectivity Index
The connectivity index is a measure of the quality of a country‟s air transport network that reflects both the
volume of passenger traffic and the importance of the destinations served. For every destination country for
which there are direct services, an estimate of total passenger seat capacity is derived from data on the
frequencies of service and the available seats per flight. From this underlying data, an index is constructed
by attaching a weight to each destination. This weight reflects the relative importance of the destination in
the global air transport network, measured by the number of seats available for passengers from that airport
relative to Atlanta, the largest airport. The connectivity index will therefore have a higher value, the more
destinations are served, the higher the frequency of services, the larger the number of available seats per
flight and the greater the relative importance of the destinations served.
Benefits to tourism
In quantifying the benefits from Travel & Tourism (T&T) we were seeking to capture the spending by tourists
and businesses on accommodation, food etc outside of their airfare (which forms part of our estimate of the
direct calculation). In doing this we relied heavily on the Oxford Economics Travel & Tourism model
prepared on behalf of the World Travel & Tourism Council (WTTC) which simulates Tourism Satellite
Account (TSA) data across over 180 countries. From the model we obtained an estimate of the level of
value-added created by foreign visitors, and assigned a share of this to the aviation industry based on the
share of foreign visitor arrivals travelling by air. We then used coefficients within the model to divide this
between T&T providers (direct) and their supply chain (indirect). Finally, we attributed a share of the total
induced effect to the aviation industry by dividing our estimates of aviation-related direct and indirect GDP
by total T&T direct and indirect GDP. It should be noted that this is a gross measure of the benefit from
tourism and therefore does not account for the spending which is effectively “lost” when domestic residents
travel abroad by air.
Economic footprint
In Section 3 we report the contribution that the aviation sector makes to the economy. The contribution is
measured in terms of the value of the sector‟s output and the number of people it employs. For each
measure, the contribution is built up from three components: direct, indirect, and induced.
The direct output component is measured by Gross Value Added (GVA). GVA is measured either as the
firm or industry sales revenue less purchases from other companies, or equivalently, as the sum of
employee compensation and gross operating surplus, measured before the deduction of depreciation,
interest charges and taxation. In this report we treat gross operating surplus as equivalent to gross
operating profit, however, the two concepts differ slightly with the former including income from land and a
technical adjustment for the change in stock valuation. GVA differs from Gross Domestic Product (GDP) in
the price used to value goods and services. GVA is measured at producer prices that reflect the price at the
„factory gate‟ together with cost of distribution. GDP is measured at market prices that reflect the price paid
by the consumer. The two prices differ by the taxes less subsidies levied on the goods or services.
The indirect output component is measured using an Input-Output table that reports how industries use the
output of other industries in the process of production, and how their final output is used, e.g. in final
domestic consumption, changes in stocks or exports. For many countries, Input-Output tables are available
as part of the national accounts. As Input-Output tables describe how an industry uses the output of other

Pacific Ocean Islands report
30
industries as inputs in the production of its goods or service, they describe its full supply chain – its direct
suppliers, those industries that supply its direct suppliers, and so on. This is reported as the indirect output
component.
The Input-Output table reports how much of final output is sold in the domestic economy. Using similar
methods as that used to derive the indirect output component, the Input-Output table can be used to
estimate how much spending on completed goods (known as final domestic consumption) is supported
through the employees of the industry and its full supply chain. This is reported as the induced output
component. Based on analysis at Oxford Economics, the ratio of induced output to the sum of direct and
indirect output is capped at 30%. The three output components – direct, indirect, and induced – are
converted to their respective employment components, using an estimate for the average labour
productivity (GVA per employee) for the economy.
Exchange rates
For the purposes of presenting consolidated figures in USD, the following 2009 annual average exchange
rates have been applied where appropriate:
NZD-USD: 1.39 FJD-USD: 1.96 AUD-USD: 1.28 PGK-USD 2.76
WST-USD: 2.49 SBD-USD: 8.06 TOP-USD: 2.03 VUV-USD: 106.74
Passenger and freight volumes
Passenger and freight traffic is accounted for in different ways across the industry supply chain, depending
on the focus of the operator and the purpose of analysis. For example, airlines generally count the number
of passengers who board their aircraft, whereas airports often count the number of passengers arriving or
departing their airport – which in some cases can lead to totals significantly larger than those reported by
airlines, despite referring to the same inherent volume of passengers. The table below outlines the main
passenger and freight volumes referred to in this report. In particular, it shows how the numbers used in the
calculation of consumer benefit and the economic footprint were derived.
Pacific Island Nations
Domestic passengers
(Thousands) (A)
International passengers
(Thousands) (B)
Total passengers 2009
(Thousands) (C)
Number of passengers carried by
National carriers (D)
Freight Tonnes
2009 (E)
Papua New Guinea 967 400 1,367 1,229,999 109
Fiji 370 1,177 1,547 797,924 137(*)
Vanuatu 163 254 418 271,688 1,356
Solomon Islands 79 124 203 119,489 n.a
Cook Islands 54 227 281 35,911 n.a
Marshall Islands 19 77 96 10,930 59,027(*)
Micronesia 35 138 174 n.a 2,061
Tonga - 164 164 n.a 1,372
Kiribati - 15 15 n.a n.a
Tuvalu - 7 7 n.a n.a
Guam 79 2,165 2,244 1,172,372 25,568
Samoa 2 168 171 33,314 1,175
*Year 2010
Use in report Source
ANumber of passengers on aircraft flying
within the Island
Airline Domestic passenger traffic associated with
the Island market.PaxIS
BNumber of passengers on aircraft flying
to and from the Island
Airline International passenger traffic associated
with the Island market.PaxIS
CNumber of passengers on aircraft flying
to, from and within the Island
Overall indicator of airline passenger traffic
associated with the Island market.PaxIS
DPassengers carried by National
registered airlines
Overall indicator of passenger output „performed‟ by
airlines in the scope of the economic footprint
analysis in Section 3 of this report
PaxIS
Use in report Source
ETonnes of freight carried on aircraft
flying to, from and within the Island
Overall indicator of freight loaded and unloaded at
airports in the Island.ACI / IATA AIF Freight Route
Passenger measure (Thousands)
Freight measure (Tonnes)

OXFORD
Abbey House, 121 St Aldates
Oxford, OX1 1HB, UK
Tel: +44 1865 268900
LONDON
Broadwall House, 21 Broadwall
London, SE1 9PL, UK
Tel: +44 207 803 1400
BELFAST
Lagan House, Sackville Street
Lisburn, BT27 4AB, UK
Tel: +44 28 9266 0669
NEW YORK
817 Broadway, 10th Floor
New York, NY 10003, USA
Tel: +1 646 786 1863
PHILADELPHIA
303 Lancaster Avenue, Suite 1b
Wayne PA 19087, USA
Tel: +1 610 995 9600
SINGAPORE
No.1 North Bridge Road
High Street Centre #22-07
Singapore 179094
Tel: +65 6338 1235
PARIS
9 rue Huysmans
75006 Paris, France
Tel: + 33 6 79 900 846
email: [email protected]
www.oxfordeconomics.com