economic benefits from air transport in … · table es1: economic benefits from air transport in...
TRANSCRIPT
ECONOMIC BENEFITS FROM AIR TRANSPORT IN PERU

IATA Economics - www.iata.org/economics - ECONOMIC BENEFITS FROM AIR TRANSPORT IN PERU - October 2009
EXECUTIVE SUMMARYAir transport in Peru has played an important role in facilitating the country’s economic growth, which was very strong • until the global recession hit the economy this year. From 2002 to 2008 passenger numbers almost doubled, which is twice the expansion of Peru’s GDP over that period. During the period of 9-10% economic growth in 2007-8 air transport was one of Peru’s fastest growing sectors.
Air transport directly contributes to the country’s GDP by generating wages, profits and tax payments and supports • further jobs and value-added through its supply chain. More importantly it is a key infrastructure asset for the economy – connecting businesses and people to key overseas markets and suppliers - facilitating the broadening of Peru’s economy from a commodities-base into services, such as tourism. Good air transport connections are also vital for foreign direct investment, which has been an important element behind Peru’s economic expansion in recent years.
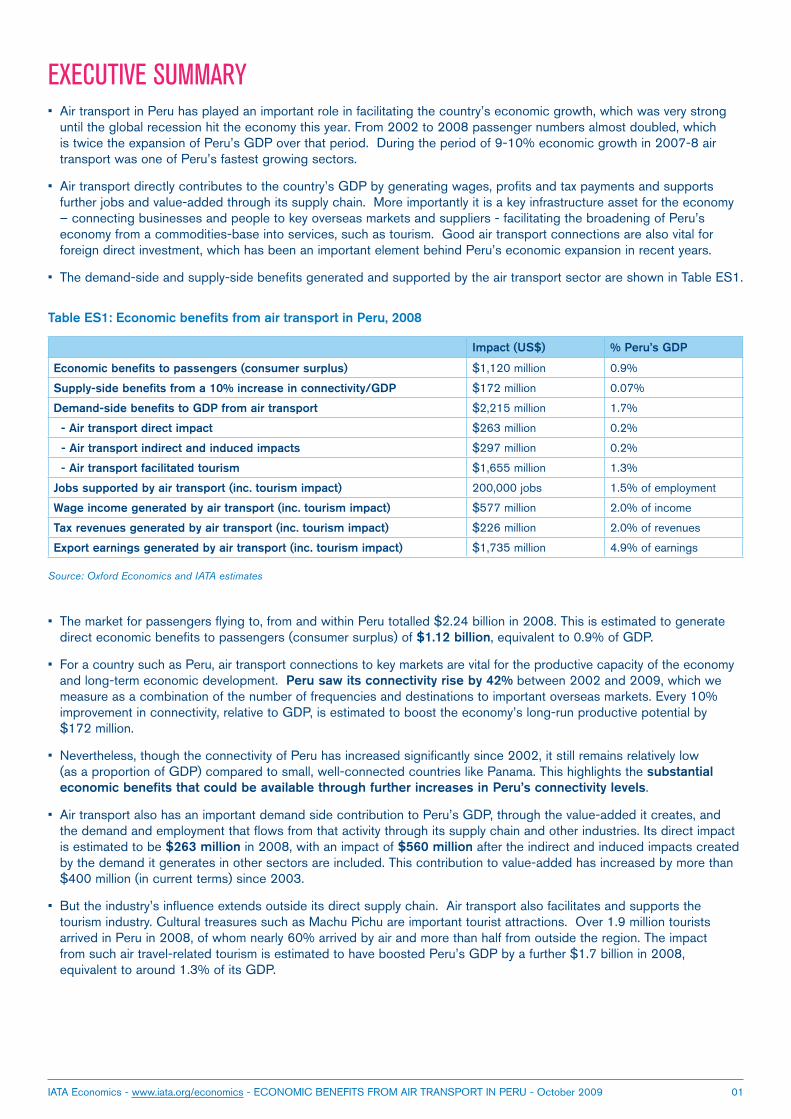
The demand-side and supply-side benefits generated and supported by the air transport sector are shown in Table ES1.•
Impact (US$) % Peru’s GDP
Economic benefits to passengers (consumer surplus) $1,120 million 0.9%
Supply-side benefits from a 10% increase in connectivity/GDP $172 million 0.07%
Demand-side benefits to GDP from air transport $2,215 million 1.7%
- Air transport direct impact $263 million 0.2%
- Air transport indirect and induced impacts $297 million 0.2%
- Air transport facilitated tourism $1,655 million 1.3%
Jobs supported by air transport (inc. tourism impact) 200,000 jobs 1.5% of employment
Wage income generated by air transport (inc. tourism impact) $577 million 2.0% of income
Tax revenues generated by air transport (inc. tourism impact) $226 million 2.0% of revenues
Export earnings generated by air transport (inc. tourism impact) $1,735 million 4.9% of earnings
Table ES1: Economic benefits from air transport in Peru, 2008
Source: Oxford Economics and IATA estimates
The market for passengers flying to, from and within Peru totalled $2.24 billion in 2008. This is estimated to generate • direct economic benefits to passengers (consumer surplus) of $1.12 billion, equivalent to 0.9% of GDP.
For a country such as Peru, air transport connections to key markets are vital for the productive capacity of the economy • and long-term economic development. Peru saw its connectivity rise by 42% between 2002 and 2009, which we measure as a combination of the number of frequencies and destinations to important overseas markets. Every 10% improvement in connectivity, relative to GDP, is estimated to boost the economy’s long-run productive potential by $172 million.
Nevertheless, though the connectivity of Peru has increased significantly since 2002, it still remains relatively low • (as a proportion of GDP) compared to small, well-connected countries like Panama. This highlights the substantial economic benefits that could be available through further increases in Peru’s connectivity levels.
Air transport also has an important demand side contribution to Peru’s GDP, through the value-added it creates, and • the demand and employment that flows from that activity through its supply chain and other industries. Its direct impact is estimated to be $263 million in 2008, with an impact of $560 million after the indirect and induced impacts created by the demand it generates in other sectors are included. This contribution to value-added has increased by more than $400 million (in current terms) since 2003.
But the industry’s influence extends outside its direct supply chain. Air transport also facilitates and supports the • tourism industry. Cultural treasures such as Machu Pichu are important tourist attractions. Over 1.9 million tourists arrived in Peru in 2008, of whom nearly 60% arrived by air and more than half from outside the region. The impact from such air travel-related tourism is estimated to have boosted Peru’s GDP by a further $1.7 billion in 2008, equivalent to around 1.3% of its GDP.
01
IATA Economics - www.iata.org/economics - ECONOMIC BENEFITS FROM AIR TRANSPORT IN PERU - October 2009 02
Adding the demand-side contributions from air transport to those facilitated in tourism gives • a total demand-side value-added of $2.2 billion, equivalent to 1.7% of Peru’s GDP. From this perspective, the industry supports more than 200,000 jobs in Peru and makes a contribution of between 1.5% and 4.9% to Peru’s employment, wage income, tax receipts and exports.
The importance of investing in improved connections to major overseas markets is shown by an analysis of the • addition of a new service from Lima to Toronto airport. This service generated over 15,000 passengers each way in 2008, representing around 0.4% of overall traffic to, from and within Peru. This service is estimated to generate at least $5 million in consumer surplus for passengers, $2 million for GDP and supports over 150 jobs. It also generates around $1 million in wage income and $300,000 in additional tax revenues for the government.
The importance of keeping airport charges and taxes in line with efficient costs is shown• by estimating the impact of a hypothetical 50% increase in the passenger departure charge from its current average level of $14.6 per departing passenger. It is estimated that this would add 1.2% to the average return fare, reducing passenger departures by 49,000. This would cause economic costs to passengers, due to higher travel costs, totalling $15 million. There would also be wider costs for the Peruvian economy, with GDP down $7 million, a loss of 534 jobs, wage income down $3 million and tax revenues down $1 million.
Further liberalisation• of restrictive elements of Peru’s bilateral air service agreements and the relaxation of airline ownership and control restrictions could yield significant additional economic benefits including a 56% increase in international passenger visits and the creation of over 77,000 jobs.
IATA Economics - www.iata.org/economics - ECONOMIC BENEFITS FROM AIR TRANSPORT IN PERU - October 2009
ECONOMIC GROWTH IN PERU Following the 1998-2001 period when a political crisis contributed to restraining GDP growth to an anaemic 0.8% p.a., economic activity has accelerated sharply with annual growth between 2002-2008 averaging 7.0%. Indeed in 2007 an 8.9% year-on-year rise in real GDP made Peru the second-fastest growing economy in Latin America behind Panama. Moreover, growth accelerated further to 9.8% in 2008, the highest rate in the region. Rapid expansion has been driven by strong inflows of foreign investment, particularly into the extractive industries, which in turn have stimulated domestic consumption and investment.
Growth has slowed markedly this year in the wake of the global financial crisis. The economy has been hit by a sharp reversal of capital inflows and a significant negative terms of trade shock due to the fall in commodity prices. However, partly due to a sharp slowdown in inflation, which has improved consumer purchasing power, and a cumulative 525 bp cut in interest rates, the finance ministry is still forecasting growth of 2.2% in 2009.
03
Source: INEI
Sector Share of GDP 2008
% growth 2007 (real)
% growth 2008 (real)
Agriculture and Fishing 9.0 3.5 6.7
Mining 6.3 2.7 7.6
Manufacturing 17.1 10.8 8.5
Electricity, Gas and Water
2.2 8.5 7.8
Construction 6.5 16.6 16.5
Retail, Restaurants, Hotels
20.7 9.4 12.0
Transport 6.3 10.2 9.1
Communications 3.6 38.8 11.6
Financial Services 2.6 14.9 8.8
Public Sector and Other Services
25.7 2.8 8.8
Total 100.0 8.9 9.8
Table 1: Peru GDP by Sector
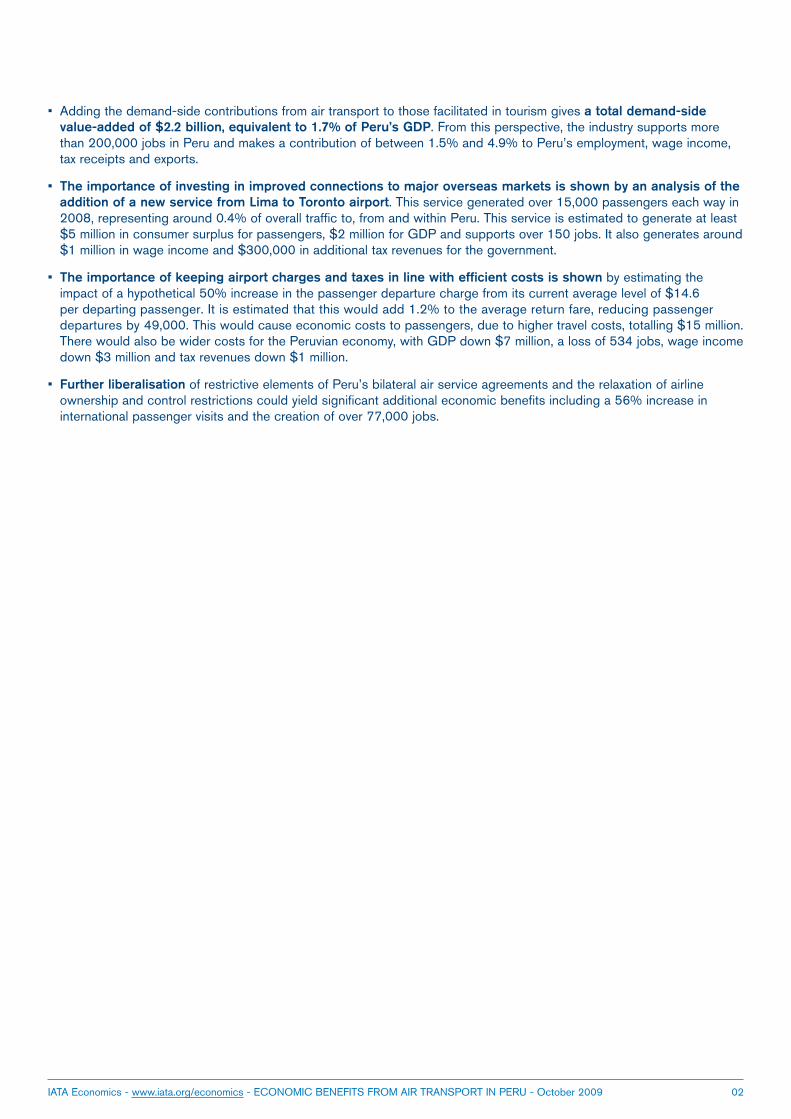
Like most modern economies Peru is shifting towards a service sector dominated economy with services accounting for 55% of GDP in 2008, a share which has remained virtually unchanged since 1997. Manufacturing accounted for around 17% of total output, while agriculture, fishing and mining’s combined share was just over 15%. At just over 6% of the economy, mining is still a relatively important sector particularly for export earnings.
Over the past ten years, the transport sector (which includes aviation) has grown at a very similar pace to the overall rate of GDP. The air transport sector has followed a more volatile growth path, largely due to the worldwide impacts of the 9-11 terrorist attacks. However, particularly rapid expansion since 2005 means that the sector’s direct contribution to GDP has risen as a share and in absolute terms since 1997 to $263 million of value-added.
The fast-growing tourist sector been an important contributor to GDP growth over the last decade, having tripled in value between 2001 and 2008. In the section below we discuss the essential role of the aviation industry in this process.
Source: INEI
Figure 1: Peru GDP, Transport and Air Transport Growth
IATA Economics - www.iata.org/economics - ECONOMIC BENEFITS FROM AIR TRANSPORT IN PERU - October 2009 04
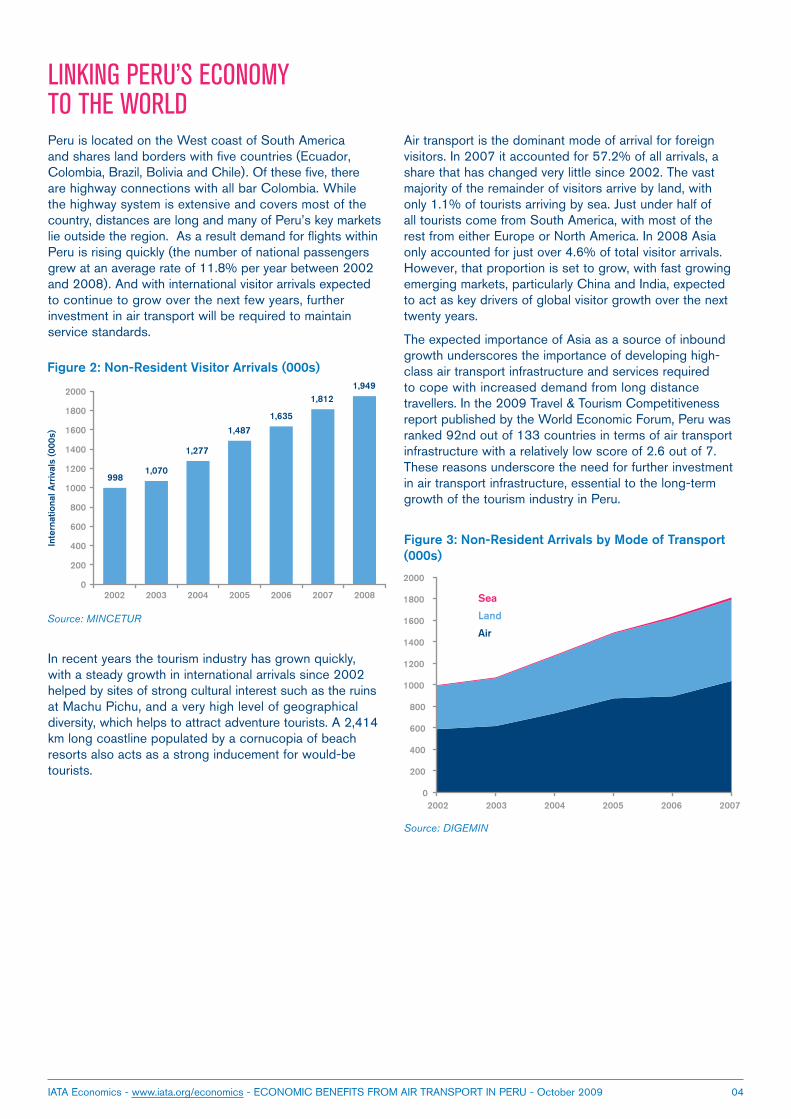
LINKING PERU’S ECONOMY TO THE WORLD Peru is located on the West coast of South America and shares land borders with five countries (Ecuador, Colombia, Brazil, Bolivia and Chile). Of these five, there are highway connections with all bar Colombia. While the highway system is extensive and covers most of the country, distances are long and many of Peru’s key markets lie outside the region. As a result demand for flights within Peru is rising quickly (the number of national passengers grew at an average rate of 11.8% per year between 2002 and 2008). And with international visitor arrivals expected to continue to grow over the next few years, further investment in air transport will be required to maintain service standards.
In recent years the tourism industry has grown quickly, with a steady growth in international arrivals since 2002 helped by sites of strong cultural interest such as the ruins at Machu Pichu, and a very high level of geographical diversity, which helps to attract adventure tourists. A 2,414 km long coastline populated by a cornucopia of beach resorts also acts as a strong inducement for would-be tourists.
Figure 2: Non-Resident Visitor Arrivals (000s)
Source: MINCETUR
Air transport is the dominant mode of arrival for foreign visitors. In 2007 it accounted for 57.2% of all arrivals, a share that has changed very little since 2002. The vast majority of the remainder of visitors arrive by land, with only 1.1% of tourists arriving by sea. Just under half of all tourists come from South America, with most of the rest from either Europe or North America. In 2008 Asia only accounted for just over 4.6% of total visitor arrivals. However, that proportion is set to grow, with fast growing emerging markets, particularly China and India, expected to act as key drivers of global visitor growth over the next twenty years.
The expected importance of Asia as a source of inbound growth underscores the importance of developing high-class air transport infrastructure and services required to cope with increased demand from long distance travellers. In the 2009 Travel & Tourism Competitiveness report published by the World Economic Forum, Peru was ranked 92nd out of 133 countries in terms of air transport infrastructure with a relatively low score of 2.6 out of 7. These reasons underscore the need for further investment in air transport infrastructure, essential to the long-term growth of the tourism industry in Peru.
Figure 3: Non-Resident Arrivals by Mode of Transport (000s)
Source: DIGEMIN
IATA Economics - www.iata.org/economics - ECONOMIC BENEFITS FROM AIR TRANSPORT IN PERU - October 2009 05
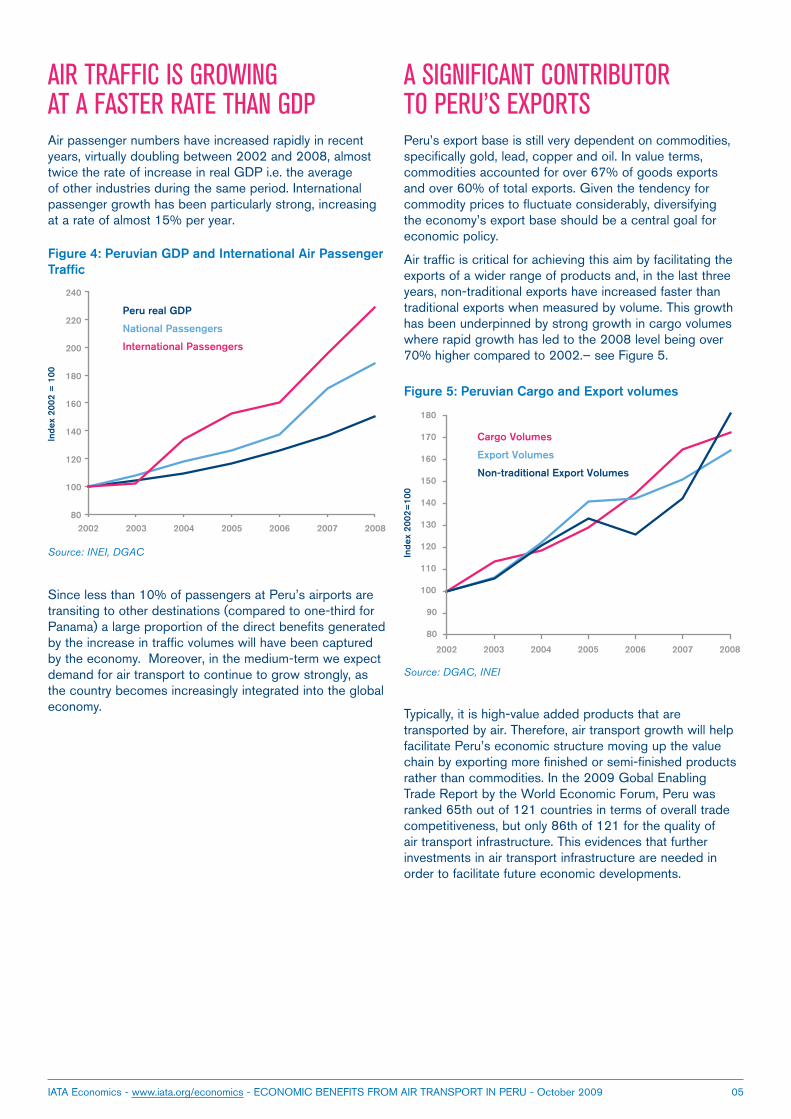
AIR TRAFFIC IS GROWING AT A FASTER RATE THAN GDPAir passenger numbers have increased rapidly in recent years, virtually doubling between 2002 and 2008, almost twice the rate of increase in real GDP i.e. the average of other industries during the same period. International passenger growth has been particularly strong, increasing at a rate of almost 15% per year.
Since less than 10% of passengers at Peru’s airports are transiting to other destinations (compared to one-third for Panama) a large proportion of the direct benefits generated by the increase in traffic volumes will have been captured by the economy. Moreover, in the medium-term we expect demand for air transport to continue to grow strongly, as the country becomes increasingly integrated into the global economy.
Figure 4: Peruvian GDP and International Air Passenger Traffic
Source: INEI, DGAC
A SIGNIFICANT CONTRIBUTOR TO PERU’S EXPORTSPeru’s export base is still very dependent on commodities, specifically gold, lead, copper and oil. In value terms, commodities accounted for over 67% of goods exports and over 60% of total exports. Given the tendency for commodity prices to fluctuate considerably, diversifying the economy’s export base should be a central goal for economic policy.
Air traffic is critical for achieving this aim by facilitating the exports of a wider range of products and, in the last three years, non-traditional exports have increased faster than traditional exports when measured by volume. This growth has been underpinned by strong growth in cargo volumes where rapid growth has led to the 2008 level being over 70% higher compared to 2002.– see Figure 5.
Typically, it is high-value added products that are transported by air. Therefore, air transport growth will help facilitate Peru’s economic structure moving up the value chain by exporting more finished or semi-finished products rather than commodities. In the 2009 Gobal Enabling Trade Report by the World Economic Forum, Peru was ranked 65th out of 121 countries in terms of overall trade competitiveness, but only 86th of 121 for the quality of air transport infrastructure. This evidences that further investments in air transport infrastructure are needed in order to facilitate future economic developments.
Figure 5: Peruvian Cargo and Export volumes
Source: DGAC, INEI
IATA Economics - www.iata.org/economics - ECONOMIC BENEFITS FROM AIR TRANSPORT IN PERU - October 2009 06
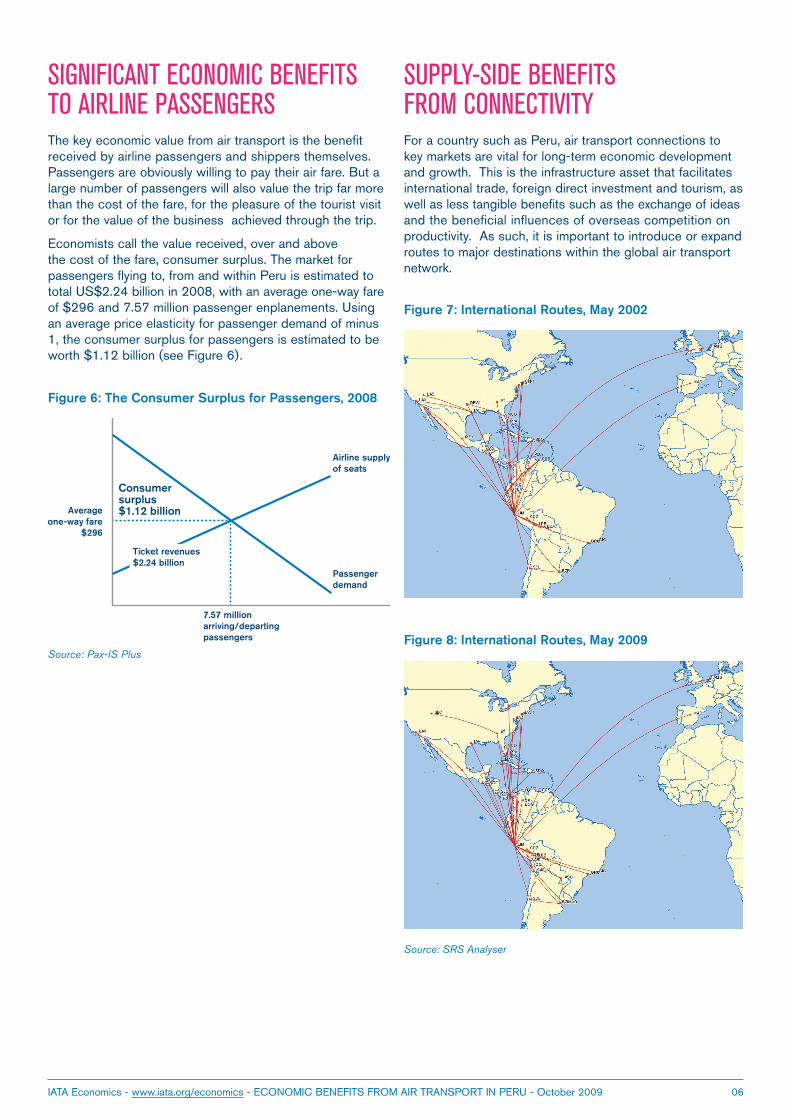
SIGNIFICANT ECONOMIC BENEFITS TO AIRLINE PASSENGERS The key economic value from air transport is the benefit received by airline passengers and shippers themselves. Passengers are obviously willing to pay their air fare. But a large number of passengers will also value the trip far more than the cost of the fare, for the pleasure of the tourist visit or for the value of the business achieved through the trip.
Economists call the value received, over and above the cost of the fare, consumer surplus. The market for passengers flying to, from and within Peru is estimated to total US$2.24 billion in 2008, with an average one-way fare of $296 and 7.57 million passenger enplanements. Using an average price elasticity for passenger demand of minus 1, the consumer surplus for passengers is estimated to be worth $1.12 billion (see Figure 6).
Figure 6: The Consumer Surplus for Passengers, 2008
Source: Pax-IS Plus
SUPPLY-SIDE BENEFITS FROM CONNECTIVITY For a country such as Peru, air transport connections to key markets are vital for long-term economic development and growth. This is the infrastructure asset that facilitates international trade, foreign direct investment and tourism, as well as less tangible benefits such as the exchange of ideas and the beneficial influences of overseas competition on productivity. As such, it is important to introduce or expand routes to major destinations within the global air transport network.
Figure 7: International Routes, May 2002
Figure 8: International Routes, May 2009
Source: SRS Analyser
IATA Economics - www.iata.org/economics - ECONOMIC BENEFITS FROM AIR TRANSPORT IN PERU - October 2009 07
In 2002, Peru’s international services were concentrated on Latin and North America but also featured two links to Europe (see Figure 7). By May 2009 Peru had increased international routes mainly within Latin America but also with longhaul service to Canada. Connections to Europe remained at a similar level, however the link to Amsterdam became a direct service (see Figure 8).
The overall number of international routes increased by 36% between 2002 and 2009. This was largely due to new services from Lima, however limited international services have also been re-established from regional airports after being absent for several years.
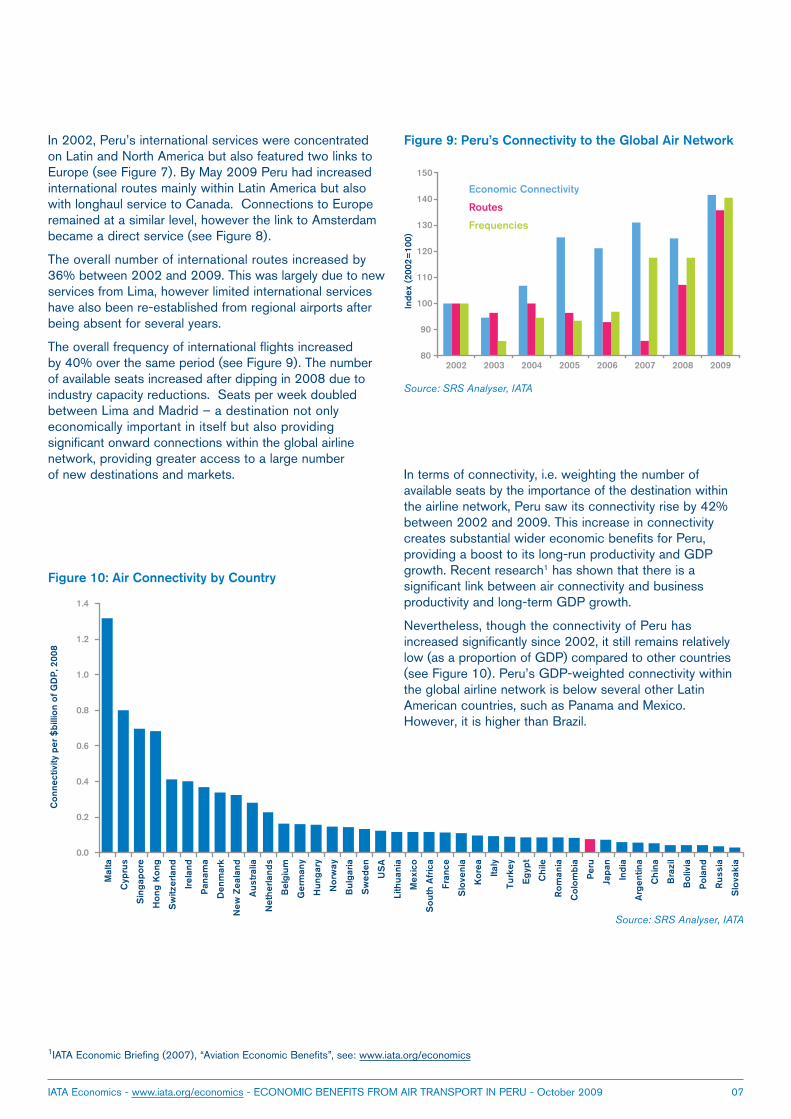
The overall frequency of international flights increased by 40% over the same period (see Figure 9). The number of available seats increased after dipping in 2008 due to industry capacity reductions. Seats per week doubled between Lima and Madrid – a destination not only economically important in itself but also providing significant onward connections within the global airline network, providing greater access to a large number of new destinations and markets.
Figure 9: Peru’s Connectivity to the Global Air Network
Source: SRS Analyser, IATA
In terms of connectivity, i.e. weighting the number of available seats by the importance of the destination within the airline network, Peru saw its connectivity rise by 42% between 2002 and 2009. This increase in connectivity creates substantial wider economic benefits for Peru, providing a boost to its long-run productivity and GDP growth. Recent research1 has shown that there is a significant link between air connectivity and business productivity and long-term GDP growth.
Nevertheless, though the connectivity of Peru has increased significantly since 2002, it still remains relatively low (as a proportion of GDP) compared to other countries (see Figure 10). Peru’s GDP-weighted connectivity within the global airline network is below several other Latin American countries, such as Panama and Mexico. However, it is higher than Brazil.
Figure 10: Air Connectivity by Country
Source: SRS Analyser, IATA
1IATA Economic Briefing (2007), “Aviation Economic Benefits”, see: www.iata.org/economics
IATA Economics - www.iata.org/economics - ECONOMIC BENEFITS FROM AIR TRANSPORT IN PERU - October 2009
Air connectivity per $billion of GDP, 2008
Impact on GDP from a 10% increase
Peru 0.079 + $172 million (0.07%)
Table 2: the Impact on Peru’s long-run GDP from its level of air connectivity
Source: IATA. IMF for GDP (PPP basis)
08
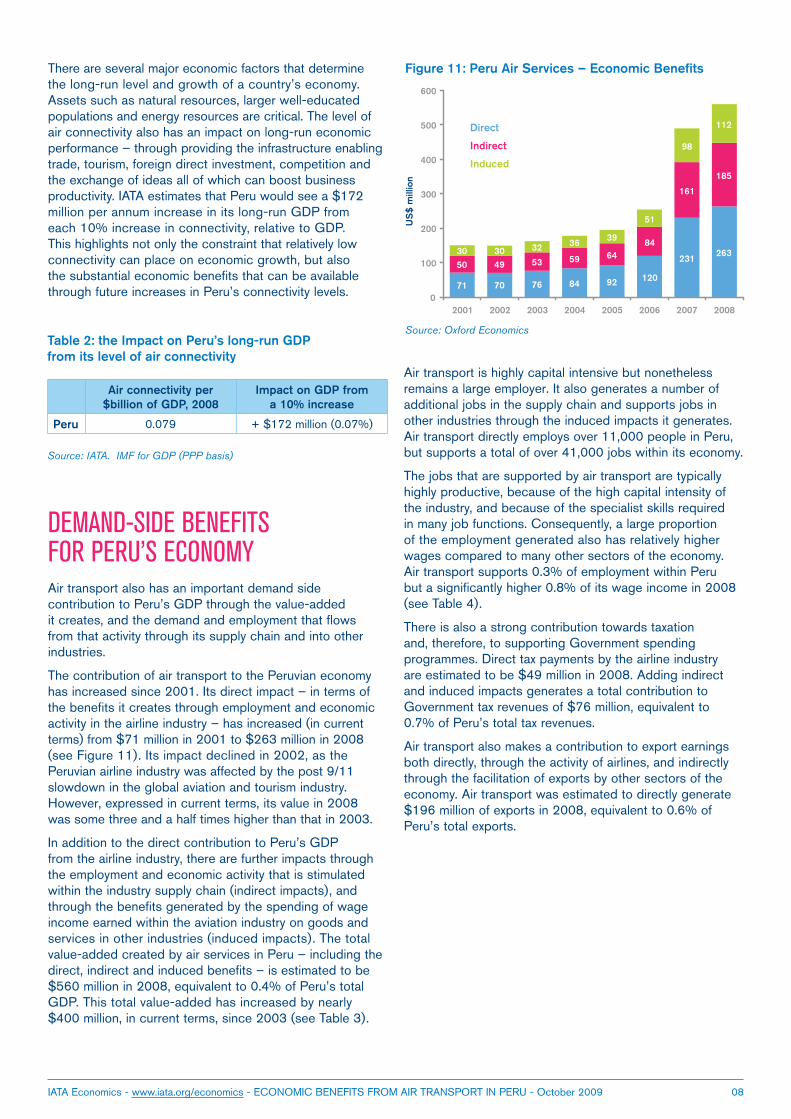
There are several major economic factors that determine the long-run level and growth of a country’s economy. Assets such as natural resources, larger well-educated populations and energy resources are critical. The level of air connectivity also has an impact on long-run economic performance – through providing the infrastructure enabling trade, tourism, foreign direct investment, competition and the exchange of ideas all of which can boost business productivity. IATA estimates that Peru would see a $172 million per annum increase in its long-run GDP from each 10% increase in connectivity, relative to GDP. This highlights not only the constraint that relatively low connectivity can place on economic growth, but also the substantial economic benefits that can be available through future increases in Peru’s connectivity levels.
DEMAND-SIDE BENEFITS FOR PERU’S ECONOMY Air transport also has an important demand side contribution to Peru’s GDP through the value-added it creates, and the demand and employment that flows from that activity through its supply chain and into other industries.
The contribution of air transport to the Peruvian economy has increased since 2001. Its direct impact – in terms of the benefits it creates through employment and economic activity in the airline industry – has increased (in current terms) from $71 million in 2001 to $263 million in 2008 (see Figure 11). Its impact declined in 2002, as the Peruvian airline industry was affected by the post 9/11 slowdown in the global aviation and tourism industry. However, expressed in current terms, its value in 2008 was some three and a half times higher than that in 2003.
In addition to the direct contribution to Peru’s GDP from the airline industry, there are further impacts through the employment and economic activity that is stimulated within the industry supply chain (indirect impacts), and through the benefits generated by the spending of wage income earned within the aviation industry on goods and services in other industries (induced impacts). The total value-added created by air services in Peru – including the direct, indirect and induced benefits – is estimated to be $560 million in 2008, equivalent to 0.4% of Peru’s total GDP. This total value-added has increased by nearly $400 million, in current terms, since 2003 (see Table 3).
Figure 11: Peru Air Services – Economic Benefits
Source: Oxford Economics
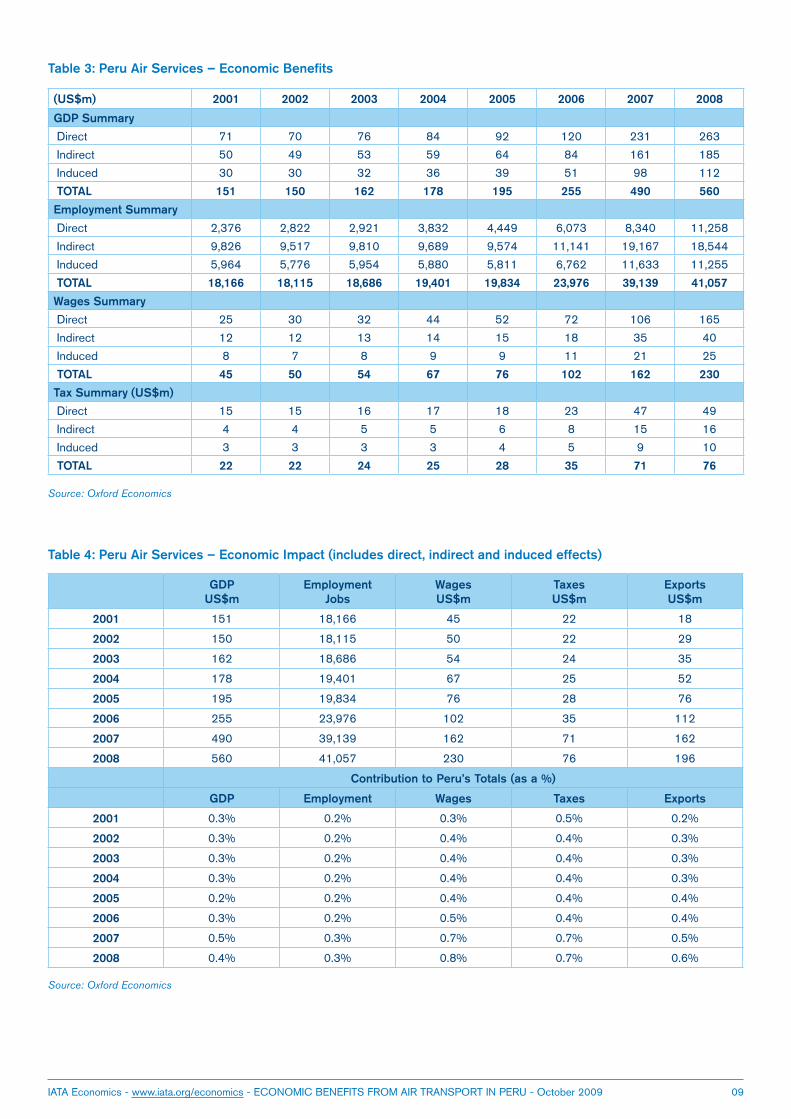
Air transport is highly capital intensive but nonetheless remains a large employer. It also generates a number of additional jobs in the supply chain and supports jobs in other industries through the induced impacts it generates. Air transport directly employs over 11,000 people in Peru, but supports a total of over 41,000 jobs within its economy.
The jobs that are supported by air transport are typically highly productive, because of the high capital intensity of the industry, and because of the specialist skills required in many job functions. Consequently, a large proportion of the employment generated also has relatively higher wages compared to many other sectors of the economy. Air transport supports 0.3% of employment within Peru but a significantly higher 0.8% of its wage income in 2008 (see Table 4).
There is also a strong contribution towards taxation and, therefore, to supporting Government spending programmes. Direct tax payments by the airline industry are estimated to be $49 million in 2008. Adding indirect and induced impacts generates a total contribution to Government tax revenues of $76 million, equivalent to 0.7% of Peru’s total tax revenues.
Air transport also makes a contribution to export earnings both directly, through the activity of airlines, and indirectly through the facilitation of exports by other sectors of the economy. Air transport was estimated to directly generate $196 million of exports in 2008, equivalent to 0.6% of Peru’s total exports.
IATA Economics - www.iata.org/economics - ECONOMIC BENEFITS FROM AIR TRANSPORT IN PERU - October 2009
(US$m) 2001 2002 2003 2004 2005 2006 2007 2008
GDP Summary
Direct 71 70 76 84 92 120 231 263
Indirect 50 49 53 59 64 84 161 185
Induced 30 30 32 36 39 51 98 112
TOTAL 151 150 162 178 195 255 490 560
Employment Summary
Direct 2,376 2,822 2,921 3,832 4,449 6,073 8,340 11,258
Indirect 9,826 9,517 9,810 9,689 9,574 11,141 19,167 18,544
Induced 5,964 5,776 5,954 5,880 5,811 6,762 11,633 11,255
TOTAL 18,166 18,115 18,686 19,401 19,834 23,976 39,139 41,057
Wages Summary
Direct 25 30 32 44 52 72 106 165
Indirect 12 12 13 14 15 18 35 40
Induced 8 7 8 9 9 11 21 25
TOTAL 45 50 54 67 76 102 162 230
Tax Summary (US$m)
Direct 15 15 16 17 18 23 47 49
Indirect 4 4 5 5 6 8 15 16
Induced 3 3 3 3 4 5 9 10
TOTAL 22 22 24 25 28 35 71 76
Source: Oxford Economics
Source: Oxford Economics
09
Table 3: Peru Air Services – Economic Benefits
GDP US$m
Employment Jobs
Wages US$m
Taxes US$m
Exports US$m
2001 151 18,166 45 22 18
2002 150 18,115 50 22 29
2003 162 18,686 54 24 35
2004 178 19,401 67 25 52
2005 195 19,834 76 28 76
2006 255 23,976 102 35 112
2007 490 39,139 162 71 162
2008 560 41,057 230 76 196
Contribution to Peru’s Totals (as a %)
GDP Employment Wages Taxes Exports
2001 0.3% 0.2% 0.3% 0.5% 0.2%
2002 0.3% 0.2% 0.4% 0.4% 0.3%
2003 0.3% 0.2% 0.4% 0.4% 0.3%
2004 0.3% 0.2% 0.4% 0.4% 0.3%
2005 0.2% 0.2% 0.4% 0.4% 0.4%
2006 0.3% 0.2% 0.5% 0.4% 0.4%
2007 0.5% 0.3% 0.7% 0.7% 0.5%
2008 0.4% 0.3% 0.8% 0.7% 0.6%
Table 4: Peru Air Services – Economic Impact (includes direct, indirect and induced effects)
IATA Economics - www.iata.org/economics - ECONOMIC BENEFITS FROM AIR TRANSPORT IN PERU - October 2009 10
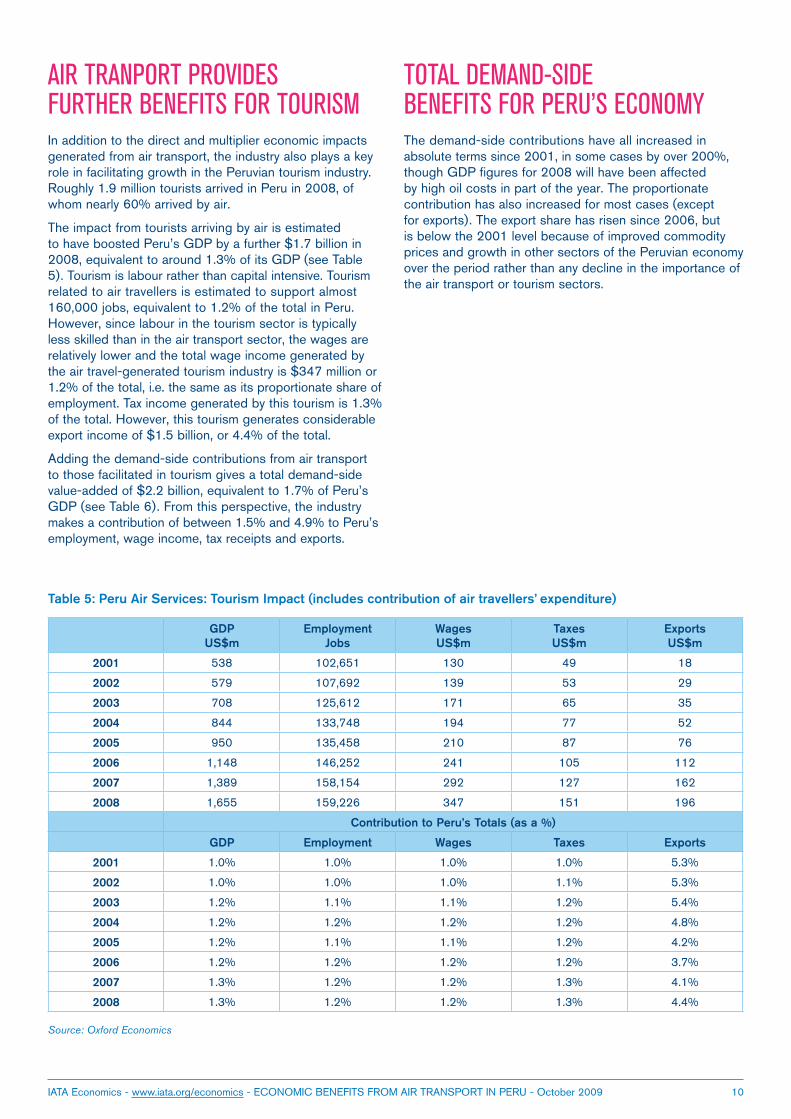
AIR TRANPORT PROVIDES FURTHER BENEFITS FOR TOURISM In addition to the direct and multiplier economic impacts generated from air transport, the industry also plays a key role in facilitating growth in the Peruvian tourism industry. Roughly 1.9 million tourists arrived in Peru in 2008, of whom nearly 60% arrived by air.
The impact from tourists arriving by air is estimated to have boosted Peru’s GDP by a further $1.7 billion in 2008, equivalent to around 1.3% of its GDP (see Table 5). Tourism is labour rather than capital intensive. Tourism related to air travellers is estimated to support almost 160,000 jobs, equivalent to 1.2% of the total in Peru. However, since labour in the tourism sector is typically less skilled than in the air transport sector, the wages are relatively lower and the total wage income generated by the air travel-generated tourism industry is $347 million or 1.2% of the total, i.e. the same as its proportionate share of employment. Tax income generated by this tourism is 1.3% of the total. However, this tourism generates considerable export income of $1.5 billion, or 4.4% of the total.
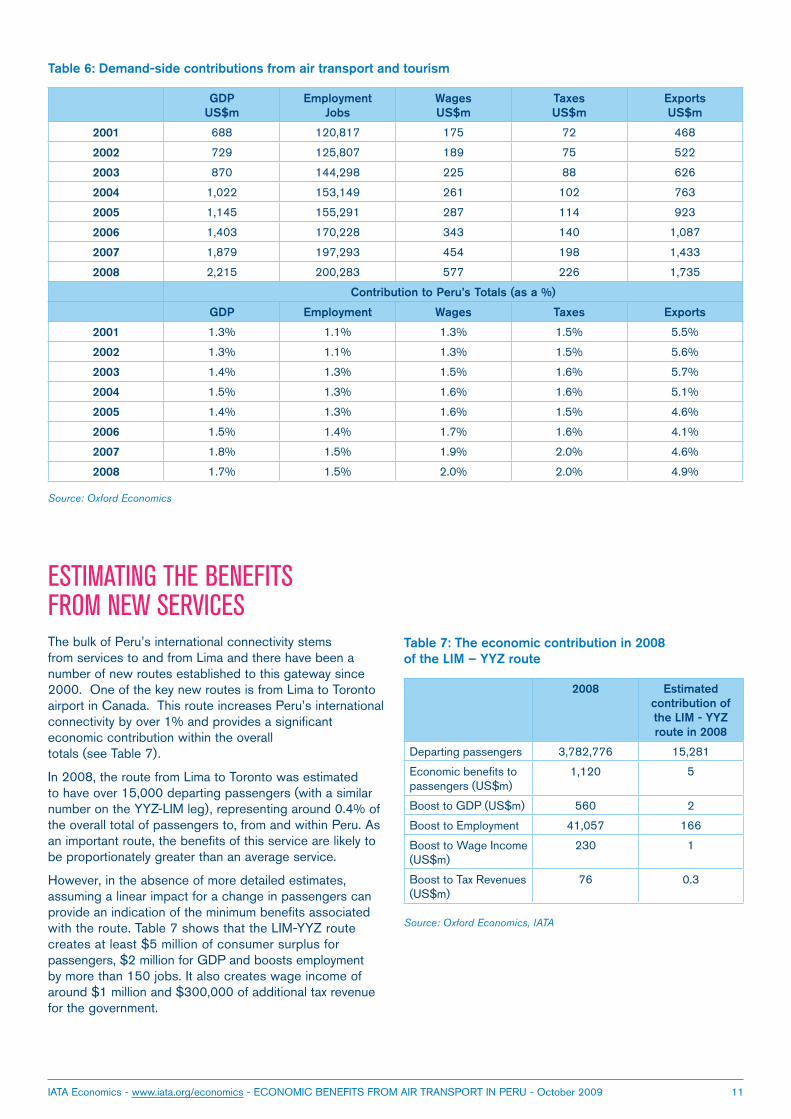
Adding the demand-side contributions from air transport to those facilitated in tourism gives a total demand-side value-added of $2.2 billion, equivalent to 1.7% of Peru’s GDP (see Table 6). From this perspective, the industry makes a contribution of between 1.5% and 4.9% to Peru’s employment, wage income, tax receipts and exports.
Source: Oxford Economics
GDP US$m
Employment Jobs
Wages US$m
Taxes US$m
Exports US$m
2001 538 102,651 130 49 18
2002 579 107,692 139 53 29
2003 708 125,612 171 65 35
2004 844 133,748 194 77 52
2005 950 135,458 210 87 76
2006 1,148 146,252 241 105 112
2007 1,389 158,154 292 127 162
2008 1,655 159,226 347 151 196
Contribution to Peru’s Totals (as a %)
GDP Employment Wages Taxes Exports
2001 1.0% 1.0% 1.0% 1.0% 5.3%
2002 1.0% 1.0% 1.0% 1.1% 5.3%
2003 1.2% 1.1% 1.1% 1.2% 5.4%
2004 1.2% 1.2% 1.2% 1.2% 4.8%
2005 1.2% 1.1% 1.1% 1.2% 4.2%
2006 1.2% 1.2% 1.2% 1.2% 3.7%
2007 1.3% 1.2% 1.2% 1.3% 4.1%
2008 1.3% 1.2% 1.2% 1.3% 4.4%
Table 5: Peru Air Services: Tourism Impact (includes contribution of air travellers’ expenditure)
TOTAL DEMAND-SIDE BENEFITS FOR PERU’S ECONOMY The demand-side contributions have all increased in absolute terms since 2001, in some cases by over 200%, though GDP figures for 2008 will have been affected by high oil costs in part of the year. The proportionate contribution has also increased for most cases (except for exports). The export share has risen since 2006, but is below the 2001 level because of improved commodity prices and growth in other sectors of the Peruvian economy over the period rather than any decline in the importance of the air transport or tourism sectors.
IATA Economics - www.iata.org/economics - ECONOMIC BENEFITS FROM AIR TRANSPORT IN PERU - October 2009 11
Source: Oxford Economics
GDP US$m
Employment Jobs
Wages US$m
Taxes US$m
Exports US$m
2001 688 120,817 175 72 468
2002 729 125,807 189 75 522
2003 870 144,298 225 88 626
2004 1,022 153,149 261 102 763
2005 1,145 155,291 287 114 923
2006 1,403 170,228 343 140 1,087
2007 1,879 197,293 454 198 1,433
2008 2,215 200,283 577 226 1,735
Contribution to Peru’s Totals (as a %)
GDP Employment Wages Taxes Exports
2001 1.3% 1.1% 1.3% 1.5% 5.5%
2002 1.3% 1.1% 1.3% 1.5% 5.6%
2003 1.4% 1.3% 1.5% 1.6% 5.7%
2004 1.5% 1.3% 1.6% 1.6% 5.1%
2005 1.4% 1.3% 1.6% 1.5% 4.6%
2006 1.5% 1.4% 1.7% 1.6% 4.1%
2007 1.8% 1.5% 1.9% 2.0% 4.6%
2008 1.7% 1.5% 2.0% 2.0% 4.9%
Table 6: Demand-side contributions from air transport and tourism
ESTIMATING THE BENEFITS FROM NEW SERVICES The bulk of Peru’s international connectivity stems from services to and from Lima and there have been a number of new routes established to this gateway since 2000. One of the key new routes is from Lima to Toronto airport in Canada. This route increases Peru’s international connectivity by over 1% and provides a significant economic contribution within the overall totals (see Table 7).
In 2008, the route from Lima to Toronto was estimated to have over 15,000 departing passengers (with a similar number on the YYZ-LIM leg), representing around 0.4% of the overall total of passengers to, from and within Peru. As an important route, the benefits of this service are likely to be proportionately greater than an average service.
However, in the absence of more detailed estimates, assuming a linear impact for a change in passengers can provide an indication of the minimum benefits associated with the route. Table 7 shows that the LIM-YYZ route creates at least $5 million of consumer surplus for passengers, $2 million for GDP and boosts employment by more than 150 jobs. It also creates wage income of around $1 million and $300,000 of additional tax revenue for the government.
2008 Estimated contribution of the LIM - YYZ route in 2008
Departing passengers 3,782,776 15,281
Economic benefits to passengers (US$m)
1,120 5
Boost to GDP (US$m) 560 2
Boost to Employment 41,057 166
Boost to Wage Income (US$m)
230 1
Boost to Tax Revenues (US$m)
76 0.3
Table 7: The economic contribution in 2008 of the LIM – YYZ route
Source: Oxford Economics, IATA
IATA Economics - www.iata.org/economics - ECONOMIC BENEFITS FROM AIR TRANSPORT IN PERU - October 2009
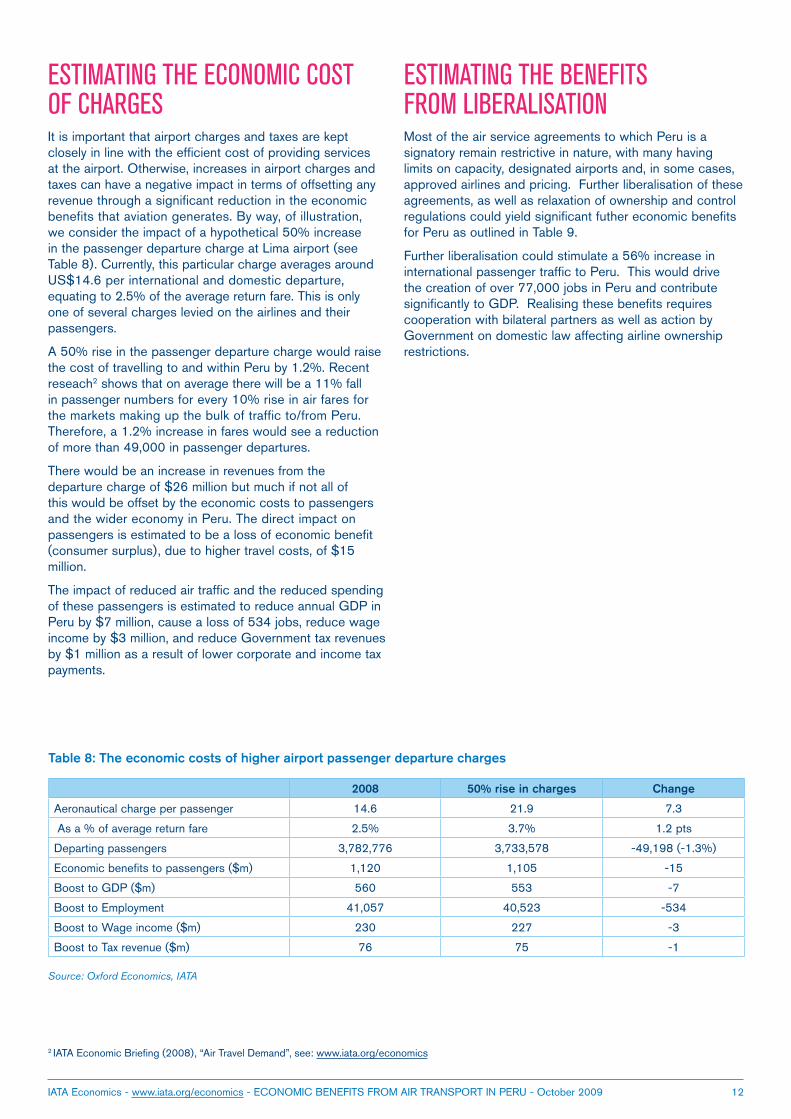
2008 50% rise in charges Change
Aeronautical charge per passenger 14.6 21.9 7.3
As a % of average return fare 2.5% 3.7% 1.2 pts
Departing passengers 3,782,776 3,733,578 -49,198 (-1.3%)
Economic benefits to passengers ($m) 1,120 1,105 -15
Boost to GDP ($m) 560 553 -7
Boost to Employment 41,057 40,523 -534
Boost to Wage income ($m) 230 227 -3
Boost to Tax revenue ($m) 76 75 -1
Table 8: The economic costs of higher airport passenger departure charges
12
ESTIMATING THE ECONOMIC COST OF CHARGESIt is important that airport charges and taxes are kept closely in line with the efficient cost of providing services at the airport. Otherwise, increases in airport charges and taxes can have a negative impact in terms of offsetting any revenue through a significant reduction in the economic benefits that aviation generates. By way, of illustration, we consider the impact of a hypothetical 50% increase in the passenger departure charge at Lima airport (see Table 8). Currently, this particular charge averages around US$14.6 per international and domestic departure, equating to 2.5% of the average return fare. This is only one of several charges levied on the airlines and their passengers.
A 50% rise in the passenger departure charge would raise the cost of travelling to and within Peru by 1.2%. Recent reseach2 shows that on average there will be a 11% fall in passenger numbers for every 10% rise in air fares for the markets making up the bulk of traffic to/from Peru. Therefore, a 1.2% increase in fares would see a reduction of more than 49,000 in passenger departures.
There would be an increase in revenues from the departure charge of $26 million but much if not all of this would be offset by the economic costs to passengers and the wider economy in Peru. The direct impact on passengers is estimated to be a loss of economic benefit (consumer surplus), due to higher travel costs, of $15 million.
The impact of reduced air traffic and the reduced spending of these passengers is estimated to reduce annual GDP in Peru by $7 million, cause a loss of 534 jobs, reduce wage income by $3 million, and reduce Government tax revenues by $1 million as a result of lower corporate and income tax payments.
Source: Oxford Economics, IATA
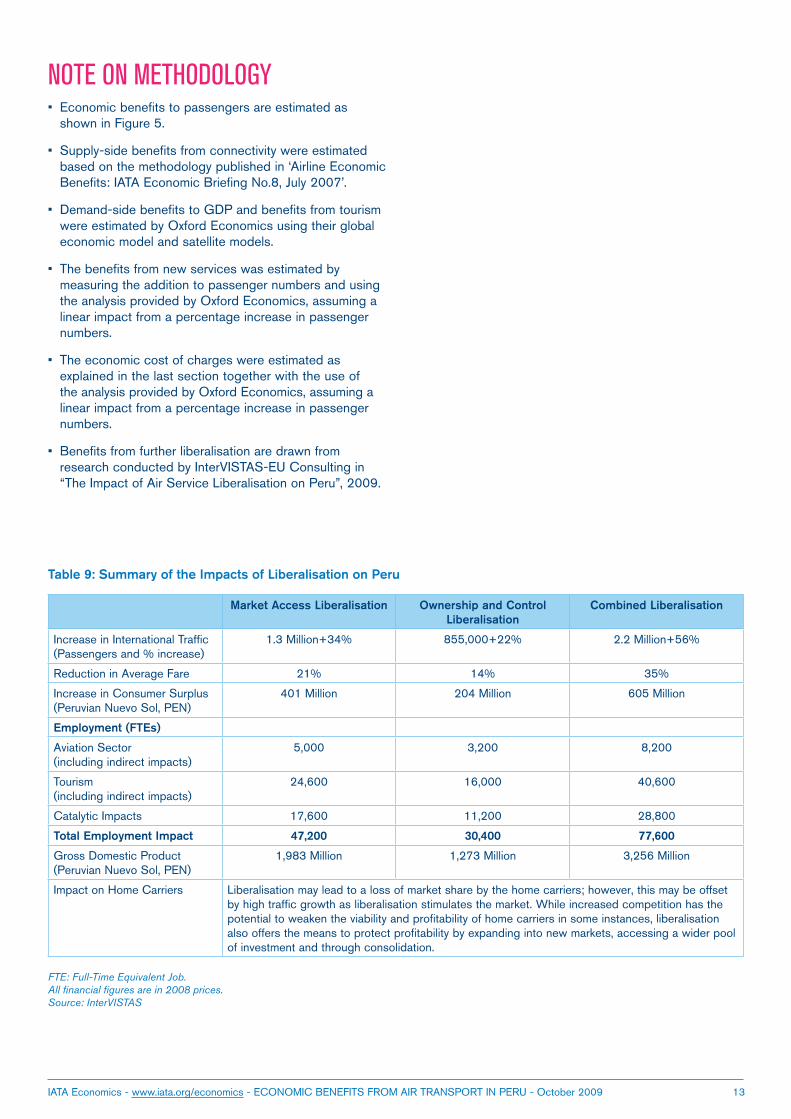
ESTIMATING THE BENEFITS FROM LIBERALISATION Most of the air service agreements to which Peru is a signatory remain restrictive in nature, with many having limits on capacity, designated airports and, in some cases, approved airlines and pricing. Further liberalisation of these agreements, as well as relaxation of ownership and control regulations could yield significant futher economic benefits for Peru as outlined in Table 9.
Further liberalisation could stimulate a 56% increase in international passenger traffic to Peru. This would drive the creation of over 77,000 jobs in Peru and contribute significantly to GDP. Realising these benefits requires cooperation with bilateral partners as well as action by Government on domestic law affecting airline ownership restrictions.
2 IATA Economic Briefing (2008), “Air Travel Demand”, see: www.iata.org/economics
IATA Economics - www.iata.org/economics - ECONOMIC BENEFITS FROM AIR TRANSPORT IN PERU - October 2009 13
NOTE ON METHODOLOGY Economic benefits to passengers are estimated as • shown in Figure 5.
Supply-side benefits from connectivity were estimated • based on the methodology published in ‘Airline Economic Benefits: IATA Economic Briefing No.8, July 2007’.
Demand-side benefits to GDP and benefits from tourism • were estimated by Oxford Economics using their global economic model and satellite models.
The benefits from new services was estimated by • measuring the addition to passenger numbers and using the analysis provided by Oxford Economics, assuming a linear impact from a percentage increase in passenger numbers.
The economic cost of charges were estimated as • explained in the last section together with the use of the analysis provided by Oxford Economics, assuming a linear impact from a percentage increase in passenger numbers.
Benefits from further liberalisation are drawn from • research conducted by InterVISTAS-EU Consulting in “The Impact of Air Service Liberalisation on Peru”, 2009.
Market Access Liberalisation Ownership and Control Liberalisation
Combined Liberalisation
Increase in International Traffic(Passengers and % increase)
1.3 Million+34% 855,000+22% 2.2 Million+56%
Reduction in Average Fare 21% 14% 35%
Increase in Consumer Surplus(Peruvian Nuevo Sol, PEN)
401 Million 204 Million 605 Million
Employment (FTEs)
Aviation Sector (including indirect impacts)
5,000 3,200 8,200
Tourism (including indirect impacts)
24,600 16,000 40,600
Catalytic Impacts 17,600 11,200 28,800
Total Employment Impact 47,200 30,400 77,600
Gross Domestic Product(Peruvian Nuevo Sol, PEN)
1,983 Million 1,273 Million 3,256 Million
Impact on Home Carriers Liberalisation may lead to a loss of market share by the home carriers; however, this may be offset by high traffic growth as liberalisation stimulates the market. While increased competition has the potential to weaken the viability and profitability of home carriers in some instances, liberalisation also offers the means to protect profitability by expanding into new markets, accessing a wider pool of investment and through consolidation.
Table 9: Summary of the Impacts of Liberalisation on Peru
FTE: Full-Time Equivalent Job.All financial figures are in 2008 prices.Source: InterVISTAS