economic benefits from air transport in south africa africa country report 2 ... benefits to tourism...
TRANSCRIPT
Economic Benefits from Air Transport in South Africa
South Africa country report
1
Acknowledgements
Oxford Economics gratefully acknowledges the help that we received from the
International Air Transport Association (IATA) in preparation of this report.
Through a survey conducted by IATA many organisations across the aviation
industry supplied us with data that has formed an integral part of our analysis.
We would like to thank all these organisations for their generosity in supplying
this data, without which this report could not have been written.
A note on the data reported in the report
Unless otherwise stated, the numbers reported in this report relate to the
calendar year 2009.
Oxford Economics 2011
v1.2
South Africa country report
2
Contents
Facts & figures .......................................................................................... 3
1 Consumer benefits for passengers and shippers ......................... 6
1.1 Consumer benefits ..................................................................................... 6
1.2 Estimated consumer benefits ..................................................................... 7
2 Enabling long-term economic growth ............................................ 8
2.1 Connectivity and the cost of air transport services .................................... 8
2.2 How aviation enhances economic performance ........................................ 9
2.3 Connectivity and long-term growth .......................................................... 10
3 Economic footprint ........................................................................ 12
3.1 The aviation sector and its economic footprint ........................................ 12
3.2 The airlines ............................................................................................... 15
3.3 The airports and ground-based services ................................................. 16
3.4 Aerospace ................................................................................................ 17
3.5 Tax contribution ........................................................................................ 18
3.6 Investment and productivity ..................................................................... 18
3.7 Catalytic effects ........................................................................................ 19
3.7.1 Benefits to South African tourism .................................................... 19
3.7.2 Benefits to South African trade ........................................................ 20
4 Conclusion ..................................................................................... 22
Annex: Our methods .............................................................................. 23
Benefits to passengers and shippers ........................................................... 23
Connectivity Index ........................................................................................ 23
Benefits to tourism ........................................................................................ 23
Economic footprint ........................................................................................ 24
Passenger and freight volumes .................................................................... 25
South Africa country report
3
Facts & figures
South African aviation’s economic benefits
Air transport to, from and within South Africa creates three distinct types of economic benefit. Typically,
studies such as this focus on the „economic footprint‟ of the industry, measured by its contribution to GDP,
jobs and tax revenues generated by the sector and its supply chain. But the economic value created by
the industry is more than that. The principal benefits are created for the customer, the passenger or
shipper using the air transport service. In addition, the connections created between cities and markets
represent an important infrastructure asset that generates benefits through enabling foreign direct
investment, business clusters, specialization and other spill-over impacts on an economy‟s productive
capacity.
1. Aviation’s economic footprint
Contribution to South African GDP
The aviation sector contributes ZAR50.9 billion (2.1%) to South African GDP. This total comprises:
ZAR20.1 billion directly contributed through the output of the aviation sector (airlines, airports and
ground services, aerospace);
ZAR21.0 billion indirectly contributed through the aviation sector‟s supply chain; and
ZAR9.8 billion contributed through the induced effects of spending by the employees of the aviation
sector and its supply chain.
In addition there are ZAR23.4 billion in „catalytic‟ benefits through tourism which raise the overall
contribution to ZAR74.3 billion or 3.1% of GDP.
Major employer
The aviation sector supports 227,000 jobs in South Africa. This total comprises:
56,000 jobs directly supported by the aviation sector;
116,000 jobs indirectly supported through the aviation sector‟s supply chain; and
54,000 jobs supported through the spending by the employees of the aviation sector and its supply
chain.
In addition there are a further 116,000 people employed through the catalytic (tourism) effects of
aviation.
High productivity jobs
The average air transport services employee generates ZAR721,132 in Gross Value Added (GVA)
annually, which is over 4 times more productive than the average in South Africa.
Contribution to public finances
The aviation sector pays nearly ZAR6.0 billion in tax. Taxes paid by aviation firms and employees
contribute around ZAR3.5 billion towards this figure, with passenger departure taxes including VAT
contributing a further ZAR2.4 billion. It is estimated that an additional ZAR5.0 billion of government
revenue is raised via the aviation sector‟s supply chain and ZAR2.3 billion through taxation of the
activities supported by the spending of employees of both the aviation sector and its supply chain.The
South Africa country report
4
South African government announced in early 2011 plans to increase Air Passenger Tax by more than
25%, starting from October 2011. If implemented this would add approximately ZAR0.3 billion to the
taxes paid. The analysis in this report does not take into account the adverse impact of this tax increase
on economic benefits.
Aerospace manufacturing benefits
South Africa has a significant aviation manufacturing sector, generating ZAR1.8 billion direct, ZAR4.6
billion indirect, and ZAR0.8 billion induced benefit to GDP.
Aerospace manufacturers directly employ 7,000 people. The supply chain supports another 25,000 jobs,
with a further 4,000 of induced employment.
Taking all these channels into account, aerospace supports 37,000 jobs, and contributes ZAR7.1 billion to
South African GDP.
2. Consumer benefits for passengers and shippers
From visiting family and friends to shipping high value products, 21 million passengers and over 240,000
tonnes of freight travelled to, from and within South Africa. More than 52,500 scheduled international
flights depart South Africa annually, destined for 77 airports in 51 countries. Domestically, more than
156,000 flights make over 17 million seats available to passengers annually, destined to 17 airports.
Air passengers resident in South Africa comprise approximately 10.5 million of the passenger total. For
the 21 million passenger flights in total, passengers pay ZAR118.7 billion (inclusive of tax), with South
African residents paying around ZAR59.4 billion. This expenditure is likely to significantly understate the
value passengers actually attach to the flights they use (see Section 1). Calculations by Oxford Economics
suggest the value of the benefit to travellers from flying, in excess of their expenditure, is worth ZAR104.3
billion a year (ZAR52.1 billion for South African residents).
Air transport is crucial for the distribution of high value to weight products. Air freight may only account for
0.5% of the tonnage of global trade with the rest of the world, but in value terms it makes up around 34.6%
of the total.
Shippers pay airlines ZAR6.6 billion annually to carry over 240,000 tonnes of freight to, from and within
South Africa. The benefit to shippers, in excess of this expenditure, is estimated as ZAR2.8 billion. Based
on the share of exports in total merchandise trade, South African shippers receive around half of this
benefit (ZAR1.4 billion).
3. Enabling long-term economic growth
In 2010 there were 66 routes per week connecting major airports in South Africa to urban agglomerations
around the world. On average there were 4 outbound flights per day along these routes. A total of 12 of
these routes were connecting South Africa to cities of more than 10 million inhabitants, with an average of
1.5 outbound flights per day available to passengers. Many of these city-pair connections are only
possible because of the traffic density provided by hub airports. South Africa‟s integration into the global
air transport network transforms the possibilities for the South African economy by:
Opening up foreign markets to South African exports;
South Africa country report
5
Lowering transport costs, particularly over long distances, helping to increase competition because
suppliers can service a wider area and potentially reduce average costs, through increased
economies of scale;
Increasing the flexibility of labour supply, which should enhance allocative efficiency and bring down
the natural rate of unemployment;
Encouraging South African businesses to invest and specialise in areas that play to the economy‟s
strengths;
Speeding the adoption of new business practices, such as just-in-time-inventory management that
relies on quick and reliable delivery of essential supplies;
Raising productivity and hence the economy‟s long-run supply capacity. It is estimated that a 10%
improvement in connectivity relative to GDP would see a ZAR1.5 billion per annum increase in long-
run GDP for the South African economy.
This report describes these channels in more detail.
Section 1 quantifies the benefits of air travel for air passengers and air freight shippers.
Section 2 examines the way in which the aviation sector supports long-run prosperity: by delivering supply-
side benefits through a variety of different channels, which help to increase the economy‟s level of
productivity, and hence its long-term sustainable rate of growth.
Section 3 analyses the economic footprint of the aviation sector - the airlines, the ground-based
infrastructure, aerospace manufacturing and spillover effects on tourism and trade - to quantify the value of
its output and the jobs it supports in South Africa.
South Africa country report
6
1 Consumer benefits for passengers and shippers
The aviation sector – comprising the airlines together with the airports, air navigation and other essential
grounds services that make up the air transport infrastructure - carries over 21 million passengers1 and
over 240,000 tonnes of air freight to, from and within South Africa. More than 52,500 scheduled
international flights depart South Africa annually, destined for 77 airports in 51 countries. Domestically,
more than 156,000 flights make over 17 million seats available to passengers annually, destined to 17
airports2.
Among the many reasons that people and businesses use air transport, people rely on it for holidays and
visiting friends and family; while businesses use air transport for meeting clients and for the speedy and
reliable delivery of mail and goods often over great distances. For this reason, the air transport network
has been called the Real World Wide Web3.
The most important economic benefit generated by air transport is the value generated for its consumers,
passengers and shippers. Passengers spent ZAR118.7 billion (inclusive of tax) on air travel in 2009 and
shippers spent ZAR6.6 billion on the transportation of air cargo4. With its speed, reliability and reach there
is no close alternative to air transport for many of its customers. This means that many are likely to value
air services higher than what might be suggested by their expenditure on these services. But this
economic value will vary from flight to flight, and from consumer to consumer, making it difficult to
measure.
1.1 Consumer benefits
The value of consumer benefit varies because as you fly more often, the value you attach to each
additional flight will in general fall. As frequent flyers know, the more they fly, the less excited they get
when they step on a plane. There comes a point when the fare exceeds the value we place on taking an
additional flight, and we choose instead to spend our money on other things. For this reason the air fares
that we are willing-to-pay do not reflect the value we place on air transport so much as the value we place
on the last flight we have flown. Much the same applies to the market as a whole. Air fares reflect the
value placed on the service by the marginal passengers - those who would forgo the flight were prices to
rise - and not the value that passengers as a whole place on air transport services.
For this reason, valuing the consumer benefits for air passengers and air freight shippers can not be
inferred simply from observed fares and shipping charges. In addition to the fares paid, we need an idea of
how the passengers and shippers value air transport other than at the margin. Unfortunately there is no
readily available data on this, and so we must rely instead on judgement, informed by economic theory, to
guide us. Economics tells us that the estimated benefits hinge on the sensitivity of demand to changes in
fares – the price elasticity of demand. Estimates of prices elasticities are available from previous research.
Economic theory also tells us that price elasticities will fall as we move away from the margin, but it offers
less guidance on how much they may fall by. This matters, because lower the price elasticity – the less
sensitive passengers are to a change in price – the higher the consumer benefit.
1 This is a count of passengers on domestic flights as well as passengers arriving and departing on international flights. Each
passenger connecting to another flight at a South African airport is counted once on their arriving flight and again on their departing flight. 2 Annual estimate of international and domestic operations for 2010 based on airline schedules published by SRSAnalyzer.
3 “Aviation – The Real World Wide Web”, by Oxford Economics. Available at http://www.oxfordeconomics.com/samples/airbus.pdf
4 Passenger spending based on fares from IATA‟s PaxIS database plus estimates for taxes and surcharges paid. Cargo spending
based on freight rates from IATA‟s CargoIS database.
South Africa country report
7
It follows that taxation of air travel or cargo directly reduces the economic benefit of all passengers and
shippers, as well as, at the margin, stopping a number of people travelling and stopping a number of
shippers using air cargo services.
1.2 Estimated consumer benefits
Given its sensitivity to our assumption about how price elasticities vary, we have taken a very conservative
assumption that probably understates the true benefits (see Annex). With this in mind, we calculate that
air passengers and shippers valued the air transport services they used at over ZAR223.0 billion and
ZAR9.4 billion respectively. Contained within these amounts, the consumer benefits derived on top of that
measured by expenditure on travel and shipments were about ZAR104.3 billion for passengers and
ZAR2.8 billion for shippers.
The total benefits accruing to passengers using the South African air transport system will include those
related to residents and non-residents as well as passengers already being accounted for under the
benefits associated with the economy at the other end of international routes. To avoid double counting
and to estimate the benefits accruing to South African residents we have assumed that 50% of passengers
in the South African market are residents. This is in line with the proportion of residents in other markets
and would indicate that approximately 10.5 million of the 21 million passengers using air transport services
to, from and within South Africa were South African residents. As for the share of freight shipped by firms
based in South Africa, data is not readily available. To give a broad indication we have used instead the
share of exports in total merchandise trade. This is estimated to be 50.2% of the total trade in goods in
20095. From this we estimate that, out of the consumer benefits generated by South African air transport
and on top of that measured by expenditure, South African citizens derived ZAR52.1 billion in value and
South African shippers around ZAR1.4 billion in value.
5 Oxford Economics Global Macroeconomic Model
South Africa country report
8
2 Enabling long-term economic growth
2.1 Connectivity and the cost of air transport services
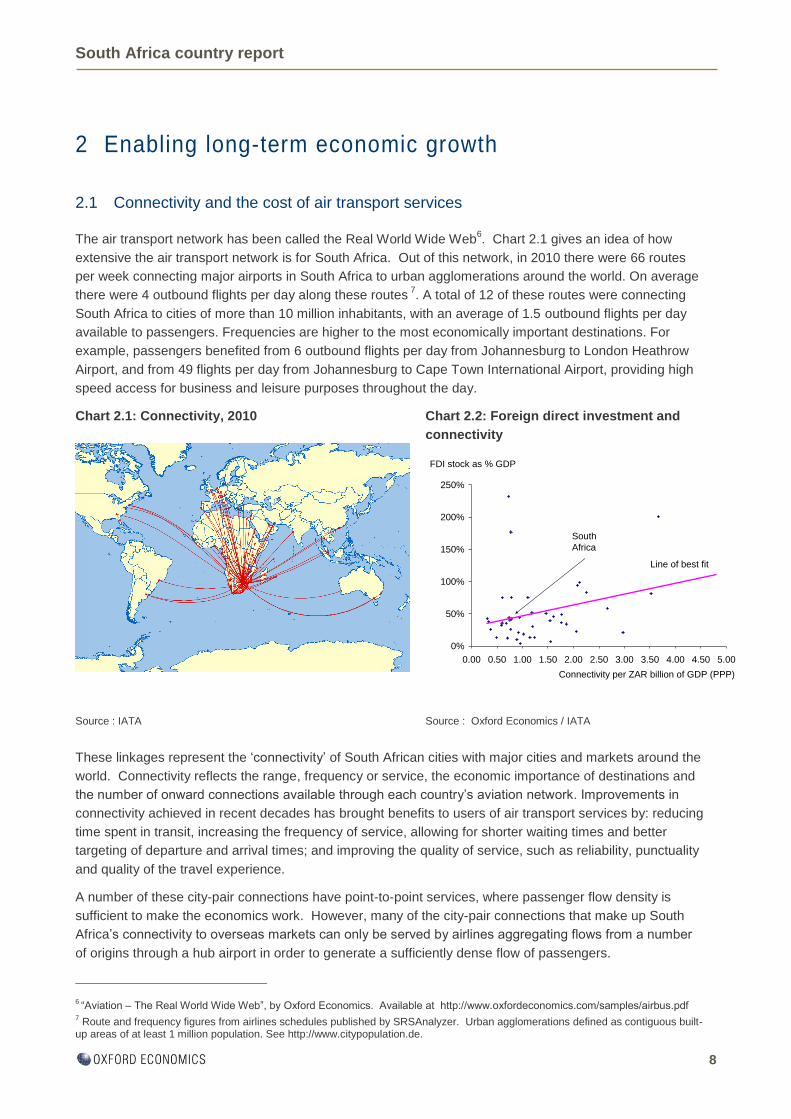
The air transport network has been called the Real World Wide Web6. Chart 2.1 gives an idea of how
extensive the air transport network is for South Africa. Out of this network, in 2010 there were 66 routes
per week connecting major airports in South Africa to urban agglomerations around the world. On average
there were 4 outbound flights per day along these routes 7. A total of 12 of these routes were connecting
South Africa to cities of more than 10 million inhabitants, with an average of 1.5 outbound flights per day
available to passengers. Frequencies are higher to the most economically important destinations. For
example, passengers benefited from 6 outbound flights per day from Johannesburg to London Heathrow
Airport, and from 49 flights per day from Johannesburg to Cape Town International Airport, providing high
speed access for business and leisure purposes throughout the day.
Chart 2.1: Connectivity, 2010 Chart 2.2: Foreign direct investment and
connectivity
Source : IATA
Source : Oxford Economics / IATA
These linkages represent the „connectivity‟ of South African cities with major cities and markets around the
world. Connectivity reflects the range, frequency or service, the economic importance of destinations and
the number of onward connections available through each country‟s aviation network. Improvements in
connectivity achieved in recent decades has brought benefits to users of air transport services by: reducing
time spent in transit, increasing the frequency of service, allowing for shorter waiting times and better
targeting of departure and arrival times; and improving the quality of service, such as reliability, punctuality
and quality of the travel experience.
A number of these city-pair connections have point-to-point services, where passenger flow density is
sufficient to make the economics work. However, many of the city-pair connections that make up South
Africa‟s connectivity to overseas markets can only be served by airlines aggregating flows from a number
of origins through a hub airport in order to generate a sufficiently dense flow of passengers.
6 “Aviation – The Real World Wide Web”, by Oxford Economics. Available at http://www.oxfordeconomics.com/samples/airbus.pdf
7 Route and frequency figures from airlines schedules published by SRSAnalyzer. Urban agglomerations defined as contiguous built-
up areas of at least 1 million population. See http://www.citypopulation.de.
0%
50%
100%
150%
200%
250%
0.00 0.50 1.00 1.50 2.00 2.50 3.00 3.50 4.00 4.50 5.00
FDI stock as % GDP
Connectivity per ZAR billion of GDP (PPP)
South
Africa
Line of best fit
South Africa country report
9
Improvements in connectivity have been accompanied by a steady fall in the cost of air transport services.
The cost of air transport services, in real terms, has fallen by around 1% a year over the past 40 years,
contributing to the rapid expansion in the volume of trade seen over this period8. Air transport has also
steadily become more competitive relative to other modes of transport. For example, it is estimated that its
relative cost has been falling by around 2.5% a year since the 1990s9. As its relative cost has fallen, air
shipments have become increasingly important for international trade. The European Union, for instance,
which reports data on the value of cargo carried by different modes of transport, has 22% of its trade with
the rest of the world carried by air.
Apart from the benefits to direct users of air transport services, the largest economic benefit of increased
connectivity comes through its impact on the long term performance of the wider economy.
2.2 How aviation enhances economic performance
Improvements in connectivity contribute to the economic performance of the wider economy through
enhancing its overall level of productivity. This improvement in productivity in firms outside the aviation
sector comes through two main channels: through the effects on domestic firms of increased access to
foreign markets, and increased foreign competition in the home market, and through the freer movement of
investment capital and workers between countries.
Improved connectivity gives South African-based businesses greater access to foreign markets,
encouraging exports, and at the same time increases competition and choice in the home market from
foreign-based producers. In this way, improved connectivity encourages firms to specialise in areas where
they possess a comparative advantage. Where firms enjoy a comparative advantage, international trade
provides the opportunity to better exploit economies of scale, driving down their costs and prices and
thereby benefiting domestic consumers in the process. Opening domestic markets to foreign competitors
can also be an important driver behind reducing unit production costs, either by forcing domestic firms to
adopt best international practices in production and management methods or by encouraging innovation.
Competition can also benefit domestic customers by reducing the mark-up over cost that firms charge their
customers, especially where domestic firms have hitherto enjoyed some shelter from competition.
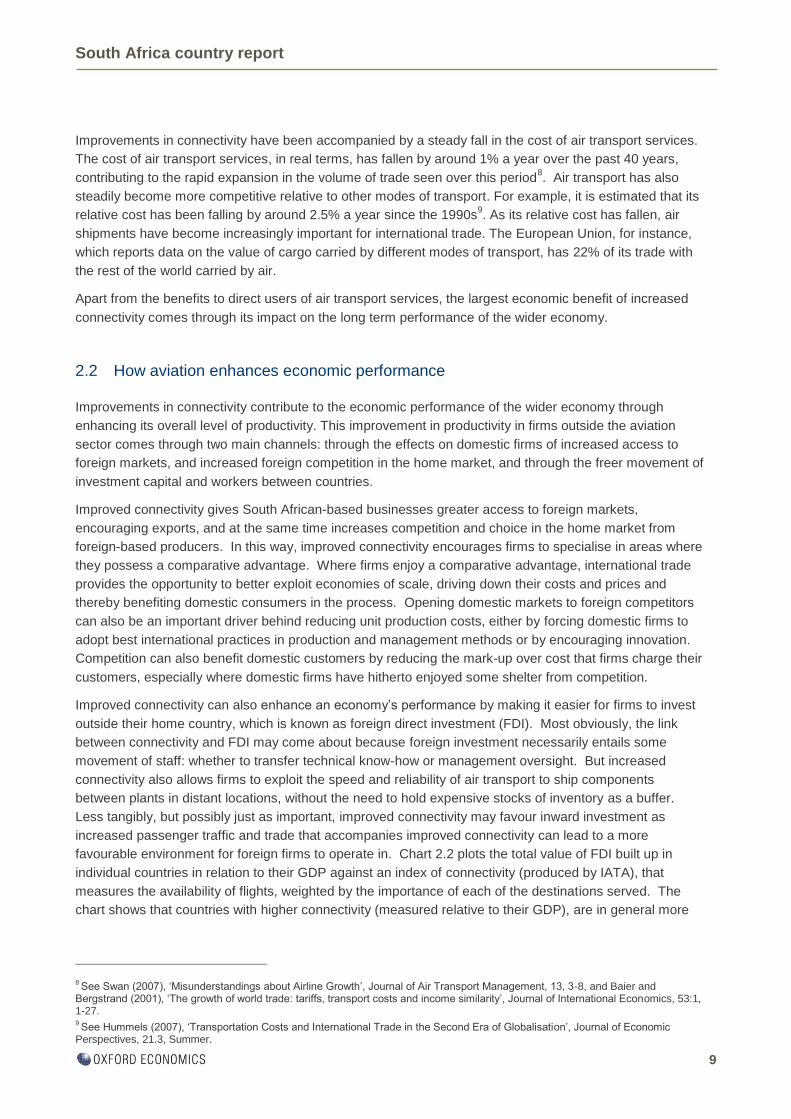
Improved connectivity can also enhance an economy‟s performance by making it easier for firms to invest
outside their home country, which is known as foreign direct investment (FDI). Most obviously, the link
between connectivity and FDI may come about because foreign investment necessarily entails some
movement of staff: whether to transfer technical know-how or management oversight. But increased
connectivity also allows firms to exploit the speed and reliability of air transport to ship components
between plants in distant locations, without the need to hold expensive stocks of inventory as a buffer.
Less tangibly, but possibly just as important, improved connectivity may favour inward investment as
increased passenger traffic and trade that accompanies improved connectivity can lead to a more
favourable environment for foreign firms to operate in. Chart 2.2 plots the total value of FDI built up in
individual countries in relation to their GDP against an index of connectivity (produced by IATA), that
measures the availability of flights, weighted by the importance of each of the destinations served. The
chart shows that countries with higher connectivity (measured relative to their GDP), are in general more
8 See Swan (2007), „Misunderstandings about Airline Growth‟, Journal of Air Transport Management, 13, 3-8, and Baier and
Bergstrand (2001), „The growth of world trade: tariffs, transport costs and income similarity‟, Journal of International Economics, 53:1, 1-27. 9 See Hummels (2007), „Transportation Costs and International Trade in the Second Era of Globalisation‟, Journal of Economic
Perspectives, 21.3, Summer.
South Africa country report
10
successful at attracting foreign direct investment. This is emphasised by the upward sloping line that
confirms the statistical relationship between greater connectivity and greater FDI.
2.3 Connectivity and long-term growth
A thought experiment considering the impact on trade from eliminating the air transport network suggests
the economic benefit of connectivity is substantial. Moreover, the experience of businesses in Europe
during the volcanic ash-induced airspace closures of 2010, as just-in-time supply chains failed, provides a
more concrete illustration of how dependent modern economies are on their air transport infrastructures.
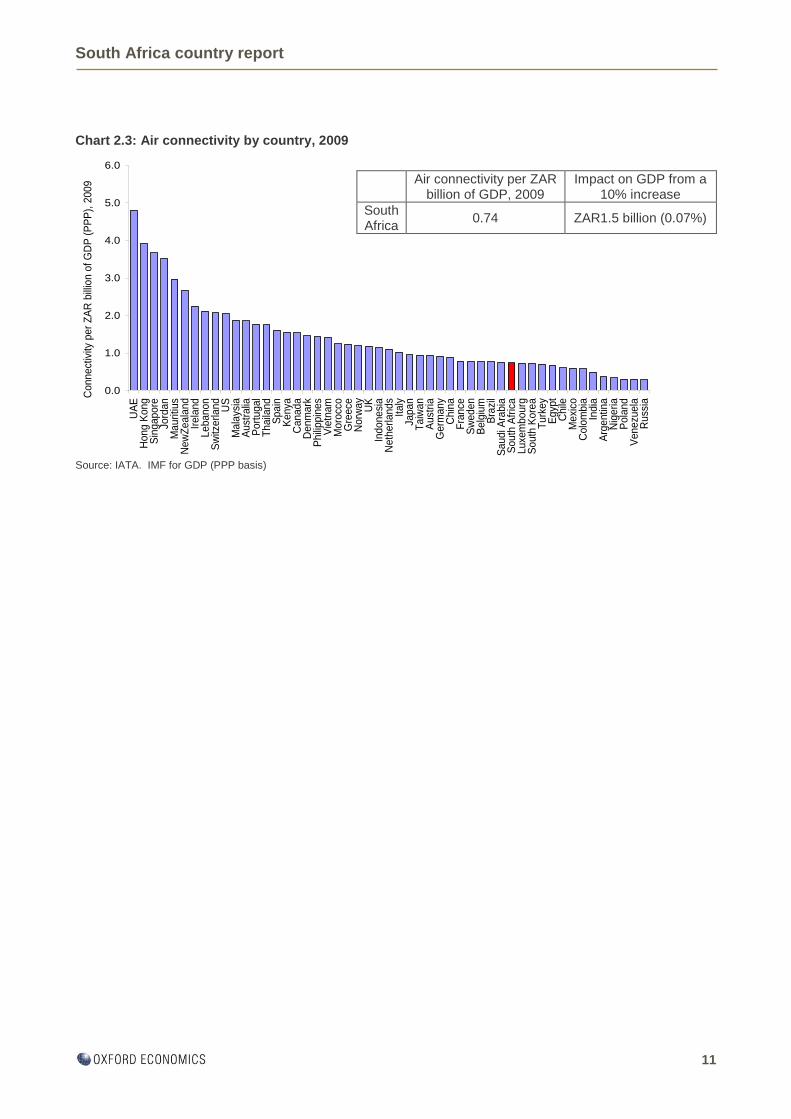
A number of recent studies have attempted to quantify the long-term impact on a country‟s GDP that
results from an improvement in connectivity. Measuring connectivity is not straightforward. Chart 2.3
shows one measure of South African connectivity, compared to other economies (see Annex for details)10
.
Given that the supply-side benefits of connectivity come through promoting international trade and inward
investment, any impact is likely to manifest itself gradually over time. This protracted adjustment makes it
very challenging to disentangle the contribution that improved connectivity has had on long-term growth,
from the many of other factors that affect an economy‟s performance. This issue is reflected in the wide
range of estimates that studies have reached for connectivity‟s impact on long-run growth. Three studies
undertaken in 2005 and 2006 provide estimates of the impact that connectivity can have on long-run level
of productivity (and hence GDP). The mechanisms through which connectivity generates this economic
benefit are those described in Section 2.2. These studies suggest that a 10% increase in connectivity
(relative to GDP) will raise the level of productivity in the economy by a little under 0.5% in the long run,
with there being a fair degree of uncertainty around this average estimate11
. A much wider 2006 study,
based on a cross-country statistical analysis of connectivity and productivity, derived a lower estimate of
0.07% for the elasticity between connectivity and long-run productivity12
.
Given the uncertainty about the correct elasticity, here we adopt the elasticity of 0.07 derived from the
2006 study, as the lowest estimate among the available studies it provides a conservative estimate of the
impact of connectivity on long-term GDP. Based on this estimate, a 10% improvement in South Africa‟s
connectivity (relative to GDP) would see a ZAR1.5 billion per annum increase in long-run GDP.
10 This measure emphasises passenger connectivity and as such will reflect the freight connectivity associated with belly cargo capacity
in passenger aircraft but may not fully capture that provided by all-cargo operations or integrator networks.
11 „The Economic Catalytic Effects of Air Transport in Europe‟, by Oxford Economic Forecasting (2005) on behalf of the EUROCONTROL
Experimental Centre and „The Economic Contribution of the Aviation Industry in the UK‟, by Oxford Economic Forecasting (2006). These studies also allow for connectivity to increase the long-run level of GDP through increasing investment. Allowing for this additional channel raises the total impact of a 10% increase in connectivity relative to GDP on long-run GDP to over 1%. 12
“Measuring the Economic Rate of Return on Investment in Aviation” by InterVISTAS Consulting Inc. (2006)
South Africa country report
11
Chart 2.3: Air connectivity by country, 2009
Source: IATA. IMF for GDP (PPP basis)
0.0
1.0
2.0
3.0
4.0
5.0
6.0
UA
EH
ong K
ong
Sin
gapore
Jord
an
Mauritiu
sN
ew
Zeala
nd
Irela
nd
Lebanon
Sw
itzerland
US
Mala
ysia
Aust
ralia
Port
ugal
Thaila
nd
Spain
Kenya
Canada
Denm
ark
Phili
ppin
es
Vie
tnam
Moro
cco
Gre
ece
Norw
ay
UK
Indonesi
aN
eth
erlands
Italy
Japan
Taiw
an
Aust
ria
Germ
any
Chin
aF
rance
Sw
eden
Belg
ium
Bra
zil
Saudi A
rabia
South
Afr
ica
Luxe
mbourg
South
Kore
aT
urk
ey
Egyp
tC
hile
Mexi
coC
olo
mbia
India
Arg
entin
aN
igeria
Pola
nd
Venezu
ela
Russ
ia
Connect
ivity
per
ZA
R b
illio
n o
f G
DP
(P
PP
), 2
009 Air connectivity per ZAR
billion of GDP, 2009 Impact on GDP from a
10% increase
South Africa
0.74 ZAR1.5 billion (0.07%)
South Africa country report
12
3 Economic footprint
Sections 1 and 2 have looked at the benefits of air transport services for its customers, and the longer-term
benefits that come through increasing long-term growth in the economy as a whole. In this section we turn
to the domestic resources that the aviation sector currently deploys to deliver its services, together with the
domestic goods and services consumed by the workers who depend on the sector for their employment.
We call the value added and jobs supported by this economic activity the aviation sector‟s „economic
footprint‟.
The resources deployed by the aviation sector are measured by its Gross Value Added (GVA). GVA is
calculated either as the output created by the sector less the cost of purchased inputs (net output
measure), or by the sum of profits and wages (before tax) generated from the sector‟s economic activity
(income measure). The two approaches are equivalent. Using either approach, by adding the GVA of all
firms in the economy, one derives an estimate for the economy‟s overall output (GDP)13
. We refer to this
as the sector‟s direct contribution to GDP.
From this direct contribution, the sector‟s economic footprint is calculated by adding to it the output (and
jobs) supported through two other channels, which we refer to as the indirect and the induced
contributions. The indirect contribution measures the resources deployed by the aviation sector through
using domestically produced goods and services produced by other firms – i.e. the resources used through
its supply chain. The GVA generated through the indirect and direct channels supports jobs both in the
aviation sector and in its supply chain. The workers whose employment depends on this activity in turn
spend their wages on goods and services. The induced contribution is the value of the domestic goods
and services purchased by this workforce. Taken together, these three channels give the aviation sector‟s
economic footprint in terms of GVA and jobs.
The aviation sector contributes to the economy in two other ways. Through the taxes levied on GVA
(recall that it is equal to the sum of profits and wages), the aviation sector supports the public finances, and
the public services that depend on them. Second, through its investment and its use of advanced
technology, the aviation sector generates more GVA per employee than the economy as a whole, raising
the overall productivity of the economy. These issues are discussed at the end of this section.
3.1 The aviation sector and its economic footprint
The sector is comprised of three distinct types of activity:
- Airlines transporting people and freight.
- Ground-based infrastructure that includes the airport facilities, the services provided for
passengers on-site at airports, such as baggage handling, ticketing and retail and catering
services, together with essential services provided off-site, such as air navigation and air
regulation.
- Aerospace manufacturing that builds and maintains aircraft systems, airframes and engines.
The aviation sector supports GDP and the employment in South Africa through four distinct channels.
These channels are:
13 It is only true to an approximation that GVA is equal to the sum of profit and wages, or that the sum of GVA across firms equals
GDP. The difference in each case, however, is small enough for us to proceed as if the equalities do in fact hold. The differences are explained in Annex A to this report.
South Africa country report
13
- Direct – the output and employment of the firms in the aviation sector.
- Indirect – the output and employment supported through the aviation sector‟s South African based
supply chain.
- Induced – employment and output supported by the spending of those directly or indirectly
employed in the aviation sector.
- Catalytic – spillover benefits associated with the aviation sector. Some of these include the
activity supported by the spending of foreign visitors travelling to South Africa via air, and the level
of trade directly enabled by the transportation of merchandise.
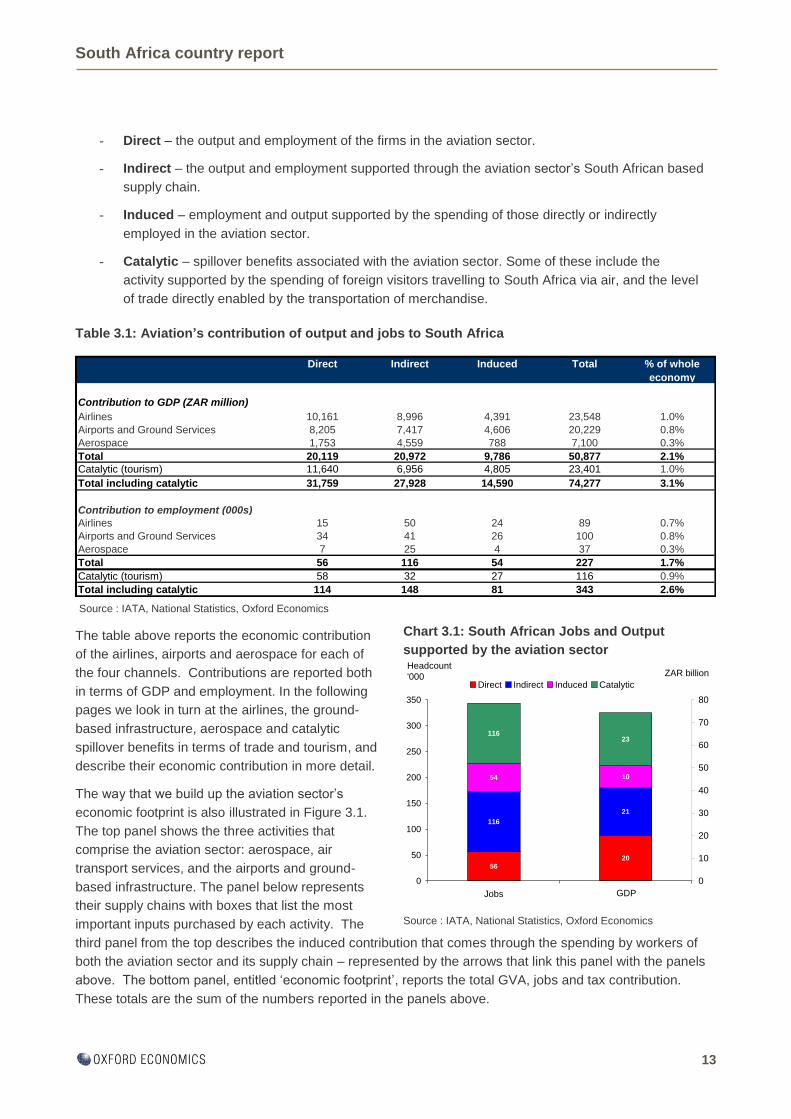
Table 3.1: Aviation’s contribution of output and jobs to South Africa
Source : IATA, National Statistics, Oxford Economics
The table above reports the economic contribution
of the airlines, airports and aerospace for each of
the four channels. Contributions are reported both
in terms of GDP and employment. In the following
pages we look in turn at the airlines, the ground-
based infrastructure, aerospace and catalytic
spillover benefits in terms of trade and tourism, and
describe their economic contribution in more detail.
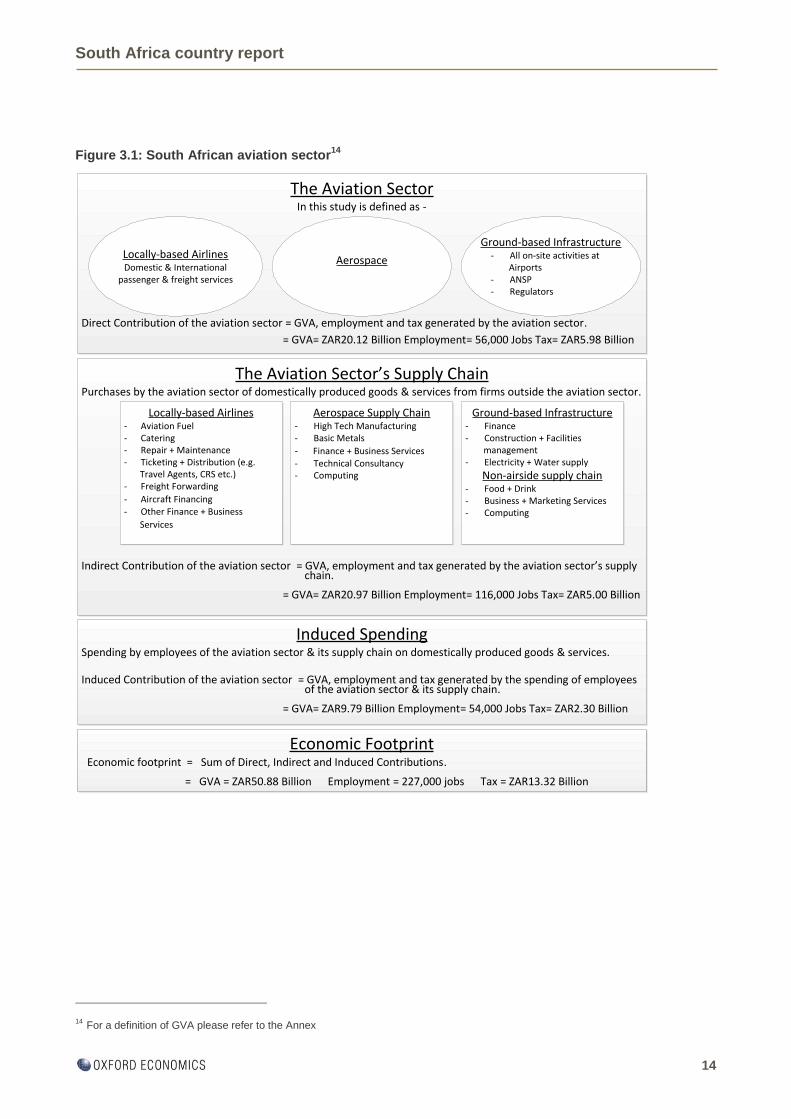
The way that we build up the aviation sector‟s
economic footprint is also illustrated in Figure 3.1.
The top panel shows the three activities that
comprise the aviation sector: aerospace, air
transport services, and the airports and ground-
based infrastructure. The panel below represents
their supply chains with boxes that list the most
important inputs purchased by each activity. The
third panel from the top describes the induced contribution that comes through the spending by workers of
both the aviation sector and its supply chain – represented by the arrows that link this panel with the panels
above. The bottom panel, entitled „economic footprint‟, reports the total GVA, jobs and tax contribution.
These totals are the sum of the numbers reported in the panels above.
Chart 3.1: South African Jobs and Output
supported by the aviation sector
Source : IATA, National Statistics, Oxford Economics
Direct Indirect Induced Total % of whole
economy
Contribution to GDP (ZAR million)
Airlines 10,161 8,996 4,391 23,548 1.0%
Airports and Ground Services 8,205 7,417 4,606 20,229 0.8%
Aerospace 1,753 4,559 788 7,100 0.3%
Total 20,119 20,972 9,786 50,877 2.1%
Catalytic (tourism) 11,640 6,956 4,805 23,401 1.0%
Total including catalytic 31,759 27,928 14,590 74,277 3.1%
Contribution to employment (000s)
Airlines 15 50 24 89 0.7%
Airports and Ground Services 34 41 26 100 0.8%
Aerospace 7 25 4 37 0.3%
Total 56 116 54 227 1.7%
Catalytic (tourism) 58 32 27 116 0.9%
Total including catalytic 114 148 81 343 2.6%
56
54
116
116
20
10
21
23
0
50
100
150
200
250
300
350
Jobs
0
10
20
30
40
50
60
70
80
Direct Indirect Induced Catalytic
Headcount
'000 ZAR billion
GDP
South Africa country report
14
Figure 3.1: South African aviation sector14
14 For a definition of GVA please refer to the Annex
The Aviation SectorIn this study is defined as -
Locally-based AirlinesDomestic & International
passenger & freight services
Ground-based Infrastructure- All on-site activities at Airports- ANSP- Regulators
Direct Contribution of the aviation sector = GVA, employment and tax generated by the aviation sector. = GVA= ZAR20.12 Billion Employment= 56,000 Jobs Tax= ZAR5.98 Billion
The Aviation Sector’s Supply ChainPurchases by the aviation sector of domestically produced goods & services from firms outside the aviation sector.
Locally-based Airlines- Aviation Fuel- Catering- Repair + Maintenance- Ticketing + Distribution (e.g. Travel Agents, CRS etc.)- Freight Forwarding
- Aircraft Financing- Other Finance + Business
Services
Ground-based Infrastructure- Finance- Construction + Facilities management - Electricity + Water supply
Non-airside supply chain- Food + Drink- Business + Marketing Services- Computing
Indirect Contribution of the aviation sector = GVA, employment and tax generated by the aviation sector’s supply chain. = GVA= ZAR20.97 Billion Employment= 116,000 Jobs Tax= ZAR5.00 Billion
Induced SpendingSpending by employees of the aviation sector & its supply chain on domestically produced goods & services.
Induced Contribution of the aviation sector = GVA, employment and tax generated by the spending of employees of the aviation sector & its supply chain. = GVA= ZAR9.79 Billion Employment= 54,000 Jobs Tax= ZAR2.30 Billion
Economic FootprintEconomic footprint = Sum of Direct, Indirect and Induced Contributions. = GVA = ZAR50.88 Billion Employment = 227,000 jobs Tax = ZAR13.32 Billion
Aerospace Supply Chain- High Tech Manufacturing- Basic Metals
- Finance + Business Services- Technical Consultancy- Computing
Aerospace
South Africa country report
15
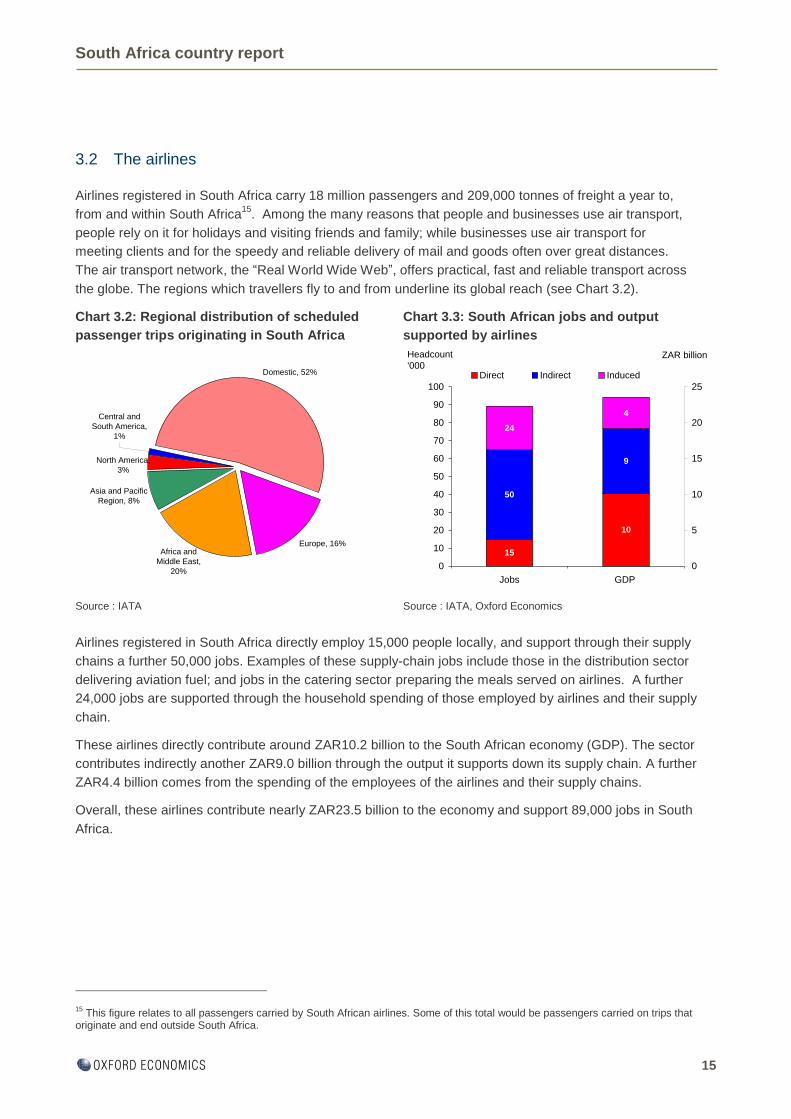
3.2 The airlines
Airlines registered in South Africa carry 18 million passengers and 209,000 tonnes of freight a year to,
from and within South Africa15
. Among the many reasons that people and businesses use air transport,
people rely on it for holidays and visiting friends and family; while businesses use air transport for
meeting clients and for the speedy and reliable delivery of mail and goods often over great distances.
The air transport network, the “Real World Wide Web”, offers practical, fast and reliable transport across
the globe. The regions which travellers fly to and from underline its global reach (see Chart 3.2).
Chart 3.2: Regional distribution of scheduled
passenger trips originating in South Africa
Chart 3.3: South African jobs and output
supported by airlines
Source : IATA Source : IATA, Oxford Economics
Airlines registered in South Africa directly employ 15,000 people locally, and support through their supply
chains a further 50,000 jobs. Examples of these supply-chain jobs include those in the distribution sector
delivering aviation fuel; and jobs in the catering sector preparing the meals served on airlines. A further
24,000 jobs are supported through the household spending of those employed by airlines and their supply
chain.
These airlines directly contribute around ZAR10.2 billion to the South African economy (GDP). The sector
contributes indirectly another ZAR9.0 billion through the output it supports down its supply chain. A further
ZAR4.4 billion comes from the spending of the employees of the airlines and their supply chains.
Overall, these airlines contribute nearly ZAR23.5 billion to the economy and support 89,000 jobs in South
Africa.
15 This figure relates to all passengers carried by South African airlines. Some of this total would be passengers carried on trips that
originate and end outside South Africa.
Europe, 16%
Asia and Pacific
Region, 8%
North America,
3%
Africa and
Middle East,
20%
Domestic, 52%
Central and
South America,
1%
15
50
24
10
9
4
0
10
20
30
40
50
60
70
80
90
100
Jobs GDP
0
5
10
15
20
25
Direct Indirect Induced
Headcount
'000ZAR billion
South Africa country report
16
3.3 The airports and ground-based services
Airlines need ground-based infrastructure to operate. This infrastructure includes the facilities at South
African airports that directly serve passengers, such as baggage handling, ticketing, retail and catering
outlets. Less visible are the essential services which are sometimes provided off-site, such as air
navigation and air regulation, as well as the local activities of freight integrators.
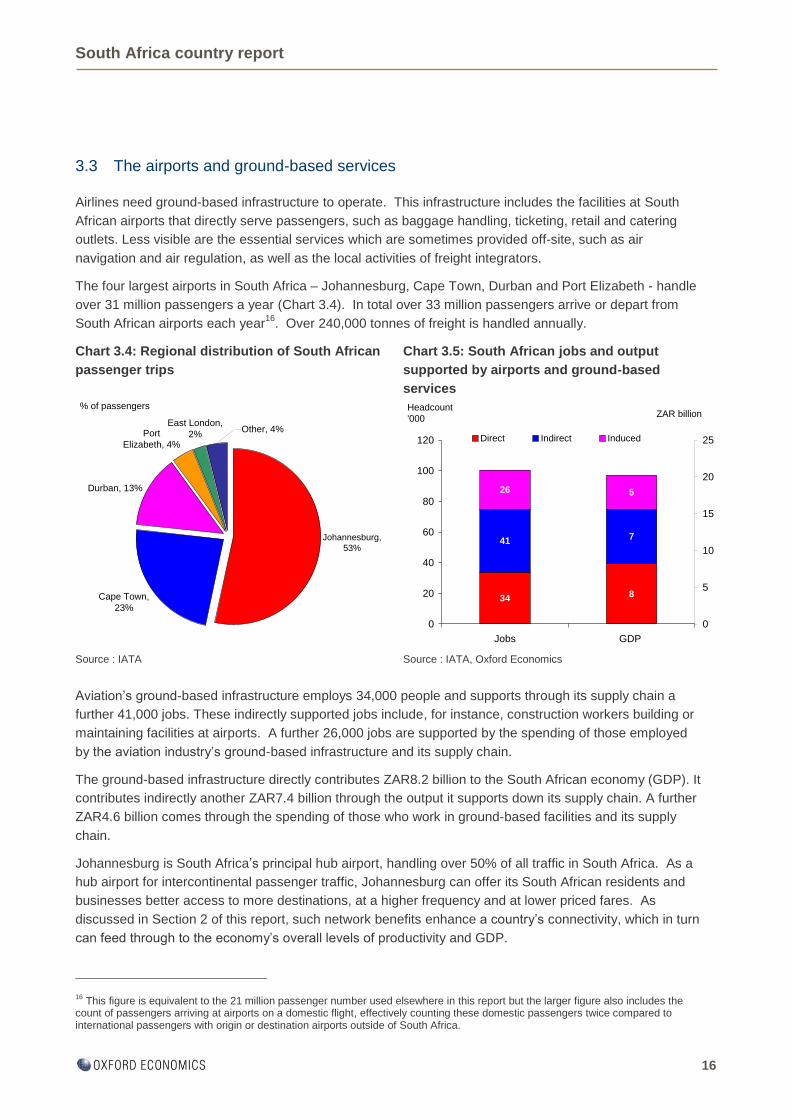
The four largest airports in South Africa – Johannesburg, Cape Town, Durban and Port Elizabeth - handle
over 31 million passengers a year (Chart 3.4). In total over 33 million passengers arrive or depart from
South African airports each year16
. Over 240,000 tonnes of freight is handled annually.
Chart 3.4: Regional distribution of South African
passenger trips
Chart 3.5: South African jobs and output
supported by airports and ground-based
services
Source : IATA Source : IATA, Oxford Economics
Aviation‟s ground-based infrastructure employs 34,000 people and supports through its supply chain a
further 41,000 jobs. These indirectly supported jobs include, for instance, construction workers building or
maintaining facilities at airports. A further 26,000 jobs are supported by the spending of those employed
by the aviation industry‟s ground-based infrastructure and its supply chain.
The ground-based infrastructure directly contributes ZAR8.2 billion to the South African economy (GDP). It
contributes indirectly another ZAR7.4 billion through the output it supports down its supply chain. A further
ZAR4.6 billion comes through the spending of those who work in ground-based facilities and its supply
chain.
Johannesburg is South Africa‟s principal hub airport, handling over 50% of all traffic in South Africa. As a
hub airport for intercontinental passenger traffic, Johannesburg can offer its South African residents and
businesses better access to more destinations, at a higher frequency and at lower priced fares. As
discussed in Section 2 of this report, such network benefits enhance a country‟s connectivity, which in turn
can feed through to the economy‟s overall levels of productivity and GDP.
16 This figure is equivalent to the 21 million passenger number used elsewhere in this report but the larger figure also includes the
count of passengers arriving at airports on a domestic flight, effectively counting these domestic passengers twice compared to international passengers with origin or destination airports outside of South Africa.
34
41
26
8
7
5
0
20
40
60
80
100
120
Jobs GDP
0
5
10
15
20
25Direct Indirect Induced
Headcount
'000ZAR billion
Cape Town,
23%
Port
Elizabeth, 4%
Johannesburg,
53%
Other, 4%
Durban, 13%
East London,
2%
% of passengers
South Africa country report
17
3.4 Aerospace
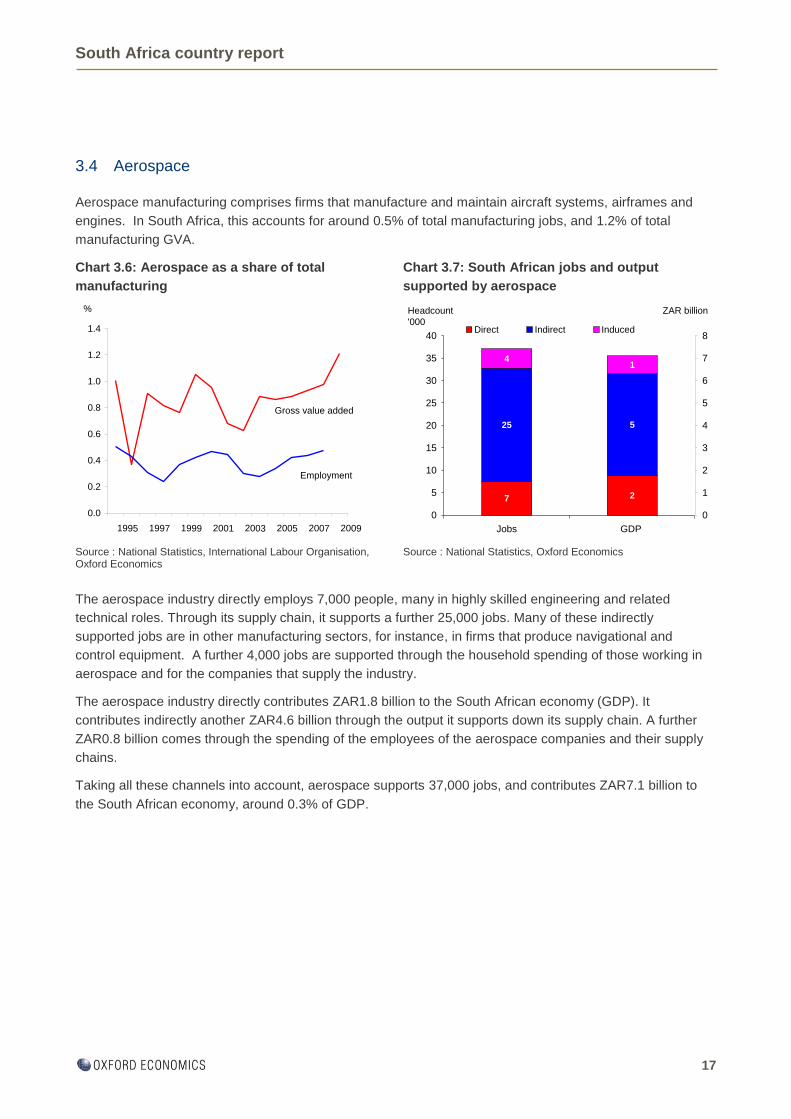
Aerospace manufacturing comprises firms that manufacture and maintain aircraft systems, airframes and
engines. In South Africa, this accounts for around 0.5% of total manufacturing jobs, and 1.2% of total
manufacturing GVA.
Chart 3.6: Aerospace as a share of total
manufacturing
Chart 3.7: South African jobs and output
supported by aerospace
Source : National Statistics, International Labour Organisation, Oxford Economics
Source : National Statistics, Oxford Economics
The aerospace industry directly employs 7,000 people, many in highly skilled engineering and related
technical roles. Through its supply chain, it supports a further 25,000 jobs. Many of these indirectly
supported jobs are in other manufacturing sectors, for instance, in firms that produce navigational and
control equipment. A further 4,000 jobs are supported through the household spending of those working in
aerospace and for the companies that supply the industry.
The aerospace industry directly contributes ZAR1.8 billion to the South African economy (GDP). It
contributes indirectly another ZAR4.6 billion through the output it supports down its supply chain. A further
ZAR0.8 billion comes through the spending of the employees of the aerospace companies and their supply
chains.
Taking all these channels into account, aerospace supports 37,000 jobs, and contributes ZAR7.1 billion to
the South African economy, around 0.3% of GDP.
0.0
0.2
0.4
0.6
0.8
1.0
1.2
1.4
1995 1997 1999 2001 2003 2005 2007 2009
%
Gross value added
Employment
7
25
4
2
5
1
0
5
10
15
20
25
30
35
40
Jobs GDP
0
1
2
3
4
5
6
7
8Direct Indirect Induced
Headcount
'000
ZAR billion
South Africa country report
18
3.5 Tax contribution
Aviation makes a substantial contribution to the public finances. In this section we estimate the
corporation tax paid by aviation companies, the income tax paid by their employees, social security
payments (both employer and employee contributions), and the revenue collected through aviation taxes.
These estimates reflect the direct tax payments of the aviation sector. We also provide an indication of the
taxes paid by the aviation sector‟s supply chain and taxes raised through induced spending channels.
They do not include increases in the overall South African tax base driven by aviation‟s contribution to
investment and productivity growth in the wider economy.
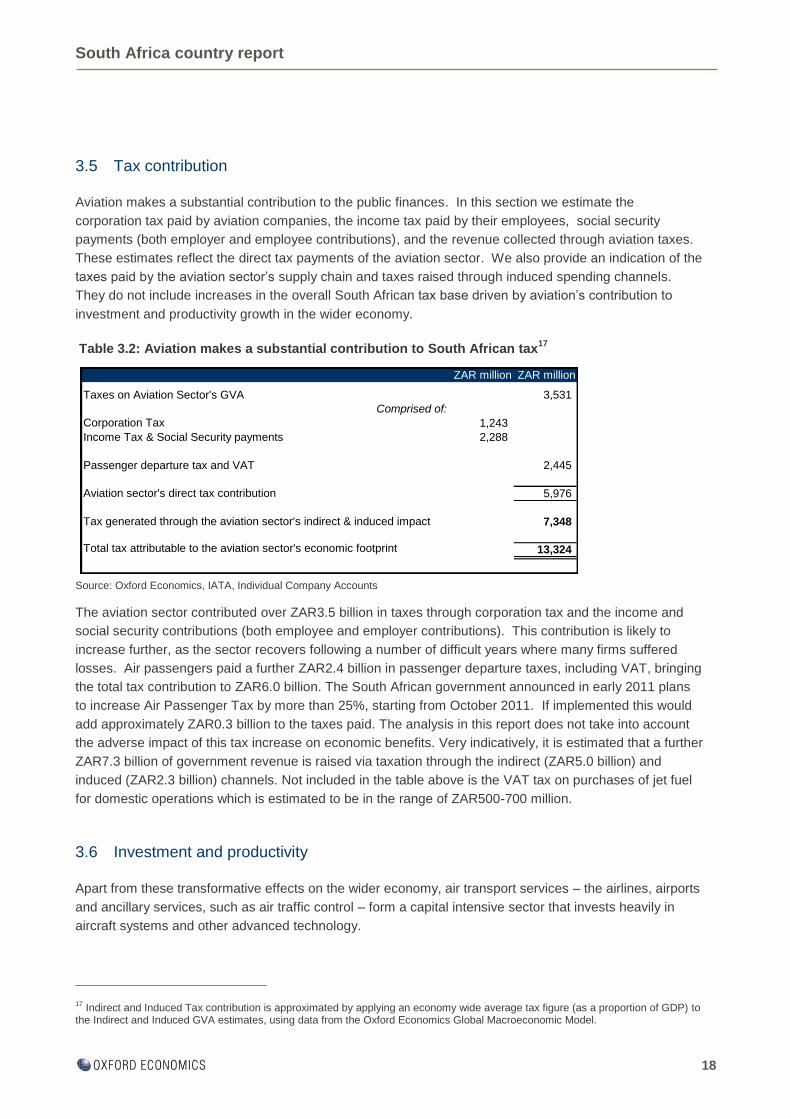
Table 3.2: Aviation makes a substantial contribution to South African tax17
Source: Oxford Economics, IATA, Individual Company Accounts
The aviation sector contributed over ZAR3.5 billion in taxes through corporation tax and the income and
social security contributions (both employee and employer contributions). This contribution is likely to
increase further, as the sector recovers following a number of difficult years where many firms suffered
losses. Air passengers paid a further ZAR2.4 billion in passenger departure taxes, including VAT, bringing
the total tax contribution to ZAR6.0 billion. The South African government announced in early 2011 plans
to increase Air Passenger Tax by more than 25%, starting from October 2011. If implemented this would
add approximately ZAR0.3 billion to the taxes paid. The analysis in this report does not take into account
the adverse impact of this tax increase on economic benefits. Very indicatively, it is estimated that a further
ZAR7.3 billion of government revenue is raised via taxation through the indirect (ZAR5.0 billion) and
induced (ZAR2.3 billion) channels. Not included in the table above is the VAT tax on purchases of jet fuel
for domestic operations which is estimated to be in the range of ZAR500-700 million.
3.6 Investment and productivity
Apart from these transformative effects on the wider economy, air transport services – the airlines, airports
and ancillary services, such as air traffic control – form a capital intensive sector that invests heavily in
aircraft systems and other advanced technology.
17 Indirect and Induced Tax contribution is approximated by applying an economy wide average tax figure (as a proportion of GDP) to
the Indirect and Induced GVA estimates, using data from the Oxford Economics Global Macroeconomic Model.
ZAR million ZAR million
Taxes on Aviation Sector's GVA 3,531
Comprised of:
Corporation Tax 1,243
Income Tax & Social Security payments 2,288
Passenger departure tax and VAT 2,445
Aviation sector's direct tax contribution 5,976
Tax generated through the aviation sector's indirect & induced impact 7,348
Total tax attributable to the aviation sector's economic footprint 13,324
South Africa country report
19
Table 3.3: Investment by the aviation sector Table 3.4: Labour productivity in the aviation
sector
Source: IATA, Oxford Economics Source: IATA, National Statistics, Oxford Economics
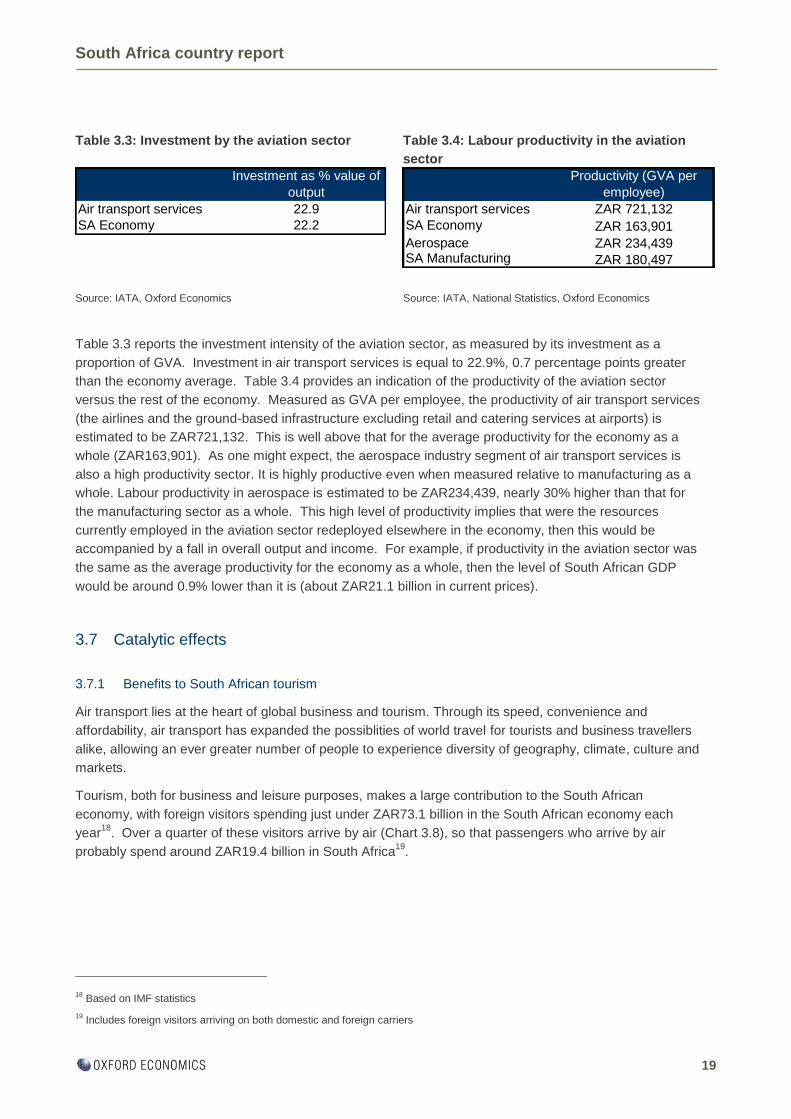
Table 3.3 reports the investment intensity of the aviation sector, as measured by its investment as a
proportion of GVA. Investment in air transport services is equal to 22.9%, 0.7 percentage points greater
than the economy average. Table 3.4 provides an indication of the productivity of the aviation sector
versus the rest of the economy. Measured as GVA per employee, the productivity of air transport services
(the airlines and the ground-based infrastructure excluding retail and catering services at airports) is
estimated to be ZAR721,132. This is well above that for the average productivity for the economy as a
whole (ZAR163,901). As one might expect, the aerospace industry segment of air transport services is
also a high productivity sector. It is highly productive even when measured relative to manufacturing as a
whole. Labour productivity in aerospace is estimated to be ZAR234,439, nearly 30% higher than that for
the manufacturing sector as a whole. This high level of productivity implies that were the resources
currently employed in the aviation sector redeployed elsewhere in the economy, then this would be
accompanied by a fall in overall output and income. For example, if productivity in the aviation sector was
the same as the average productivity for the economy as a whole, then the level of South African GDP
would be around 0.9% lower than it is (about ZAR21.1 billion in current prices).
3.7 Catalytic effects
3.7.1 Benefits to South African tourism
Air transport lies at the heart of global business and tourism. Through its speed, convenience and
affordability, air transport has expanded the possiblities of world travel for tourists and business travellers
alike, allowing an ever greater number of people to experience diversity of geography, climate, culture and
markets.
Tourism, both for business and leisure purposes, makes a large contribution to the South African
economy, with foreign visitors spending just under ZAR73.1 billion in the South African economy each
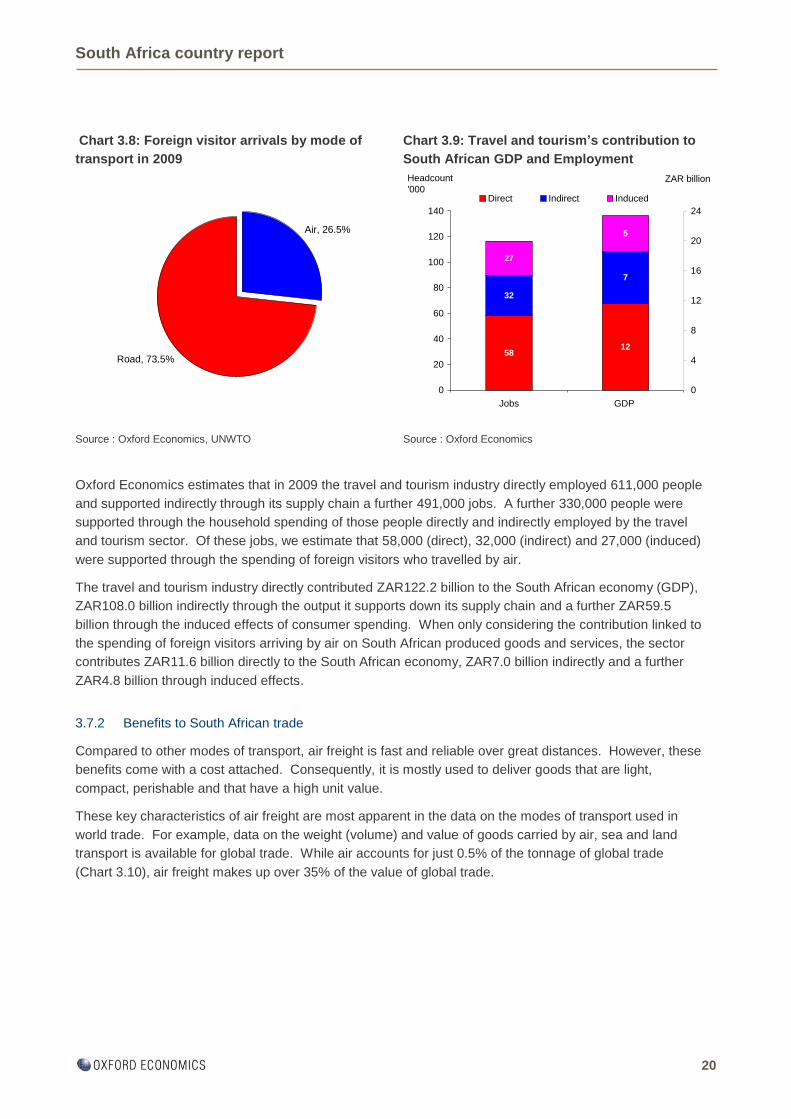
year18
. Over a quarter of these visitors arrive by air (Chart 3.8), so that passengers who arrive by air
probably spend around ZAR19.4 billion in South Africa19
.
18 Based on IMF statistics
19 Includes foreign visitors arriving on both domestic and foreign carriers
Investment as % value of
output
Air transport services 22.9
SA Economy 22.2
Productivity (GVA per
employee)
Air transport services ZAR 721,132
SA Economy ZAR 163,901
Aerospace ZAR 234,439SA Manufacturing ZAR 180,497
South Africa country report
20
Chart 3.8: Foreign visitor arrivals by mode of
transport in 2009
Chart 3.9: Travel and tourism’s contribution to
South African GDP and Employment
Source : Oxford Economics, UNWTO Source : Oxford Economics
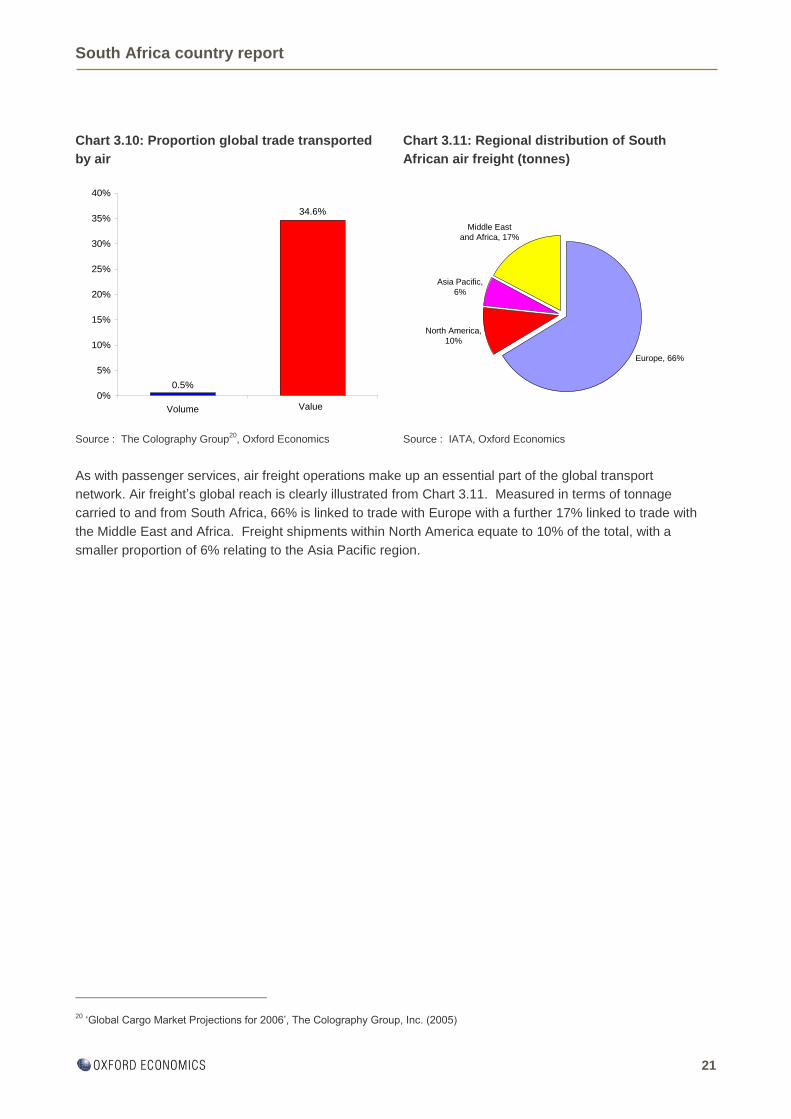
Oxford Economics estimates that in 2009 the travel and tourism industry directly employed 611,000 people
and supported indirectly through its supply chain a further 491,000 jobs. A further 330,000 people were
supported through the household spending of those people directly and indirectly employed by the travel
and tourism sector. Of these jobs, we estimate that 58,000 (direct), 32,000 (indirect) and 27,000 (induced)
were supported through the spending of foreign visitors who travelled by air.
The travel and tourism industry directly contributed ZAR122.2 billion to the South African economy (GDP),
ZAR108.0 billion indirectly through the output it supports down its supply chain and a further ZAR59.5
billion through the induced effects of consumer spending. When only considering the contribution linked to
the spending of foreign visitors arriving by air on South African produced goods and services, the sector
contributes ZAR11.6 billion directly to the South African economy, ZAR7.0 billion indirectly and a further
ZAR4.8 billion through induced effects.
3.7.2 Benefits to South African trade
Compared to other modes of transport, air freight is fast and reliable over great distances. However, these
benefits come with a cost attached. Consequently, it is mostly used to deliver goods that are light,
compact, perishable and that have a high unit value.
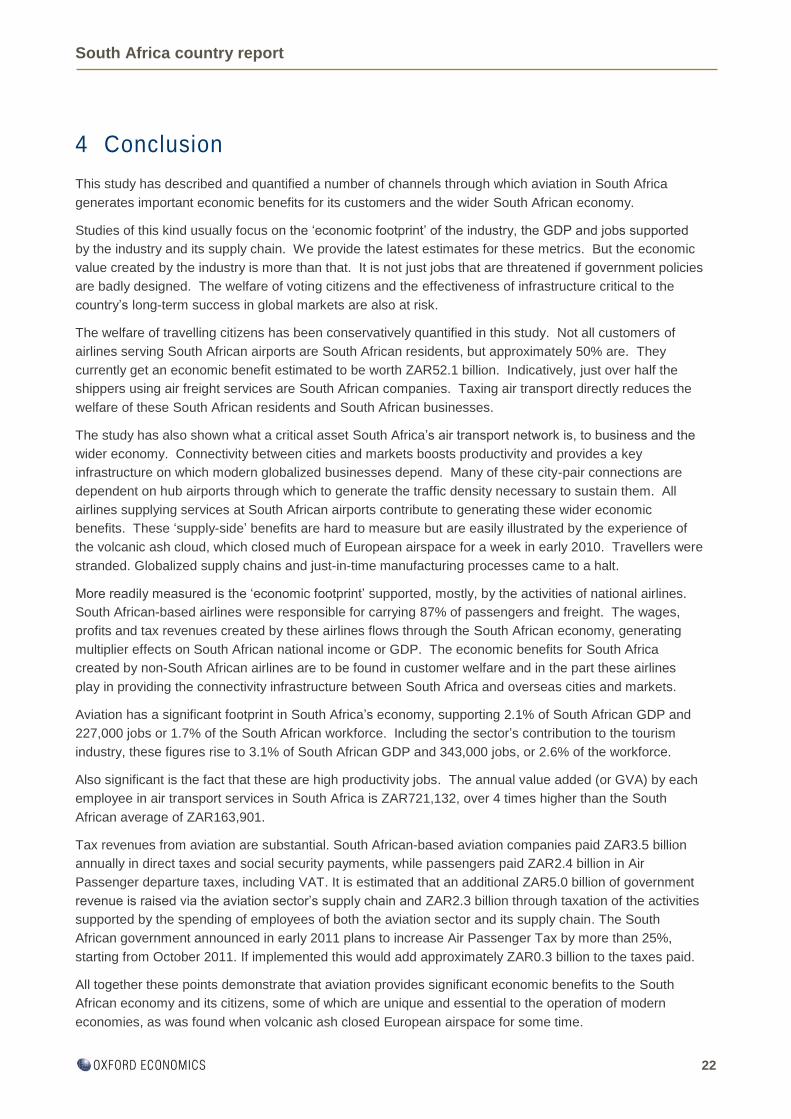
These key characteristics of air freight are most apparent in the data on the modes of transport used in
world trade. For example, data on the weight (volume) and value of goods carried by air, sea and land
transport is available for global trade. While air accounts for just 0.5% of the tonnage of global trade
(Chart 3.10), air freight makes up over 35% of the value of global trade.
Air, 26.5%
Road, 73.5%58
32
27
12
7
5
0
20
40
60
80
100
120
140
Jobs GDP
0
4
8
12
16
20
24
Direct Indirect Induced
Headcount
'000ZAR billion
South Africa country report
21
Chart 3.10: Proportion global trade transported
by air
Chart 3.11: Regional distribution of South
African air freight (tonnes)
Source : The Colography Group20
, Oxford Economics Source : IATA, Oxford Economics
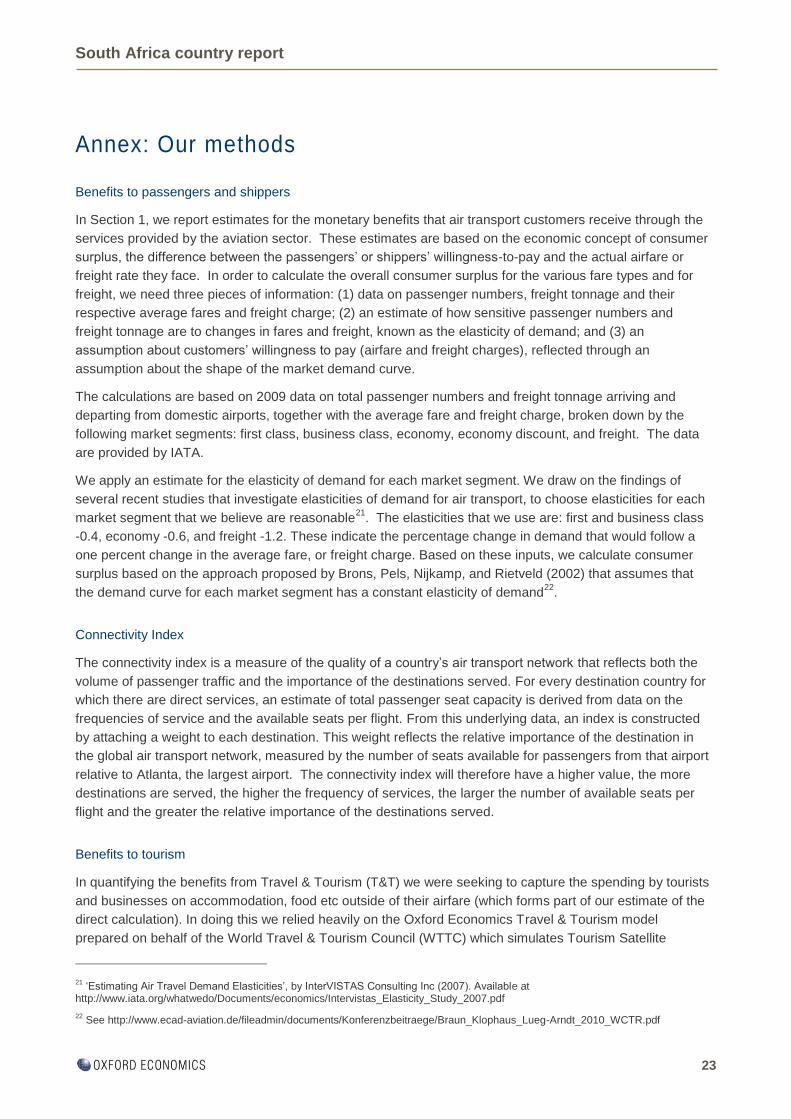
As with passenger services, air freight operations make up an essential part of the global transport
network. Air freight‟s global reach is clearly illustrated from Chart 3.11. Measured in terms of tonnage
carried to and from South Africa, 66% is linked to trade with Europe with a further 17% linked to trade with
the Middle East and Africa. Freight shipments within North America equate to 10% of the total, with a
smaller proportion of 6% relating to the Asia Pacific region.
20 „Global Cargo Market Projections for 2006‟, The Colography Group, Inc. (2005)
Europe, 66%
North America,
10%
Asia Pacific,
6%
Middle East
and Africa, 17%
0.5%
34.6%
0%
5%
10%
15%
20%
25%
30%
35%
40%
Volume Value
South Africa country report
22
4 Conclusion
This study has described and quantified a number of channels through which aviation in South Africa
generates important economic benefits for its customers and the wider South African economy.
Studies of this kind usually focus on the „economic footprint‟ of the industry, the GDP and jobs supported
by the industry and its supply chain. We provide the latest estimates for these metrics. But the economic
value created by the industry is more than that. It is not just jobs that are threatened if government policies
are badly designed. The welfare of voting citizens and the effectiveness of infrastructure critical to the
country‟s long-term success in global markets are also at risk.
The welfare of travelling citizens has been conservatively quantified in this study. Not all customers of
airlines serving South African airports are South African residents, but approximately 50% are. They
currently get an economic benefit estimated to be worth ZAR52.1 billion. Indicatively, just over half the
shippers using air freight services are South African companies. Taxing air transport directly reduces the
welfare of these South African residents and South African businesses.
The study has also shown what a critical asset South Africa‟s air transport network is, to business and the
wider economy. Connectivity between cities and markets boosts productivity and provides a key
infrastructure on which modern globalized businesses depend. Many of these city-pair connections are
dependent on hub airports through which to generate the traffic density necessary to sustain them. All
airlines supplying services at South African airports contribute to generating these wider economic
benefits. These „supply-side‟ benefits are hard to measure but are easily illustrated by the experience of
the volcanic ash cloud, which closed much of European airspace for a week in early 2010. Travellers were
stranded. Globalized supply chains and just-in-time manufacturing processes came to a halt.
More readily measured is the „economic footprint‟ supported, mostly, by the activities of national airlines.
South African-based airlines were responsible for carrying 87% of passengers and freight. The wages,
profits and tax revenues created by these airlines flows through the South African economy, generating
multiplier effects on South African national income or GDP. The economic benefits for South Africa
created by non-South African airlines are to be found in customer welfare and in the part these airlines
play in providing the connectivity infrastructure between South Africa and overseas cities and markets.
Aviation has a significant footprint in South Africa‟s economy, supporting 2.1% of South African GDP and
227,000 jobs or 1.7% of the South African workforce. Including the sector‟s contribution to the tourism
industry, these figures rise to 3.1% of South African GDP and 343,000 jobs, or 2.6% of the workforce.
Also significant is the fact that these are high productivity jobs. The annual value added (or GVA) by each
employee in air transport services in South Africa is ZAR721,132, over 4 times higher than the South
African average of ZAR163,901.
Tax revenues from aviation are substantial. South African-based aviation companies paid ZAR3.5 billion
annually in direct taxes and social security payments, while passengers paid ZAR2.4 billion in Air
Passenger departure taxes, including VAT. It is estimated that an additional ZAR5.0 billion of government
revenue is raised via the aviation sector‟s supply chain and ZAR2.3 billion through taxation of the activities
supported by the spending of employees of both the aviation sector and its supply chain. The South
African government announced in early 2011 plans to increase Air Passenger Tax by more than 25%,
starting from October 2011. If implemented this would add approximately ZAR0.3 billion to the taxes paid.
All together these points demonstrate that aviation provides significant economic benefits to the South
African economy and its citizens, some of which are unique and essential to the operation of modern
economies, as was found when volcanic ash closed European airspace for some time.
South Africa country report
23
Annex: Our methods
Benefits to passengers and shippers
In Section 1, we report estimates for the monetary benefits that air transport customers receive through the
services provided by the aviation sector. These estimates are based on the economic concept of consumer
surplus, the difference between the passengers‟ or shippers‟ willingness-to-pay and the actual airfare or
freight rate they face. In order to calculate the overall consumer surplus for the various fare types and for
freight, we need three pieces of information: (1) data on passenger numbers, freight tonnage and their
respective average fares and freight charge; (2) an estimate of how sensitive passenger numbers and
freight tonnage are to changes in fares and freight, known as the elasticity of demand; and (3) an
assumption about customers‟ willingness to pay (airfare and freight charges), reflected through an
assumption about the shape of the market demand curve.
The calculations are based on 2009 data on total passenger numbers and freight tonnage arriving and
departing from domestic airports, together with the average fare and freight charge, broken down by the
following market segments: first class, business class, economy, economy discount, and freight. The data
are provided by IATA.
We apply an estimate for the elasticity of demand for each market segment. We draw on the findings of
several recent studies that investigate elasticities of demand for air transport, to choose elasticities for each
market segment that we believe are reasonable21
. The elasticities that we use are: first and business class
-0.4, economy -0.6, and freight -1.2. These indicate the percentage change in demand that would follow a
one percent change in the average fare, or freight charge. Based on these inputs, we calculate consumer
surplus based on the approach proposed by Brons, Pels, Nijkamp, and Rietveld (2002) that assumes that
the demand curve for each market segment has a constant elasticity of demand22
.
Connectivity Index
The connectivity index is a measure of the quality of a country‟s air transport network that reflects both the
volume of passenger traffic and the importance of the destinations served. For every destination country for
which there are direct services, an estimate of total passenger seat capacity is derived from data on the
frequencies of service and the available seats per flight. From this underlying data, an index is constructed
by attaching a weight to each destination. This weight reflects the relative importance of the destination in
the global air transport network, measured by the number of seats available for passengers from that airport
relative to Atlanta, the largest airport. The connectivity index will therefore have a higher value, the more
destinations are served, the higher the frequency of services, the larger the number of available seats per
flight and the greater the relative importance of the destinations served.
Benefits to tourism
In quantifying the benefits from Travel & Tourism (T&T) we were seeking to capture the spending by tourists
and businesses on accommodation, food etc outside of their airfare (which forms part of our estimate of the
direct calculation). In doing this we relied heavily on the Oxford Economics Travel & Tourism model
prepared on behalf of the World Travel & Tourism Council (WTTC) which simulates Tourism Satellite
21 „Estimating Air Travel Demand Elasticities‟, by InterVISTAS Consulting Inc (2007). Available at
http://www.iata.org/whatwedo/Documents/economics/Intervistas_Elasticity_Study_2007.pdf
22 See http://www.ecad-aviation.de/fileadmin/documents/Konferenzbeitraege/Braun_Klophaus_Lueg-Arndt_2010_WCTR.pdf
South Africa country report
24
Account (TSA) data across over 180 countries. From the model we obtained an estimate of the level of
value-added created by foreign visitors, and assigned a share of this to the aviation industry based on the
share of foreign visitor arrivals travelling by air. We then used coefficients within the model to divide this
between T&T providers (direct) and their supply chain (indirect). Finally, we attributed a share of the total
induced effect to the aviation industry by dividing our estimates of aviation-related direct and indirect GDP
by total T&T direct and indirect GDP. It should be noted that this is a gross measure of the benefit from
tourism and therefore does not account for the spending which is effectively “lost” when domestic residents
travel abroad by air.
Economic footprint
In Section 3 we report the contribution that the aviation sector makes to the economy. The contribution is
measured in terms of the value of the sector‟s output and the number of people it employs. For each
measure, the contribution is built up from three components: direct, indirect, and induced.
The direct output component is measured by Gross Value Added (GVA). GVA is measured either as the
firm or industry sales revenue less purchases from other companies, or equivalently, as the sum of
employee compensation and gross operating surplus, measured before the deduction of depreciation,
interest charges and taxation. In this report we treat gross operating surplus as equivalent to gross
operating profit, however, the two concepts differ slightly with the former including income from land and a
technical adjustment for the change in stock valuation. GVA differs from Gross Domestic Product (GDP) in
the price used to value goods and services. GVA is measured at producer prices that reflect the price at
the „factory gate‟ together with cost of distribution. GDP is measured at market prices that reflect the price
paid by the consumer. The two prices differ by the taxes less subsidies levied on the goods or services.
The indirect output component is measured using an Input-Output table that reports how industries use the
output of other industries in the process of production, and how their final output is used, e.g. in final
domestic consumption, changes in stocks or exports. For many countries, Input-Output tables are
available as part of the national accounts. As Input-Output tables describe how an industry uses the
output of other industries as inputs in the production of its goods or service, they describe its full supply
chain – its direct suppliers, those industries that supply its direct suppliers, and so on. This is reported as
the indirect output component.
The Input-Output table reports how much of final output is sold in the domestic economy. Using similar
methods as that used to derive the indirect output component, the Input-Output table can be used to
estimate how much spending on completed goods (known as final domestic consumption) is supported
through the employees of the industry and its full supply chain. This is reported as the induced output
component.
We also calculate the contribution of freight integrator activity in countries where they have significant
presence. Where reported, their contribution appears under airport and ground based infrastructure as a
component of both the direct benefit (on-airport activity) and indirect benefit (off-airport activity), with the
induced benefit adjusted accordingly. Our estimates are based on employment and market share
information supplied by freight integrators (either directly or from company websites), and labour
productivity estimates derived from Oxford Economics‟ 2009 global express delivery industry study23
.
23 See http://www.oef.com/samples/oefglobalexpress.pdf
South Africa country report
25
The three output components – direct, indirect, and induced – are converted to their respective
employment components, using an estimate for the average labour productivity (GVA per employee) for
the economy.
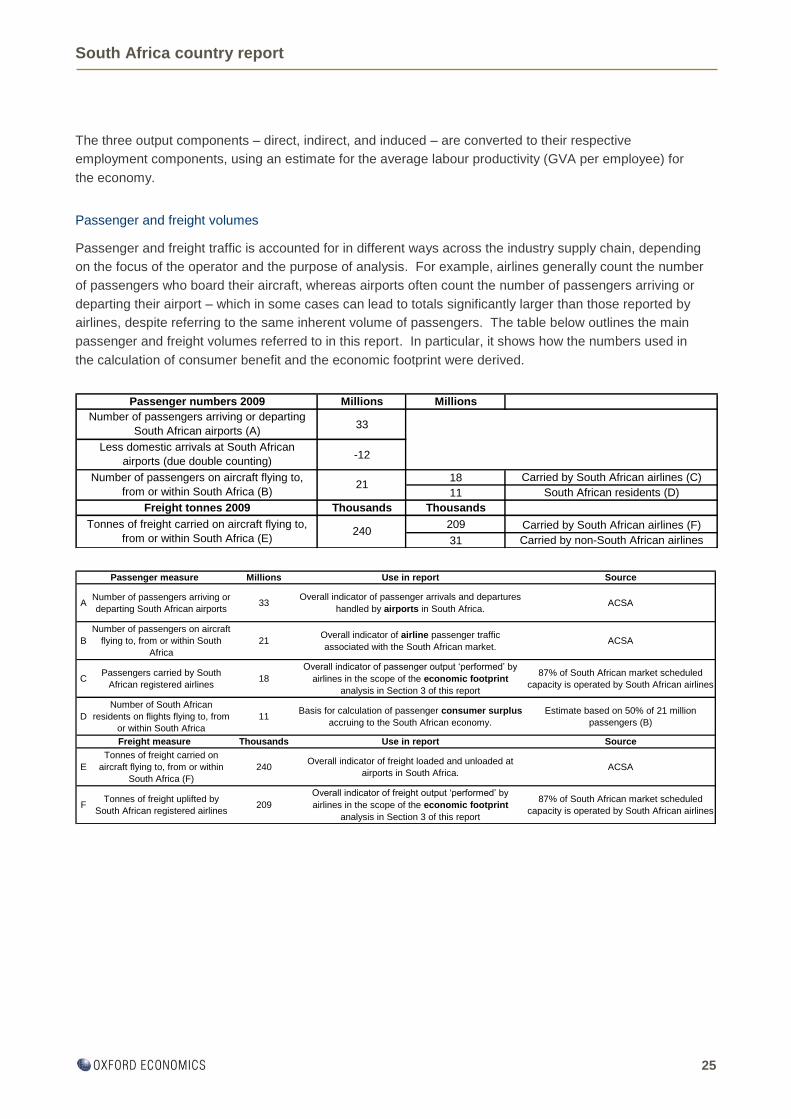
Passenger and freight volumes
Passenger and freight traffic is accounted for in different ways across the industry supply chain, depending
on the focus of the operator and the purpose of analysis. For example, airlines generally count the number
of passengers who board their aircraft, whereas airports often count the number of passengers arriving or
departing their airport – which in some cases can lead to totals significantly larger than those reported by
airlines, despite referring to the same inherent volume of passengers. The table below outlines the main
passenger and freight volumes referred to in this report. In particular, it shows how the numbers used in
the calculation of consumer benefit and the economic footprint were derived.
Passenger numbers 2009 Millions Millions
Number of passengers arriving or departing
South African airports (A)33
Less domestic arrivals at South African
airports (due double counting)-12
18 Carried by South African airlines (C)
11 South African residents (D)
Freight tonnes 2009 Thousands Thousands
209 Carried by South African airlines (F)
31 Carried by non-South African airlines
Number of passengers on aircraft flying to,
from or within South Africa (B)21
Tonnes of freight carried on aircraft flying to,
from or within South Africa (E)240
Millions Use in report Source
ANumber of passengers arriving or
departing South African airports33
Overall indicator of passenger arrivals and departures
handled by airports in South Africa.ACSA
B
Number of passengers on aircraft
flying to, from or within South
Africa
21Overall indicator of airline passenger traffic
associated with the South African market.ACSA
CPassengers carried by South
African registered airlines18
Overall indicator of passenger output „performed‟ by
airlines in the scope of the economic footprint
analysis in Section 3 of this report
87% of South African market scheduled
capacity is operated by South African airlines
D
Number of South African
residents on flights flying to, from
or within South Africa
11Basis for calculation of passenger consumer surplus
accruing to the South African economy.
Estimate based on 50% of 21 million
passengers (B)
Thousands Use in report Source
E
Tonnes of freight carried on
aircraft flying to, from or within
South Africa (F)
240Overall indicator of freight loaded and unloaded at
airports in South Africa.ACSA
FTonnes of freight uplifted by
South African registered airlines209
Overall indicator of freight output „performed‟ by
airlines in the scope of the economic footprint
analysis in Section 3 of this report
87% of South African market scheduled
capacity is operated by South African airlines
Freight measure
Passenger measure

OXFORD
Abbey House, 121 St Aldates
Oxford, OX1 1HB, UK
Tel: +44 1865 268900
LONDON
Broadwall House, 21 Broadwall
London, SE1 9PL, UK
Tel: +44 207 803 1400
BELFAST
Lagan House, Sackville Street
Lisburn, BT27 4AB, UK
Tel: +44 28 9266 0669
NEW YORK
817 Broadway, 10th Floor
New York, NY 10003, USA
Tel: +1 646 786 1863
PHILADELPHIA
303 Lancaster Avenue, Suite 1b
Wayne PA 19087, USA
Tel: +1 610 995 9600
SINGAPORE
No.1 North Bridge Road
High Street Centre #22-07
Singapore 179094
Tel: +65 6338 1235
PARIS
9 rue Huysmans
75006 Paris, France
Tel: + 33 6 79 900 846
email: [email protected]
www.oxfordeconomics.com