economic approach to assess the forest carbon implications of biomass energy
TRANSCRIPT
Economic Approach to Assess the Forest Carbon Implications ofBiomass EnergyAdam Daigneault,*,† Brent Sohngen,‡ and Roger Sedjo§
†Landcare Research, Auckland, New Zealand‡Agricultural, Environmental, and Development Economics, The Ohio State University, Columbus, Ohio, United States§Resources For the Future, Washington, DC, United States
*S Supporting Information
ABSTRACT: There is widespread concern that biomass energy policy thatpromotes forests as a supply source will cause net carbon emissions. Most ofthe analyses that have been done to date, however, are biological, ignoring theeffects of market adaptations through substitution, net imports, and timberinvestments. This paper uses a dynamic model of forest and land usemanagement to estimate the impact of United States energy policies thatemphasize the utilization of forest biomass on global timber production andcarbon stocks over the next 50 years. We show that when market factors areincluded in the analysis, expanded demand for biomass energy increases timberprices and harvests, but reduces net global carbon emissions because higherwood prices lead to new investments in forest stocks. Estimates are sensitive toassumptions about whether harvest residues and new forestland can be used forbiomass energy and the demand for biomass. Restricting biomass energy tobeing sourced only from roundwood on existing forestland can transform the policy from a net sink to a net source of emissions.These results illustrate the importance of capturing market adjustments and a large geographic scope when measuring the carbonimplications of biomass energy policies.
■ INTRODUCTIONFor centuries, the proportion of wood used as a primary energysource has been declining. The United States and Europe,however, are pushing ever more stringent renewable portfoliostandards that will increase the demand for wood as a primaryenergy source and potentially reverse this trend, at least insome locations. According to the Center for Climate andEnergy Solutions, 39 states now have adopted some form ofrenewable or alternative energy portfolio standard or goal thatpromotes the use of alternative energy.1 Many of the laws thesestates have adopted promote biomass energy as a renewablesource of electricity production. In addition, policies like theLow Carbon Fuel Standard in California, or laws like theUnited States Energy Independence and Security Act of 2007,promote development of liquid fuels from woody biomass.With technological change in the fuel processing sector,demand for wood as an input into the liquid fuel systemcould increase in the future.When viewed as a renewable energy source, wood-based
biomass has been treated as carbon neutral, such that when it isburned for energy, it does not release net carbon dioxide.2 Thisassumption of “carbon neutrality”, however, has beenchallenged. For example, in the fall of 2010 two noteworthyletters were sent to the Congress by eminent scientistsexamining the meritsor demeritsof biomass in the climatedebate. The first, from about 90 scientists,3 questioned thetreatment of all biomass energy as carbon-neutral, arguing that
“clearing or cutting forest for energy... has the net effect ofreleasing otherwise sequestered carbon into the atmospherejust like... fossil fuels.” The second letter, by over 100 forestscientists,4 expressed concern over equating biogenic carbonemission with fossil fuel emission. It argued that such anapproach that focuses on net smoke stack emissionsindependent of their feedstocks would encourage further fossilfuel energy production to the long-term detriment of theatmosphere.In addition to these statements by scientists, several analyses
have now been conducted to examine the implications thatwood used for biomass energy has on the carbon cycle. Tworecent studies have concluded that when biomass energy orbiofuels are produced with wood, carbon emissions to theatmosphere actually increase.5,6 The emission results from theloss of carbon in existing stocks of forests that are drawn downin order to meet new demands for forest resources. In the paperby Searchinger et al.,6 land use change can occur which shiftsforests to perennials such as switchgrass, or other annual crops,that have lower carbon intensity per hectare. In either case, theavoided emissions from the energy that is displaced are notlarge enough to limit the carbon losses.
Received: August 30, 2011Revised: March 26, 2012Accepted: April 19, 2012Published: April 19, 2012
Policy Analysis
pubs.acs.org/est
© 2012 American Chemical Society 5664 dx.doi.org/10.1021/es2030142 | Environ. Sci. Technol. 2012, 46, 5664−5671
Forest stocks, of course, are influenced both by biological andeconomic factors, each of which exert important influences onforest carbon and resulting carbon flow. These earlier studiesfocused entirely on biological factors and ignored the importantpolicy and economic forces that influence forest stocks andwhether biomass energy should be considered carbon neutral.Even some notable economic studies (e.g., 7) that haveexamined the indirect effects of biofuel policies have usedsimple life cycle analysis which did not fully account for forestdynamics. This paper uses modeling that links forest dynamicsto economic markets and thus improves these earlier estimates.In so doing, the results of many of these earlier studies arereversed.Some of the economic factors that influence forest stocks
include the time path for implementing a biomass energypolicy, timber prices, costs of accessing and harvesting trees,transportation costs, land opportunity costs, and other factors.The level of forest investments and the timing of their impactson carbon sequestration are likely to have particularlyimportant implications.8 Furthermore, there is a consistenttrend toward utilizing a broader array of shorter rotationspecies in timber production.9,10 In the past 40 years, the areaof timber plantations globally has increased to over 120 millionhectares, supplying around 30% of the world’s timber.11 Thisinvestment has slowed timber price growth globally, and it hasreduced pressure on harvesting in natural forests, therebyreducing the costs of forest protection. There is evidence insome regions, however, that increasing values for timberplantations have in turn increased pressures to convert naturalforests to plantations, resulting in net carbon emissions over a30-year period (e.g., 12, 13). To properly quantify carbon flowsassociated with policy changes, economic models that canaccount for a range of influences on land use change must beutilized.
■ MODEL AND DISCUSSIONThis paper presents the results of economic analysis of theeffects of U.S. biomass energy policy on U.S. and global carbonstocks. Economic analysis recognizes that forest investmentdecisions are based on anticipated future market conditions aswell as current conditions (e.g., prices). The analysis isconducted with a global economic model of forest and landuse with carbon accounting routines. The model has been usedwidely for carbon sequestration analysis as well as for timbersupply analysis (e.g., 11, 14−16). A global model is usedbecause wood is an internationally traded commodity andpolicies in the U.S. could have influences well beyond the U.S.border. For instance, if biomass energy demands are metlocally, more timber might be imported to meet traditionalwood uses. The market and carbon influence of these changesare factored into this global model.A full description of the global forest and land use model, as
well as the carbon accounting routines and many of theassumptions of the model, are provided in the SupportingInformation (SI). The model maximizes the net present valueof consumers’ surplus less the costs of production in forestryfor 200 forest types that encompass 16 different regions of theglobe. Forestry demand is represented by a single globaldemand function for industrial wood products that shifts outover time based on changes in income. The modelendogenously solves timber prices, economically optimal ageclasses for timber harvests, economically optimal intensity ofmanagement, and the optimal area of land to maintain in
forests. Because forestry competes with agriculture for land, thetwo markets interact via land supply functions. These landsupply functions account for the costs of renting andmaintaining land in forests, and are specified for each foresttype in the model. They are constant in temperate regions, andthey shift inward in tropical regions to simulate risingopportunity costs of land. The model has been updated forthis analysis with demand functions for biomass energy in fiveregions of the U.S. (Northeast, South, North Central, West,and Pacific Northwest), that include forest-specific costfunctions that average about $40/m3 for harvesting andtransporting forest residues and industrial roundwood tomeet these demands. The detailed description of the biomasssector of the timber model is provided in the SI.In addition to considering the international dimension, the
model has a long (200 year) time horizon which allows us toaccommodate the long time horizon of most timber invest-ments. Although there are strong trends toward shorterrotation species in many parts of the world, shifts in harvestingpatterns of longer rotation types in temperate or boreal zonesinduced by biomass energy policies could have importantcarbon consequences. Model projections are conducted forforest land use and management for the next two centuriesalthough we only present the first 60 years in this paper. Thelong time horizon allows us to account for investment decisionsthat are ignored by other models (e.g., whether to plantplantations in anticipation of higher prices associated withbiomass or biofuel mandates), and terminal conditions areimposed far enough into the future so as to not affect the studyresults over the period of interest.The analysis in this paper involves comparing carbon stored
in the forest system in the baseline to carbon stored in theforest system under several alternative policy scenarios. In thiscase, the baseline ignores biomass energy demands, while thescenario includes biomass energy demand. With biomassenergy demand, the market will adjust timber harvesting,management, land use, and consequently carbon storage. Thechange in carbon then is the difference in carbon stocksbetween the scenario and the baseline. The carbon stored in theforest system is measured as the carbon in ecosystems(including soil carbon and slash) and carbon in wood products.In scenarios that include demand for biomass energy, carbonmay also be calculated as the reduction in emissions from theenergy sector when biomass energy displaces traditional energy.Estimates of carbon stocks are presented every 5 years for thebaseline and alternative policy scenarios.Mathematically, the change in carbon caused by the policy is
a path of changes in the total forest carbon stock:
= + −CC TFCS ER TFCSt tS
tS
tB
(1)
where TFCS is the total forest carbon stock and ER is theemission reduction with the biomass scenario. The superscript“S” indicates the carbon stock is measured for the scenario andthe superscript “B” indicates the carbon stock is measured forthe baseline. The methods for measuring the total forest carbonstock are described in detail in the SI. Using eq 1 to assesschanges in carbon when a policy shift occurs entails asubstantial difference from most lifecycle analyses. First, thisapproach is dynamic and relies on measuring carbon acrossmultiple time periods. With this method, we do not aggregatechanges that occur in different time periods using discountingor other methods; we simply present the changes in specifictime periods. Second, underlying the calculations of the total
Environmental Science & Technology Policy Analysis
dx.doi.org/10.1021/es2030142 | Environ. Sci. Technol. 2012, 46, 5664−56715665

forest carbon stock in either the baseline or the scenarios are arange of behavioral changes that are mediated by market pricesignals. Life cycle analysis accounts neither for the baseline, northe adjustments in carbon stocks resulting from marketactivities.The forestry model tracks the age class, growing stock
volume, and harvest of over 200 different forest types in 16different regions of the world. The carbon accounting routinesare described in ref 14 and the SI. For this analysis, we calculatetotal ecosystem carbon in aboveground and belowground plantmaterial, and soil carbon. We also track carbon stored in timberproducts and decay starting from our initial period, 2010. Wedo not account for inherited emissions from historical woodproduct harvests. This analysis also tracks GHG emissions fromfuel used to harvest and transport wood to be processed. Inaddition to counting carbon in forests and wood products, wealso calculate the reduction in carbon emissions from the woodenergy that displaces (i.e., offsets) fossil fuel energy. Tocalculate the reduction in emissions, we assume that biomassenergy from forests offsets the emissions from electricity usingthe average carbon intensity of coal-based electricity in theUnited States in 2009, as that is what biomass is most likely todisplace. For this paper, we assume that 1 m3 of timberproduces approximately 850 kWh and offsets 0.94 t CO2 in apower plant with 33% efficiency. This is based on theassumption that 1 m3 of timber with a moisture content of50% produces 8.8 MMBtu of energy, offsetting the combustionof 0.33 tons of coal with an average energy content of 26.7MMBtu/ton and carbon content of 77%, or 2.83 tons CO2/toncoal. These calculations are included separately in our results soreaders can see the impact of these reductions in emissions.Several policy scenarios are examined in this paper and
compared to a baseline case with no bioenergy policy. Asensitivity analysis with additional increases in the demand forroundwood and biomass energy was also conducted. Thebiomass energy scenarios are delineated by two critical issues.First, we assess whether harvest and use of forest residues (i.e.,slash) affects the economic efficiency or the carbon implicationsof biomass energy. Thus, two of the scenarios assume that up to50% of available forest residues can be removed and used forbiomass energy, and two of them assume that residues are notallowed to be utilized by markets. These with and withoutresidue cases are considered because there is a policy debatenot only about whether residues should be used due to thenutrient and other ecological benefits provided by leaving theresidues on-site, but also that some regional RPS requirementswould be primarily met by the felling of whole trees.
Second, there is an important question about theresponsiveness of land use to the biomass policy. The landuse supply functions described above and in the SI control landuse change in general, and assume that land use is responsive tobiomass policy. Given the debate that has occurred in theliterature on the responsiveness of land use to biomass policies(e.g., 6), we include two scenarios that assume that investmentscan be made to expand forestland in response to biomassenergy demands, and two scenarios that assume that forestlandarea is unresponsive. The nonresponsive land use scenario mayalso mirror the Energy Independence and Security Act (EISA),which limits the use of woody biomass material from landsconverted specifically to produce biomass energy after thepolicy was enacted in 2007. Our constrained land scenarios fixall land types at their baseline levels, thus prohibitingconversion of any land into plantations to produce biomassenergy. This provides a test for the importance of forestinvestments on the resulting carbon fluxes. Note, however, thatin the constrained land case, investments in forest managementcan still increase forest density and carbon sequestration onexisting timberlands.For the biomass energy scenarios, the projections are based
on forecasts of regional bioenergy consumption from the U.S.Energy Information Administration Annual Energy Outlook2010 (AEO 2010) “Reference Case”.18 A series of adjustmentswere made to modify the aggregate bioenergy projections inAEO2010 to focus only on the hypothetical effects ofproducing energy from woody biomass. First, all bioenergyproduced in the initial period is assumed to come from woodybiomass. Second, all bioenergy produced in the major U.S.timber producing regions of the South, Pacific Northwest, andWest are assumed to come from woody biomass for all periods,while demand for woody biomass in the Northeast and NorthCentral regions is expected to grow at roughly half theprojected rate for total biomass-based energy in the region.This is because we assume that a large portion of the demand inthese regions will likely be met by other sources of biomasssuch as agricultural residues or energy-crops, while regions thathave large forest stocks will continue to be the main source ofbiomass. Finally, because AEO only has projections up to 2035,we allow regional biomass demand to grow at projected ratesuntil 2050 and remain constant at the 2050 demand level forthe remaining periods of the simulation. Additional details areprovided in the SI.The sensitivity analysis considers several additional scenarios
that adjust key assumptions about the demand for roundwoodand biomass energy. First, we consider the possibility that
Table 1. Summary of Modeled Biomass Scenarios
scenarioaverage GDP growth
(%/yr)annual GDPgrowth (%)
U.S. biomass 2035(Mm3)
U.S. biomass 2055(Mm3)
harvestresidues
forestland areaconstrained
baseline, no biomass 1.6 1.6 none none no noresidues and forestland change 1.6 1.6 146 171 yes nono residues but forestlandchange
1.6 1.6 146 171 no no
residues but no forestlandchange
1.6 1.6 146 171 yes yes
no residues or forestlandchange
1.6 1.6 146 171 no yes
high GDP 2.4 2.4 146 171 yes nohigh biomass demand 1.6 1.6 292 342 yes nohigh GDP and high biomassdemand
2.4 2.4 292 342 yes no
Environmental Science & Technology Policy Analysis
dx.doi.org/10.1021/es2030142 | Environ. Sci. Technol. 2012, 46, 5664−56715666
future incomes rise much more rapidly over the coming centurythan our baseline projection. It is possible that if demand forwood is greater in the future, wood will become scarcer, andadding biomass energy demand will have greater impacts onforests. As noted above, in the baseline our average rate ofincrease in GDP per capita is 1.6% per year. For this sensitivityscenario, we assume that GDP per capita rises at an average rateof 2.4% per decade. We then assess the implications of addingbiomass energy demand to this scenario with greater globalwood demand. Second, we test an assumption that regionalbiomass energy demand in the U.S. itself rises more rapidly;specifically, we double the biomass energy demand from theprojections discussed in the previous paragraph. We test theinfluence of significantly higher biomass energy demand forboth rates of annual growth in global GDP per capita. Asummary of the key assumptions for the modeled scenarios islisted in Table 1.
■ RESULTS AND DISCUSSIONFor the baseline case, we assume that global average income percapita rises at 2.4% per year, but that the rate of increase slows
at 0.9% per year. As a result, income per capita rises at 1.6% onaverage over the century. This is consistent with historicalgrowth rates in world GDP per capita in the last century.19
Under this baseline scenario timber prices rise by 0.4% per yearbetween 2015 and 2060 (Table 2). This represents slowergrowth in prices than over the past century, but rates that areconsistent with recent decades.17 The modeled price trends
Table 2. Baseline Timber Prices and Global RoundwoodOutput
million hectares
year
roundwoodprice ($ per
m3)
output(millionm3/yr)
globalforestarea
globalindustrialplantations
U.S.forestarea
2015 $142.35 1,992 3,497 79 2072020 $146.60 2,027 3,528 87 2132025 $149.25 2,085 3,499 89 2162030 $151.90 2,142 3,470 91 2192035 $156.25 2,206 3,447 92 2192040 $160.60 2,269 3,424 94 2202045 $161.95 2,331 3,416 95 2212050 $163.30 2,393 3,407 97 2222055 $164.40 2,471 3,401 98 2222060 $165.50 2,550 3,396 99 222
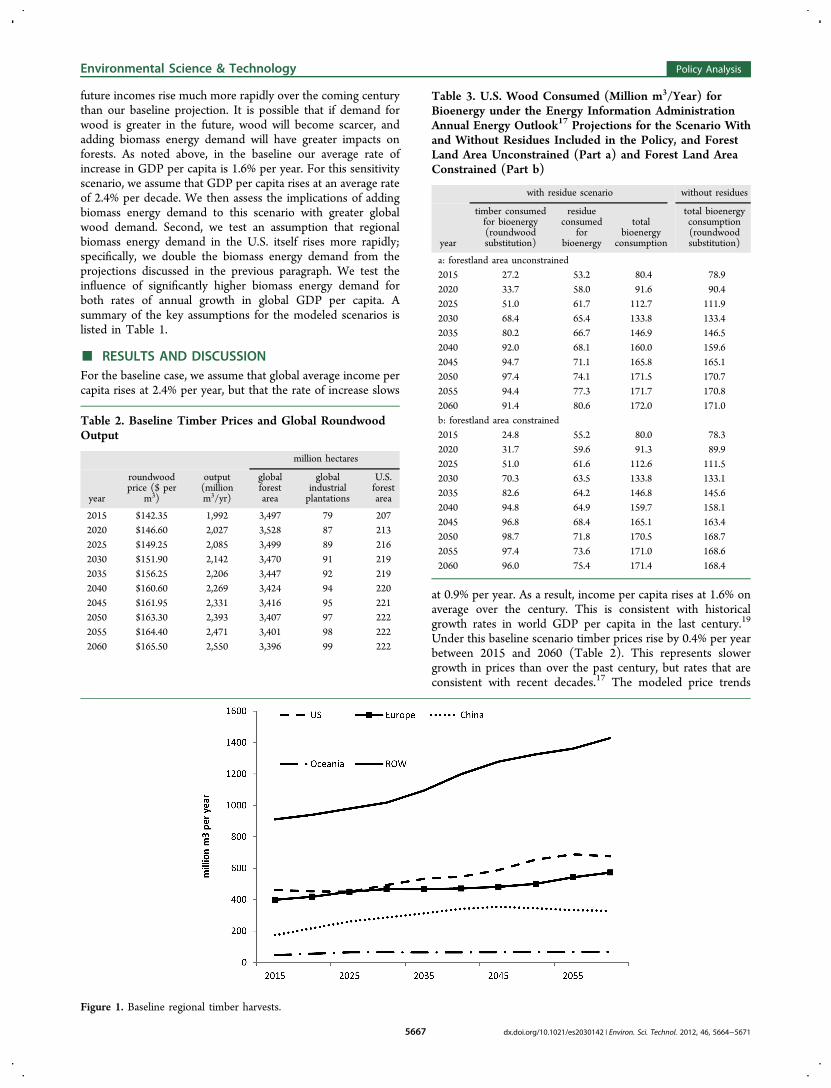
Figure 1. Baseline regional timber harvests.
Table 3. U.S. Wood Consumed (Million m3/Year) forBioenergy under the Energy Information AdministrationAnnual Energy Outlook17 Projections for the Scenario Withand Without Residues Included in the Policy, and ForestLand Area Unconstrained (Part a) and Forest Land AreaConstrained (Part b)
with residue scenario without residues
year
timber consumedfor bioenergy(roundwoodsubstitution)
residueconsumed
forbioenergy
totalbioenergy
consumption
total bioenergyconsumption(roundwoodsubstitution)
a: forestland area unconstrained2015 27.2 53.2 80.4 78.92020 33.7 58.0 91.6 90.42025 51.0 61.7 112.7 111.92030 68.4 65.4 133.8 133.42035 80.2 66.7 146.9 146.52040 92.0 68.1 160.0 159.62045 94.7 71.1 165.8 165.12050 97.4 74.1 171.5 170.72055 94.4 77.3 171.7 170.82060 91.4 80.6 172.0 171.0b: forestland area constrained2015 24.8 55.2 80.0 78.32020 31.7 59.6 91.3 89.92025 51.0 61.6 112.6 111.52030 70.3 63.5 133.8 133.12035 82.6 64.2 146.8 145.62040 94.8 64.9 159.7 158.12045 96.8 68.4 165.1 163.42050 98.7 71.8 170.5 168.72055 97.4 73.6 171.0 168.62060 96.0 75.4 171.4 168.4
Environmental Science & Technology Policy Analysis
dx.doi.org/10.1021/es2030142 | Environ. Sci. Technol. 2012, 46, 5664−56715667
suggest that a future without biomass energy demands is one inwhich timber supplies will be relatively bountiful.Global timber production in the baseline expands by about
30%, from almost 2.0 billion m3 per year in 2010 to over 2.5billion m3 per year in 2060 (Table 2). One important trend intimber markets is the continued drive toward establishing short-rotation timber plantations for industrial wood production, inparticular in subtropical regions. In this model, the area of fast-growing plantations devoted to timber production increases by20 million hectares in the next 40 years. Most of the increase intimber output globally occurs in China and the emergingplantation areas of the rest of the world region (Figure 1). Ourestimates of net global forest loss in the coming decades
forest area declines by about 100 million hectares by 2060areless than rates of net forest change in recent decades estimatedby FAO.20 The small net change globally, though, masksdeforestation processes calculated by the model. For example,we calculate about 4 million hectares of annual grossdeforestation in tropical regions in the coming decades.Total U.S. biomass energy demand in the scenarios amounts
to an additional 80 million m3 per year of timber (eitherroundwood or residues) being converted into energy by 2015.This amounts to around 17% of current U.S. roundwoodtimber harvests (Table 3). Our analysis shows that demand isexpected to rise to around 170 million m3 per year by 2050(4%/yr), or about 33% of the projected U.S. roundwoodharvests. If policy allows residues to be utilized for biomassenergy, the residues play a very important role, amounting toover 65% of the wood used for biomass energy in 2015, andremaining important throughout the simulation period. Ifpolicy does not allow residues, all of the wood used for energymust come either from additional production of timber withinthe U.S., substitution with other traditional roundwood uses, orimports from other regions of the globe.Harvesting additional timber from the forest to meet biomass
energy demands has a high opportunity cost, and thus there islittle new timber harvesting in the United States to meetimmediate biomass energy needs (Table 4). In the next 10years, most of the wood used for biomass energy comes fromresidues (if they are allowed by policy), substituting lower-value
Table 4. Change in Roundwood Production and NetImports (Million m3/Year)
U.S. roundwoodproduction
change in roundwoodproduction change in net imports
year baselinewith
residueswithoutresidues
withresidues
withoutresidues
a: forestland area unconstrained2015 460.8 −0.4 0.8 21.9 60.22020 473.7 −0.3 0.8 27.1 70.02025 452.9 8.3 4.9 31.5 81.42030 432.0 16.8 8.9 35.9 92.82035 449.9 22.8 11.5 34.7 95.32040 467.8 28.8 14.1 33.6 97.82045 492.7 25.8 15.7 39.3 89.52050 517.6 22.9 17.3 45.1 81.22055 532.7 29.9 16.3 38.7 86.72060 547.8 37.0 15.3 32.3 92.3b: forestland area constrained2015 460.8 2.6 0.3 5.9 49.22020 473.7 2.1 0.3 14.0 60.72025 452.9 2.8 −0.3 36.8 84.82030 432.0 3.5 −1.0 59.6 108.92035 449.9 4.7 1.3 68.0 116.82040 467.8 6.0 3.7 76.5 124.82045 492.7 6.0 4.2 76.9 128.72050 517.6 6.0 4.7 77.3 132.62055 532.7 4.2 4.6 76.4 131.92060 547.8 2.4 4.5 75.6 131.2
Table 5. Global and U.S. Forest Area (Million Hectares)under Alternative Scenarios, Unconstrained Forest LandBase (No Table Is Shown for the Constrained Land Casesince Forest Areas Remain the Same As the Baseline)
global forest area U.S. forest area
change change
year baselinewith
residueswithoutresidues baseline
withresidues
withoutresidues
2015 3,497.2 8.0 12.4 207.2 3.5 1.62020 3,528.2 15.9 24.8 212.7 7.1 3.12025 3,499.1 18.2 26.8 215.9 9.0 3.92030 3,469.9 20.4 28.8 219.0 10.9 4.82035 3,447.2 19.5 27.2 219.5 11.6 4.92040 3,424.4 18.5 25.6 220.0 12.3 5.02045 3,415.8 16.5 22.5 220.9 12.6 4.22050 3,407.1 14.5 19.3 221.8 12.9 3.42055 3,401.4 17.7 20.2 222.1 13.1 3.12060 3,395.6 20.8 21.1 222.5 13.4 2.9
Table 6. Baseline U.S. Carbon Stocks (Billion tons CO2),Including Above- and Below-Ground Stocks, Soil Carbon,Carbon Stored in Timber Products, and With (Part a) orWithout (Part b) Carbon from Electricity Offsets
change in carbon stocks −unconstrained land
change in carbon stocks −constrained land
year baselinewith
residueswithoutresidues
withresidues
withoutresidues
a: carbon from electricity offsets excluded2015 188.0 −0.1 0.1 −0.1 0.02020 191.0 −0.2 0.2 −0.2 0.12025 194.1 0.2 0.2 −0.5 −0.12030 197.2 0.6 0.2 −0.7 −0.32035 199.4 1.1 0.5 −0.8 −0.22040 201.5 1.5 0.8 −0.8 −0.12045 203.1 1.5 0.9 −1.0 0.02050 204.7 1.6 1.0 −1.2 0.02055 206.2 2.0 1.0 −1.2 −0.32060 207.7 2.4 1.0 −1.3 −0.6average annualflow (milliontons CO2/yr)
40.1 16.4 −21.3 −10.1
b: carbon electricity offsets included2015 188.0 0.1 0.3 0.1 0.22020 191.0 0.2 0.5 0.2 0.52025 194.1 0.9 0.8 0.2 0.52030 197.2 1.5 1.1 0.1 0.62035 199.4 2.2 1.6 0.3 0.92040 201.5 2.8 2.1 0.5 1.22045 203.1 3.0 2.3 0.5 1.42050 204.7 3.2 2.6 0.4 1.62055 206.2 3.6 2.6 0.4 1.32060 207.7 4.0 2.6 0.3 1.0average annualflow (milliontons CO2/yr)
67.2 43.4 5.7 16.3
Environmental Science & Technology Policy Analysis
dx.doi.org/10.1021/es2030142 | Environ. Sci. Technol. 2012, 46, 5664−56715668
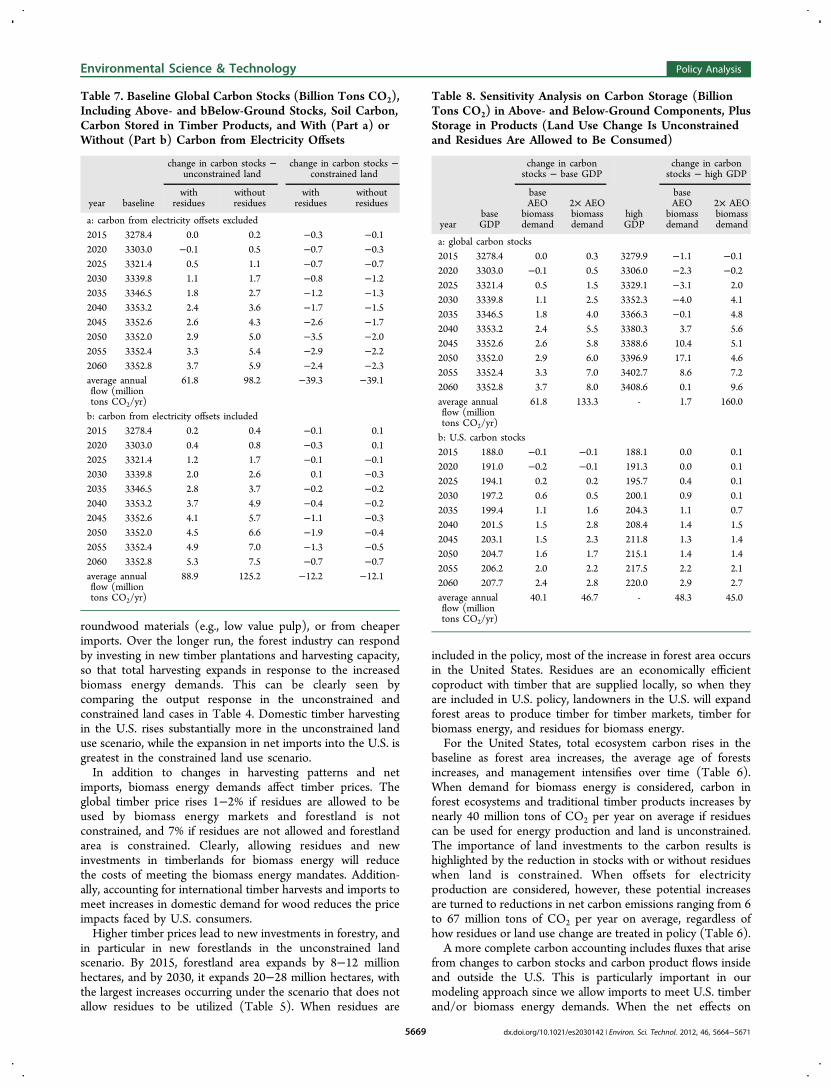
roundwood materials (e.g., low value pulp), or from cheaperimports. Over the longer run, the forest industry can respondby investing in new timber plantations and harvesting capacity,so that total harvesting expands in response to the increasedbiomass energy demands. This can be clearly seen bycomparing the output response in the unconstrained andconstrained land cases in Table 4. Domestic timber harvestingin the U.S. rises substantially more in the unconstrained landuse scenario, while the expansion in net imports into the U.S. isgreatest in the constrained land use scenario.In addition to changes in harvesting patterns and net
imports, biomass energy demands affect timber prices. Theglobal timber price rises 1−2% if residues are allowed to beused by biomass energy markets and forestland is notconstrained, and 7% if residues are not allowed and forestlandarea is constrained. Clearly, allowing residues and newinvestments in timberlands for biomass energy will reducethe costs of meeting the biomass energy mandates. Addition-ally, accounting for international timber harvests and imports tomeet increases in domestic demand for wood reduces the priceimpacts faced by U.S. consumers.Higher timber prices lead to new investments in forestry, and
in particular in new forestlands in the unconstrained landscenario. By 2015, forestland area expands by 8−12 millionhectares, and by 2030, it expands 20−28 million hectares, withthe largest increases occurring under the scenario that does notallow residues to be utilized (Table 5). When residues are
included in the policy, most of the increase in forest area occursin the United States. Residues are an economically efficientcoproduct with timber that are supplied locally, so when theyare included in U.S. policy, landowners in the U.S. will expandforest areas to produce timber for timber markets, timber forbiomass energy, and residues for biomass energy.For the United States, total ecosystem carbon rises in the
baseline as forest area increases, the average age of forestsincreases, and management intensifies over time (Table 6).When demand for biomass energy is considered, carbon inforest ecosystems and traditional timber products increases bynearly 40 million tons of CO2 per year on average if residuescan be used for energy production and land is unconstrained.The importance of land investments to the carbon results ishighlighted by the reduction in stocks with or without residueswhen land is constrained. When offsets for electricityproduction are considered, however, these potential increasesare turned to reductions in net carbon emissions ranging from 6to 67 million tons of CO2 per year on average, regardless ofhow residues or land use change are treated in policy (Table 6).A more complete carbon accounting includes fluxes that arise
from changes to carbon stocks and carbon product flows insideand outside the U.S. This is particularly important in ourmodeling approach since we allow imports to meet U.S. timberand/or biomass energy demands. When the net effects on
Table 7. Baseline Global Carbon Stocks (Billion Tons CO2),Including Above- and bBelow-Ground Stocks, Soil Carbon,Carbon Stored in Timber Products, and With (Part a) orWithout (Part b) Carbon from Electricity Offsets
change in carbon stocks −unconstrained land
change in carbon stocks −constrained land
year baselinewith
residueswithoutresidues
withresidues
withoutresidues
a: carbon from electricity offsets excluded2015 3278.4 0.0 0.2 −0.3 −0.12020 3303.0 −0.1 0.5 −0.7 −0.32025 3321.4 0.5 1.1 −0.7 −0.72030 3339.8 1.1 1.7 −0.8 −1.22035 3346.5 1.8 2.7 −1.2 −1.32040 3353.2 2.4 3.6 −1.7 −1.52045 3352.6 2.6 4.3 −2.6 −1.72050 3352.0 2.9 5.0 −3.5 −2.02055 3352.4 3.3 5.4 −2.9 −2.22060 3352.8 3.7 5.9 −2.4 −2.3average annualflow (milliontons CO2/yr)
61.8 98.2 −39.3 −39.1
b: carbon from electricity offsets included2015 3278.4 0.2 0.4 −0.1 0.12020 3303.0 0.4 0.8 −0.3 0.12025 3321.4 1.2 1.7 −0.1 −0.12030 3339.8 2.0 2.6 0.1 −0.32035 3346.5 2.8 3.7 −0.2 −0.22040 3353.2 3.7 4.9 −0.4 −0.22045 3352.6 4.1 5.7 −1.1 −0.32050 3352.0 4.5 6.6 −1.9 −0.42055 3352.4 4.9 7.0 −1.3 −0.52060 3352.8 5.3 7.5 −0.7 −0.7average annualflow (milliontons CO2/yr)
88.9 125.2 −12.2 −12.1
Table 8. Sensitivity Analysis on Carbon Storage (BillionTons CO2) in Above- and Below-Ground Components, PlusStorage in Products (Land Use Change Is Unconstrainedand Residues Are Allowed to Be Consumed)
change in carbonstocks − base GDP
change in carbonstocks − high GDP
yearbaseGDP
baseAEO
biomassdemand
2× AEObiomassdemand
highGDP
baseAEO
biomassdemand
2× AEObiomassdemand
a: global carbon stocks2015 3278.4 0.0 0.3 3279.9 −1.1 −0.12020 3303.0 −0.1 0.5 3306.0 −2.3 −0.22025 3321.4 0.5 1.5 3329.1 −3.1 2.02030 3339.8 1.1 2.5 3352.3 −4.0 4.12035 3346.5 1.8 4.0 3366.3 −0.1 4.82040 3353.2 2.4 5.5 3380.3 3.7 5.62045 3352.6 2.6 5.8 3388.6 10.4 5.12050 3352.0 2.9 6.0 3396.9 17.1 4.62055 3352.4 3.3 7.0 3402.7 8.6 7.22060 3352.8 3.7 8.0 3408.6 0.1 9.6average annualflow (milliontons CO2/yr)
61.8 133.3 - 1.7 160.0
b: U.S. carbon stocks2015 188.0 −0.1 −0.1 188.1 0.0 0.12020 191.0 −0.2 −0.1 191.3 0.0 0.12025 194.1 0.2 0.2 195.7 0.4 0.12030 197.2 0.6 0.5 200.1 0.9 0.12035 199.4 1.1 1.6 204.3 1.1 0.72040 201.5 1.5 2.8 208.4 1.4 1.52045 203.1 1.5 2.3 211.8 1.3 1.42050 204.7 1.6 1.7 215.1 1.4 1.42055 206.2 2.0 2.2 217.5 2.2 2.12060 207.7 2.4 2.8 220.0 2.9 2.7average annualflow (milliontons CO2/yr)
40.1 46.7 - 48.3 45.0
Environmental Science & Technology Policy Analysis
dx.doi.org/10.1021/es2030142 | Environ. Sci. Technol. 2012, 46, 5664−56715669
carbon stocks are measured globally, our results suggest thatbiomass energy policy using forests as a supply source willreduce net emissions by up to 98 million tons CO2 per yearwhen land is not constrained, and electricity offsets are notcounted (Table 7). If land is constrained, biomass energy policycould lead to an increase in net carbon emissions, even withenergy offsets. If land is unconstrained, as is likely the caseglobally where many low-cost sites for forest expansion exist,biomass energy policy in the U.S. will reduce net carbonemissions by up to 125 million tons CO2 per year on average.This level amounts to up to a 5% change in emissions for theentire U.S. electric power sector.21
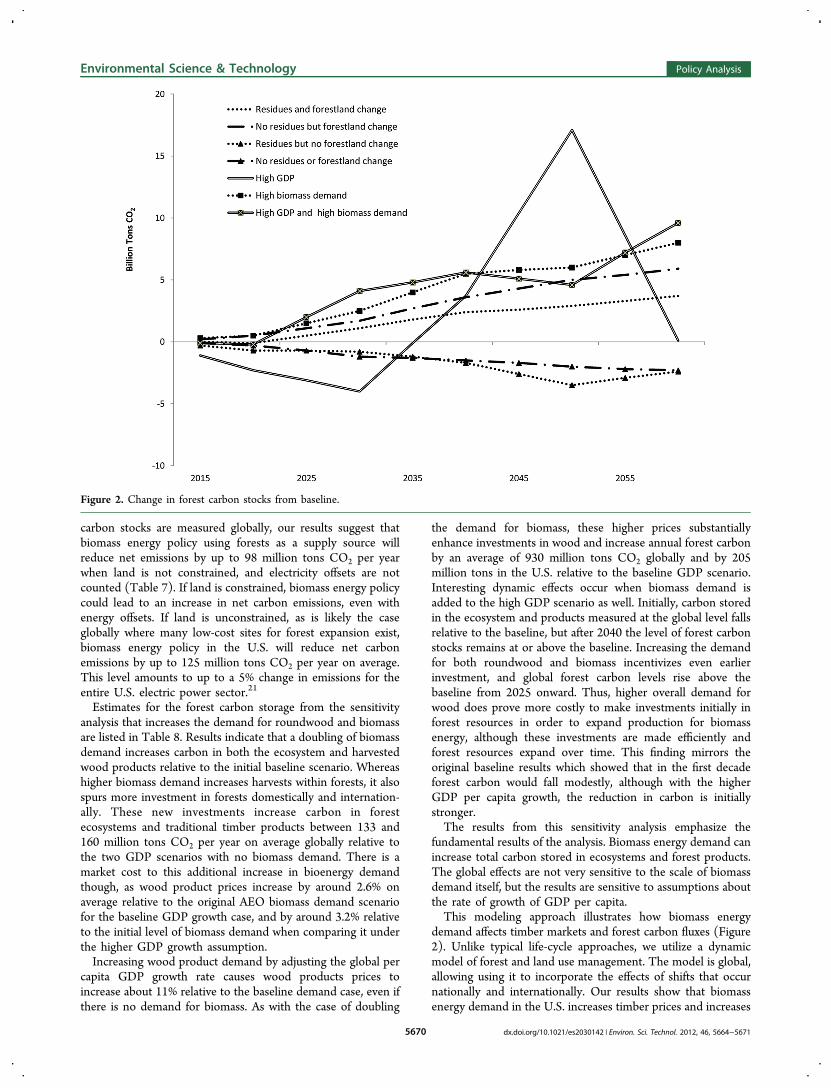
Estimates for the forest carbon storage from the sensitivityanalysis that increases the demand for roundwood and biomassare listed in Table 8. Results indicate that a doubling of biomassdemand increases carbon in both the ecosystem and harvestedwood products relative to the initial baseline scenario. Whereashigher biomass demand increases harvests within forests, it alsospurs more investment in forests domestically and internation-ally. These new investments increase carbon in forestecosystems and traditional timber products between 133 and160 million tons CO2 per year on average globally relative tothe two GDP scenarios with no biomass demand. There is amarket cost to this additional increase in bioenergy demandthough, as wood product prices increase by around 2.6% onaverage relative to the original AEO biomass demand scenariofor the baseline GDP growth case, and by around 3.2% relativeto the initial level of biomass demand when comparing it underthe higher GDP growth assumption.Increasing wood product demand by adjusting the global per
capita GDP growth rate causes wood products prices toincrease about 11% relative to the baseline demand case, even ifthere is no demand for biomass. As with the case of doubling
the demand for biomass, these higher prices substantiallyenhance investments in wood and increase annual forest carbonby an average of 930 million tons CO2 globally and by 205million tons in the U.S. relative to the baseline GDP scenario.Interesting dynamic effects occur when biomass demand isadded to the high GDP scenario as well. Initially, carbon storedin the ecosystem and products measured at the global level fallsrelative to the baseline, but after 2040 the level of forest carbonstocks remains at or above the baseline. Increasing the demandfor both roundwood and biomass incentivizes even earlierinvestment, and global forest carbon levels rise above thebaseline from 2025 onward. Thus, higher overall demand forwood does prove more costly to make investments initially inforest resources in order to expand production for biomassenergy, although these investments are made efficiently andforest resources expand over time. This finding mirrors theoriginal baseline results which showed that in the first decadeforest carbon would fall modestly, although with the higherGDP per capita growth, the reduction in carbon is initiallystronger.The results from this sensitivity analysis emphasize the
fundamental results of the analysis. Biomass energy demand canincrease total carbon stored in ecosystems and forest products.The global effects are not very sensitive to the scale of biomassdemand itself, but the results are sensitive to assumptions aboutthe rate of growth of GDP per capita.This modeling approach illustrates how biomass energy
demand affects timber markets and forest carbon fluxes (Figure2). Unlike typical life-cycle approaches, we utilize a dynamicmodel of forest and land use management. The model is global,allowing using it to incorporate the effects of shifts that occurnationally and internationally. Our results show that biomassenergy demand in the U.S. increases timber prices and increases
Figure 2. Change in forest carbon stocks from baseline.
Environmental Science & Technology Policy Analysis
dx.doi.org/10.1021/es2030142 | Environ. Sci. Technol. 2012, 46, 5664−56715670
harvests, but that the scope for increasing harvests initially inthe U.S. is limited. As a consequence, imports into the U.S. willincrease to help meet the overall demand for wood productsand biomass energy.Although demand for wood increases, the total carbon
maintained in forests also increases because higher wood priceslead to new investments in forest stocks. These investments innew timber plantations occur both within the U.S. and globallyand for varying levels of increases in demand for wood. Recentpolicies have suggested that the land that can be used to supplybiomass for energy and liquid fuels should be constrained, andwhen we test that scenario, we find that investments in newwood production decline, and biomass energy from forestfeedstocks could instead lead to an increase in net carbonemissions. Regardless of whether land is constrained or residuesare allowed to be used for biomass energy, if offsets from theproduction of electricity are considered, then biomass energyproduction with a forest feedstock will lead to a reduction innet greenhouse gas emissions. These results illustrate theimportance of capturing market adjustments when measuringthe carbon implications of biomass energy policies.
■ ASSOCIATED CONTENT
*S Supporting InformationAppendix describing the global forest and land use modelutilized in this paper. The first section shows the equations andparameters for the baseline model without the biomasscomponents. The biomass components are then introducedinto the model in the last section. This material is available freeof charge via the Internet at http://pubs.acs.org.
■ AUTHOR INFORMATION
Corresponding Author*E-mail: [email protected]; phone: +64 (0)9 574 4138; mail: Landcare Research, 231 Morrin Road, StJohns, Auckland 1072 New Zealand.
NotesThe authors declare no competing financial interest.
■ ACKNOWLEDGMENTSThis work was funded by the Resources For the FutureForestry Program. We also appreciate financial support formodel development from the U.S. Environmental ProtectionAgency Climate Change Division, the U.S. EnvironmentalProtection Agency Office of Transportation and Air Quality,the U.S. Department of Energy, and the Ohio AgriculturalResearch and Development Center. All ideas and opinionsexpressed in this paper, however, are those of the authors alone.
■ REFERENCES(1) Center for Climate and Energy Solutions, Renewable andAlternative Portfolio Standards. http://www.c2es.org/what_s_being_done/in_the_states/rps.cfm.(2) Intergovernmental Panel on Climate Change. 2006 IPCCGuidelines for National Greenhouse Gas Inventories; Volume 4, Chapter12; Harvested wood products. Pingoud, K.; Skog, K.; Martino, D.L.;Tonosaki, M.; Xiaoquan, Z.; Ford-Robertson, J. IntergovernmentalPanel on Climate Change, 2006; 33 pp.(3) Schlesinger et al. Letter to Speaker Pelosi, et al. U.S. Congress.May 17, 2010.(4) Lippke et al. Letter to Chairman Boxer, et al. U.S. Congress. July20, 2010.
(5) Walket, T., Ed.; Cardellichio, P.; Colnes, A.; Gunn, J.; Kittler, B.;Perschel, R.; Recchia, C.; Saah, D.; Walker, T. Massachusetts BiomassSustainability and Carbon Policy Study: Report to the Commonwealth ofMassachusetts Department of Energy Resources; Natural Capital InitiativeReport NCI-2010-30; Manomet Center for Conservation Sciences:Brunswick, ME, 2010; 182 pp.(6) Searchinger, T. D.; Hamburg, S. P.; Melillo, J; Chameides, W;Havlik, P; Kammen, D. M.; Likens, G. E.; Lubowski, R. N.;Obersteiner, M; Oppenheimer, M; Robertson, G. P.; Schlesinger, W.H.; Tilman, G. D. Fixing a Critical Climate Accounting Error. Science2009, 326 (5952), 527−528.(7) Hertel, T. W.; Golub, A.; Jones, A. D.; O’Hare, M.; Plevin, R. J.;Kammen, D. M. Effects of US maize ethanol on global land use andgreenhouse gas emissions: Estimating market-mediated responses.BioScience 2010, 60 (3), 223−231.(8) Sedjo, R. A. Carbon Neutrality and Bioenergy: A Zero Sum Game?;Discussion paper 11-15; Resources For the Future: Washington, DC,April 2011.(9) Sedjo, R. A. The Comparative Economics of Plantation Forestry: AGlobal Assessment; Resources for the Future/Johns Hopkins Press:Baltimore, MD, 1983.(10) Cubbage, F.; Koesbanda, S.; MacDonagh, P.; Balmelli, G.;Olmos, V. M.; Rubilar, R.; de la Torre, R.; Hoeflich, V.; Murraro, M.;Kotze, H.; Gonzalez, R.; Carrerro, O.; Frey, G.; Turner, J.; Lord, R.;Huang, J.; MacIntyre, C.; McGinley, K.; Abt, R.; Phillips, R. Globaltimber investments, wood costs, regulation, and risk. Biomass Bioenergy2010, 34 (12), 1667−1678.(11) Daigneault, A. J.; Sohngen, B.; Sedjo, R. A. Exchange Rates andthe Competitiveness of the United States Timber Sector in a GlobalEconomy. Forest Policy Econ. 2008, 10 (2008), 108−116.(12) Sohngen, B.; Brown, S. The Influence of Conversion of ForestTypes on Carbon Sequestration and other Ecosystem Services in theSouth Central United States. Ecol. Econ. 2006, 57, 698−708.(13) Alig, R. A.; Butler, B. J. Projecting Large-Scale Changes in LandUse and Land Cover for Terrestrial Carbon Analyses. Environ. Manage.2004, 33 (4), 443−456.(14) Sohngen, B.; Sedjo, R. A. Potential Carbon Flux from TimberHarvests and Management in the Context of a Global Timber Market.Climatic Change 2000, 44, 151−172.(15) Sohngen, B.; Mendelsohn, R. An Optimal Control Model ofForest Carbon Sequestration. Am. J. Agric. Econ. 2003, 85 (2), 448−457.(16) Kindermann, G.; Obersteiner, M.; Sohngen, B.; Sathaye, J.;Andrasko, K.; Rametsteiner, E.; Schlamadinger, B.; Wunder, S.; Beach,R. Global cost estimates of reducing carbon emissions through avoideddeforestation. Proc. Natl. Acad. Sci. 2008, 105 (30), 10302−10307.(17) Haynes, R. W. Emergent Lessons from a Century of Experience withPacific Northwest Timber Markets; Gen. Tech. Rep. PNW-GTR-747;U.S. Department of Agriculture, Forest Service, Pacific NorthwestResearch Station: Portland, OR; 45 pp.(18) Energy Information Administration. Annual Energy Outlook2010; DOE/EIA-0383(2010); U.S. Department of Energy, EnergyInformation Administration, Office of Integrated Analysis andForecasting: Washington, DC, 2010; 231 pp.(19) Historical Statistics of the World Economy; http://www.ggdc.net/MADDISON/oriindex.htm.(20) United Nations Food and Agricultural Organization. GlobalForest Resources Assessment; FAO: Rome, 2010; 340 pp.(21) U.S. Environmental Protection Agency. Inventory of U.S.Greenhouse Gas Emissions and Sinks: 1990−2009; EPA 430-R-11-005;Office of Atmospheric Programs: Washington, DC, 2011; 459 pp.
Environmental Science & Technology Policy Analysis
dx.doi.org/10.1021/es2030142 | Environ. Sci. Technol. 2012, 46, 5664−56715671