economic and socio-environmental evaluation of...
TRANSCRIPT
Economic and Socio-EnvironmentalEvaluation of Predator
Control Alternatives
Russell L. Gum and William E. Martin
A simulation model containing both economic (monetary) and socio-environmental(value index) components is developed in a case study of predator control alternatives.Particular emphasis is given to the description and justification of the socio-economicmodel. The economic model is estimated in terms of producers' and consumers'surpluses. The empirical tradeoff function developed suggests that alternatives to recentpredator control programs exist that would be "better" for both general public andproducer interests. The general approach can serve as a prototype for policy evaluationsinvolving multiple objectives.
Predator control is a complex, controver-sial, and to a few groups in our society, a veryemotional issue. At present there is a debateamong livestock producers, environmental-ists, animal protection groups, and govern-ment agencies over both the appropriatelevel of predator control and the appropriatecontrol methods. The coyote is the majorpredator harmful to agricultural productionin the western United States where annuallosses have been estimated at 8 percent oflambs born and more than 2 percent of thesheep inventory [Gee, et al.].
This paper presents and reports results of asimulation model designed to generate amultiple objective analysis of the level andmethods of coyote control in protectingsheep herds. Specific attention is given to thedevelopment of an environmental qualityindex generally relevant to predator controland specifically related to coyote control, and
Russell Gum is Agricultural Economist, Natural Re-sources Economics Division, Economics, Statistics andCooperatives Service, USDA, and Adjunct Professor ofAgricultural Economics, University of Arizona. WilliamE. Martin is Professor of Agricultural Economics, Uni-versity of Arizona.
Arizona Agricultural Experiment Station Journal ArticleNo. 2956.
to measuring net economic costs and benefitsof coyote control in terms of producers' andconsumers' surpluses. The economic andenvironmental measures are used to developa production possibilities frontier for eco-nomic efficiency and environmental qualityrelevant to coyote control. The biological re-sponse portion of the model, based on inputfrom biological scientists involved with pred-ator control, is only treated cursorily here.For those and other details of the model seeGum et al. (1978).
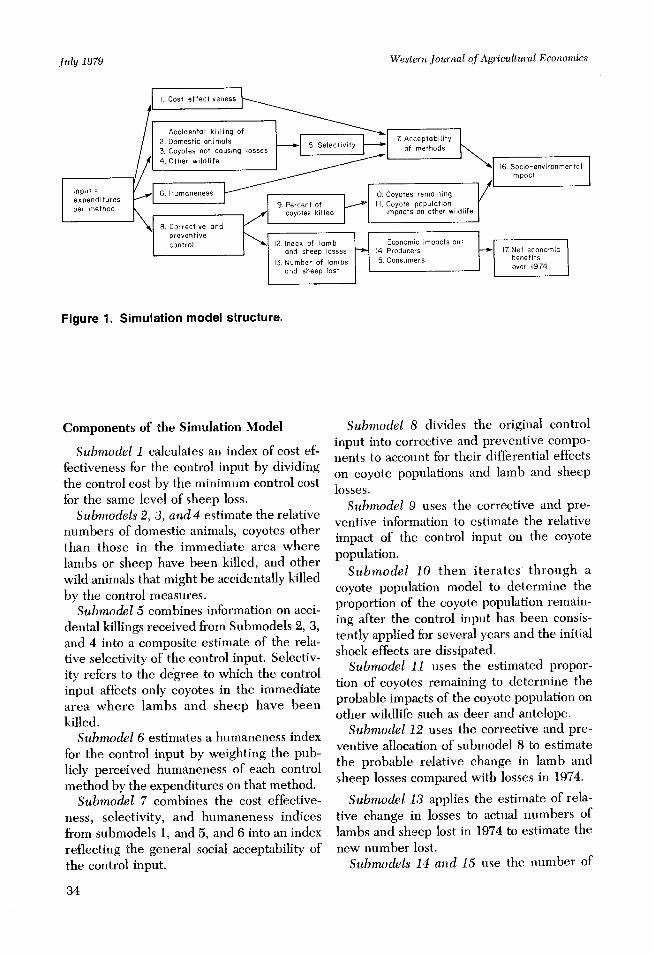
The simulation model is a mathematicalapproximation of the real life biological, eco-nomic, and social systems which are eitheraffected by coyote control or influence itsimpacts. The general structure of the modelis shown in Figure 1. Dollar expenditure in-formation for each control method is fed tothe appropriate submodels of the system,which in turn provide information for otherparts of the system. The various impacts ofthe control input are estimated and con-densed into two final outputs: the socio-environmental index and the net change ineconomic benefits relative to actual 1974 con-trol. Each submodel is briefly described be-low, followed by a discussion of proceduresfor estimating the economic and socio-environmental impacts.
33
Western Journal of Agricultural Economics
Figure 1. Simulation model structure.
Components of the Simulation Model
Submodel 1 calculates an index of cost ef-fectiveness for the control input by dividingthe control cost by the minimum control costfor the same level of sheep loss.
Submodels 2, 3, and 4 estimate the relativenumbers of domestic animals, coyotes otherthan those in the immediate area wherelambs or sheep have been killed, and otherwild animals that might be accidentally killedby the control measures.
Submodel 5 combines information on acci-dental killings received from Submodels 2, 3,and 4 into a composite estimate of the rela-tive selectivity of the control input. Selectiv-ity refers to the degree to which the controlinput affects only coyotes in the immediatearea where lambs and sheep have beenkilled.
Submodel 6 estimates a humaneness indexfor the control input by weighting the pub-licly perceived humaneness of each controlmethod by the expenditures on that method.
Submodel 7 combines the cost effective-ness, selectivity, and humaneness indicesfrom submodels 1, and 5, and 6 into an indexreflecting the general social acceptability ofthe control input.
34
Submodel 8 divides the original controlinput into corrective and preventive compo-nents to account for their differential effectson coyote populations and lamb and sheeplosses.
Submodel 9 uses the corrective and pre-ventive information to estimate the relativeimpact of the control input on the coyotepopulation.
Submodel 10 then iterates through acoyote population model to determine theproportion of the coyote population remain-ing after the control input has been consis-tently applied for several years and the initialshock effects are dissipated.
Submodel 11 uses the estimated propor-tion of coyotes remaining to determine theprobable impacts of the coyote population onother wildlife such as deer and antelope.
Submodel 12 uses the corrective and pre-ventive allocation of submodel 8 to estimatethe probable relative change in lamb andsheep losses compared with losses in 1974.
Submodel 13 applies the estimate of rela-tive change in losses to actual numbers oflambs and sheep lost in 1974 to estimate thenew number lost.
Submodels 14 and 15 use the number of
July 1979
Predator Control
lambs and sheep lost to determine the quan-tity of lambs marketed, then estimatethrough use of a demand equation the retailand farm prices, and finally calculate theeconomic impacts on producers (net changein total sales proceeds) and on consumers (netchange in consumers' surplus).
Submodel 16 compiles and condenses theinformation on social acceptability ofmethods, number of coyotes remaining, andcoyote impacts on other wildlife into a com-posite index reflecting both social andenvironmental factors - hereafter called thesocio-environmental index. The weights usedin combining the three items are based onpublic perception of the relative importanceof each item.
Submodel 17 calculates the net change ineconomic benefits of the particular controlinput relative to 1974 conditions, by sum-ming the positive or negative change in eco-nomic impacts on producers and consumersand then deducting the positive or negativechange in control costs relative to 1974 costs.
The simulation model is a prototype sys-tems approach to a comprehensive evaluationof the coyote control issue. Relationshipswhich determine the economic and socio-environmental impacts of control measuresare explicitly identified and quantified. Thequantified relationships are based upon thebest data and judgment available during the1975-77 time period of the study. Whileneither the basic data nor the functional rela-tionships can be represented as "absolutelytrue," the model provides a useful first ap-proximation for policy discussion. As Bould-ing comments on economic measurement ofcost-benefit analysis in Economics as a Sci-ence,
... it is a useful first approximation andwhen it comes to evaluating difficult choicesit is extremely useful to have a first approx-imation that we can modify. Without someguidelines, indeed, all evaluation is randomselection by wild hunches. (p. 129)
The purpose of the model is not to dis-cover a single answer, but rather to provide astructure for use in analyzing the predator
control issue. In terms of data quality, eco-nomic data (costs and demands) are readilyavailable, public attitudes and perceptionsare obtained by survey techniques, but thereare arguments among wildlife biologists as tothe exact relationships among predator con-trol, coyotes, and other species. As improvedknowledge of the biological relationships isgenerated, further analysis of the coyote con-trol issue may be done using this structure.
Conceptual Framework
The two major goals of interest are socio-environmental and economic. The two goals,being measured in different dimensions, arenot aggregated; instead, data on each are pre-sented in a trade-off function.
The economic component is handled tra-ditionally in terms of consumers' and pro-ducers' surplus. The conceptual frameworkunderlying the socio-environmental portionof the simulation model (all those data lead-ing to submodel 16) is based on the multipleobjective planning system variously known as"Strawman" [Technical Committee 1971],TECHOM [Technical Committee 1974; Gumet al., 1976], or "S.Q.P.I.: System for Quan-tified Planning Inquiry" [Arthur et al., 1976].The planning system consists of a hierarchicalstructure of goals and subgoals where infor-mation about the achievement of lower levelgoals, weighted by their relative importance,is aggregated to form the information aboutachievement of the higher levels of thehierarchy. While goal hierarchies can be de-fined for any major societal goal, includingeconomic goals, only a socio-environmentalgoal hierarchy related to coyote control is de-fined here.
Economists have long agreed that whilethere are goals other than economic effi-ciency in the decision-making process, it isnot for them to make decisions about the rel-ative weights of these objectives. As Beattieet al. argue in a summary of economic opin-ion, "Rather than attempting to estimate theweighting scheme of the political process byobserving its actions, it would seem more log-
35
Gum and Martin
Western Journal of Agricultural Economics
ical and less conducive to error to provideinformation concerning the consequences toalternative actions and leave the weighting ofthese consequences to the political process"(p. 7). The System for Quantified PlanningInquiry (S.Q.P.I.), when combined withseparate economic analysis, offers informa-tion on alternative actions for both economicconsequences and socio-environmental pref-erences for the decision-makers' considera-tion. As formulated here, S.Q.P.I. providesa cardinal measure of the major goal ofsocio-environmental quality, although anyparticular value can only be compared to analternative value produced from an alterna-tive action. For the group of people express-ing their preferences, one action is better orworse than the other by a given percent.Naturally, a different, relatively homoge-neous group could have a different socio-environmental quality index. Thus, for anygiven policy action and a given group ofpeople, the trade-off information will show again or loss in economic benefits and a gain orloss in socio-environmental quality relative toan alternative action. No optimum isspecified. Such trade-off information wouldbe equally useful if the socio-environmentalindex were only ordinal rather than cardinal.
The concept of a hierarchical structure formeasuring "fuzzy" goals such as environmen-tal quality, and providing a clearer, moreconcrete analysis of what kind of resultsenvironmental action should be producing,goes back to the "Administrative Behavior"concepts of Herbert Simon. At higher levels,goals are harder to describe operationally andcriteria for success are harder to agree upon.However, the higher goals may be brokeninto sublevel goals until, at the bottom of thestructure, the goals may be directly per-ceived and operationally measured. Further,where there is more than one goal on a givenlevel, each should be assigned its relativeweight.
Socio-Environmental Structure forCoyote Control
Figure 2 illustrates the socio-environmen-
36
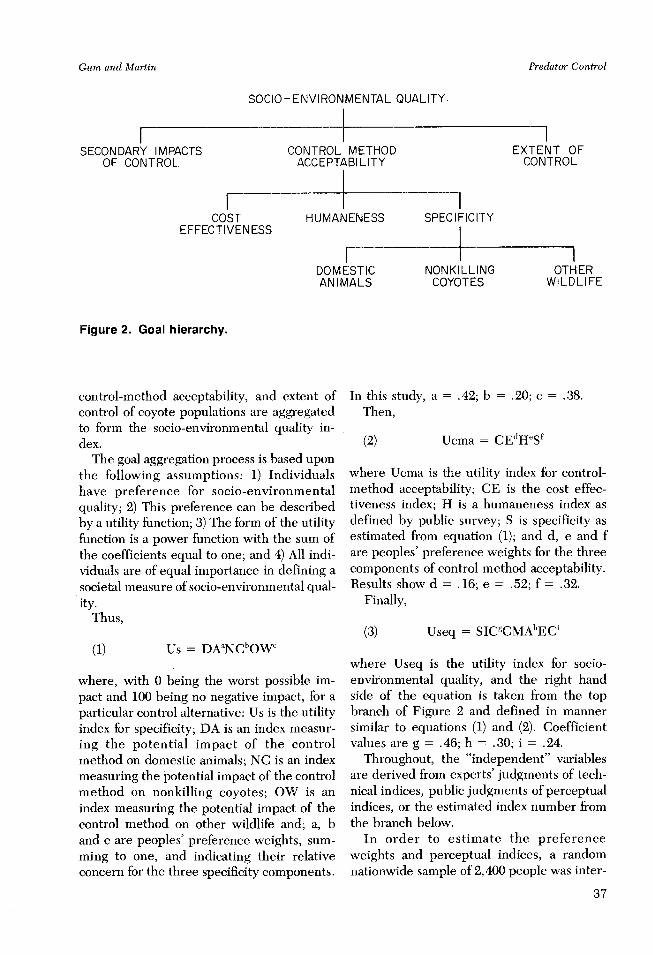
tal goal hierarchy for coyote control policies.The goals are displayed graphically as a treestructure with the more general measures atthe top and the component-specific measuresat the bottom. The procedure for the socio-environmental analysis involves a four stepprocess building on this hierarchical struc-ture: 1) Identification of areas of concern (so-cial goals); 2) Development of measures oftechnical results of alternative actions (tech-nical indicators); 3) Development of relation-ships of technical indicators to social goals;and 4) Weighting and aggregation of specificsocial goals to yield measures of more generalsocial goals.
Three areas of concern are identified forthe evaluation of coyote control alternativesin step 1: 1) Perceived acceptability of thecontrol methods; 2) The amount of change incoyote population levels; and 3) Secondaryimpacts on other wildlife of changes in coyotepopulations.
These three concerns are shown as leadingto the major goal of socio-environmentalquality in Figure 2. Two of these three con-cerns are directly measurable. However, thethird, the acceptability of predator controlmethods is, in turn, dependent upon: 1)Humaneness, which is the amount of suffer-ing inflicted on the victims of control; 2) Spe-cificity, relating to the accidental killing ofnontarget animals; and 3) Cost-effectiveness,as reflected by the control cost divided by theminimum control cost for the same level ofsheep loss.
The specificity measure branches intodomestic animals, wild animals other thancoyotes, and coyotes that are not in the im-mediate area where losses to sheep andlambs have been occurring.
The aggregation process of step 4 relatesthe technical measures of the specific socialgoals to the general goal of environmentalquality. First, the three measures of spe-cificity are aggregated into a general measureof specificity. Then, humaneness, specificityand cost-effectiveness are aggregated into ageneral measure of control-method ac-ceptability. Finally, secondary impacts of
July 1979
Gum and Martin
SOCIO-ENVIRONMENTAL QUALITY
SECONDARY IMPACTSOF CONTROL
ICOST
EFFECTIVENESS
CONTROL METHODACCEPTABILITY
HUMANENESS
DOMESTICANIMALS
Figure 2. Goal hierarchy.
control-method acceptability, and extent ofcontrol of coyote populations are aggregatedto form the socio-environmental quality in-dex.
The goal aggregation process is based uponthe following assumptions: 1) Individualshave preference for socio-environmentalquality; 2) This preference can be describedby a utility function; 3) The form of the utilityfunction is a power function with the sum ofthe coefficients equal to one; and 4) All indi-viduals are of equal importance in defining asocietal measure of socio-environmental qual-ity.
Thus,
(1) Us = DAaNCbOWC
where, with 0 being the worst possible im-pact and 100 being no negative impact, for aparticular control alternative: Us is the utilityindex for specificity; DA is an index measur-ing the potential impact of the controlmethod on domestic animals; NC is an indexmeasuring the potential impact of the controlmethod on nonkilling coyotes; OW is anindex measuring the potential impact of thecontrol method on other wildlife and; a, band c are peoples' preference weights, sum-ming to one, and indicating their relativeconcern for the three specificity components.
In this study, a = .42; b = .20; c = .38.Then,
(2) Ucma = CEdHeSf
where Ucma is the utility index for control-method acceptability; CE is the cost effec-tiveness index; H is a humaneness index asdefined by public survey; S is specificity asestimated from equation (1); and d, e and fare peoples' preference weights for the threecomponents of control method acceptability.Results show d = .16; e = .52; f = .32.
Finally,
(3) Useq = SICgCMAhECi
where Useq is the utility index for socio-environmental quality, and the right handside of the equation is taken from the topbranch of Figure 2 and defined in mannersimilar to equations (1) and (2). Coefficientvalues are g = .46; h = .30; i = .24.
Throughout, the "independent" variablesare derived from experts' judgments of tech-nical indices, public judgments of perceptualindices, or the estimated index number fromthe branch below.
In order to estimate the preferenceweights and perceptual indices, a randomnationwide sample of 2,400 people was inter-
37
EXTENT OFCONTROL
SPECIFICITY
INONKILLING
COYOTES
IOTHER
WILDLIFE
I ~_ _ i I_ _ I_
i
Predator Control
Western Journal of Agricultural Economics
viewed by telephone. By use of a computer-assisted phone interview system and profes-sional interviewers, a response rate of 78percent was achieved using a sample designthat assured random selection by both sexand age.
The questions were of a "rank and distrib-ute" form, where respondents were firstasked to rank a set of concerns reflecting onelevel of the tree in Figure 2 and then to dis-tribute 100 points among the items to reflecttheir relative importance. For a discussion ofthe statistical properties of this form of ques-tion see Carpenter and Blackwood.
The results from this "allocate 100 point"type of question are directly interpreted asthe coefficients of the utility function. Theinterpretation depends upon the assumptionof a utility function with the form of a powerfunction that is homogenous of degree one.Although for the specific stimuli related tocoyote control this interpretation is just anassumption, other researchers have foundthe power function to describe empirically awide range of value-related stimulus re-sponse phenomena [Stevens, Hamblin andSmith, Dawson and Brinkler, Gregson andRussell, Hamblin, Judge, and Maskowitz].For further discussion of the rationale, as-sumptions, and validity of this approach, seeGum et al. (1976) and Roefs.
There are several alternative methods ofaggregating individual utility functions toproduce a single environmental quality in-dex. The simplest approach, on which theresults presented in this paper are based, isto use the average responses as a representa-tive utility function. Other approaches arediscussed in Gum et al. (1976). They includeaggregating individual functions before com-puting an average function, and grouping in-dividuals by interest group, by homogenousvalues, or by homogenous characteristicssuch as income or geographic area. In thisstudy of coyote control the results were notsensitive to the method by which individualutility functions were aggregated (Arthur etal., 1977).
38
Economic Structure and Estimates
To reflect the total economic impact ofcoyote predation on sheep and lambs,changes in producers' surplus and consum-ers' surplus resulting from a change in thelevel of control expenditure and mix of con-trol methods from those of 1974 must be es-timated. Both surplus measures are shortterm specifically for 1974 conditions, and donot reflect producers going out of business,consumers substituting other products forlamb, or other long term adjustments.
A demand function for lamb was estimatedto serve as the basis for calculating the con-sumers' and producers' surpluses. The datafor the demand analysis consist of quarterlyobservations for 1958 through 1974 for theU.S. for the following variables: P = Seasonalaverage retail price of lamb; QL = Seasonalaverage per capita consumption of lamb andmutton; QB = Seasonal average per capitaconsumption of beef; QP = Seasonal averageper capita consumption of pork; I = Per capi-ta personal disposable income; and T =Time.
The regression equation selected was:
(4) P = 65.5 -20.80QL -1.20QB
(3.1) (2.4)
-0.71QP + 0.121 -0.50T(QL)
(3.2) (29.3) (4.7)
with a coefficient of determinaton of .99 andan F ratio (for the test that all coefficientsequal zero) of 1170. T-tests for all variablesincluded in the model (in parentheses) weresignificant at the .95 confidence level. Thesignificance of the T(QL) variable indicatesthat the slope of the demand function ischanging over time.
To estimate the 1974 demand for lamb, theaverage 1974 values for QB, QP, I, and T for1974 were substituted into the demand equa-tion. The resulting estimate of the demandfunction was
(5) P = 169 -54QL.
July 1979
Gum and Martin
At the average 1974 quantity, price flexibilitywas -. 17; that is, a one percent increase inthe quantity of lamb produced would haveresulted in a .17 percent decrease in the re-tail price of lamb.
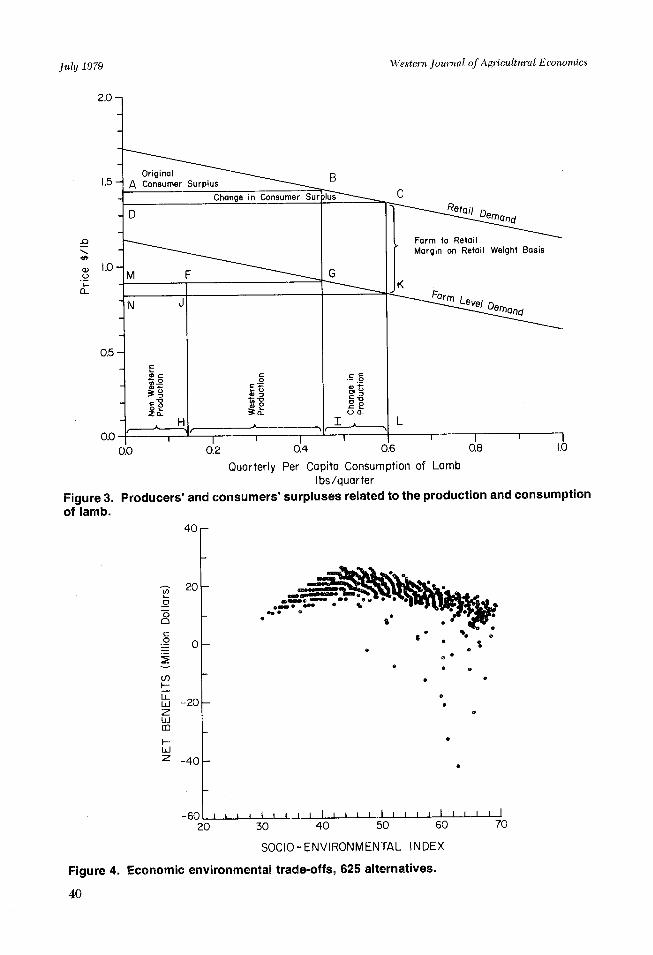
If, for example, the coyote control alterna-tive resulted in less sheep and lamb lossesthan observed in 1974, lamb productionwould increase and prices would fall. The re-sulting change in consumers' surplus is calcu-lated directly from the demand curve as areaA B C D in Figure 3.1 The change in consum-ers' surplus has been shown by Willig (1976)to be a reasonable approximation of thetheoretically more correct welfare measure ofcompensation variation.
To calculate the change in producers'surplus of the western sheep producers thefollowing assumptions were made: 1) Themarginal cost of raising to market a lambsaved from coyote predation is zero. Sincemost costs to sheep ranchers are either fixedor related to raising and feeding the ewes,this is a reasonable assumption. Detail oncosts of sheep production can be found inGee (1977). 2) A constant farm to retail mar-gin exists for all alternative quantities of lambmarketed.
Given these assumptions, the change inproducers' surplus due to reduced sheep andlamb losses to coyotes is the difference be-tween the gross returns under the originalcondition and the control alternative. In Fig-ure 3 this change is indicated by the differ-ence between rectangles F G H I and J K LH. 2
The net economic benefits of a control al-ternative are calculated as the sum of thechanges from 1974 conditions of consumers'surplus and western sheep ranchers pro-ducers' surplus, minus the change in costs ofcontrol. Thus, control costs were not allo-
Under the assumptions of a constant marketing margin,the change in consumers' surplus is identical at the re-tail and farm level. Thus, ABCD equals MGKN. Sinceretail demand was estimated and a constant marketingmargin is an assumption, our estimate is at the retaillevel.
cated to producers or consumers, but weresubtracted from total benefits to yield arealistic representation of net societal bene-fits.
Results
To evaluate the predator control alterna-tives, systematic variations in the levels oftrapping, aerial gunning, 1080 toxicant, andM-44 were made using the 1974 levels of allother methods as a base. 1080 toxicant is arelatively slow acting poison. M-44 is aspringloaded sodium cyanide injector whichshoots cyanide into the coyote's mouth whenhe tugs on the scented bait. The other, muchless efficient alternatives, are snaring, den-ning (digging coyote pups out of the den),and shooting from the ground.
The level of each method was varied insteps of $2 million from $0 to $8 million ofexpenditures. All possible combinations ofexpenditures and methods were investi-gated, resulting in 625 combinations. A scat-ter plot of the results in terms of the trade-offs between the environmental index ascalculated by the average utility function andnet economic benefits is presented in Figure4. The 1974 base is at zero net economic ben-efits with a socio-environmental index of 64.
With some exceptions, control alternativeswith lower values than any other alternativefor both the socio-environmental index andfor net economic benefits were judged ineffi-cient and eliminated from further analyses.The exceptions included for analysis werethose alternatives which were the most effi-cient of those which do not include either1080 or M-44. Of the resulting set of efficientalternatives, presented in Table 1 and Figure
2 Schmalensee argues that under conditions of pure com-petition, Marshallian surplus, that is the sum of pro-ducers' and consumers' surplus, may be measured ateither the retail or derived demand level. The distribu-tion between producers and consumers will change,however, if the marketing margin is not constant.Under our assumption of a constant margin, the changein consumers' surplus at the retail level plus the changein producers' surplus at the producer level equals thetotal change in economic benefits.
39
Predator Control
Western Journal of Agricultural Economics
0
a)
Producers' and
Quarterly Per Capita Consumption of LambIbs/quarter
consumers' surpluses related to the production and consumption
An r
C')
o
O
0
C)
HILLLU
H-W
LJz
20
0
-20
-40
crc
0.** 0 .
ememompomoo , 0f 0 %
0 :
0* 0
& 0
* 0
I I I I I I I I II I I I i i I I I I I I I I I I
20 30 40 50 60
SOCIO-ENVIRONMENTAL INDEX
Figure 4. Economic environmental trade-offs, 625 alternatives.
40
Figure 3.of lamb.
70UkJ I I II I ! I E · .I. ......
July 1979
n i\
"!u
i
.a
.
m- *
_ . . . . ..
Gum and Martin
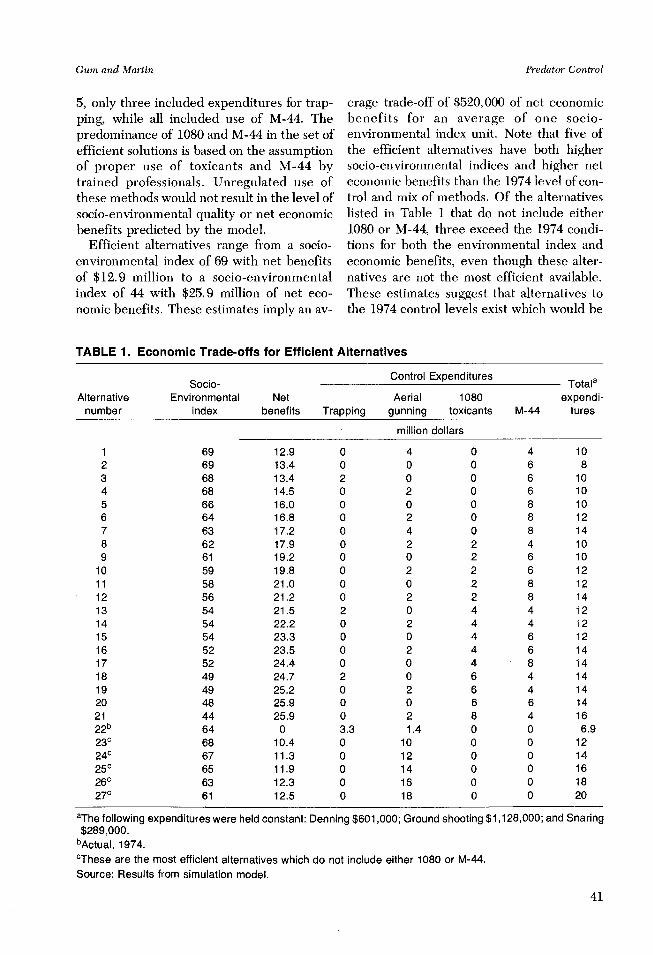
5, only three included expenditures for trap-ping, while all included use of M-44. Thepredominance of 1080 and M-44 in the set ofefficient solutions is based on the assumptionof proper use of toxicants and M-44 bytrained professionals. Unregulated use ofthese methods would not result in the level ofsocio-environmental quality or net economicbenefits predicted by the model.
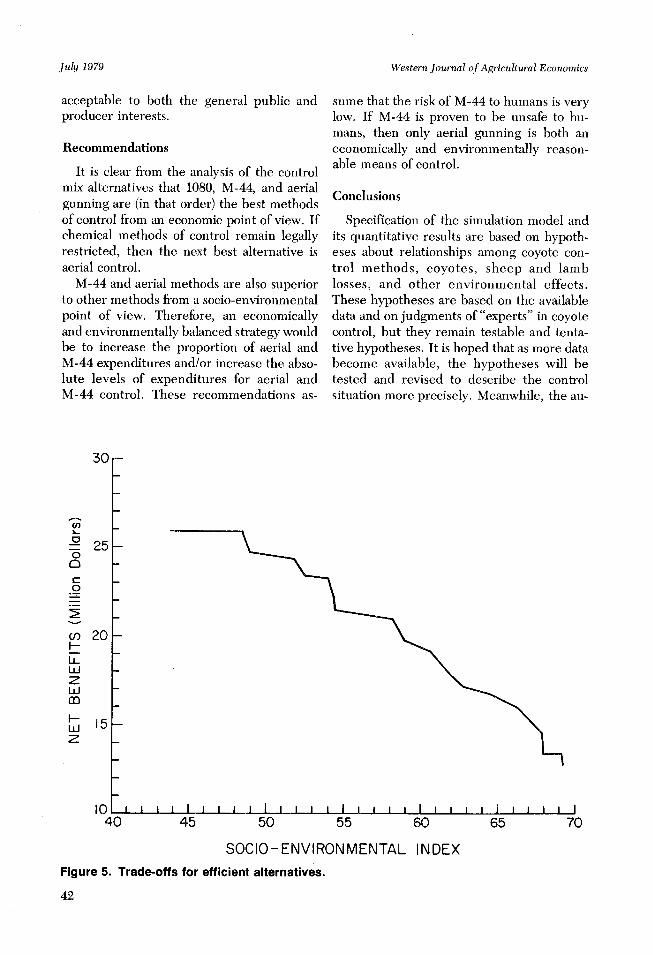
Efficient alternatives range from a socio-environmental index of 69 with net benefitsof $12.9 million to a socio-environmentalindex of 44 with $25.9 million of net eco-nomic benefits. These estimates imply an av-
erage trade-off of $520,000 of net economicbenefits for an average of one socio-environmental index unit. Note that five ofthe efficient alternatives have both highersocio-environmental indices and higher neteconomic benefits than the 1974 level of con-trol and mix of methods. Of the alternativeslisted in Table 1 that do not include either1080 or M-44, three exceed the 1974 condi-tions for both the environmental index andeconomic benefits, even though these alter-natives are not the most efficient available.These estimates suggest that alternatives tothe 1974 control levels exist which would be
TABLE 1. Economic Trade-offs for Efficient Alternatives
Control Expenditures TSocio- Totala
Alternative Environmental Net Aerial 1080 expendi-number index benefits Trapping gunning toxicants M-44 tures
million dollars
1 69 12.9 0 4 0 4 102 69 13.4 0 0 0 6 83 68 13.4 2 0 0 6 104 68 14.5 0 2 0 6 105 66 16.0 0 0 0 8 106 64 16.8 0 2 0 8 127 63 17.2 0 4 0 8 148 62 17.9 0 2 2 4 109 61 19.2 0 0 2 6 10
10 59 19.8 0 2 2 6 1211 58 21.0 0 0 2 8 1212 56 21.2 0 2 2 8 1413 54 21.5 2 0 4 4 1214 54 22.2 0 2 4 4 1215 54 23.3 0 0 4 6 1216 52 23.5 0 2 4 6 1417 52 24.4 0 0 4 8 1418 49 24.7 2 0 6 4 1419 49 25.2 0 2 6 4 1420 48 25.9 0 0 6 6 1421 44 25.9 0 2 8 4 1622b 64 0 3.3 1.4 0 0 6.923c 68 10.4 0 10 0 0 1224c 67 11.3 0 12 0 0 1425c 65 11.9 0 14 0 0 1626c 63 12.3 0 16 0 0 1827c 61 12.5 0 18 0 0 20
aThe following expenditures were held constant: Denning $601,000; Ground shooting $1,128,000; and Snaring$289,000.
bActual, 1974.CThese are the most efficient alternatives which do not include either 1080 or M-44.Source: Results from simulation model.
41
Predator Control
Western Journal of Agricultural Economics
acceptable to both the general public andproducer interests.
Recommendations
It is clear from the analysis of the controlmix alternatives that 1080, M-44, and aerialgunning are (in that order) the best methodsof control from an economic point of view. Ifchemical methods of control remain legallyrestricted, then the next best alternative isaerial control.
M-44 and aerial methods are also superiorto other methods from a socio-environmentalpoint of view. Therefore, an economicallyand environmentally balanced strategy wouldbe to increase the proportion of aerial andM-44 expenditures and/or increase the abso-lute levels of expenditures for aerial andM-44 control. These recommendations as-
3u
C3ano
0
LUz.
O
I-
LJZ
25
20
15
10
sume that the risk of M-44 to humans is verylow. If M-44 is proven to be unsafe to hu-mans, then only aerial gunning is both aneconomically and environmentally reason-able means of control.
Conclusions
Specification of the simulation model andits quantitative results are based on hypoth-eses about relationships among coyote con-trol methods, coyotes, sheep and lamblosses, and other environmental effects.These hypotheses are based on the availabledata and on judgments of "experts" in coyotecontrol, but they remain testable and tenta-tive hypotheses. It is hoped that as more databecome available, the hypotheses will betested and revised to describe the controlsituation more precisely. Meanwhile, the au-
I I I I I I I I I I I I I I I I I I I I I I I I I I I I I
3 45 50 55 60 65 70
SOCIO-ENVIRONMENTAL INDEX
Figure 5. Trade-offs for efficient alternatives.
42
. I I I I I I I
July 1979
12 rm-
I
4(
Gum and Martin
thors believe this simulation is a reasonableapproximation of reality which can providevaluable information to decision makers. Inaddition, the general approach can serve as aprototype for future policy evaluations in-volving multiple objectives.
Epilogue
Subsequent to the development of thesimulation model, the authors became in-volved with the policy process as a member(and alternate member) of the Secretary ofInterior's "Animal Damage Control PolicyStudy Advisory Committee." Representationon the committee came from the sheep andcattle industries, environmental organiza-tions, and state and federal agencies as wellas from academia.
The model was offered for use as a learningtool, where the committee members couldsuggest various changes in the assumptionsabout the technical relationships and observethe sensitivity of the results to those changes.The committee as a group could use thestructure for a discussion of the issues.
With several exceptions, the members de-clined the opportunity, preferring instead toexamine the data in unintegrated bits andpieces. There was a tendency to emphasizethe data and results that supported their pre-conceived positions and attacking as "unsci-entific" the portions of the model with whichthey did not agree. The first draft of thestudy report, even stated that "Controver-sial, political issues in general are not amena-ble to solution by orderly, rational analysis,irrespective of whether or not the analysesare run through a computer." [U.S. Fish andWildlife Service, p. C-7, 1978].
It appears that rational policy analysis stillfaces a long uphill climb.
References
Arthur, L. M., Nicolaas W. Bouwes and Russell L.Gum, "S.Q.P.I.: System for Quantified Planning In-quiry," Working Paper No. 5, Natural Resource Eco-nomics Division, Economic Research Service, U.S.Department of Agriculture, March 1976.
Arthur, L. M., R. L. Gum, E. H. Carpenter and W. W.Shaw, "Predator Control: The Public Viewpoint,"Trans. of the 42nd North American Wildlife andNatural Resources Conference, pp. 137-45, 1977.
Beattie, B. R., E. N. Castle, W. G. Brown and W. L.Griffin, Economic Consequences of Interbasin WaterTransfer. Oregon State University Agricultural Exper-iment Station, Technical Bulletin 116, June 1971.
Boulding, Kenneth E., Economics as a Science,McGraw-Hill Book Company, New York, 1970.
Carpenter, E. and L. G. Blackwood, "The Effect ofQuestion Position on Responses to Attitudinal Ques-tions," Rural Sociology, 44(1979).
Dawson, W. E. and R. P. Brinker, "Validation of RatioScales of Opinion by Multimodality Matching," Per-cept. Psychophysics, 9(1971):413-417.
Gee, C. K., Enterprise Budgets for Western CommercialSheep Businesses, 1974, ERS-659, Natural ResourceEconomics Division, Economic Research Service,U.S. Department of Agriculture, March 1977.
Gee, C. K., R. Magleby, W. R. Bailey, R. L. Gum, andL. M. Arthur, Sheep and Lamb Losses to Predatorsand Other Causes in the Western United States,AER-369, Natural Resource Economics Division,Economic Research Service, U. S. Department of Ag-riculture, March 1977.
Gregson, R. A. M. and P. N. Russell, "PsychophysicalPower Law Exponent Value for Sucrose Intensity,"Perceptual Motor Skills, 20(1965):294.
Gum, Russell L., Louise M. Arthur and Richard S. Mag-leby, Coyote Control: A Simulation Evaluation of Al-ternative Strategies, AER-408, Natural Resource Eco-nomics Division, Economics, Statistics, and Coopera-tives Service, U.S. Department of Agriculture, July1978.
Gum, Russell L., T. G. Roefs and D. B. Kimball,"Quantifying Societal Goals: Development of aWeighting Methodology," Water Resources Research,12(1976):617-622.
Hamblin, Robert L., "Mathematical Experimentationand Sociological Theory: A Critical Analysis,"Sociometry, 34(1971):423-452.
Hamblin, Robert L. and C. R. Smith, "Values, Statusand Professors," Sociometry, 29(1966):183-196.
Judge, Robert M., "Cognitive Strawman: Public Input toa Water Resource Planning System," dissertation,Department of Hydrology and Water Resources, Uni-versity of Arizona, Tucson, 1975.
43
Predator Control
Western Journal of Agricultural Economics
Maskowitz, H. R., "Perceptual Changes in Taste Mix-tures," Percept. Psychophysics, 11(1972):257-262.
Roefs, T. G., "Two Methods of Adding Information tothe Resources Management Process," EconomicModelingfor Water Policy Evaluation, Spec. Manage.Sci. Ser., edited by R. M. Thrall et. al., Vol. 3, NorthHolland, Amsterdam, 1975.
Schmalensee, Richard, "Another Look at the Social Val-uation of Input Price Changes," The American Eco-nomic Review, 66(1976):239-243.
Simon, Herbert A., Administrative Behavior, 3rd Edi-tion, The Free Press, New York, N.Y., 1976.
Stevens, S. S., "A Metric for the Social Consensus," Sci-ence, 151(1966):530-541.
Technical Committee, "Water Resources Planning andSocial Goals: Conceptualization Toward a NewMethodology," Publ. PRWG-94-1, Water Res. Lab.,Utah State University, Logan, 1971.
Technical Committee, "Water Resources Planning, So-cial Goals, and Indicators: Methodological Develop-ment and Empirical Test," Publ. PRWG-131-1, WaterRes. Lab., Utah State Univ., Logan, 1974.
U.S. Fish and Wildlife Service. "Draft Report on Preda-tor Damage Management in the West," Washington,D.C., May 5, 1978.
Willig, Robert D., "Consumer Surplus Without Apol-ogy," The American Economic Review, 66(1976):587-597.
44
July 1979