economic and environmental determinants of urban...
TRANSCRIPT
ECONOMIC AND ENVIRONMENTAL DETERMINANTS OF URBAN MORTALITY
Timothy D. Hogan and Lee R. McPheters, Arizona State University
The urban environment has become the domin- ant setting for contemporary life in the United States, with more than 73 percent of the popula- tion residing within metropolitan areas. The
benefits of urbanization include numerous econo- mies of scale in production and consumption. However, the process of urbanization has entailed mounting negative side effects or externalities, including crime, congestion, and environmental deterioration. In addition, urban mortality rates exceed those of non -metropolitan areas (7).
This paper examines factors associated with the level of urban morality in the United States. We seek evidence on the existence of a systematic relationship between urban mortality and a vari- ety of socio- economic, environmental and health care characteristics of the urban setting. In particular, several alternative measures of the supply of health care services and of environ- mental quality have been included as variables in our analysis. This has been done so that we can explicitly investigate the relative effects of differences in the provision of health services and of variations in pollution levels upon urban mortality levels, since these factors are two potentially important determinants that can be affected by social policy. The U. S. society currently allocates huge sums of money to health care expenditures, and there is growing pressure for the establishment of an even more expensive national health insurance system. At the same
time, we have in recent years seen a social and governmental response, involving both increased expenditures and regulation, to the growing awareness of the adverse effects of pollution and other environmental contaminants. Many argue that, in an affluent society such as the United States, other factors such as personal habits, diet, pollution, etc., have more impacts on health than the availability of more and better medical services (6,9). We hope to gain some in- sight into this controversy within the context of the urban environment with this empirical analy- sis.
II. Review of Previous Studies
Although the determinants of urban mortality are undoubtedly complex, initial studies attempt- ed to link variation in mortality with differ- ences in a single or small number of suspected influencing variables. For example, in one of the earliest reported studies, Altenderfer (1)
examined the relation between per capita income and mortality in 1940 for 92 cities with popula- tion greater than 100,000 persons. Altenderfer concluded that overall mortality and the death rate for ten broad diagnosis groups were inverse- ly related to income (1, p. 1688).
In a later study, Patno (14) related mortal- ity to "economic level," using 1940 and 1950 cen- sus tract data for the white population of Pitts- burgh, Pennsylvania. The measures employed as
701
indicators of economic level were median value of owner occupied housing and median monthly rental, and median family income. Based upon this evi-
dence, Patno determined "In general, the highest
mortality occurred among persons within the areas designated as being of low economic level, and the most favorable experience was found among the residents of the areas of higher economic status" (14, pp. 845 -846).
The particular problem of racial differences in infant mortality in urban areas was examined by Jiobu (11) who found post -natal infant mortality related to socio- economic measures. He suggested that ghettoization may affect infant mortality due to influences of factors such as overcrowding and quality of medical care.
In a more qualitative investigation consider- ing a wider range of influences of mortality, Biraben linked urban mortality to certain aspects of urban living such as increased personal con- tacts, traffic, pollution, and the general pace of city life (4) .
A major collection of studies on the econo- mics of health and medical care was published by the National Bureau of Economic Research in 1972 (8). One of these essays (2) attempts to test the impact of medical care variables on health, as measured by white mortality rates. While this study analyzed state, rather than urban data, the
authors, Auster, Leveson, and Sarachek, took a more sophisticated approach than previous studies by including a number of socio- economic and en- vironmental variables to control for differences among geographic areas. They discovered the in- fluence of medical care on mortality to be small,
while the association between mortality and edu- cation was strong and negative. Surprisingly, an income measure was found to be positively related to mortality in this study, contrary to much of the previous evidence.
Another study included in that collection, which is perhaps the most comprehensive investiga- tion of the determinants of urban mortality to date, is that of Silver (15) who examined both Standard Metropolitan Statistical Area and state data to explain spatial variation in black and white mortality rates. Silver applied regression analysis to some forty explanatory variables. Again, Silver found the relation between education and mortality to be negative and usually signifi- cant. The excess of black over white mortality was attributed to differences in income and edu- cational levels for the two groups. Generally, Silver found a negative relation between income and mortality, with education excluded from the model. One exception was the case of white male mortality, using state data. Re- estimating the
white male mortality equations with income broken into labor and non -labor components, the sign of non -labor income was strongly negative, while labor income was not usually significant. This
suggested to Silver that "pure" increases in in- come may have a positive effect on health, but incomes earned by more strenuous or dangerous work may be unfavorable to health.
While the more recent attempts to estimate the relative contributions of various determin- ants of urban mortality have included larger numbers of variables than earlier approaches, the increased number of variables has introduced the possibility of multi -collinearity and thus mis- interpretation of the empirical results. Below, we follow an approach which allows for consideration of a large number of variables, but minimizes the problems associated with multi - collinearity.
III. Design of the Study
Our fundamental hypothesis is that variation in urban mortality is dependent upon a complex milieu of determinants, including economic vari- ables, environmental variables, population char- acteristics, and various measures of health care availability and utilization. We test this hy-
pothesis in a least squares regression analysis, using data for the 64 largest SMSA's within the continental U. S. for 1970.1 Since the inclusion of all the potential determinant variables in one regression equation would prove unwieldy and sta- tistically suspect, we reduce the information contained in the original large data matrix through extraction of its principal components.
Briefly, principal component analysis takes observations on a large number of correlated variables and finds a smaller set of orthogonal or uncorrelated variables which capture as much of the variability of the original data set as possible (5, pp. 53 -65). The resulting compon- ents may be used to construct index variables which can be employed as independent variables in ordinary least squares regression analysis.
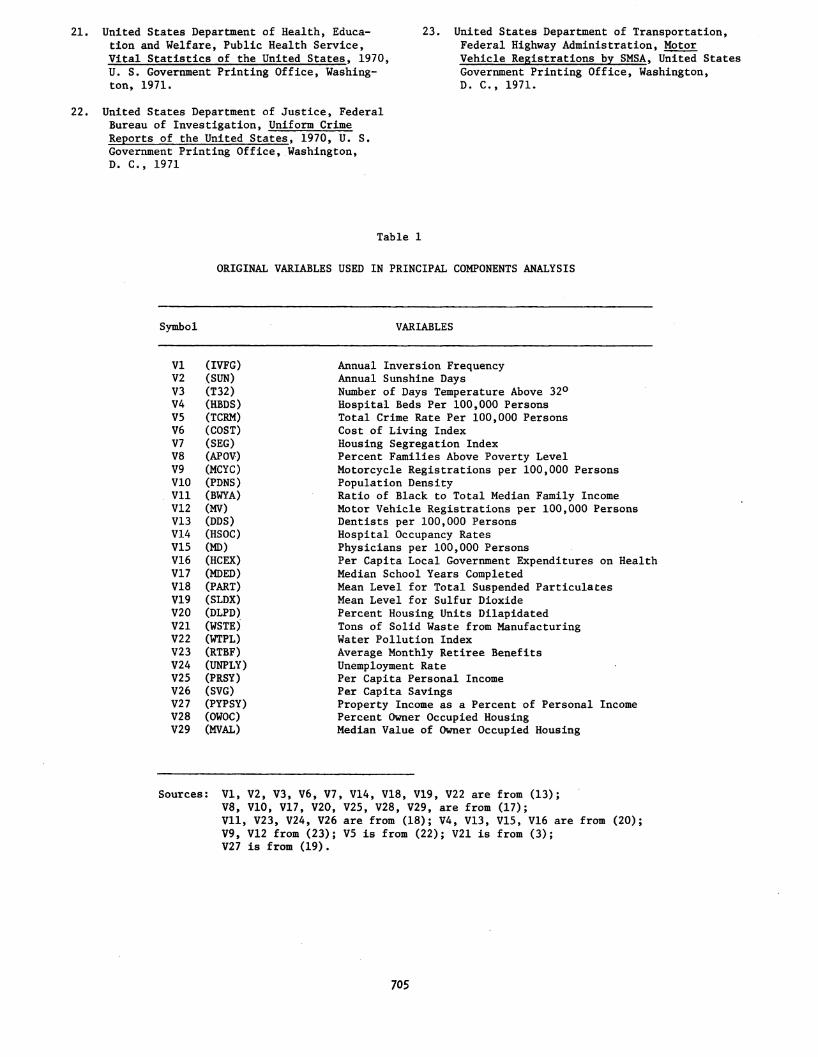
The original data used in our analysis are shown in Table 1. Included are measures of econ- omic variables, population characteristics, en- vironmental measures, and medical care variables. Many of these variables have appeared independent- ly as explanatory variables in previous analyses
of mortality.
Extracting components until the resulting Eigen- values fell to 1.0, we derived nine ortho- gonal components or factors which accounted for over 75 percent of the variance in the original data matrix. To facilitate interpretation of each of the derived factors, we performed varimax rotation, which preserves orthogonality while simplifying the columns of the factor matrix.2 The loadings shown in Table 2 measure the correla- tion between the original variables and each of the respective components after varimax rotation.
The first factor extracted in principal com- ponent analysis is usually a general factor ex- pressing a summary of the linear relationships present in the data. After rotation, the first factor (F1) seemed to measure the general char- acter of urban areas especially with respect to
702
motor vehicle dominance. This factor is positive- ly associated with motor vehicle registrations, days of sunshine, per capita income and education, and negatively related to hospital occupancy rates and pollution variables. We found SMSA's with high scores on this factor are likely to be newer "sun belt" cities.
The second factor (F2) tends to be most high- ly associated with variables measuring economic level, including percent of the population above the poverty level and retirement benefits. The third factor (F3) reflects influence of suburban - ization on the middle class; it is negatively re- lated to population density and housing dilapida- tion, but positively related to education and proportion of housing owner occupied.
Factor four (F4) is most strongly associated with property or non -labor income, while factor five (F5) is linked to measures of health care services, including doctors and dentists per 100,000 persons and per capita health care expend- itures by local governments. Factor six (F6) is
associated with air quality and water pollution variables, while factor seven (F7) is interpreted as a medical facilities factor, loading highly on hospital beds per 100,000 persons. Factor eight (F8) seems closely associated with both savings and black white income differentials, and factor nine (F9) loads most highly on unemployment.
These factors were used as weights in con- structing indices corresponding to each component. Each of the 64 SMSA's thus received a weighted value or "score" for each component. The SMSA's with the highest and lowest index values for each factor are shown in Table 3.
The constructed indices were utilized as orthogonal independent variables in an ordinary least squares regression equation of the form
= a + b1F1 + b2F2 + b3F3 + b4F4 + b5F5 + b6F6 +
b7F7 + b8F8 + b9F9 + u
where Mi is the age- adjusted mortality rate for the ith population category a is an intercept term and u is the stochastic error term.
The mortality variables used in the study are age- adjusted mortality rates for whites (MW) and
blacks (MB) for 1970 expressed in index form.
Data for construction of the mortality variables were obtained from (17) and (21). The computation procedures followed those set out in (16, p. 242).
The mortality index measures the ratio of SMSA mortality to expected deaths based upon national age- specific mortality rates.
IV. Empirical Results
Regression analysis yielded the following re- gression results for white and black mortality (t- values are in parentheses, with those signifi- cant at the 5% level marked with an asterisk): (1) MW = 100.1 - 1.99 Fl* + .746 F2 - 3.09 F3*
(2.90) (1.08) ( -4.49)
- 1.71 F4* .448 F5 + 1.46 F6* + 1.85 F7* -
(-2.489) (-.652) (2.13) (2.69)
1.69 F8* - .086 F9 R2 .501
(-2.47) (-.126)
(2) MB = 106.4 - 2.68 F1 - 6.45 F2* - 3.03 F3 - (-.911) (-2.19) (-1.03)
891 F4 - 5.55 F5* + 1.21 F6 + 3.24 F7 + (-.303) (-1.89) (.410) (1.10)
6.03 F8* - 2.96 F9 R2.= .239
(2.05) (-1.02)
Since the indices are based on standardized variables, the importance of each factor to the equation can be measured by the size of the re- gression coefficient. For white mortality, the most important factor is F3, the measure of sub - urbanization, which includes low population den- sity, high median education, and high proportion of owner occupied housing. The negative sign on this factor suggests that the process of suburban- ization has a definite favorable impact upon mor- tality.
These results are consistent with a number of previous studies which found an inverse rela- tionship between education and health and mortal- ity. For example, Kitagawa and Hauser found a "consistent decline in mortality as years of schooling increased" (12, p. 38). They inter- preted the education variable as a proxy for all the various socioeconomic variables which may be linked to education, including income, level of occupation, style of life, diet, quality of hous- ing, and others. Grossman also found a similar relationship, within the framework of a more so- phisticated human- capital model (10).
Our approach suggests that higher levels of education in urban areas are closely tied to other important socioeconomic variables, especial- ly those associated with suburbanization. Pre- vious studies utilizing single variables in re- gression equations may have failed to capture the composite nature of the relationship involved.
The second most important determinant of white mortality in this equation is F1, the mea- sure of general urban character. This index en-
ters with a negative sign, which suggests newer, rapidly growing SMSA's may have a more favorable mortality experience, in spite of high motor vehicle density.
Also important is F7, the medical facility factor. The sign is positive, which may be an indication of simultaneity in the underlying structure of the relationships of the equation. That is, areas with higher mortality rates may require a large stock of medical facilities.
Factor F4, non -labor or property income, is significant and negative in sign. This confirms earlier findings of Silver (15). That is, in- creases in income may be beneficial to health and longevity if they are not directly associated with additional emotional or physical stress. Similarly, factor F8, a factor which was highly associated with savings, has a negative effect on mortality.
703
The final significant determinant of white
mortality is the pollution index (F6). The pos-
itive sign here supports the view that higher
pollution levels are detrimental to health.
Three of the factors were not significant at
the 5% level. These were the economic level in-
dex (F2), the health services index (F5) and the
unemployment measure (F9). The insignificance
of the health services factor supports a growing
body of literature which suggests that in ad-
vanced societies there may not be a strong link
between supply of health services and health
status (6, 9).
The results for black mortality are substan- tially weaker than for white mortality, with less than 25 percent of the variation explained by three significant indices. The most important of the significant variables is factor two which is highly correlated with the proportion of the pop- ulation above the poverty level. This variable was insignificant for whites, suggesting mortal-
ity gains to whites from increasing affluence have possibly been exhausted, but such benefits to blacks are still forthcoming.
This interpretation is given weight by the
results for factor eight, which is highly asso- ciated with savings and the black -white income differential. While this factor had a negative influence on white mortality, the sign for black mortality is positive.
The third variable of interest is the health care services index (F5). As with the poverty variable, health care services was not signifi-
cant for white mortality, but is significant and of negative sign for black mortality. While in-
cremental physicians or public expenditures on medical services have no apparent significant in-
fluence on white mortality, black mortality seems
to be influenced in a beneficial way by the avail-
ability of such services.
IV. Conclusions
While there is substantial variation in mor- tality rates among urban areas, there appear to
be certain urban characteristics which are sys-
tematically related to mortality levels. These
characteristics have a differential impact on
white and black mortality rates.
The empirical results of our study demon-
strate the mortality experience of whites in
newer, automobile oriented, suburbanized areas is
more favorable than that found in older, higher density metropolitan areas. While early studies
.found a persistent negative relationship between economic level and urban mortality, studies based
on more recent data have found a positive rela- tionship between economic factors and mortality. Our results confirm the explanation offered by
Silver for this anomaly. The negative relation-
ship between our property income factor and white mortality and the insignificance of our index of economic level (F2) replicate Silver's findings for non -labor income and aggregate income mea- sures.
The results for mortality experience of ur- ban blacks seem the virtual inverse of that for whites. Factors related to suburbanization and character of the SMSA are found to be insignifi- cant determinants of black mortality. On the other hand, two factors found to be insignificant for whites (economic level and medical services) were significant and of the theoretically expect- ed sign for blacks. This evidence is consistent with the hypothesis that improvements in economic level and medical services continue to offer po- tential mortality gains to blacks, which may be no longer true for whites.
The empirical results also provide some in- teresting evidence for the controversy dealing with the proper mix of public policies to improve the health of the U. S. population. The findings relating to white mortality tend to support the contention that efforts should be concentrated away from the traditional medical approach toward a broader approach of lifestyle modification. At the same time, however, results from the analysis of black mortality imply that continued emphasis on improved medical care and increased availabil- ity of such services to the black and minority populations would have significant impact upon the health status of these disadvantaged popula- tions.
FOOTNOTES
1Honolulu was excluded due to its unusual socio- economic and demographic characteristics.
2Such a simplification is equivalent to max- imizing the variance of the squared loadings of each column. Hence, the name "varimax."
REFERENCES
1. Altenderfer, M. E. "Relationship Between Per Capita Income and Mortality," Public Health Reports, Vol. 62, pp. 1681 -1691, Nov. 1947.
2. Auster, Richard, Irving Leveson, and Deborah Saracheck, "The Production of Health, An Exploratory Study," in Victor R. Fuchs,
(ed.), Essays in the Economics of Health and Medical Care, National Bureau of Econo- mic Research, Columbia University Press,
New York, 1972.
3. Berry, Brian, Land Use, Urban Form and Envir- onmental Quality, University of Chicago, De- partment of Geography Research Paper No. 155, 1974.
4. Biraben, Jean -Noel, "Quelques Aspects de la Mortalite en Milleu Urbain," Population,
Vol. 3, pp, 509 -520, 1975.
5. Dhrymes, P. J., Econometrics: Statistical Foundations and Applications, Harper and Row, New York, 1970.
6. Dubos, Rene, The Mirage of Health, Harper, New York, 1959.
704
7. Erhard, Carl L. and Joyce E. Berlin (eds.), Mortality and Morbidity in the United States, Harvard University Press, Cambridge, 1974.
8. Fuchs, Victor, Essays in the Economics of Health and Medical Care, National Bureau of Economic Research, Columbia University Press, New York, 1972.
9. Fuchs, Victor, Who Shall Live, Basic Books, New York, 1974.
10. Grossman, Michael, "The Correlation Between "Health and Schooling," in Household Produc- tion and Consumption, National Bureau of Economic Research, 1976.
11. Jiobu, Robert M. "Urban Determinants of Racial Differentiation in Infant Mortality," Demography, Vol. 9, pp. 603 -615, November, 1972.
12. Kitagawa, E. M. and P. M. Hauser, "Education Differentials in Mortality by Cause of Death: The United States, 1960," Demo- graphy, Vol. 5, pp. 318 -353, 1968.
13. Liu, Ben -Chieh, Quality of Life Indicators in United States Metropolitan Areas, 1970, U. S. Environmental Protection Agency, Washington, D. C. 1975.
14. Patno, M. E., "Mortality and Economic Level in an Urban Area," Public Health Reports, Vol. 75, pp. 841 -851, September, 1960.
15. Silver, Morris, "An Econometric Analysis of Spatial Variations in Mortality Rates by Age and Sex," in Victor Fuchs, ed., Essays in the Economics of Health and Medical Care, National Bureau of Economic Research, Colum- bia University Press, New York, 1972.
16. Stockwell, Edward G. (ed.), The Methods and Materials of Demography, San Francisco, Academic Press, 1976 (condensed edition).
17. United States Department of Commerce, Bureau of the Census, 1970 Census of Population and Housing", United States Government Print-
ing Office, Washington, D. C., 1972.
18. United States Department of Commerce, City and County Data Book, United States Govern- ment Printing Office, Washington, D. C.,
1972.
19. United States Department of Commerce, Survey of Current Business, United States Govern- ment Printing Office, Washington, D. C.,
May, 1974.
20. United States Department of Commerce, Statis- tical Abstract of the United States, United States Government Printing Office, Washing- ton, D. C. Various Issues.
21. United States Department of Health, Educa-
tion and Welfare, Public Health Service, Vital Statistics of the United States, 1970,
U. S. Government Printing Office, Washing- ton, 1971.
22. United States Department of Justice, Federal
Bureau of Investigation, Uniform Crime
Reports of the United States, 1970, U. S.
Government Printing Office, Washington, D. C., 1971
Table 1
23. United States Department of Transportation, Federal Highway Administration, Motor Vehicle Registrations by SMSA, United States Government Printing Office, Washington, D. C., 1971.
ORIGINAL VARIABLES USED IN PRINCIPAL COMPONENTS ANALYSIS
Symbol VARIABLES
V1 (IVFG)
V2 (SUN)
V3 (T32)
V4 (HBDS)
V5 (TCRM)
V6 (COST)
V7 (SEG)
V8 (APOV)
V9 (MCYC)
V10 (PDNS)
V11 (BWYA) V12 (MV)
V13 (DDS)
V14 (HSOC)
V15 (MD)
V16 (HCEX)
V17 (MDED)
V18 (PART)
V19 (SLDX)
V20 (DLPD)
V21 (WSTE)
V22 (WTPL)
V23 (RTBF)
V24 (UNPLY)
V25 (PRSY)
V26 (SVG)
V27 (PYPSY) V28 (OWOC)
V29 (MVAL)
Annual Inversion Frequency Annual Sunshine Days Number of Days Temperature Above 32° Hospital Beds Per 100,000 Persons Total Crime Rate Per 100,000 Persons Cost of Living Index Housing Segregation Index Percent Families Above Poverty Level Motorcycle Registrations per 100,000 Persons Population Density Ratio of Black to Total Median Family Income Motor Vehicle Registrations per 100,000 Persons Dentists per 100,000 Persons Hospital Occupancy Rates Physicians per 100,000 Persons Per Capita Local Government Expenditures on Health Median School Years Completed Mean Level for Total Suspended Particulates Mean Level for Sulfur Dioxide Percent Housing Units Dilapidated Tons of Solid Waste from Manufacturing Water Pollution Index Average Monthly Retiree Benefits Unemployment Rate Per Capita Personal Income Per Capita Savings Property Income as a Percent of Personal Income Percent Owner Occupied Housing Median Value of Owner Occupied Housing
Sources: V1, V2, V3, V6, V7, V14, V18, V19, V22 are from (13);
V8, V10, V17, V20, V25, V28, V29, are from (17);
Vil, V23, V24, V26 are from (18); V4, V13, V15, V16 are from (20); V9, V12 from (23); V5 is from (22); V21 is from (3); V27 is from (19).
705
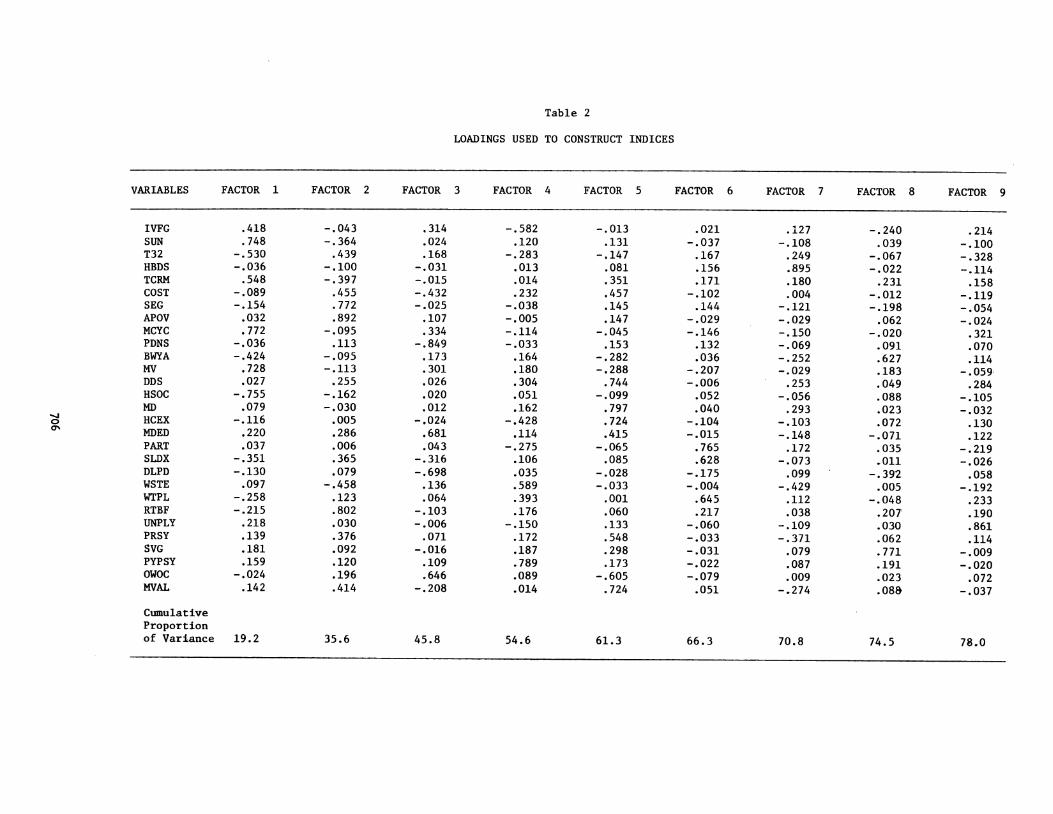
Table 2
LOADINGS USED TO CONSTRUCT INDICES
VARIABLES FACTOR 1 FACTOR 2 FACTOR 3 FACTOR 4 FACTOR 5 FACTOR 6 FACTOR 7 FACTOR 8 FACTOR
IVFG .418 -.043 .314 -.582 -.013 .021 .127 -.240 .214 SUN .748 -.364 .024 .120 .131 -.037 -.108 .039 -.100 T32 -.530 .439 .168 -.283 -.147 .167 .249 -.067 -.328 HBDS -.036 -.100 -.031 .013 .081 .156 .895 -.022 -.114 TCRM .548 -.397 -.015 .014 .351 .171 .180 .231 .158 COST -.089 .455 -.432 .232 .457 -.102 .004 -.012 -.119 SEG -.154 .772 -.025 -.038 .145 .144 -.121 -.198 -.054 APOV .032 .892 .107 -.005 .147 -.029 -.029 .062 -.024 MCYC .772 -.095 .334 -.114 -.045 -.146 -.150 -.020 .321 PDNS -.036 .113 -.849 -.033 .153 .132 -.069 .091 .070 BWYA -.424 -.095 .173 .164 -.282 .036 -.252 .627 .114 MV .728 -.113 .301 .180 -.288 -.207 -.029 .183 -.059 DDS .027 .255 .026 .304 .744 -.006 .253 .049 .284 HSOC -.755 -.162 .020 .051 -.099 .052 -.056 .088 -.105 MD .079 -.030 .012 .162 .797 .040 .293 .023 -.032 HCEX -.116 .005 -.024 -.428 .724 -.104 -.103 .072 .130 MDED .220 .286 .681 .114 .415 -.015 -.148 -.071 .122 PART .037 .006 .043 -.275 -.065 .765 .172 .035 -.219 SLDX -.351 .365 -.316 .106 .085 .628 -.073 .011 -.026 DLPD -.130 .079 -.698 .035 -.028 -.175 .099 -.392 .058 WSTE .097 -.458 .136 .589 -.033 -.004 -.429 .005 -.192 WTPL -.258 .123 .064 .393 .001 .645 .112 -.048 .233 RTBF -.215 .802 -.103 .176 .060 .217 .038 .207 .190 UNPLY .218 .030 -.006 -.150 .133 -.060 -.109 .030 .861 PRSY .139 .376 .071 .172 .548 -.033 -.371 .062 .114 SVG .181 .092 -.016 .187 .298 -.031 .079 .771 -.009 PYPSY .159 .120 .109 .789 .173 -.022 .087 .191 -.020 OWOC -.024 .196 .646 .089 -.605 -.079 .009 .023 .072 MVAL. .142 .414 -.208 .014 .724 .051 -.274 .088 -.037
Cumulative Proportion of Variance 19.2 35.6 45.8 54.6 61.3 66.3 70.8 74.5 78.0
9
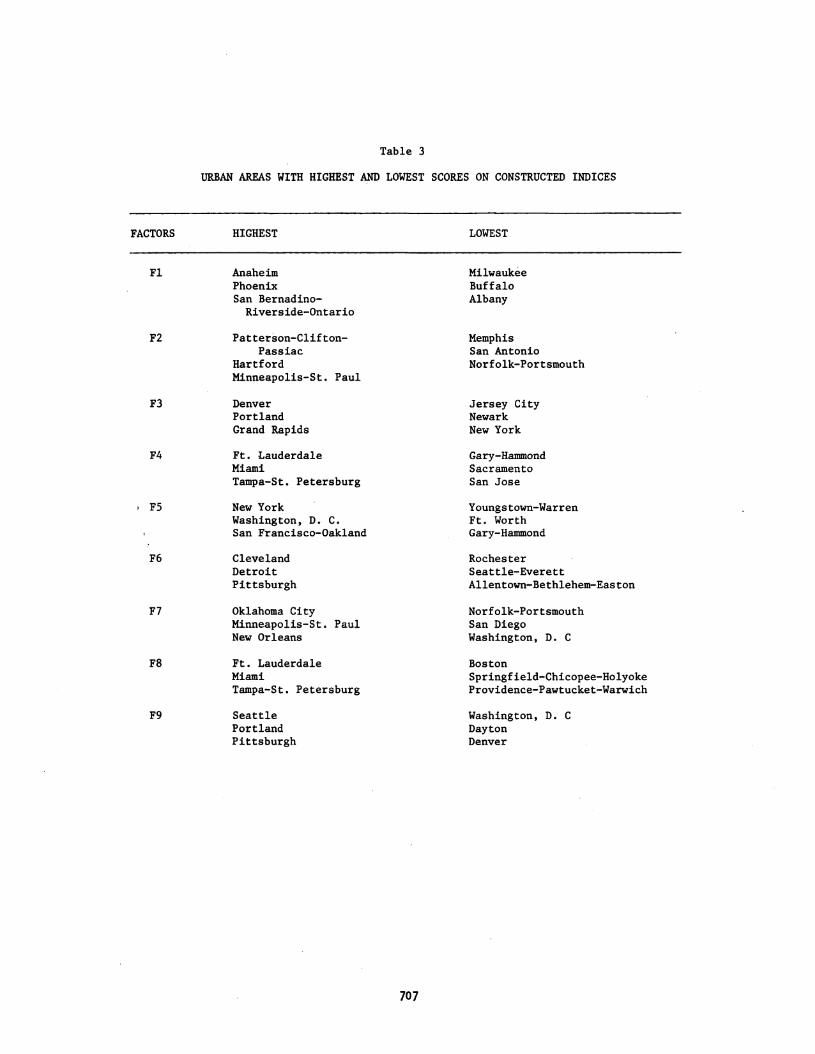
Table 3
URBAN AREAS WITH HIGHEST AND LOWEST SCORES ON CONSTRUCTED INDICES
FACTORS
F2
F3
F4
F5
F6
F7
F8
F9
HIGHEST LOWEST
Anaheim Phoenix San Bernadino-
Riverside- Ontario
Patterson-Clifton - Passiac
Hartford Minneapolis -St. Paul
Denver Portland Grand Rapids
Ft. Lauderdale Miami Tampa -St. Petersburg
New York Washington, D. C.
San Francisco -Oakland
Cleveland Detroit Pittsburgh
Oklahoma City Minneapolis -St. Paul New Orleans
Ft. Lauderdale Miami Tampa -St. Petersburg
Seattle Portland Pittsburgh
707
Milwaukee Buffalo Albany
Memphis San Antonio Norfolk- Portsmouth
Jersey City Newark New York
Gary -Hammond Sacramento San Jose
Youngstown- Warren Ft. Worth Gary -Hammond
Rochester Seattle- Everett Allentown -Bethlehem- Easton
Norfolk- Portsmouth San Diego Washington, D. C
Boston Springfield- Chicopee -Holyoke Providence -Pawtucket -Warwich
Washington, D. C
Dayton Denver