econometric modelling for the asia-pacific region · asia-pacific itupublications the economic...
TRANSCRIPT
Regional initiativesAsia-Pacific
ITUPublications
The economic contribution of broadband digitization and ICT regulationEconometric modelling for the Asia-Pacific region
Published in SwitzerlandGeneva 2019
Photo credits Shutterstock
International Telecommunication UnionTelecommunication Development Bureau
Place des NationsCH-1211 Geneva 20
Switzerland
ASIA -PACIFIC
The
eco
nom
ic c
ont
rib
utio
n o
f b
road
ban
d d
igit
izat
ion
and
ICT
reg
ulat
ion
Eco
nom
etri
c m
od
ellin
g fo
r th
e A
sia-
Paci
fic r
egio
n
ISBN 978-92-61-29371-0
9 7 8 9 2 6 1 2 9 3 7 1 0
The economic contribution of broadband digitization
and ICT regulationEconometric modelling for
the Asia-Pacific region
copy ITU 2019
All rights reserved No part of this publication may be reproduced by any means whatsoever without the prior written permission of ITU
Please consider the environment before printing this report
Acknowledgements
This study has been prepared by the International Telecommunication Union (ITU) with the collaboration of the ITU Telecommunication Development Bureau (BDT) Regulatory and Market Environment Division (RME)
This study is based on desk research and on data from the ITU ICT Regulatory Tracker and the Digital Ecosystem Development Index developed with funding from the CAF (Corporacioacuten Andina de Fomento) Development Bank for Latin America and the ITU 2018 report on the economic contribution of broadband digitization and ICT regulation
ISBN
978-92-61-29361-1 (paper version)
978-92-61-29371-0 (electronic version)
978-92-61-29381-9 (EPUB version)
978-92-61-29391-8 (Mobi version)
iii
Authors
Raul Katz (PhD Management Science and Political Science Massachusetts Institute of Technology) is currently Director of Business Strategy Research at the Columbia Institute for Tele-Information and President of Telecom Advisory Services LLC (www teleadvs com) Before founding Telecom Advisory Services he worked for twenty years at Booz Allen Hamilton where he was the Head of the Telecommunications Practice in North and Latin America and member of its Leadership Team
Fernando Callorda (BA MA Economics Universidad de San Andres-Argentina) is a project manager with Telecom Advisory Services LLC an Assistant Professor and Researcher at ESEADE and UNLAM (Argentina) Before joining Telecom Advisory Services he was a staff analyst in the Argentina Congress
v
Foreword
The transformative power of digital technologies and connectivity is empowering people creating an environment that nurtures innovation and is triggering positive change in business processes and in the global economy
The ITU study on the economic contribution of broadband digitization and ICT regulation provided a global econometric analysis of robust and reliable data resources to measure the impact of fixed and mobile broadband and digital transformation on the economy as a whole It also analysed the impact of institutional and regulatory variables to the development of the digital ecosystem
Based on the data and analysis to measure the impact of digitization as a whole a further need was identified to conduct studies that delved deeper into these effects focusing on specific regions of the world By applying the same methodologies and econometric models used for assessing global effects this study focuses on the impact of broadband digital transformation and policy and regulatory frameworks on the growth of markets for digital services in the Asia-Pacific region It also provides evidence of the importance of regulatory and institutional variables in driving digital growth illustrating that broadband technologies and effective ICT regulation can have positive impacts on the development of national economies and prosperity
This ITU report suggests that an increase of 10 per cent in mobile broadband penetration would yield a growth of 051 per cent in GDP per capita The impact of policy and regulatory frameworks on the development of digitization was also tested Importantly in the case of the Asia-Pacific region the results also validated the positive impact of the policy and regulatory component in the countries in the region It was noted that an increase of 10 per cent in the ITU ICT Regulatory Tracker yields a positive increase in the CAF Digital Ecosystem Development Index of 1875 per cent in the Asia-Pacific countries
I am delighted that this ever-growing body of research will guide and assist membership in the Asia-Pacific region to design sustainable policies and strategies and to benefit from the dynamic and exciting broadband ecosystem
Doreen Bogdan-Martin Director ITU Telecommunication Development Bureau
vii
Authors iii
Foreword v
1 Introduction 1
2 The effects identified on a global scale 121 Economic impact of fixed broadband 222 Economic impact of mobile broadband 223 Economic impact of digitization 324 Impact of policy and regulatory framework on digitization development 3
3 The economic contribution of broadband and digitization and the impact of policy on digi-tization in the Asia-Pacific region 331 Review of the research literature 432 Hypotheses 533 Economic impact of fixed broadband in the Asia-Pacific region 634 Economic impact of mobile broadband in the Asia-Pacific region 835 Economic impact of digitization in the Asia-Pacific region 1236 Impact of policy and regulatory framework on digitization in the Asia-Pacific region 13
4 Conclusion 17
Annex A List of data sources for models testing the economic impact of fixed and mobile broad-band 20
Annex B Indicators in the Digital Ecosystem Development Index and data sources 21
Bibliography 25
Table of Contents
viii
List of Tables and Figures
Tables
Table 1 Economic impact of fixed broadband (Asia-Pacific region) 6Table 2 Economic impact of fixed broadband for high-income countries (Global model compared to the Asia-Pacific region) 7Table 3 Economic impact of mobile broadband (Asia-Pacific region) 8Table 4 Economic impact of mobile broadband (Global sample compared to the Asia-Pacific region) 9Table 5 Economic impact of mobile broadband (Asia-Pacific region mid- and low-income countries) 10Table 6 Economic impact of digitization (Asia-Pacific region) 12Table 7 Economic impact of digitization 2017 (Asia-Pacific region compared to OECD) 13Table 8 Correlation between the ICT Regulatory Tracker and the CAF Digital Ecosystem Development Index (Asia-Pacific region) 14Table 9 Impact of lagged ICT Regulatory Tracker on the CAF Digital Ecosystem Development Index (Asia-Pacific region) 14Table 10 Impact of lagged ICT Regulatory Tracker on the CAF Digital Ecosystem Development Index (Asia-Pacific region) 15Table 11 Correlations between ICT Regulatory Tracker and CAF Digital Ecosystem Development Index pillars (Asia-Pacific region) 16Table 12 Impact of the ICT Regulatory Tracker components on the CAF Digital Ecosystem Development Index pillars (Asia-Pacific region) 17Table 13 Summary of results of econometric models (Asia-Pacific) 18
Figures
Figure 1 Economic impact of mobile broadband (Global sample vs Asia-Pacific region 2017) 11Figure 2 Main findings for the Asia-Pacific region 19
The economic contribution of broadband digitization and ICT regulationThe economic contribution of broadband digitization and ICT regulation
1
1 IntroductionThe Economic contribution of broadband digitization and ICT regulation Econometric modelling for the Asia-Pacific region presents a set of econometric analyses that estimate the economic contribution of broadband and digitization as well as the impact of ICT policy on the development of the digital economy in the Asia and Pacific region It provides substantial evidence regarding the impact of broadband and digital transformation on the economy and the impact of institutional and regulatory variables on the growth of the digital ecosystem
This report follows the findings of the ITU global study published in 2018 on the economic contribution of broadband digitization and ICT regulation1 which was based on a large sample of economies and demonstrated the following impacts and effects
bull Fixed broadband economic impact is guided by a returns to scale effect2 according to which the economic impact of fixed broadband is greater in high-income country economies than in low-income country economies
bull The economic impact of mobile broadband reflects a saturation effect according to which the mobile broadband contribution is higher in low-income country economies than in mid- and high-income country economies
bull The impact of the digital ecosystem on countries with developed country economies is higher than in developing country economies
bull The regulatory and policy framework has a consistent impact on the development of the digital ecosystem regardless of the level of development or income
This evidence was considered significant for policy makers and regulators in particular with regards to two key issues
bull Which technologies should become a policy priority in terms of adoption
bull How to ensure that beyond broadband adoption policies are deployed to stimulate the development of the digital ecosystem
The conclusions generated by this research has prompted calls to conduct studies that delve deeper into these effects focusing on specific regions of the world By applying the same methodologies and models used for assessing global effects this report focuses on the Asia-Pacific region summarizes the results of the ITU 2018 global study and presents the results of the analyses for the region
2 The effects identified on a global scaleThis section presents the types of analyses methodologies and results relied upon for the ITU 2018 global study Section 3 focuses on countries in the Asia-Pacific region
The global ITU study cited above focused on testing three effects
bull the economic contribution of fixed and mobile broadband
1 Katz R and Callorda F (2018) The economic contribution of broadband digitization and ICT regulation Geneva International Telecommunication Union (https www itu int en ITU -D Regulatory -Market Documents FINAL _1d _18 -00513 _Broadband -and -Digital -Transformation -E pdf)
2 Generally the returns to scale effect refers to a reduction in unit cost as the scale of production increases over time when inputs such as physical capital usage are variable The ITU report on the impact of broadband on the economy 2012 (https www itu int ITU -D treg broadband ITU -BB -Reports _Impact -of -Broadband -on -the -Economy pdf) states that according to the returns to scale theory the economic impact of broadband increases exponentially with the penetration of the technology
2
The economic contribution of broadband digitization and ICT regulation
bull the economic contribution of digitization (a variable that subsumes broadband technology within a larger set of digital ecosystem components) and
bull the impact of the policy and regulatory frameworks on the growth of markets for digital services and applications
The analyses and findings for each of the effects provides the context for the regional models
21 Economic impact of fixed broadband
The structural econometric model in the ITU 2018 global study composed of four equations3 generated evidence of the impact of fixed broadband on the economy between 2010 and 2017 The results based on a model run for a 139 country sample (general fixed broadband model) showed that an increase of 10 per cent in fixed broadband penetration yielded an increase in 08 per cent in gross domestic product (GDP) per capita
The sample was split into three sets (high- medium- and low-income countries) to test whether the fixed broadband contribution to GDP increased or decreased depending on the level of economic development
1 countries with GDP per capita higher than USD 22 000 (50 countries)
2 countries with GDP per capita between USD 12 000 and USD 22 000 (26 countries)
3 countries with GDP per capita lower than USD 12 000 (63 countries)
The results supported the hypothesis that the economic contribution of fixed broadband increases with the level of economic development
bull high-income countries a 10 per cent increase in fixed broadband penetration yields 14 per cent increase in GDP growth
bull middle-income countries a 10 per cent increase in fixed broadband penetration yields 05 per cent increase in GDP growth
bull low-income countries while the coefficient of fixed broadband was similar to that of middle-income countries (10 per cent increase in fixed broadband penetration yields 05 per cent increase in GDP growth) the impact was not statistically significant4
22 Economic impact of mobile broadband
The ITU 2018 global study also shows that mobile broadband has a higher impact than fixed broadband on the world economy Relying on a structural model run for a 139 country sample (general mobile broadband model) it was estimated that on average an increase of 10 per cent in mobile broadband penetration yielded an increase of 15 per cent in GDP However using the same three data sets (high- medium- and low-income countries) to test the economic impact of mobile broadband showed that the level of economic contribution of mobile broadband is higher in low-income countries than in high-income countries where it had no impact
bull high-income countries no economic impact was detected
bull middle-income countries an increase of 10 per cent in mobile broadband penetration yields an increase in 18 per cent in GDP
bull low-income countries an increase of 10 per cent in mobile broadband penetration yields an increase in 2 per cent in GDP
3 For descriptions of models and methodologies see the ITU 2018 global study cited in footnote 14 The coefficient is not statistically significant due to the lack of proof of causality in that model
3
The economic contribution of broadband digitization and ICT regulation
This difference reflects the high levels of access to fixed broadband in high-income countries while mobile network access to broadband is the only technology available to the majority of consumers in low-income countries Consequently the mobile broadband contribution to high-income economies is only marginal and the impact of mobile broadband in low-income countries is extremely important
23 Economic impact of digitization
The ITU 2018 global study tested the economic impact of digitization using an endogenous growth model that linked GDP to the fixed stock of capital labour force and the CAF Digital Ecosystem Development Index (see section 35) The approach followed in this case tested the economic contribution for a sample of 73 countries worldwide (the general digitization model) and then split the results into two sets of countries those within the Organization for Economic Co-operation and Development (OECD)5 and non-OECD countries According to the general digitization model an increase of 10 per cent in the CAF Digital Ecosystem Development Index resulted in a 13 per cent growth in GDP per capita When the sample was split between OECD and non-OECD countries economic impact increased in the OECD countries relative to non-OEECD nations
bull OECD countries An increase of 10 per cent in the CAF Digital Ecosystem Development Index resulted in a 14 per cent growth in GDP per capita
bull Non-OECD countries An increase of 10 per cent in the CAF Digital Ecosystem Development Index yielded a 10 per cent growth in GDP per capita
Furthermore a single variable model with country and period fixed effects indicated that digitization also has an impact on labour and total factor productivity An increase in the digitization index of 10 per cent yielded an increase in labour productivity of 26 per cent and in total factor productivity of 23 per cent
24 Impact of policy and regulatory framework on digitization development
In the ITU 2018 global study the contribution to digitization development was tested through a multivariate regression model with fixed effects based on two independent variables the ITU ICT Regulatory Tracker6 and a year lag of the same variable for control purposes The model provided further evidence of the importance of the regulatory and institutional variable in driving digital ecosystem growth An increase of 10 per cent in the ITU ICT Regulatory Tracker yielded a positive increase in the CAF Ecosystem Development Index of 0348 per cent in the subsequent time period
Having presented the types of analyses methodologies and results relied upon for the ITU 2018 global study section 3 below focuses on validating the results for the Asia-Pacific region starting with a brief review of the research literature on economic contribution of broadband in the region
3 The economic contribution of broadband and digitization and the impact of policy on digitization in the Asia-Pacific region
This section analyses the economic contribution of broadband and digitization for the majority of countries (30) in the Asia-Pacific region including Afghanistan Australia Bangladesh Bhutan Brunei Darussalam Cambodia China Fiji India Indonesia Islamic Republic of Iran Japan Lao PDR
5 Australia Austria Belgium Canada Chile Czech Republic Denmark Estonia Finland France Germany Greece Hungary Iceland Ireland Israel Italy Japan Latvia Lithuania Luxembourg Mexico Netherlands New Zealand Norway Poland Portugal Republic of Korea Slovak Republic Slovenia Spain Sweden Switzerland Turkey United Kingdom United States of America
6 https www itu int net4 itu -d irt tracker -by -country regulatory -tracker 2017
4
The economic contribution of broadband digitization and ICT regulation
Malaysia Mongolia Myanmar Nepal New Zealand Pakistan Papua New Guinea Philippines Republic of Korea Singapore Solomon Islands Sri Lanka Thailand Timor-Leste Tonga Vanuatu and Viet Nam7 Countries included in each analysis are indicated at the beginning of each section
31 Review of the research literature
Research on the economic impact of broadband in the Asia-Pacific region often relies on econometric analysis either cross-sectional or country specific Within the cross-sectional group a study by McKinsey amp Co (2009) based on a comparison of broadband policies and penetration across selected countries in the Asia-Pacific region concluded that an increase of 10 per cent in broadband penetration would lead to approximately 06 to 07 per cent increase in GDP growth The study concluded that the collective gross domestic product (GDP) could generate an additional USD 150 billion to USD 180 billion and could generate more than 65 million jobs if the region was on par with the Europe region in broadband penetration
Similarly in a study of the contribution of mobile technology to economic growth in a selection of countries in the Asia-Pacific region8 analysts of Oxford Economics (2016) measured the impact of mobile Internet on labour productivity as well as the increase in the labour participation rate The first relationship was specified through a Dynamic Generalized Method of Moments according to which an additional subscription of mobile broadband per 100 inhabitants is associated with a 003 per cent increase in labour productivity On the other hand a similar increase in one subscription of mobile broadband per 100 population is associated with a 0006 percentage point increase in labour participation rate With these two relationships the study quantified the future impact of mobile Internet technology to GDP growth and job creation
In a similar vein GSMA analysts (2017) studied the impact of the mobile economy in selected countries in the Asia-Pacific region9 by assessing the direct indirect and productivity contribution to the GDP and measuring the generation of direct and indirect employment The direct contribution in 2016 estimated at 16 per cent of GDP was calculated with the value added by infrastructure providers mobile operators device manufacturers distributors and content and applications developers The indirect contribution was estimated at 06 per cent of GDP while the productivity impact reached 3 per cent of output On the other hand direct employment amounted to 64 million jobs while indirect jobs reached 97 million
The growing availability of country data enabled researchers to develop country-specific models to understand the causal links between broadband and development in the region For example a study by Analysys Mason (2015) which focused on the economic impact of fixed and mobile broadband in Thailand relied on a multiplier approach where the factors were developed by examining prior research results The authors stipulated that depending on a countryrsquos ICT maturity a 10 per cent point increase in broadband penetration leads to an increase in GDP of between 026 per cent and 092 per cent In terms of job creation the addition of 1 000 new broadband connections results in the creation of up to 33 new jobs Based on these multipliers an increase in broadband connections from 52 per cent in 2013 to 133 per cent in 2020 for Thailand was estimated to yield a cumulative GDP increase of USD 23 billion
Similarly in a study for the Australian Communications and Media Authority researchers for the Centre for International Economics (2014) estimated the impact of mobile broadband in Australia This study was based on a survey of over 1 000 businesses and concluded that between 2006 and 2013 mobile broadband contributed to 460 per cent of overall productivity growth By relying on
7 These countries (Democratic Peoplersquos Republic of Korea Kiribati Maldives Marshall Islands Micronesia Nauru Samoa Tuvalu) were excluded for lack of data
8 The study focuses on Brunei Darussalam Cambodia Indonesia Lao PDR Malaysia Myanmar Philippines Singapore Thailand and Viet Nam
9 This study focused on China India Indonesia Japan Malaysia Myanmar Philippines and Republic of Korea However the research methodology is not spelled out in the study
5
The economic contribution of broadband digitization and ICT regulation
a general equilibrium model the study concluded that mobile broadband had increased the growth rate of the Australia economy by 028 per cent between 2007 and 2013
A microeconomic study of ICT impact on firm productivity in Japan (Motohashi 2003) based on observations of 9 500 companies and relying on a Cobb Douglas production function concluded that using intra firm broadband networks exhibited 10 per cent higher in Total Factor Productivity growth rate Coincidentally a study by Jitsuzumi (2009) concluded that if the potential of ubiquitous networks is fully utilized the real GDP growth rate will be about 1 to 11 points higher than otherwise
In an econometric analysis of mobile penetration in India Kathuria (2010) stipulated that Indian states with high mobile penetration can be expected to grow faster than those states with lower mobile penetration rates by 12 percentage points a year more on average for every 10 per cent increase in the penetration rate The corresponding correlation between per capita income and other ICT indicators across states were also positive but not as large between fixed and per capita income it is 08 for Internet and per capita income it is 066 while for broadband and per capita income it is 062
Finally according to a four equation model10 (similar to the one implemented in this ITU report) Katz and Koutroumpis (2012) estimated that in the case of the Philippines a 1 per cent increase in mobile broadband connections yielded 0036 per cent of GDP growth Based on this coefficient mobile broadband is estimated to have contributed an annual 032 per cent of GDP This represented 69 per cent of all GDP growth for the economy during the past decade given that GDP in the Philippines grew at a compound annual average rate of 46 per cent In addition given the acceleration of mobile broadband penetration since 2005 the impact of the technology had almost doubled reaching 061 per cent of GDP and representing 73 per cent of all economic growth in the Philippines This result further reinforced the increasing returns to scale hypothesis for network infrastructures
32 Hypotheses
Considering the evidence generated in the research literature and the ITU 2018 global study that preceded the Asia-Pacific region analysis different types of effects could be stipulated in some countries in the Asia-Pacific region
bull high impact of fixed broadband for high-income countries
bull low impact of mobile broadband for middle-income countries
bull high impact of digitization for high-income countries
In addition to testing the economic impact of broadband (fixed and mobile) and digitization the impact of policy and regulatory frameworks on the development of digitization was also tested
10 State-of-the-art econometric models currently in use consist of four equations an aggregate production function modelling the economy and subsequently three functions demand supply and output Originally developed by Roller and Waverman (2001) and implemented by Koutroumpis (2009) Katz and Koutroumpis (2012a 2012b) and Katz and Callorda (2014 2016 2018)
6
The economic contribution of broadband digitization and ICT regulation
33 Economic impact of fixed broadband in the Asia-Pacific region
The estimation of the economic contribution of fixed broadband in the Asia-Pacific region relied on the same structural model used in the ITU 2018 global study and in the estimation of effects in other regions The model consists of four equations an aggregate production function modelling the economy and subsequently three functions demand supply and output
Data
To test the hypothesis of fixed broadband economic impact presented above a database of the countries mentioned above was built containing time series for all the required variables between 2011 and 2017 The data sources are the International Telecommunication Union the World Bank and Ovum (see Annexes A and B for sources of data)
Model results and discussion
Table 1 presents the model results for 18 countries in the Asia-Pacific region Australia Bangladesh Cambodia China India Indonesia Islamic Republic of Iran Japan Malaysia New Zealand Pakistan Philippines Republic of Korea Republic of Nepal Singapore Sri Lanka Thailand Viet Nam11
Table 1 Economic impact of fixed broadband (Asia-Pacific region)
GDP per capita (purchasing power parity (PPP))
Fixed Broadband Subscribers Penetration 016321
Capital 006453
Education 032973
Fixed Broadband Subscribers Penetration
Fixed Telephone Subscribers 026323
Rural Population -006317
GDP per capita 076166
Fixed Broadband price -006035
HHI Fixed Broadband -011748
Revenue Fixed Broadband
GDP per capita 042119
Fixed Broadband price 102013
HHI Fixed Broadband -015685
Fixed Broadband Adoption Growth
Revenue Fixed Broadband -060433
Observations 463
Number of countries 18
11 Some countries in the region were not included because they either exhibit less than 2 household adoption of fixed broadband or they lack data on industry structure (a key variable in the structural model)
7
The economic contribution of broadband digitization and ICT regulation
Country Fixed Effects Yes
Year and quarter Fixed Effects Yes
Years 2011-2017
R-Squared first model 09978
significant at 1 5 and 10 critical value respectively
As expected according to the fixed broadband general model this technology has had a significant economic contribution in the Asia-Pacific region during the last six years (2011-2017) An increase of 10 per cent in fixed broadband penetration yields an increase in 163 per cent in GDP per capita Capital formation and education have also had a positive impact on GDP growth It is important to note that the exclusion of countries with less than 2 per cent household fixed broadband adoption confirms the return to scale hypothesis The Asia-Pacific region results for fixed broadband are positive and statistically significant and higher than the impact for high-income countries in the global sample (163 vs 140) (see Table 2 and 13)
Table 2 Economic impact of fixed broadband for high-income countries (Global model compared to the Asia-Pacific region)
Global ITU study - High-income countries Asia-Pacific region
GDP per capita (PPP)
Fixed Broadband Subscriber Penetration 014047 016321
Capital 030257 006453
Education -011711 032973
Fixed Broadband Subscriber Penetration
Fixed Telephone Subscribers 039270 026323
Rural Population 004370 -006317
GDP per capita 015746 076166
Fixed Broadband Price 022080 - -006035
HHI Fixed Broadband -021266 -011748
Fixed Broadband Revenue
GDP per capita -048618 042119
Fixed Broadband Price 146762 102013
HHI Fixed Broadband -081781 -015685
Fixed Broadband Adoption Growth
Fixed Broadband Revenue -082810 -060433
Observations 1364 463
Number of countries 50 18
8
The economic contribution of broadband digitization and ICT regulation
Global ITU study - High-income countries Asia-Pacific region
Country Fixed Effects Yes Yes
Year and quarter Fixed Effects Yes Yes
Years 2010-2017 2011-2017
R-Squared first model 09848 09978
significant at 1 5 and 10 critical value respectively
NOTE The global model was built starting in 2010 given that by then most countries had exceeded the 5 per cent adoption threshold
34 Economic impact of mobile broadband in the Asia-Pacific region
The fixed broadband model like the structural model used to test the economic contribution of mobile broadband comprises an aggregate production function modelling the economy and three subsequent functions demand supply and output
Data
To test the economic impact of mobile broadband hypothesis presented above a database was built for the following 24 countries Afghanistan Australia Bangladesh Cambodia China India Indonesia Islamic Republic of Iran Japan Lao PDR Malaysia Mongolia Myanmar Republic of Korea Republic of Nepal New Zealand Pakistan Papua New Guinea Philippines Singapore Sri Lanka Thailand Vanuatu Viet Nam The database contains time series for all the required variables between 2011 and 2017 for observations with an adoption rate higher than 4 per cent of the population The data sources are the International Telecommunication Union the World Bank and GSMA (see Annexes A and B for sources of data)
Model results and discussion
The model was run for all 24 countries in the Asia-Pacific region (listed above) for seven years (2011-2017) yielding statistically significant results and thereby confirming the effects identified in the global model The results are as presented in Table 3
Table 3 Economic impact of mobile broadband (Asia-Pacific region)
GDP per capita (PPP)
Mobile Broadband Unique Subscribers Penetration 005091
Capital 001831
Education 041805
Mobile Broadband Unique Subscribers Penetration
Mobile Unique Subscribers Penetration 134777
Rural Population -004220
GDP per capita 011848
Mobile Broadband Price 002943
HHI Mobile Broadband -011985
9
The economic contribution of broadband digitization and ICT regulation
Revenue Mobile Broadband
GDP per capita 149669
Mobile Broadband price -016775
HHI Mobile Broadband -011985
Mobile Broadband Adoption Growth
Revenue Mobile Broadband -079806
Observations 633
Number of countries 24
Country Fixed Effects Yes
Year and quarter Fixed Effects Yes
Years 2011-2017
R-Squared first model 09982
significant at 1 5 and 10 critical value respectively
According to the mobile broadband model for the 24 selected countries in the Asia-Pacific region an increase of 10 per cent in mobile broadband penetration yields an increase of 051 per cent in GDP per capita The importance of fixed capital formation is not statistically significant although it presents a positive sign Similarly education remains as important as in the fixed broadband model In the aggregate mobile broadband appears to have a lower economic impact than fixed broadband (163 per cent versus 051 per cent increase in GDP per capita as a result of 10 per cent increase in broadband penetration)
This sample includes the most developed countries in the region which as evidenced in the ITU 2018 global study appears to yield a lower economic impact than fixed broadband This finding is also confirmed when comparing the Asia-Pacific region model results with those of the ITU 2018 global study (general mobile broadband model
Table 4 Economic impact of mobile broadband (Global sample compared to the Asia-Pacific region)
Global Asia Pacific
GDP per Capita (PPP)
Mobile Broadband Unique Subscribers Penetration 015022 005091
Capital 021490 001831
Education 005569 041805
Mobile Broadband Unique Subscribers Penetration
Mobile Unique Subscribers Penetration 16797 134777
Rural Population -003596 -004220
GDP per capita 005968 011848
Mobile Broadband price 000728 002943
10
The economic contribution of broadband digitization and ICT regulation
Global Asia Pacific
HHI Mobile Broadband -037128 -011985
Revenue Mobile Broadband
GDP per capita 008839 149669
Mobile Broadband price 011020 -016775
HHI Mobile Broadband -212035 -011985
Mobile Broadband Adoption Growth
Revenue Mobile Broadband -114176 149669
Observations 3858 633
Number of countries 139 24
Country Fixed Effects Yes Yes
Year and quarter Fixed Effects Yes Yes
Years 2010-2017 2011-2017
R-Squared first model All 09982
significant at 1 5 and 10 critical value respectively
As depicted in Table 4 the global sample model which includes a larger percentage of developing countries than the Asia-Pacific region model indicates a higher coefficient of mobile broadband economic contribution
To test the hypothesis that impact of mobile broadband is higher in emerging economies the high-income countries were excluded (Australia Japan New Zealand Singapore and Republic of Korea) from the Asia-Pacific region sample In this case an increase of 10 per cent in mobile broadband penetration yields an increase in 243 per cent in GDP12 (see table 5)
Table 5 Economic impact of mobile broadband (Asia-Pacific region mid- and low-income countries)
GDP per Capita (PPP)
Mobile Broadband Unique Subscribers Penetration 024389
Capital 002877
Education 030639
Mobile Broadband Unique Subscribers Penetration
Mobile Unique Subscribers Penetration 119652
Rural Population 002148
GDP per capita 004730
Mobile Broadband price 003705
12 In this model we only consider observations with adoption rate higher than 12 of population In that point the growth rate of the technology reduces significantly the variance
11
The economic contribution of broadband digitization and ICT regulation
HHI Mobile Broadband 005752
Revenue Mobile Broadband
GDP per capita 153028
Mobile Broadband price -038190
HHI Mobile Broadband -146858
Mobile Broadband Adoption Growth
Revenue Mobile Broadband -032794
Observations 398
Number of countries 18
Country Fixed Effects Yes
Year and quarter Fixed Effects Yes
Years 2011-2017
R-Squared first model 09955
significant at 1 5 and 10 critical value respectively
When high-income countries in the Asia-Pacific region are excluded from the sample the mobile broadband contribution coefficient increases from 051 to 243 A comparison of level of impact for the global sample and for Asia-Pacific region is shown in Figure 1
Figure 1 Economic impact of mobile broadband (Global sample vs Asia-Pacific region 2017)
Source ITU
As depicted in Figure 1 the structural model compared to both data samples yields similar saturation effects confirming the mobile broadband hypothesis
12
The economic contribution of broadband digitization and ICT regulation
35 Economic impact of digitization in the Asia-Pacific region
In addition to measuring the impact of a single communications technology -broadband- the economic contribution of digitization as measured by the CAF (Corporacioacuten Andina de Fomento) Digital Eco-system Development Index13 (Katz and Callorda 2018e) was also tested The hypothesis to be tested in this case is whether the economic contribution of digitization increases in high-income countries relative to emerging economies For this purpose the endogenous growth model which links GDP to the fixed stock of capital labour force and the CAF Digital Ecosystem Development Index as a proxy of digital technology progress was run for 30 countries in the Asia-Pacific region
Data
The CAF Digital Ecosystem Development Index was calculated for Afghanistan Australia Bangladesh Bhutan Brunei Darussalam Cambodia China Republic of Korea Fiji India Indonesia Islamic Republic of Iran Japan Lao PDR Malaysia Mongolia Myanmar Republic of Nepal New Zealand Pakistan Papua New Guinea Philippines Singapore Solomon Islands Sri Lanka Thailand Timor-Leste Tonga Vanuatu Viet Nam
In addition the model included independent variables for fixed capital formation (source World Bank) GDP per capita (source IMF) and tertiary school enrolment as a proxy for labour quality (source World Bank)
Model results and discussion
The model was first run for 30 countries14 over seven years (2011-2017) which resulted in 210 observations and included fixed effects by year (see table 6)
Table 6 Economic impact of digitization (Asia-Pacific region)
Variable Coefficients
Previous GDP046987
(006445)
Digitization018906
(005987)
Capital008080
(005338)
Labour033793
(033050)
Constant375917
(058804)
Observations 210
Year fixed effects Yes
significant at 1 5 and 10 critical value respectively
13 The CAF Digital Ecosystem Development Index developed with funding from CAF Development Bank for Latin America14 Afghanistan Australia Bangladesh Bhutan Brunei Darussalam Cambodia China Fiji India Indonesia Islamic
Republic of Iran Japan Lao PDR Malaysia Mongolia Myanmar New Zealand Pakistan Papua New Guinea Philippines Republic of Korea Republic of Nepal Singapore Solomon Islands Sri Lanka Thailand Timor-Leste Tonga Vanuatu Viet Nam
13
The economic contribution of broadband digitization and ICT regulation
According to the model an increase of 10 per cent in the CAF Digital Ecosystem Development Index results in a 189 per cent growth in GDP per capita Therefore an increase in the Digital Ecosystem Development Index from 50 to 51 will yield an increase of per capita GDP of 038 per cent (accounting both for direct and indirect effects on output)
The coefficient of economic impact of digitization in the Asia-Pacific region model is 40 per cent higher than the impact of the OECD model developed in the ITU 2018 global study except that this result is not as robust as that developed for the global sample because of the reduced number of observations (see table 7)
Table 7 Economic impact of digitization 2017 (Asia-Pacific region compared to OECD)
Variable Asia-Pacific region OECD
Previous GDP046987
(006445)
06783
(00311)
Digitization018906
(005987)
01351
(00711)
Capital008080
(005338)
02105
(00291)
Labour033793
(033050)
-00736
(00502)
Constant375917
(058804)
23371
(03823)
Observations 210 374
Year fixed effects Yes Yes
significant at 1 5 and 10 critical value respectively
36 Impact of policy and regulatory framework on digitization in the Asia-Pacific region
The following analysis relies on the ITU ICT Regulatory Tracker as the independent variable to test its impact on the CAF Digital Ecosystem Development Index For this purpose as in the ITU 2018 global study cited above two models were developed the first tests the correlation between the ICT Regulatory Tracker and the CAF Digital Ecosystem Development Index The underlying premise is that higher regulatory performance is directly related to the development of the digital economy
Beyond measuring the correlation between both variables the second model was developed with lagged variables
Finally the variables were converted to logarithms to test causality of change in the values of both indices
14
The economic contribution of broadband digitization and ICT regulation
Data
The models in this case rely on the ICT Regulatory Tracker and the CAF Digital Ecosystem Development Index for the period between 2008 and 2017 for Afghanistan Australia Bangladesh Bhutan Brunei Darussalam Cambodia China Fiji India Indonesia Islamic Republic of Iran Japan Lao PDR Malaysia Mongolia Myanmar New Zealand Pakistan Papua New Guinea Philippines Republic of Korea Republic of Nepal Singapore Solomon Islands Sri Lanka Thailand Timor-Leste Tonga Vanuatu Viet Nam The CAF Digital Ecosystem Development index includes an institutional and regulatory pillar which had to be excluded from the calculations in order to avoid co-linearity Once the index was recalculated it was possible to test the impact of the ICT Regulatory Tracker on digitization
Model results and discussion
As in the prior section a correlational analysis between both indices was initially run (results are presented in table 8)
Table 8 Correlation between the ICT Regulatory Tracker and the CAF Digital Ecosystem Development Index (Asia-Pacific region)
CAF Digital Ecosystem Development Index (without the regulatory pillar)
Coefficient (standard deviation)Asia-Pacific region
ICT Regulatory Tracker043486
(002353)
Constant464202
(129862)
R-square 05332
Fixed effects for year and country Yes
Countries 30
Observations 330
Years 2007-2017
significant at 1 5 and 10 critical value respectively
In order to test for the causal link a control of a one-year lag of the ICT Regulatory Tracker was also added (see table 9)
Table 9 Impact of lagged ICT Regulatory Tracker on the CAF Digital Ecosystem Development Index (Asia-Pacific region)
CAF Digital Ecosystem Development Index (without regulatory sub-index)
Coefficient(Standard deviation)
Asia-Pacific
CAF Digital Ecosystem Development Index (without regulation pillar)
021101
(004695)
ICT Regulatory Tracker (t-1)024801
(004157)
Constant433466
(145038)
15
The economic contribution of broadband digitization and ICT regulation
CAF Digital Ecosystem Development Index (without regulatory sub-index)
Coefficient(Standard deviation)
Asia-Pacific
R-squared 05585
Fixed effects for year and country Yes
Groups 30
Observations 330
Years 2008-2017
significant at 1 5 and 10 critical value respectively
In this model it was found that an additional point in the ICT Regulatory Tracker yields 021101 points higher in the CAF Digital Ecosystem Development Index (without the regulatory sub-index) in the same period and 024801 higher in the subsequent period which by adding both effects yields a total coefficient of 045902
Considering that the two previous models tested the correlation between both indices the variables were converted to logarithms to assess change Additionally the CAF Digital Ecosystem Development Index was recalculated without the regulatory and the competition pillars (given the potential co-linearity with the ICT Regulatory Tracker is high) (see table 10)
Table 10 Impact of lagged ICT Regulatory Tracker on the CAF Digital Ecosystem Development Index (Asia-Pacific region)
Log CAF Digital Ecosystem Development Index (without the reg-ulatory and competition pillars)
Coefficient(Standard deviation)
Asia-Pacific region
Log CAF Digital Ecosystem Development Index (without regulation and competition pillars) (t-1)
003179
(000162)
Log ICT Regulatory Tracker (t-1)018752
(002372)
Constant161231
(007790)
R-Squared 07526
Fixed effects for year and country Yes
Groups 30
Observations 330
Years 2008-2017
significant at 1 5 and 10 critical value respectively
In this case it is possible to prove the hypothesis an increase of 10 per cent in the ICT Regulatory Tracker yields a positive increase in the CAF Digital Ecosystem Development Index of 1875 per cent in the subsequent time period
In order to further test the relationship between the regulatory and the digital ecosystem indices a set of alternative correlations between pillars was also run (see Table 11)
16
The economic contribution of broadband digitization and ICT regulation
Table 11 Correlations between ICT Regulatory Tracker and CAF Digital Ecosystem Development Index pillars (Asia-Pacific region)
Pillars ICT Regula-tory Tracker
ICT Regula-tory Tracker
(without Competition)
Regulatory authority
component
Regulatory mandate
component
Regulatory regime
component
Competition framework component
CAF Digital Ecosystem Development Index
04757
(00328)
04777
(00358)
04135
(00540)
04746
(00436)
05128
(00257)
04024
(00421)
Infrastructure of Digital Services
06528
(00495)
06808
(00537)
05918
(00816)
06679
(00653)
07330
(00394)
05685
(00617)
Connectivity of Digital Services
05327
(00370)
05449
(00401)
04741
(00610)
05444
(00489)
05885
(00282)
04504
(00474)
Household digi-tization
04699
(00345)
04774
(00375)
04435
(00559)
04748
(00454)
05107
(00276)
03978
(00436)
Digitization of production
06457
(00475)
06759
(00512)
05909
(00775)
06656
(00625)
07179
(00372)
05166
(00610)
Digital Competitive Intensity
03566
(00283)
03325
(00312)
02645
(00454)
03257
(00372)
03572
(00245)
03020
(00353)
Development of Digital Industries
02642
(00239)
02496
(00263)
02256
(00382)
02551
(00308)
02680
(00212)
02262
(00290)
Digital factors of production
04594
(00336)
04469
(00369)
03768
(00553)
04465
(00444)
04958
(00270)
03925
(00426)
significant at 1 5 and 10 critical value respectively
NOTE The values in bold have correlations higher than 060
A second set of regressions shows that the regulatory regime component of the ICT Regulatory Tracker appears to be the main path of impact of the CAF Digital Ecosystem Development Index (see Table 12)
17
The economic contribution of broadband digitization and ICT regulation
Table 12 Impact of the ICT Regulatory Tracker components on the CAF Digital Ecosystem Development Index pillars (Asia-Pacific region)
CAF Digital Ecosystem Develop-
ment Index
Infra-structure of Digital Services
Connec-tivity of Digital
Services
House-hold
digitiza-tion
Digitiza-tion of
produc-tion
Digital Competitive Intensity
Develop-ment of Digital
Industries
Digital factors of produc-
tion
Regulatory authority component
00768
(00698)
01196
(01086)
00708
(00769)01352
(00758)
01347
(01020)
00650
(00671)
00250
(00589)
00128
(00748)
Regulatory mandate component
-01621
(00930)
-02704
(01447)
-01661
(01024)-01875
(01009)
-02535
(01359)
-01736
(00894
-00268
(00785)
-00104
(00997)
Regulatory regime component
05361
(00388)
07889
(00604)
06179
(00427)
05245
(00421)
07554
(00567)
03845
(00373)
02591
(00327)
05188
(00416)
Constant 21329 (01161)
13189
(01805)
23402
(01278)
21567
(01259)
09998
(01696)
29962
(01116)
19717
(00979)
19961
(01244)
R-squared 05688 05346 05925 05302 05513 03974 03316 05159
significant at 1 5 and 10 critical value respectively
Table 12 indicates that the regulatory regime component has a positive and significant impact on every pillar of the CAF Digital Ecosystem Development Index15 This could indicate that the regulatory regime could be the components that has a higher impact on digital development16 in the Asia-Pacific region
4 ConclusionThis regional analysis on the Asia Pacific region has validated the findings of the ITU 2018 global study on the economic contribution of broadband and digitization as well as the impact of regulation and policy on the digital economy development based on the following considerations
bull Fixed broadband economic impact is guided by a return to scale effect according to which the economic impact of fixed broadband is higher in more developed countries than in less developed countries
bull The economic impact of mobile broadband depicts a saturation effect according to which its contribution is higher in less developed than in more developed countries
bull The impact of the digital ecosystem on high-income economies is higher than in developing countries
bull The regulatory and policy framework has an impact on the development of the digital ecosystem
15 The regulatory regime component includes indicators such as type of licenses provided to offer telecommunication services obligations to publish interconnection offers by operators monitoring of quality of service infrastructure sharing for mobile operators permitted andor mandated unbundled access in local loop spectrum secondary trading allowed and number portability
16 While the second component of the ICT Regulatory has sometimes a negative sign the coefficient of regulatory regime is always bigger and positive
18
The economic contribution of broadband digitization and ICT regulation
An assessment of the research literature on the Asia-Pacific region provided some validation of the findings on the ITU 2018 global study Considering the evidence generated in the research literature and the global study that preceded this analysis we stipulated different types of effects for each sub-region in the Asia-Pacific region
bull Impact of fixed broadband The impact should be higher considering the weight that high-income economies (Australia Japan New Zealand Republic of Korea Singapore) have in the Asia-Pacific region while it would be lower in the rest of countries if the high-income economies were to be excluded
bull Impact of mobile broadband The impact should be lower considering the weight of high-income economies (Australia Japan New Zealand Republic of Korea Singapore) have in Asia Pacific However if high-income economies are excluded from the sample the impact should be higher
bull Impact of digitization The impact should be high considering high-income economies in the Asia-Pacific region (Australia Japan New Zealand Republic of Korea Singapore)
The evidence yielded by the econometric analysis amply confirms these hypotheses (Table 13)
Table 13 Summary of results of econometric models (Asia-Pacific)
Hypotheses
10 increase impact on GDP per capita growth
Asia-Pacific totals
Asia-Pacific low- and
medium-in-come
countries
Global Study
high-income countries
Global Study low-income
countries
Economic impact of fixed broadband 163 000 140 000
Economic impact of mobile broadband 051 243 000 198
Economic impact of digitization189
135
(OECD countries)
104
(non-OECD countries)
bull Impact of fixed broadband The contribution of the total sample for the Asia-Pacific region is comparable to the high-income ITU 2018 global study results due to the weight of high-income economies in the Asia-Pacific region while it has zero impact in both low-income groups
bull Impact of mobile broadband The Asia-Pacific region low- and medium-income countries have a higher contribution coefficient than the total for all Asia-Pacific countries which is consistent with the ITU 2018 global study
bull Impact of digitization while results are less reliable due to sample size the impact in the Asia-Pacific region is as high as countries in the ITU 2018 global study
The conclusions Asia-Pacific region analyses are depicted in Figure 2
19
The economic contribution of broadband digitization and ICT regulation
Figure 2 Main findings for the Asia-Pacific region
Source ITU
The analysis of the impact of policy and regulatory framework on the growth of markets for digital services and applications aimed to test the impact of regulation and regulatory authorities on the development of the digital economy As illustrated in the previous sections all models were run for the Asia-Pacific region In this case the results also validated the positive impact of the policy and regulatory variable An increase of 10 per cent in the ICT Regulatory Tracker yields a positive increase in the CAF Digital Ecosystem Development Index of 1875 per cent for the Asia-Pacific region in the subsequent time period
A second set of regressions shows that of all the components of the ICT Regulatory Tracker the regulatory regime component appears to be the main path of impact of the CAF Digital Ecosystem Development Index This analysis provided further evidence of the importance of the regulatory and institutional variable in driving the growth of the digital ecosystem
20
The economic contribution of broadband digitization and ICT regulation
Annex A List of data sources for models testing the economic impact of fixed and mobile broadband
Indicator Source
GDP per capita (PPP) IMF
Fixed broadband subscriber penetration ITU - OVUM
Capital - Gross capital formation (percentage of GDP) World Bank
Education - School enrolment tertiary (per cent gross) World Bank
Fixed telephone subscribers ITU
Rural population (per cent of total population) World Bank
Fixed broadband price ITU
HHI fixed broadband OVUM
Fixed broadband revenue ITU - OVUM
Mobile broadband unique subscriber penetration GSMA
Mobile unique subscriber penetration GSMA
Mobile broadband priceARPU ITU - GSMA
HHI mobile broadband GSMA
Mobile broadband revenue GSMA
21
The economic contribution of broadband digitization and ICT regulation
Annex B Indicators in the Digital Ecosystem Development Index and data sourcesPillar Sub-pillar Indicator Source
Infrastructure Investment Telecommunications investment per capita in current prices ndash five year average (USD PPP)
World Bank ITU
Quality of service Average fixed broadband download speed (Mbits)
Akamai
Quality of service Average mobile broadband download speed (Average Mbits)
Akamai
Quality of service Fixed broadband connections with download speed higher than 4 Mbits (percentage)
Akamai
Quality of service Fixed broadband connections with download speed higher than 10 Mbits (percentage)
Akamai
Quality of service Fixed broadband connections with download speed higher than 15 Mbits (percentage)
Akamai
Quality of service Fibre optic broadband connections as a percent-age of total fixed broadband connections
ITU FTTH OECD
Quality of service International broadband bandwidth per Internet user (bits)
ITU
Coverage Fixed broadband coverage ( of households) Eurostat CAF Ideal OECD
Coverage 2G coverage ITU
Coverage 3G coverage ITU
Coverage 4G coverage ITU
Service infrastructure
IXPs per 1 000 000 population Packet Clearing House UNCTAD
Service infrastructure
Number of secure servers (per 1 000 000 population)
World Bank
Service infrastructure
Number of satellites (per 1 000 000 population) N2yocom
22
The economic contribution of broadband digitization and ICT regulation
Pillar Sub-pillar Indicator Source
Connectivity Affordability Monthly fixed broadband subscription as per-centage of GDP per capita
ITU
Affordability Monthly mobile broadband Smartphone sub-scription (500 MB cap prepaid) as percentage of GDP per capita
ITU
Affordability Monthly mobile broadband PC subscription (1 GB cap post-paid) as percentage of GDP per capita
ITU
Affordability Monthly pay TV subscription as percentage of GDP per capita
Business Bureau CAF PwC TAS
Penetration Fixed broadband penetration (connections per 100 households)
ITU
Penetration Mobile broadband penetration (connections per 100 population)
ITU
Penetration Unique mobile broadband users (per 100 population)
GSMA
Penetration Pay TV penetration (connections per 100 households)
Business Bureau CAF PwC TAS ITU Convergencia
Ownership Penetration of computers ( of households) ITU
Ownership Smartphone users (per 100 population) GSMA
Ownership Percentage of population with access to electric energy
World Bank
Household digitization
Internet use Percentage of population using the Internet ITU
Internet use Penetration of dominant social network (users per 100 population)
OWLOO
Internet use Mobile data ARPU as percentage of total ARPU GSMA
E-government E-government index ONU
E-commerce Internet commerce as percentage of total retail commerce
Euromonitor
Telemedicine National health policy (binary variables) WHO
OTTs Video on demand penetration (per cent households)
PWC
23
The economic contribution of broadband digitization and ICT regulation
Pillar Sub-pillar Indicator Source
Digitization of production
Digital infrastructure
Per cent enterprises with Internet access UNCTADstat TAS Eurostats
Digital supply chain Per cent enterprises using Internet for elec-tronic banking
UNCTADstat TAS Eurostats
Digital supply chain Per cent enterprises using Internet for pur-chasing inputs
UNCTADstat TAS Eurostats
Digital distribution Per cent enterprises that sell products over the Internet
UNCTADstat TAS Eurostats
Digital processing Per cent workforce using the Internet UNCTADstat TAS Eurostats
Digital processing Per cent workforce using computers UNCTADstat TAS Eurostats
Competitive intensity
Competition level HHI fixed broadband Convergencia Regulators TAS
Competition level HHI mobile broadband GSMA Regulators
Competition level HHI pay TV Convergencia Dataxis Ofcom TAS Reguladores
Competition level HHI mobile telephony GSMA Regulators
Digital industries
Exports High technology exports (USD per capita in cur-rent prices)
World Bank
Exports ICT services exports (USD per capita in current prices)
World Bank
Weight of digital industries
Digital ecosystem sales as a percentage of GDP PWC TAS ITU
Weight of digital industries
Telecommunications operators revenues per capita (USD in current prices)
ITU
Weight of digital industries
Computer software spending (per cent of GDP) INSEAD
Internet of Things M2M connections (per 100 population) ITU OECD
Content production Wikipedia pages edited per month (per million population between 15 and 69 years old)
INSEAD
24
The economic contribution of broadband digitization and ICT regulation
Pillar Sub-pillar Indicator Source
Factors of digi-tal production
Human capital Education years expectancy (years) World Bank UNESCO
Human capital Tertiary school enrolment (per cent population) World Bank UNESCO
Schools Per cent educational establishments with Internet access
UNESCO CEPAL
Schools Computers per students ratio UNESCO CEPAL
Innovation USPTO patents per country (per 1 000 000 population)
USPTO
Innovation Intellectual property revenues (USD per capita PPA in current prices)
World Bank
Investment in innovation
RampD spending (per cent of GDP) World Bank UNESCO
Economic development
GDP per capita (USD current prices) IMF
Economic development
Electric energy consumption (kWh per capita) World Bank
Institutional and regulatory
Cyber-security and piracy
Per cent of non-licensed installed software BSA The soft-ware alliance
Cyber-security and piracy
Commercial value of non-licensed software (as per cent of GDP)
BSA The soft-ware alliance
Government role Per cent of regulatory agency attributions based on ITU regulatory tracker
ITU TAS
Government role Per cent of regulatory agency functions based on ITU regulatory tracker
ITU TAS
- - Population World Bank
- - Exchange rate PPP IMF
- - Number of households ITU
- - GDP per capita for first quintile (USD in cur-rent prices)
IMF World Mundial
25
The economic contribution of broadband digitization and ICT regulation
Bibliographybull Socio-economic impact of mobile broadband in Thailand and contribution to the digital economy
Analysys Mason (2015)
bull The economic impacts of mobile broadband on the Australian economy from 2006 to 2013 Centre for International Economics (2014)
bull The Mobile economy Asia Pacific 2017 GSM Association https www gsma com asia -pacific resources the -mobile -economy -asia -pacific -2017
bull Addressing Inter-State Issues Broadband impact on economic growth Kathuria R (2010)
bull The impact of broadband on the economy research to date and policy issues International Telecommunication Union Katz R (2012) https www itu int ITU -D treg broadband ITU -BB -Reports _Impact -of -Broadband -on -the -Economy pdf
bull The economic impact of broadband in the Philippines Broadband Commission for Digital Development Katz R and Koutroumpis P (2012)
bull The economic contribution of broadband digitization and ICT regulation International Telecommunication Union Katz R and Callorda F (2018) https www itu int en ITU -D Regulatory -Market Documents FINAL _1d _18 -00513 _Broadband -and -Digital -Transformation -E pdf
bull The impact of mobile internet on the economy of Southeast Asia Oxford Economics (2016)
Office of the Director International Telecommunication Union (ITU) Telecommunication Development Bureau (BDT) Place des Nations CH-1211 Geneva 20 Switzerland
Office of Deputy Director and Regional Presence Field Operations Coordination Department (DDR) Place des Nations CH-1211 Geneva 20 Switzerland
Email bdtdirectorituint Email bdtdeputydirituint Tel +41 22 730 50355435 Tel +41 22 730 5131 Fax +41 22 730 5484 Fax +41 22 730 5484 Digital Networks and Society (DNS) Digital Knowledge Hub Department
(DKH) Partnerships for Digital Development Department (PDD)
Email bdt-dnsituint Email bdt-dkhituint Email bdt-pddituint Tel +41 22 730 5421 Tel +41 22 730 5900 Tel +41 22 730 5447 Fax +41 22 730 5484 Fax +41 22 730 5484 Fax +41 22 730 5484 Africa
Ethiopia Cameroon Senegal Zimbabwe International Telecommunication Union (ITU) Regional Office Gambia Road Leghar Ethio Telecom Bldg 3rd floor PO Box 60 005 Addis Ababa Ethiopia
Union internationale des teacuteleacutecommunications (UIT) Bureau de zone Immeuble CAMPOST 3e eacutetage Boulevard du 20 mai Boicircte postale 11017 Yaoundeacute Cameroon
Union internationale des teacuteleacutecommunications (UIT) Bureau de zone 8 Route des Almadies Immeuble Rokhaya 3e eacutetage Boicircte postale 29471 Dakar - Yoff Senegal
International Telecommunication Union (ITU) Area Office TelOne Centre for Learning Corner Samora Machel and Hampton Road PO Box BE 792 Belvedere Harare Zimbabwe
Email itu-ro-africaituint Email itu-yaoundeituint Email itu-dakarituint Email itu-harareituint Tel +251 11 551 4977 Tel + 237 22 22 9292 Tel +221 33 859 7010 Tel +263 4 77 5939 Tel +251 11 551 4855 Tel + 237 22 22 9291 Tel +221 33 859 7021 Tel +263 4 77 5941 Tel +251 11 551 8328 Fax + 237 22 22 9297 Fax +221 33 868 6386 Fax +263 4 77 1257 Fax +251 11 551 7299 Americas
Brazil Barbados Chile Honduras Uniatildeo Internacional de Telecomunicaccedilotildees (UIT) Escritoacuterio Regional SAUS Quadra 6 Ed Luis Eduardo Magalhatildees Bloco ldquoErdquo 10ordm andar Ala Sul (Anatel) CEP 70070-940 Brasilia - DF Brazil
International Telecommunication Union (ITU) Area Office United Nations House Marine Gardens Hastings Christ Church PO Box 1047 Bridgetown Barbados
Unioacuten Internacional de Telecomunicaciones (UIT) Oficina de Representacioacuten de Aacuterea Merced 753 Piso 4 Santiago de Chile Chile
Unioacuten Internacional de Telecomunicaciones (UIT) Oficina de Representacioacuten de Aacuterea Colonia Altos de Miramontes Calle principal Edificio No 1583 Frente a Santos y Ciacutea Apartado Postal 976 Tegucigalpa Honduras
Email itubrasiliaituint Email itubridgetownituint Email itusantiagoituint Email itutegucigalpaituint Tel +55 61 2312 2730-1 Tel +1 246 431 0343 Tel +56 2 632 61346147 Tel +504 2235 5470 Tel +55 61 2312 2733-5 Fax +1 246 437 7403 Fax +56 2 632 6154 Fax +504 2235 5471 Fax +55 61 2312 2738 Arab States Asia-Pacific CIS Egypt Thailand Indonesia Russian Federation International Telecommunication Union (ITU) Regional Office Smart Village Building B 147 3rd floor Km 28 Cairo Alexandria Desert Road Giza Governorate Cairo Egypt
International Telecommunication Union (ITU) Regional Office Thailand Post Training Center 5th floor 111 Chaengwattana Road Laksi Bangkok 10210 Thailand Mailing address PO Box 178 Laksi Post Office Laksi Bangkok 10210 Thailand
International Telecommunication Union (ITU) Area Office Sapta Pesona Building 13th floor JI Merdan Merdeka Barat No 17 Jakarta 10110 Indonesia Mailing address co UNDP ndash PO Box 2338 Jakarta 10110 Indonesia
International Telecommunication Union (ITU) Regional Office 4 Building 1 Sergiy Radonezhsky Str Moscow 105120 Russian Federation
Email itu-ro-arabstatesituint Email ituasiapacificregionituint Email ituasiapacificregionituint Email itumoscowituint Tel +202 3537 1777 Tel +66 2 575 0055 Tel +62 21 381 3572 Tel +7 495 926 6070 Fax +202 3537 1888 Fax +66 2 575 3507 Tel +62 21 380 23222324 Fax +62 21 389 5521 Europe
Switzerland International Telecommunication Union (ITU) Office for Europe Place des Nations CH-1211 Geneva 20 Switzerland
Email eurregionituint Tel +41 22 730 5467 Fax +41 22 730 5484
Regional initiativesAsia-Pacific
ITUPublications
The economic contribution of broadband digitization and ICT regulationEconometric modelling for the Asia-Pacific region
Published in SwitzerlandGeneva 2019
Photo credits Shutterstock
International Telecommunication UnionTelecommunication Development Bureau
Place des NationsCH-1211 Geneva 20
Switzerland
ASIA -PACIFIC
The
eco
nom
ic c
ont
rib
utio
n o
f b
road
ban
d d
igit
izat
ion
and
ICT
reg
ulat
ion
Eco
nom
etri
c m
od
ellin
g fo
r th
e A
sia-
Paci
fic r
egio
n
ISBN 978-92-61-29371-0
9 7 8 9 2 6 1 2 9 3 7 1 0
- The economic contribution of broadband digitization and ICT regulation Econometric modelling for the Asia-Pacific region
- Acknowledgements
- Authors
- Foreword
- 1 Introduction
- 2 The effects identified on a global scale
-
- 21 Economic impact of fixed broadband
- 22 Economic impact of mobile broadband
- 23 Economic impact of digitization
- 24 Impact of policy and regulatory framework on digitization development
-
- 3 The economic contribution of broadband and digitization and the impact of policy on digitization in the Asia-Pacific region
-
- 31 Review of the research literature
- 32 Hypotheses
- 33 Economic impact of fixed broadband in the Asia-Pacific region
- 34 Economic impact of mobile broadband in the Asia-Pacific region
- 35 Economic impact of digitization in the Asia-Pacific region
- 36 Impact of policy and regulatory framework on digitization in the Asia-Pacific region
-
- 4 Conclusion
- Annex A List of data sources for models testing the economic impact of fixed and mobile broadband
- Annex B Indicators in the Digital Ecosystem Development Index and data sources
- Bibliography
-
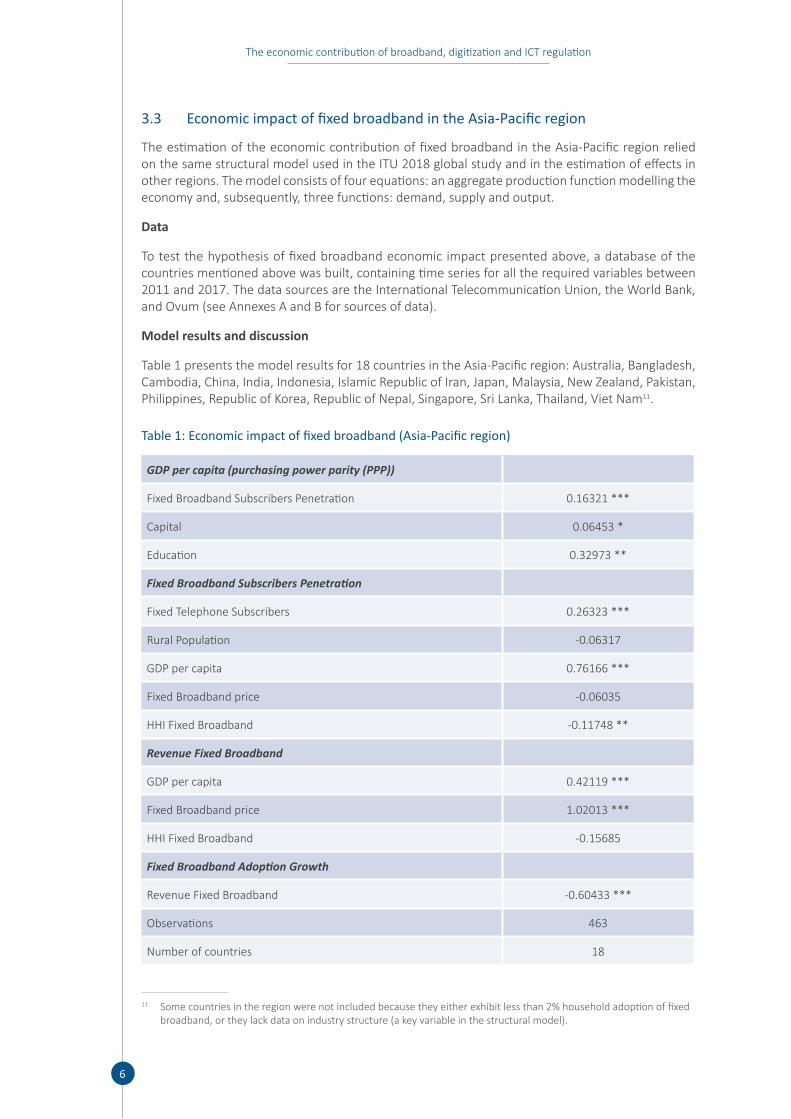
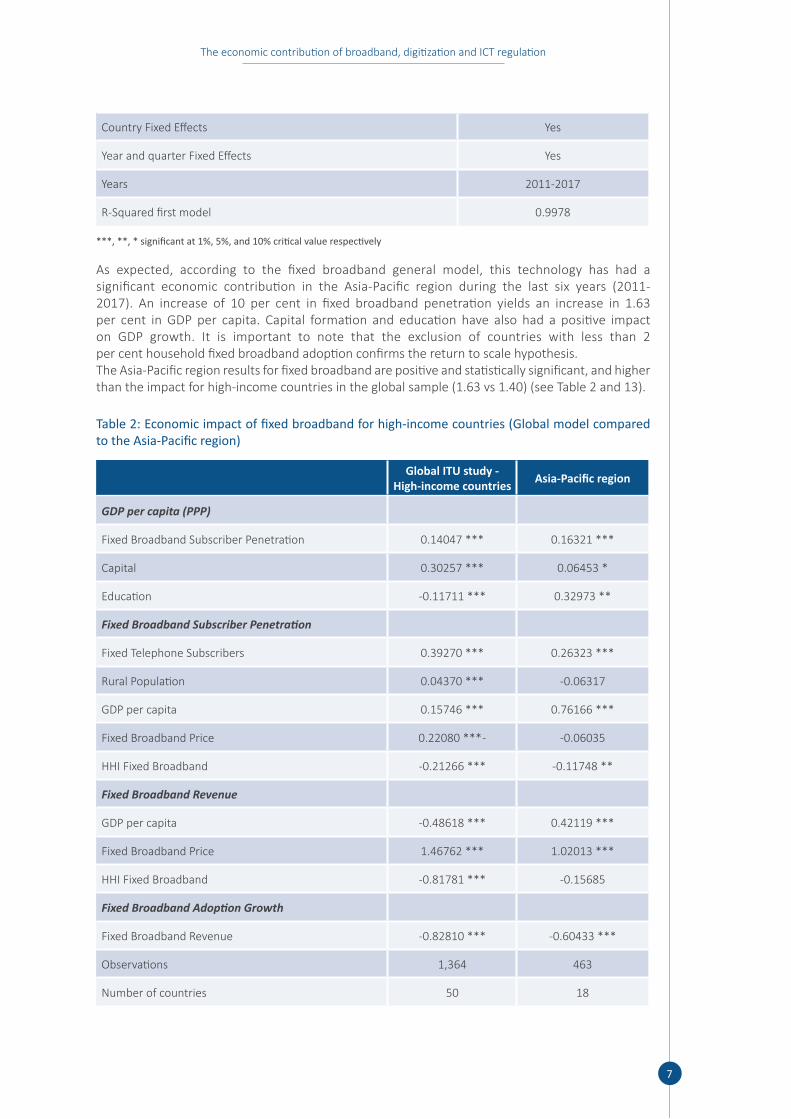
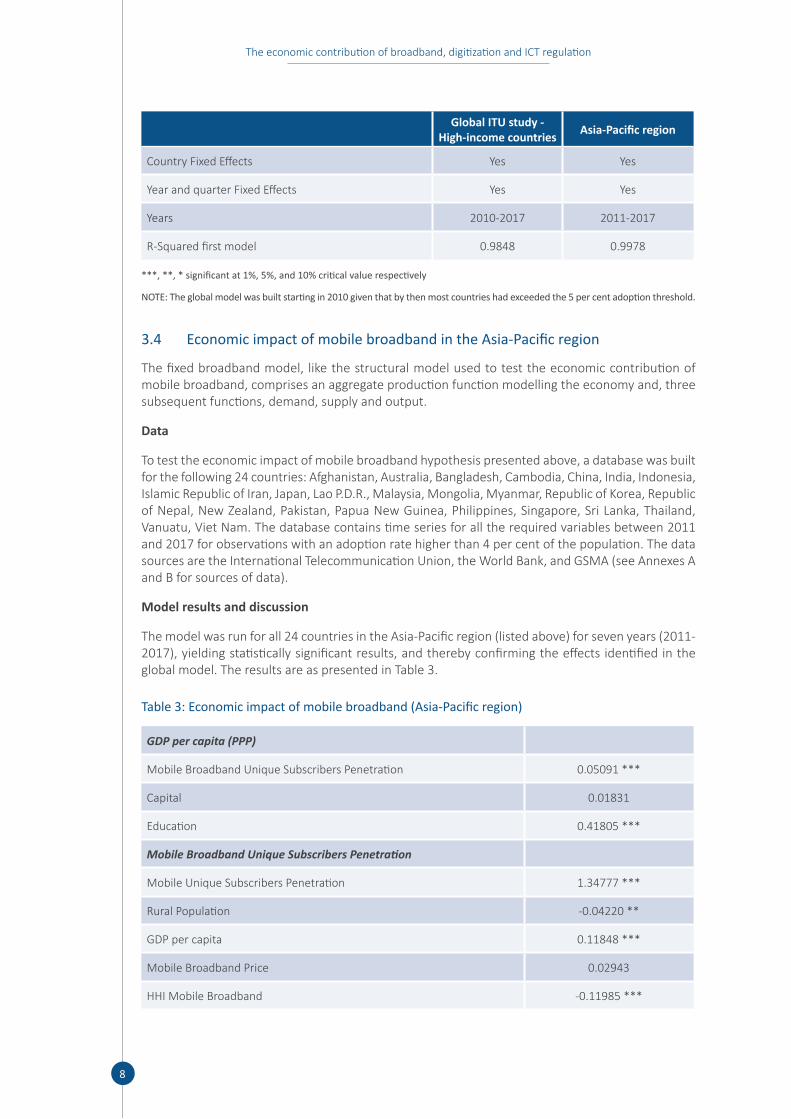
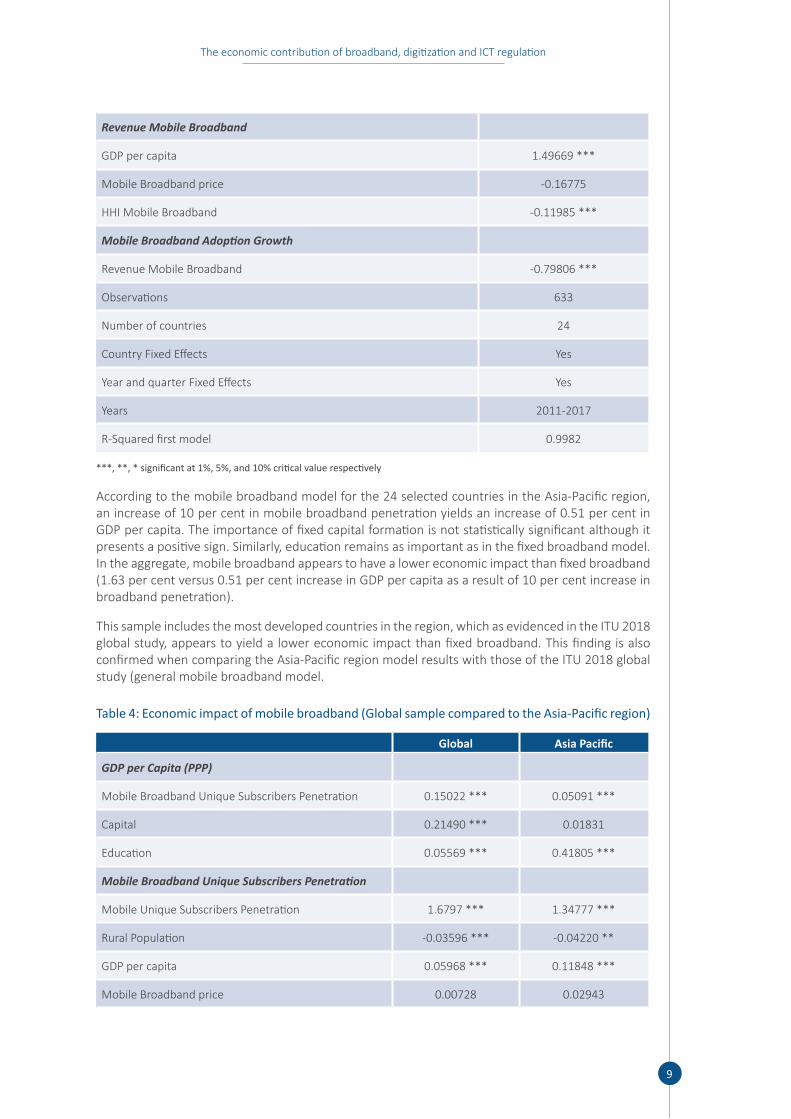
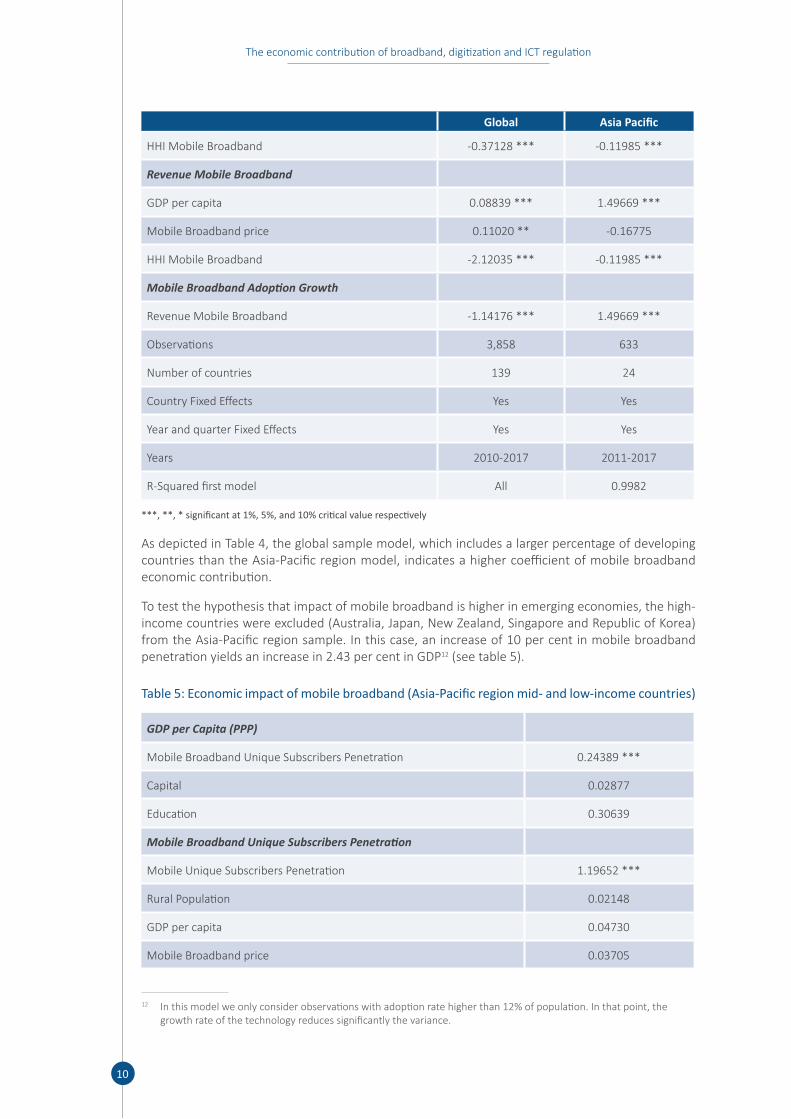
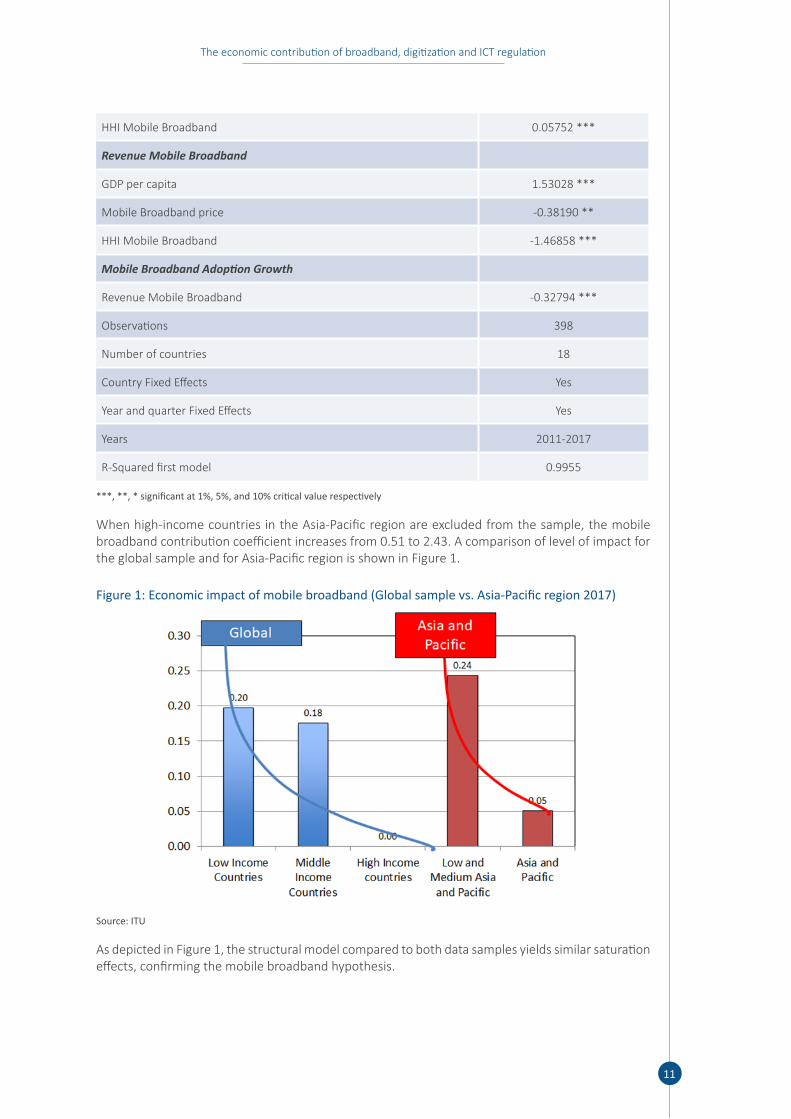
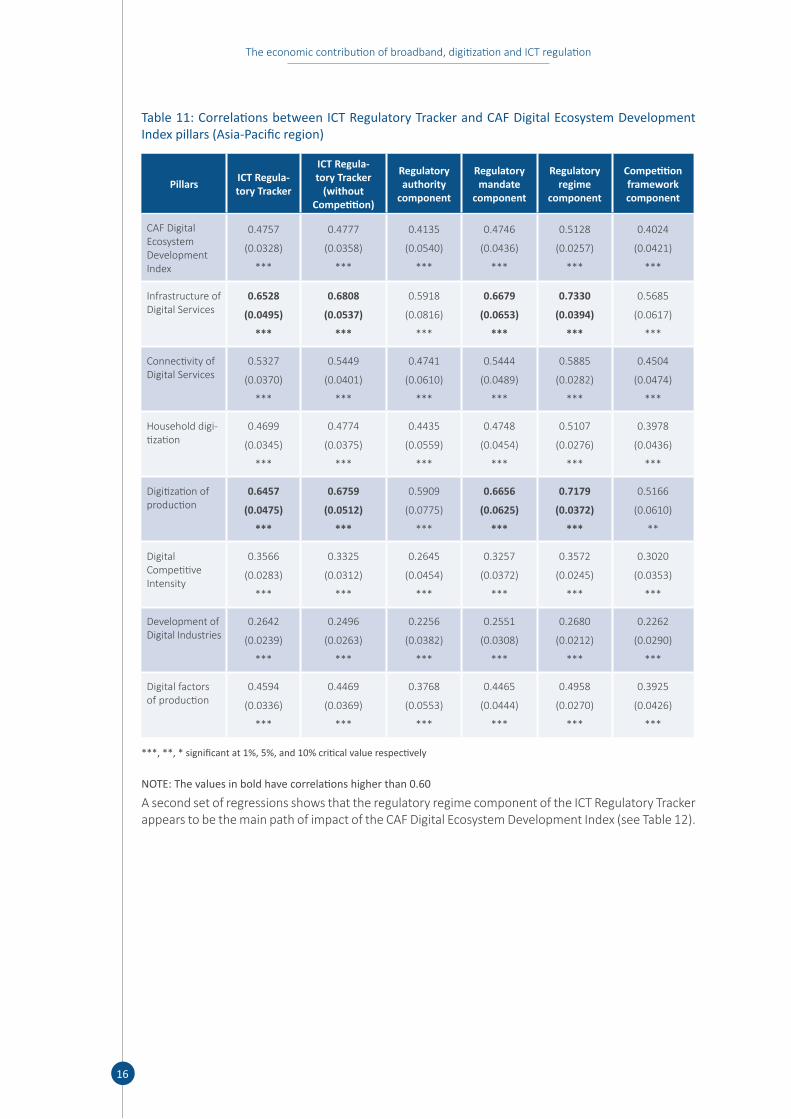
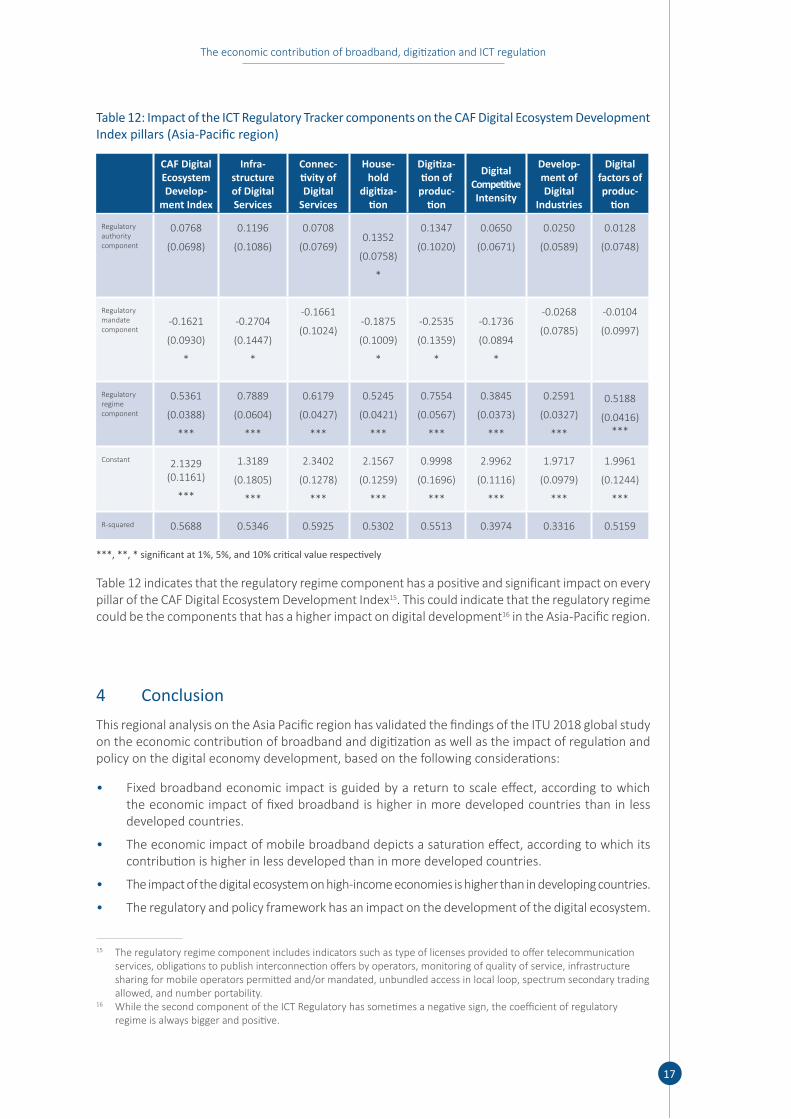
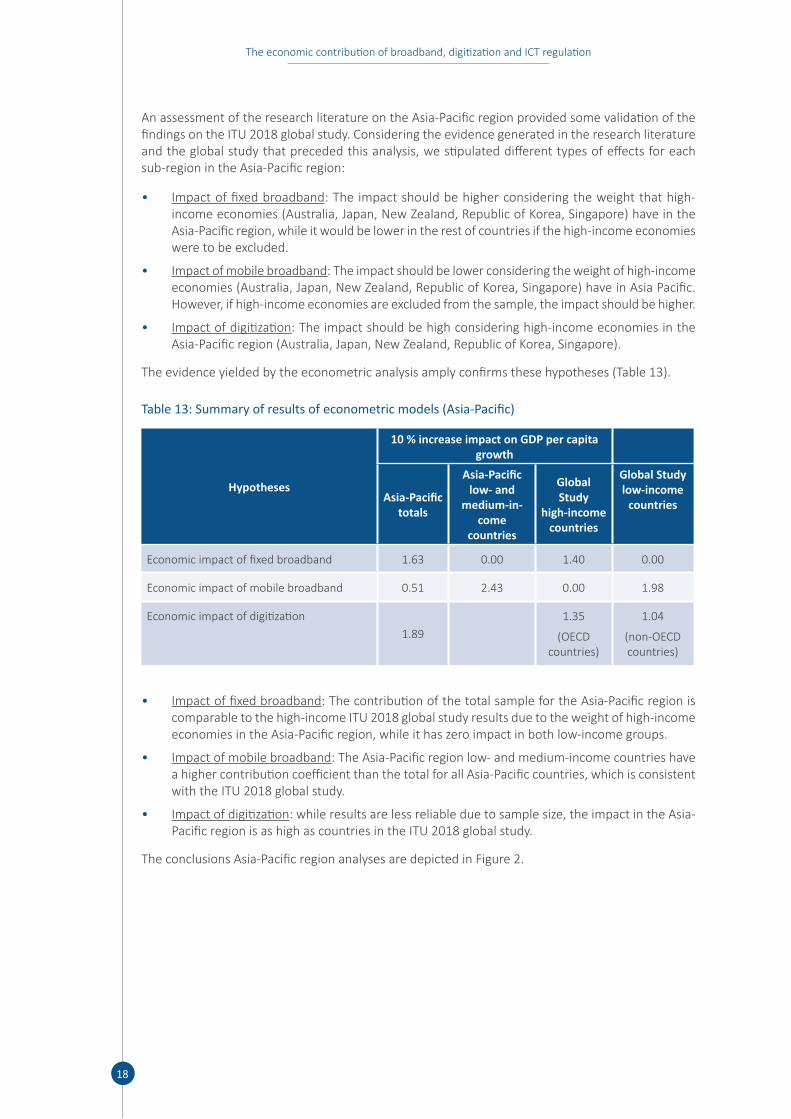
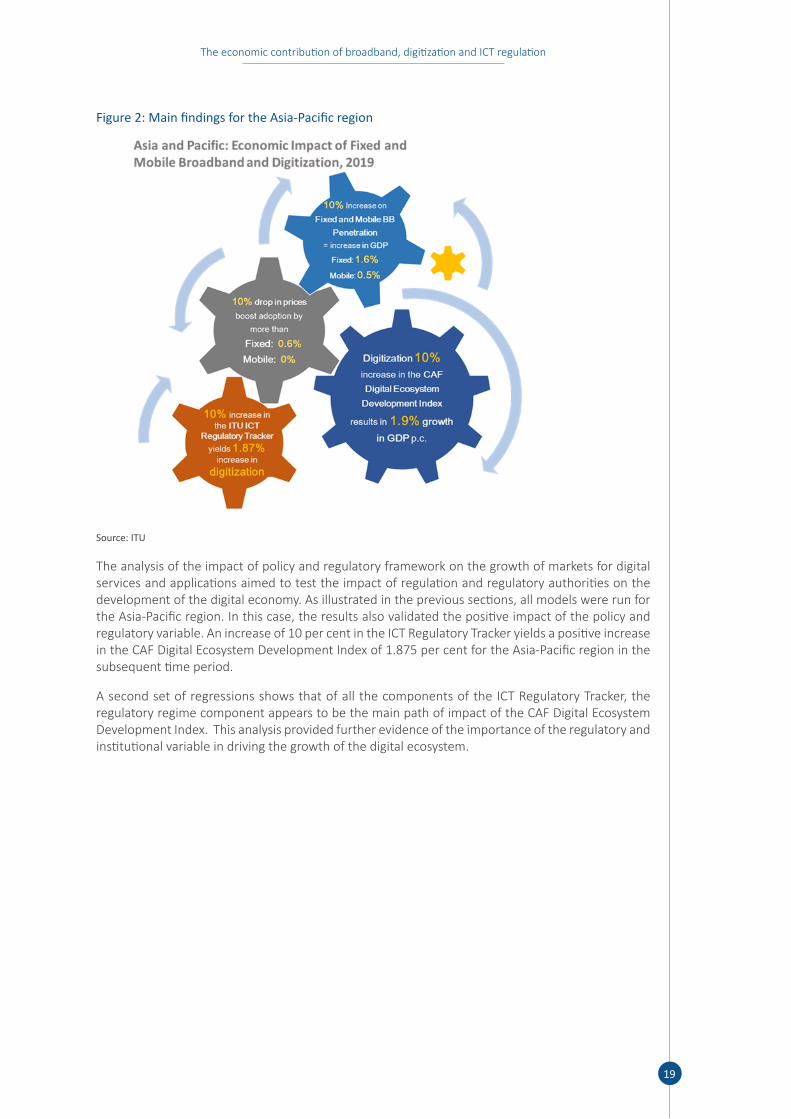
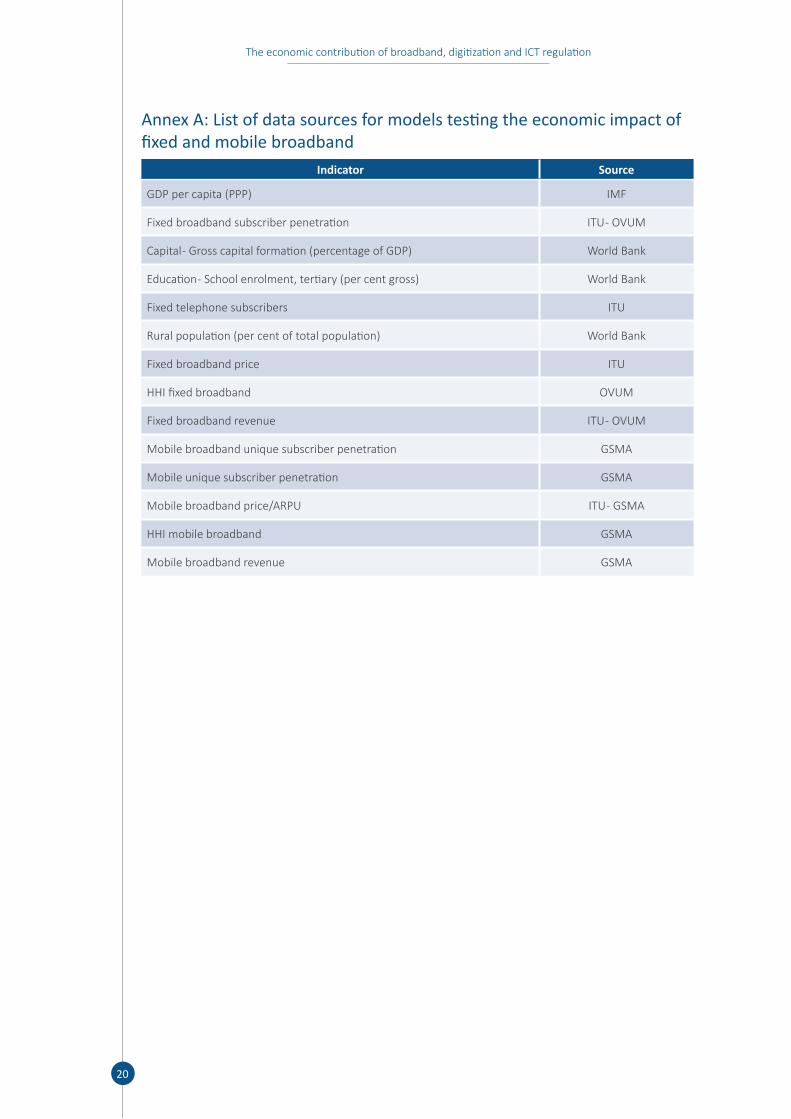
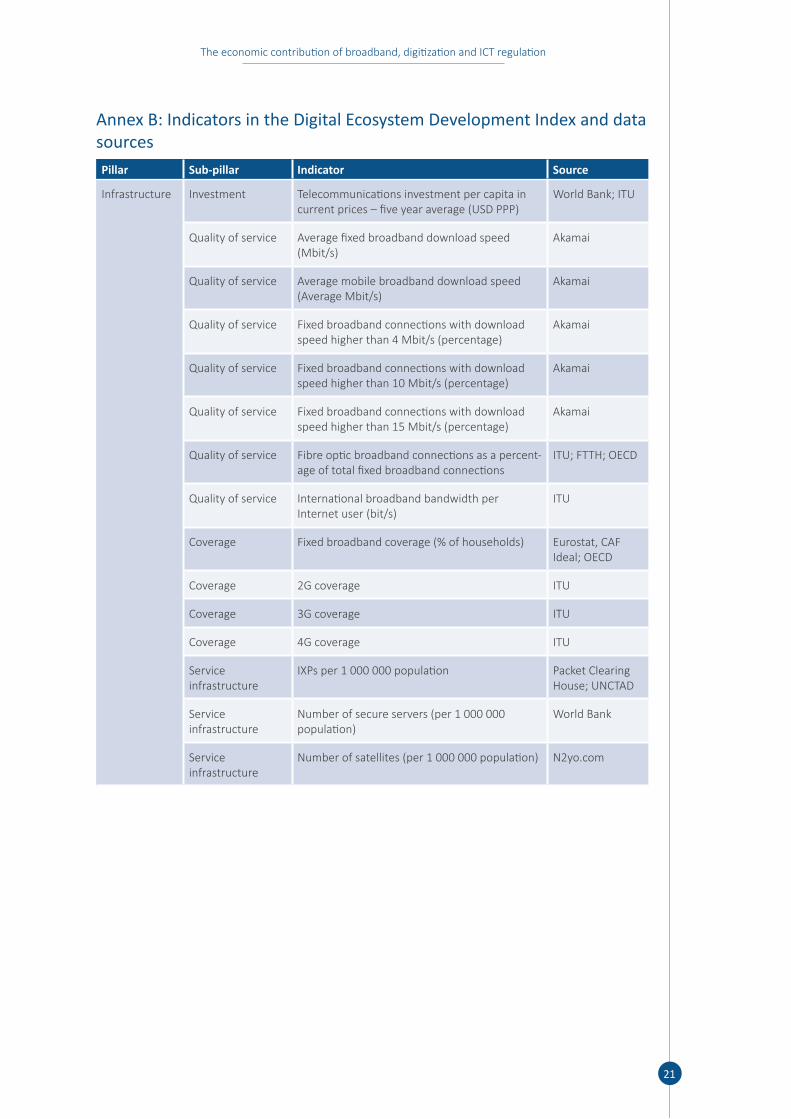
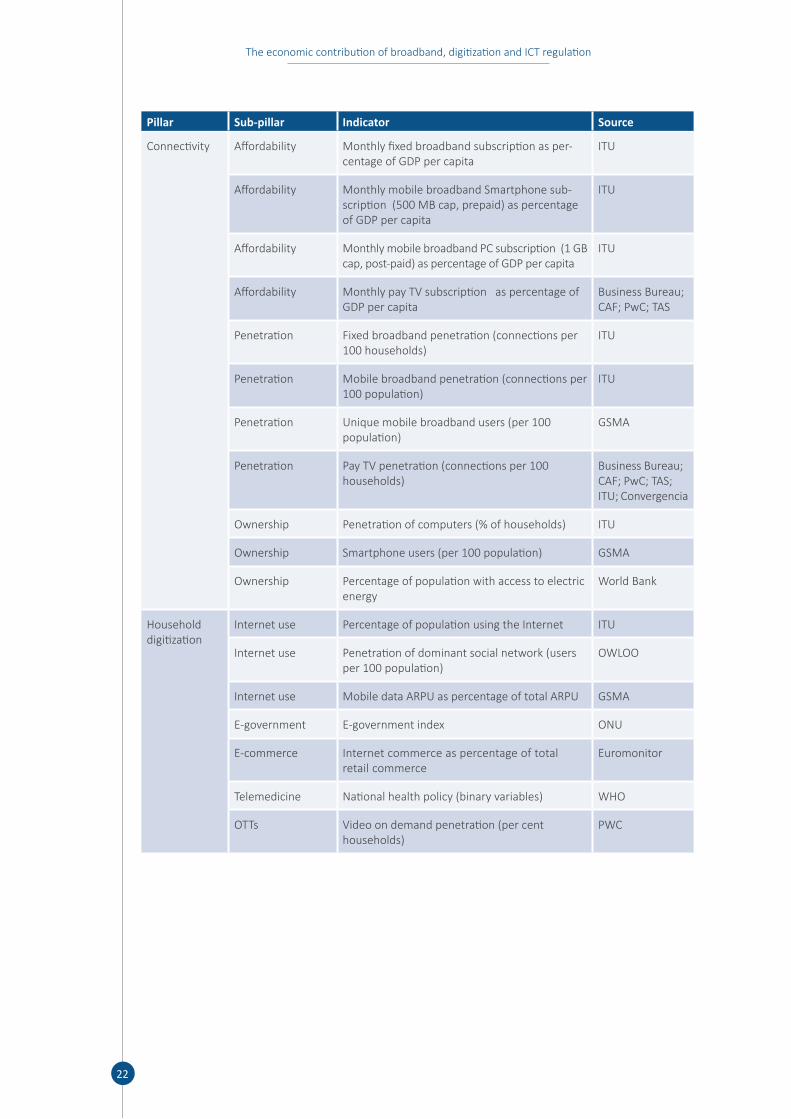
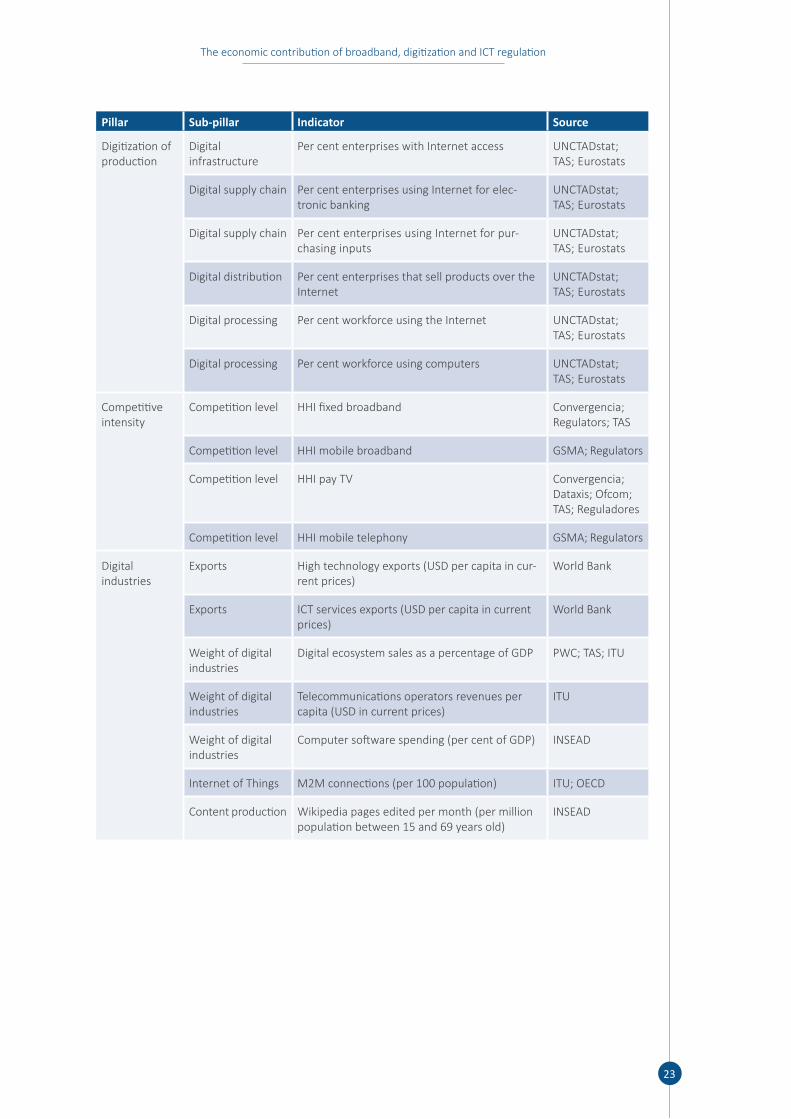
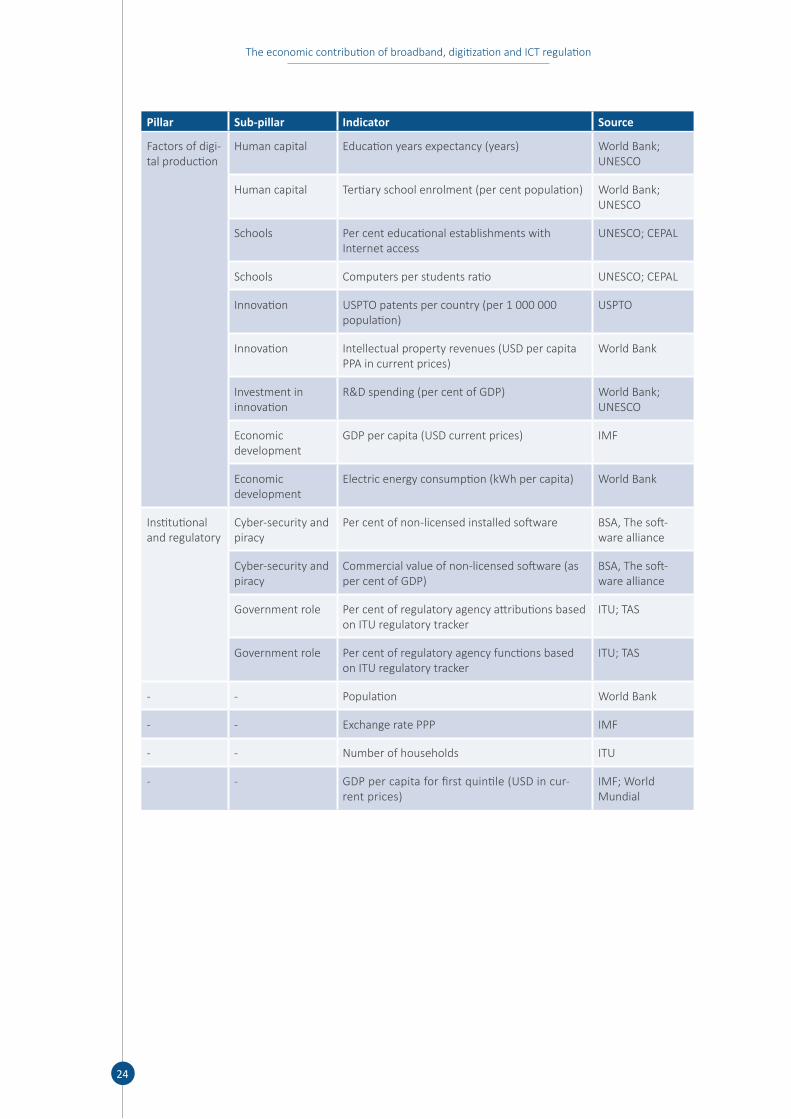