ecology, trade, and states in pre‐colonial … · fenske ecology, trade, and states in...
TRANSCRIPT
ECOLOGY, TRADE, AND STATES INPRE-COLONIAL AFRICA
James FenskeUniversity of Oxford
AbstractState capacity matters for growth. I test Bates’ explanation of pre-colonial African states. He arguesthat trade across ecological boundaries promoted states. I find that African societies in ecologicallydiverse environments had more centralized states. This is robust to reverse causation, omittedheterogeneity, and alternative interpretations of the link between diversity and states. The resultsurvives including non-African societies. I test mechanisms connecting trade to states, and find thattrade supported class stratification between rulers and ruled. I underscore the importance of ethnicinstitutions and inform our knowledge of the effects of trade on institutions. (JEL: N57, O10)
1. Introduction
States that can collect taxes, protect property, and sustain markets matter fordevelopment. It is not only modern states that matter; state antiquity predicts growthand stability in the present (Bockstette, Chanda, and Putterman 2002; Putterman andWeil 2010). Understanding state capacity, then, improves our knowledge of the causesof growth. The origins of state capacity have, however, received comparatively littleattention in the literature (Besley and Persson 2010). Explaining why strong statesexisted in the past in some regions but not others adds to our knowledge of statecapacity in the present and helps explain present-day income differences (Moav,Neeman, and Mayshar 2011; Gennaioli and Voth 2012). If the historical variablesthat predict past states are not well understood, their lingering effects in the presentmay be mis-attributed to other intermediate channels.
The editor in charge of this paper was Fabrizio Zilibotti.
Acknowledgments: I am grateful to Achyuta Adhvaryu, Robert Bates, William Beinart, PrashantBharadwaj, Rahul Deb, Nicola Gennaioli, Timothy Guinnane, Namrata Kala, Elias Papaioannou, AloysiusSiow, Christopher Udry, and Kelly Zhang for their comments. Many thanks to Stelios Michalopoulosand Nathan Sussman for generously sharing data with me. I am also thankful for feedback received inseminars at the University of Oxford, Hebrew University, Tel Aviv University, the Pacific Conference forDevelopment Economics, the University of Michigan, the Economic History Society Annual Meeting, andUniversitat Pompeu Fabra.
E-mail: [email protected] (Fenske)
Journal of the European Economic Association June 2014 12(3):612–640c� 2014 by the European Economic Association DOI: 10.1111/jeea.12042

Fenske Ecology, Trade, and States in Pre-colonial Africa 613
In this paper, I test a “Ricardian” theory of states in sub-Saharan Africa originallypresented by Bates (1983). Building on earlier views,1 he argues that long-distancetrade gave rise to states in Africa. His model is verbal:
[T]he contribution of the state is to provide order and peace and thereby to renderproduction and exchange possible for members of society. The origins of the state,then, lie in the welfare gains that can be reaped through the promotion of markets.
He suggests that gains from trade are greatest where products from one ecological zonecan be traded for products from another. It is near ecological boundaries, then, thatwe should expect to see states. To support his view, he takes 34 pre-colonial Africansocieties, and shows that the proportion of societies with central monarchs is greateron an ecological boundary.2
Bates’ view has been overlooked because his small sample and lack of controlsprevent him from making a credible econometric argument that this correlation iscausal. In this paper, I use ethnographic and geographic data to overcome this limitation.I merge data on state centralization for 440 ethnic groups in pre-colonial sub-SaharanAfrica with a map of African ecological zones. I use ethnic-level ecological diversityto proxy for the gains from trade. I show that ecological diversity is strongly relatedto the presence of pre-colonial states. For example, within the societies classified as“Equatorial Bantu”, the Luba score 0.69 on the diversity index and 3 out of 4 onthe centralization index. The Kela and Ndonko, by contrast, have no diversity and nocentralization. On the “Guinea Coast”, the Yoruba score 3 on centralization and 0.58on diversity, while the Yako score zero on both.
I show that this result is robust. I use spatial variation in rainfall as an instrumentalvariable, in order to control for possible reverse causation. The result survives additionalcontrols, checks for unobserved heterogeneity, alternative estimation strategies,removing influential observations, and alternative measures of trade and states. Ishow that the “Ricardian” view better explains the relationship between states anddiverse ecology than six alternative interpretations. These are: first, larger territoriesare more diverse and require more levels of administration; second, societies thatindependently develop states conquer trading regions; third, dense population in diverseregions explains statehood; fourth, defense of “islands” of land quality accounts forstates; fifth, the diversity of available economic activities creates states, and; sixth,competition between ethnic groups in more diverse areas leads to state formation. Irule out these alternative explanations by controlling for these mechanisms directly,by re-estimating the results using artificial countries of a uniform shape and size asthe unit of observation, and by presenting narrative evidence from the most influentialobservations in the data.
Unlike Bates, I am agnostic about whether it is long-distance or local tradethat matters most to state formation, and about whether trade gives rise to statesby increasing the returns to investment in public goods, by cheapening the cost of
1. For example, see Bisson 1982; Oliver and Fage 1962; Vansina 1966.
2. I present a condensed version of his results in the Online Appendix.

614 Journal of the European Economic Association
extending authority over space, or by making rulers more effective in public goodsprovision. The public goods provided by states can lower the costs of both inter-state and intra-state trade. In the Online Appendix, I present a simple model ofthe mechanisms by which trade may lead to state centralization. I find that classstratification is the channel best supported by the data, though trade is associated witha wide range of state functions.
Although I focus on Africa, I show that the relationship between diversity andstates holds even when non-African societies are included in the analysis. Whilemany historians of Europe link states to the growth of markets (e.g. Jones 1981),historians of Africa put particular emphasis on trade (Bates 1983). The importance ofecologically-driven trade in Africa is well documented in the historical literature (e.g.Lovejoy and Baier 1975). There is also particular institutional continuity in Africa.Traditional authorities were often co-opted by colonial states, and their successorspossess significant powers today (Acemoglu, Reed, and Robinson 2012; Mamdani1996). The historical territories of ethnic groups can be measured with more precisionin Africa than in many other areas. It is in Africa that empirical studies have establishedthe importance of these “ethnic” types of institutions.
1.1. Related Literature
My results contribute to our understanding of the origins of state capacity and of therelationship between trade and institutional quality.
State Capacity. A wealth of theories exist on the origins of the state, stressing factorssuch as the relative benefits of “stationary” versus “roving” bandits (Olson 1993), therelative benefits of different mechanisms for governing markets (Dixit 2004), conflict(Gennaioli and Voth 2012; Besley and Persson 2010), ease of taxation (Moav, Neeman,and Mayshar 2011), and past investments (Besley and Persson 2009). This literaturehas, however, focused overwhelmingly on institutions that exist in the present day orthose that were created in the circum-Mediterranean or in European colonies. Less isknown about the origins of states that have not been built by Europeans. Pre-colonialstates do, however, matter for contemporary African development (Gennaioli andRainer 2007; Michalopoulos and Papaioannou 2013). I provide evidence on the causesof institutions indigenous to Africa, linking them specifically to trade.
In addition, testing specific theories of state centralization informs policy. Each ofthe theories just mentioned suggests different mechanisms for improving state capacity.These need not be mutually exclusive: it is possible that both past investments andaccess to trade bolster the strength of contemporary states. Knowing which are thecauses that matter most, however, helps identify those that are the most urgent targetsfor policy.
Because my results distinguish this theory of state formation from severalalternatives, they help establish that the relationship between ethnic institutionsand present-day outcomes is causal. Bockstette, Chanda, and Putterman (2002), for
Fenske Ecology, Trade, and States in Pre-colonial Africa 615
example, suggest that historical states matter for reasons such as learning-by-doing andbureaucratic discipline that outlast the original motivation for state creation. If insteadthe determinants of historical states continue to have direct effects in the present,these conclusions will be unwarranted. Because African trade patterns have changeddramatically under colonial rule and again since independence, historical gains fromtrade can be used to instrument for ethnic institutions. I show that the main result fromMichalopoulos and Papaioannou (2013), in which historical states predict historicalluminosity, continues to hold when ecological diversity is used as an instrument forhistorical states.
Trade and Institutions. Historically, trade and institutions have co-evolved, withbetter rulers encouraging trade, and trade accentuating initial differences in institutionalquality (De Long and Shleifer 1993; Acemoglu, Johnson, and Robinson 2005). Asubstantial literature exists testing whether causation works in either direction, witha particular emphasis on the possible relationship between trade and democracy.Empirical results, however, are conflicting. The effects of trade on democracy maybe positive (Lopez-Cordova and Meissner 2005), negative (Rigobon and Rodrik2005), or negligible (Ahlquist and Wibbels 2012; Papaioannou and Siourounis 2008).The impact may depend on the timing of trade reforms (Giavazzi and Tabellini2005) or on the distribution of the gains from trade (Bruckner, Ciccone, and Tesei2012).
In this paper, I trace out the importance of trade for one specific institutionaloutcome—the centralization of African states—and find that trade increases statecapacity. Although I do not have data on the degree to which the central state wasdemocratic in my sample, I am able to show that gains from trade predict greater levelsof local democracy. Ethnic groups whose territories were more ecologically diversewere more likely to appoint local headmen through election or another form of formalconsensus.
In Section 2, I describe my econometric specification and sources of data. InSection 3, I present the baseline results. In Section 4, I demonstrate the robustness ofthese results. In Section 5, I give evidence that the six alternative stories mentionedpreviously do not explain the results. In Section 6, I present evidence that centralizedstates emerged from trade because it supported class differentiation, that no one typeof trade mattered most, and that ecological diversity can be used as an instrument forethnic institutions today. In Section 7, I conclude.
2. Data
To test whether the gains from trade due to ecological diversity predict the existenceof centralized states, I estimate the following equation on a sample of pre-colonialAfrican societies, using an ordered probit:
State centralizationi D ˛ C ˇ Gains from tradei C x0i� C �i : (1)

616 Journal of the European Economic Association
In this section, I explain my sources of data on state centralization, my ecologicalproxies for the gains from trade, and the controls that I include in xi . I cluster standarderrors by the ethnographic regions recorded in the sample.3
To measure African states, I take data from Murdock’s (1967) Ethnographic Atlas.This was originally published in 29 issues of Ethnology between 1962 and 1980.It contains data on 1,267 societies from around the world.4 From this source, I usevariable 33, “Jurisdictional Hierarchy Beyond Local Community” to measure statecentralization. This gives a discrete categorization between “No Levels” and “FourLevels”. The sample used for the analysis consists of the 440 sub-Saharan societiesfor which this variable is not missing.5 For comparison with Europe and Asia, theChekiang and Japanese score a 4 on this index, the Czechs and the Dutch score a 3,while the Lolo and Lapps each have no centralization. I do not have data on possiblesubstitutes for states, such as multi-ethnic federations that coordinate tax collection ortributary relationships across ethnic groups.
As far as I am aware, no data exist on pre-colonial African trade that could allowcomparison of a large number of societies. My approach is to use geographic proxiesfor the capacity to trade. I follow Bates (1983) in assuming that the ability to tradeacross ecological zones creates gains from trade. I use White’s (1983) vegetation mapof Africa to identify these regions.6 This classifies African vegetation into 18 majortypes, which I plot in the Online Appendix.7 I use three measures of the ecologically-driven gains from trade: ecological diversity, distance from an ecological boundary,and ecological polarization. I merge these measures with the Ethnographic Atlasusing Murdock’s (1959) map of African ethnic groups.8 This has also been used byMichalopoulos and Papaioannou (2011, 2013) and in several papers by Nathan Nunn.A similar approach for North America has been employed by Dippel (2011).
In Section 4, I supplement this with historical and anthropological evidence fromsix African societies.9 In each, the exchange of products across ecological zones wassignificant. My only other measure of pre-colonial trade is a map of trade routes from
3. These are: African Hunters, South African Bantu, Central Bantu, Northeast Bantu, Equatorial Bantu,Guinea Coast, Western Sudan, Nigerian Plateau, Eastern Sudan, Upper Nile, Ethiopia/Horn, MoslemSudan, and Indian Ocean.
4. In particular, I use the revised Atlas posted online by J. Patrick Gray at http://eclectic.ss.uci.edu/˜drwhite/worldcul/EthnographicAtlasWCRevisedByWorldCultures.sav.
5. It is probable that stateless societies are more likely to be missing from these data. This will only biasthe results if they are more likely to be missing in ecologically diverse regions.
6. This is available at http://www.grid.unep.ch/data/download/gnv031.zip.
7. Altimontaine, anthropic, azonal, bushland and thicket, bushland and thicket mosaic, cape shrubland,desert, edaphic grassland mosaic, forest, forest transition and mosaic, grassland, grassy shrubland,secondary wooded grassland, semi-desert, transitional scrubland, water, woodland, woodland mosaicsand transitions.
8. This is available on Nathan Nunn’s website. While most groups are matched directly by name, somerequire an alternative spelling, an alternative name, linkage to a supergroup or subgroup, or joining to anethnic group in roughly the same location. A table of these matches is in the Online Appendix.
9. It is possible that gains from trade could arise from other forms of geographic heterogeneity.Empirically, ecological diversity performs best. I have found no positive effect of other indices, such

Fenske Ecology, Trade, and States in Pre-colonial Africa 617
Brice and Kennedy (2001). I show in Section 6 that these predict states. I do not makethem a focus of this paper, as their placement is potentially endogenous.10
Though Bates (1983) focuses on long-distance trade, internal trade may alsofacilitate states. A state may protect intra-ethnic trade, but it may also facilitate tradebetween polities occupying two separate, internally homogenous regions. In Section 6,I show that the data cannot ultimately disentangle whether it is local trade or long-distance trade that matters most. Thus, I construct indices of the gains from both localand long-distance trade.
The principal measure that I use of gains from trade is ecological diversity. Icalculate the share st
i of each society i’s area that is occupied by each ecologicaltype t . Ecological diversity is a Herfindahl index constructed from these shares:
Ecological diversityi D 1 �tD18XtD1
�st
i
�2: (2)
This captures the opportunities for trade that exist within an ethnic group’sterritory—the gains from internal trade.
The second index that I use measures ecological polarization. This is alsoconstructed from the vegetation shares:
Ecological polarizationi D 1 �tD18XtD1
�0:5 � st
i
0:5
�2
sti : (3)
This measures the degree to which a society approximates a territory in whichtwo vegetation types each occupy half its area. Similar measures have been used forethnicity (Montalvo and Reynal-Querol 2005). This also captures gains from internaltrade. If increasing returns to scale exist in production or trade, trade may be mostprofitable if a society is evenly divided into two ecological zones. This would maximizethe polarization index.
The third index that I use is distance from an ecological boundary. I use the White(1983) map to compute the average distance (in decimal degrees) of all points ina group’s territory from the nearest boundary between two ecological regions. Thiscaptures gains from external trade, since the boundary may lie outside the ethnic group.Because a society that is intersected by a boundary will also be ecologically diverse,the measures of internal and external trade will be positively correlated. Distancefrom a boundary does, however, predict states even in the sub-sample of ecologicallyhomogeneous societies.
as ruggedness or a Theil index of land quality on states. Area under water in White (1983) indicates riversand lakes: this has a negative impact on statehood if included with the baseline set of controls. Mangrovesand coastal areas are classified as “azonal”, and have no effect. The difference in land quality betweenthe most fertile and least fertile points in an ethnic group’s territory does predict states, but this is given adifferent interpretation in Section 4.
10. See Michalopoulos, Naghavi, and Prarolo (2010). This map includes mostly routes across the Saharaor connecting Lake Victoria to the coast. These are not correlated with ecological diversity.

618 Journal of the European Economic Association
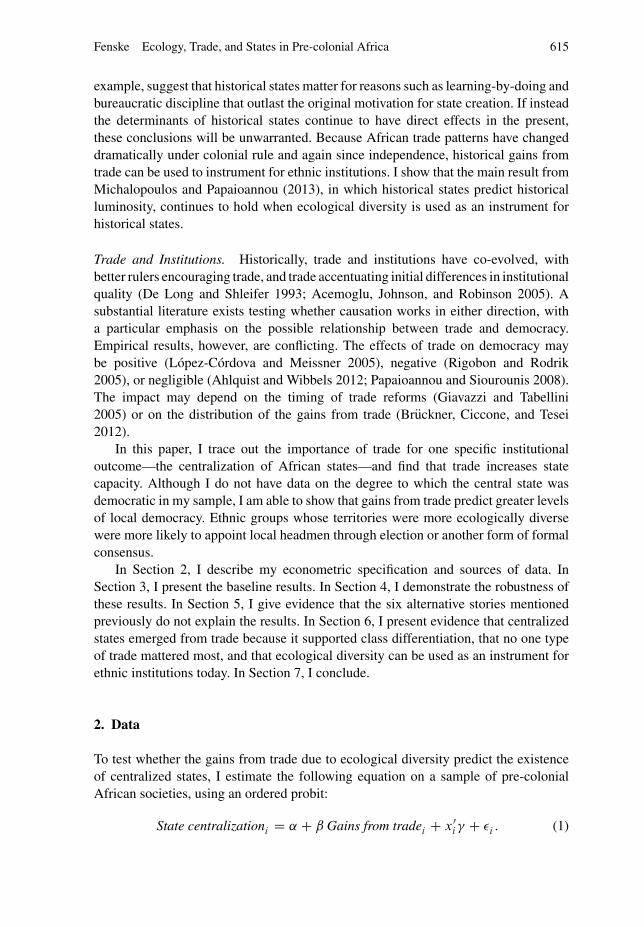
FIGURE 1. State centralization and ecological diversity. States, on the left, are from Murdock (1967).Darker regions have more centralized states. Ecological diversity, on the right, is computed usingWhite (1983). Darker regions are more ecologically diverse.
I present maps of state centralization and ecological diversity in Figure 1.11 Themost centralized African states are clustered along an east–west line between theSahara and West African forest, in the microclimates of the Ethiopian highlands, alongthe barrier between the equatorial rainforest and the East and Central African woodlandmosaics, and on the divide between grassland and woodland in the continent’ssoutheastern corner.
I join several other geographic variables to the data on ecology and states usingthe Murdock (1959) map of Africa. I include these in xi as controls. Except whereI note otherwise, I take data stored in raster format, and for each society I computethe average value of the points within its territory.12 In particular, I control for thepresence of a major river, agricultural constraints (an inverse measure of land quality),distance from the coast, elevation, suitability for malaria, precipitation, ruggedness,temperature, distance from Lake Victoria, date of observation, crop type dummies, anddistance from the Atlantic and Indian Ocean slave trades. These variables are describedin more detail in the Online Appendix. Summary statistics are given in Table 1.
11. The base map of ethnic groups is available on Nathan Nunn’s website. While most ethnic groups canbe matched to this map directly by name, some require an alternative spelling, an alternative name, linkageto a supergroup, or subgroup, or joining to an ethnic group in roughly the same location. A table of thesematches is included in the Online Appendix.
12. Raster data taken from the following sources: Ag. constraints, http://www.iiasa.ac.at/Research/LUC/SAEZ/index.html, plate 28; Elevation, http://epp.eurostat.ec.europa.eu/; Malaria, http://www.mara.org.za/lite/download.htm; Precipitation, http://www.iiasa.ac.at/Research/LUC/SAEZ/index.html,plate 1; Temperature, http://www.iiasa.ac.at/Research/LUC/SAEZ/index.html, plate 6; Ruggedness,http://diegopuga.org/data/rugged/.

Fenske Ecology, Trade, and States in Pre-colonial Africa 619
TABLE 1. Summary statistics.
(1) (2) (3) (4) (5)Mean S.D. Min Max N
Outcomes
State centralization 1.15 0.93 0 4 440Any centralization 0.73 0.44 0 1 440Local state 2.91 0.68 2 4 439Class stratification 1.25 1.41 0 4 364Headman appointed 0.066 0.25 0 1 320Light density 1.50 0.18 1.15 3.34 440Local authority: Democratic 0.081 0.27 0 1 320
Gains from trade
Ecological diversity 0.30 0.23 0 0.80 440Eco. Div. (FAO) 0.47 0.23 0 0.80 440Ecological polarization 0.51 0.38 0 1.00 440Dist. ecological boundary 0.45 0.53 0.019 2.95 440Any diversity 0.78 0.42 0 1 440Salt 0.42 0.88 0 6 440Gold production 0.34 1.86 0 24 440Iron production 0.12 0.33 0 1 440% dep. on fishing 8.32 10.9 0 70 440
Controls
Log area 0.16 1.29 �11.7 3.29 440Major river 0.23 0.42 0 1 440Ag. constraints 5.41 1.06 2.94 8.92 440Dist. coast 5.54 3.76 0 14.9 440Elevation 728 520 �7.41 2,308 440Malaria 0.83 0.27 0 1 440Precipitation 846 468 0 2,474 440Ruggedness 71,792 70,413 0 421,381 440Temperature 8,882 1,112 5,295 10,699 440Dist. L. Victoria 2,198 1,438 131 5,708 440Date observed 1,919 21.6 1,830 1,960 440Dist. Atlantic ST 6,688 1,515 3,671 9,949 440Dist. Indian ST 4,546 1,589 1,028 7,953 440Dist. Saharan ST 3,333 975 806 6,999 440Dist. Red ST 2,887 1,360 107 5,773 440Crop: None 0.025 0.16 0 1 440Crop: Trees 0.084 0.28 0 1 440Crop: Roots/tubers 0.19 0.39 0 1 440
Other variables used
Log rainfall range 5.18 1.01 1.39 7.42 370Area 2.43 3.64 8.2e-06 27.0 440Pop. density 22.2 28.5 0 311 440Ag. constraints range 4.66 1.95 0 9 440Subsistence diversity 0.52 0.12 0.13 0.74 440
These data are admittedly anachronistic—the institutional variables are recorded atan earlier date than the geographic controls and the measure of ecological diversity.Because these variables are slow to change, this should only add measurement errorto the analysis.

620 Journal of the European Economic Association
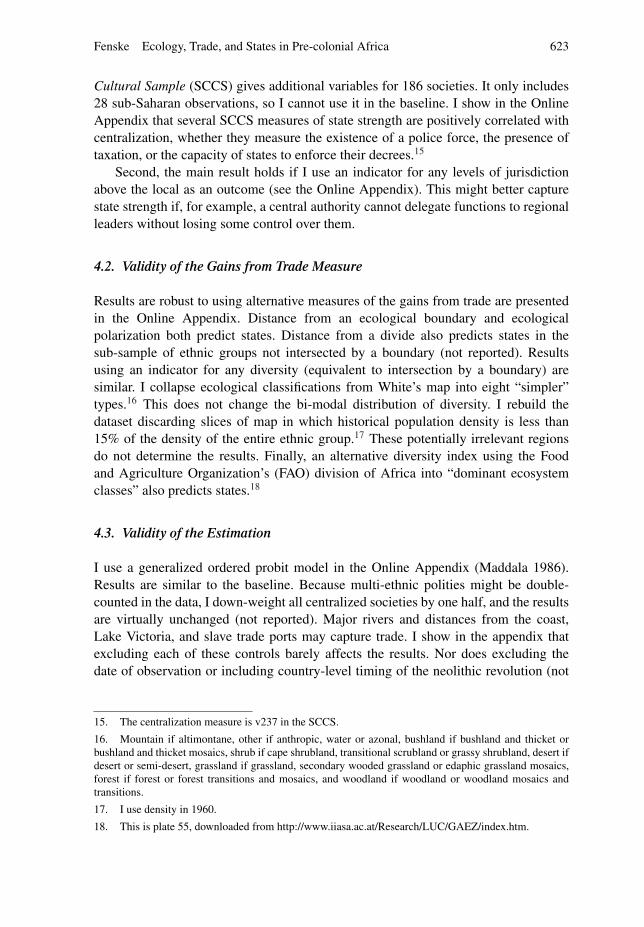
FIGURE 2. State centralization above and below median diversity. The dark bars are for ecologicaldiversity above the median, the light bars for ecological diversity below it.
3. Results
I begin by showing the unconditional relationship between gains from trade and statecentralization. In Figure 2, I cut the sample into societies above and below medianecological diversity. For each, I show the relative frequencies of states of each levelof centralization. Below the median (the lighter bars), it is more common for societiesto have no levels of centralization, or only one level. Above the median, there is agreater prevalence of societies with two or three levels. As ecological variation rises,the distribution of state centralization shifts to the right.
Table 2 presents estimates of ˇ. I report the full set of coefficient estimates inthe Online Appendix, omitting them here for space. In column (1), only the measureof ecological diversity is included. Ecological diversity has a significant and positivecorrelation with state centralization. This is robust to the inclusion of additional controlsin column (2). In column (3), I add fixed effects for the major regions of Africa byUN classifications. These are intended to account for the role of large differences inculture and geography. This has almost no impact on the results.
Few of the additional controls are significant. Some important exceptions are nomajor crop (negative) and roots and tubers (positive). The negative effect of no majorcrop suggests that it is difficult to form a state without an agrarian base. The positiveeffect of roots and tubers is likely capturing unobservable features of forest-zone Bantusocieties that better enabled them to create states.
Is the effect of ecological diversity large? In Table 2, I report marginal effects.The impact of a one unit change in ecological diversity is to reduce the probability

Fenske Ecology, Trade, and States in Pre-colonial Africa 621
TA
BL
E2.
Eco
logi
cald
iver
sity
pred
icts
stat
es.
Stat
ece
ntra
liza
tion
Sub-
Saha
ran
Afr
ica
Who
lew
orld
(1)
(2)
(3)
(4)
Eco
logi
cald
iver
sity
0.79
4���
0.48
4��0.
442��
0.44
6��(0
.266
)(0
.207
)(0
.192
)(0
.184
)E
co.D
iv.(
FAO
)O
ther
cont
rols
No
Yes
Yes
Yes
UN
regi
onFE
No
No
Yes
Obs
erva
tions
440
440
440
1,07
7Ps
eudo
R-s
quar
ed0.
0111
0.07
240.
0809
0.17
1
Mar
gina
leffe
cts
Con
tinu
ous
>m
edia
nC
onti
nuou
s>
med
ian
Con
tinu
ous
>m
edia
nC
onti
nuou
s>
med
ian
0le
vels
�0.2
59��
��0
.108
���
�0.1
51��
�0.0
65��
��0
.137
���0
.060
���
�0.1
77��
�0.0
50(0
.087
)(0
.033
)(0
.065
)(0
.024
)(0
.058
)(0
.022
)(0
.073
)(0
.035
)1
leve
l�0
.022
�0.0
09�0
.016
�0.0
07�0
.015
�0.0
070.
065��
0.01
8(0
.038
)(0
.016
)(0
.019
)(0
.008
)(0
.016
)(0
.007
)(0
.029
)(0
.013
)2
leve
ls0.
152��
�0.
063��
�0.
103��
0.04
5���
0.09
5��0.
042��
�0.
071��
0.02
0(0
.052
)(0
.019
)(0
.045
)(0
.016
)(0
.041
)(0
.015
)(0
.030
)(0
.014
)3
leve
ls0.
118��
�0.
050��
�0.
062��
0.02
7��0.
054��
0.02
4���
0.03
5��0.
010
(0.0
44)
(0.0
18)
(0.0
27)
(0.0
11)
(0.0
24)
(0.0
09)
(0.0
15)
(0.0
07)
4le
vels
0.01
00.
004
0.00
30.
001
0.00
20.
001
0.00
6��0.
002
(0.0
08)
(0.0
03)
(0.0
03)
(0.0
01)
(0.0
02)
(0.0
01)
(0.0
03)
(0.0
01)
Not
es:
Reg
ress
ions
estim
ated
byor
dere
dpr
obit.
Stan
dard
erro
rsin
pare
nthe
ses
clus
tere
dby
regi
on.C
oeffi
cien
tes
timat
esw
here
ecol
ogic
aldi
vers
ityis
repl
aced
with
an“a
bove
med
ian”
indi
cato
rar
eno
trep
orte
d.O
ther
cont
rols
inco
lum
ns(1
),(2
)an
d(3
)ar
elo
gar
ea,m
ajor
rive
r,ag
ricu
ltura
lcon
stra
ints
,dis
tanc
eto
coas
t,el
evat
ion,
mal
aria
,pre
cipi
tatio
n,ru
gged
ness
,te
mpe
ratu
re,
dist
ance
toL
ake
Vic
tori
a,di
stan
cefr
omth
eA
tlant
ican
dIn
dian
Oce
ansl
ave
trad
es,
and
dum
mie
sfo
rcr
opty
pe,
unle
ssot
herw
ise
spec
ified
.O
ther
cont
rols
inco
lum
n(4
)ar
elo
gar
ea,l
and
qual
ity,d
ista
nce
from
coas
t,el
evat
ion,
mal
aria
,rai
nfal
l,te
mpe
ratu
re,d
ate,
crop
dum
mie
s,m
ajor
rive
r,ru
gged
ness
,and
abso
lute
latit
ude.
��
�Si
gnifi
cant
at1%
;��
sign
ifica
ntat
5%.

622 Journal of the European Economic Association
of having no centralization by roughly 14–26 percentage points. The probabilities ofhaving two or three levels increase to match this. Ecological diversity has a bimodaldistribution; societies are clustered around peaks of zero diversity and roughly 0.5 (seethe Online Appendix). If an ecologically homogeneous society such as the Tallensi orthe Yako were to be and placed in a more typically diverse region, such as that of theFur (0.496) or Wolof (0.506), the probability of any centralization would rise roughly7 to 13 percentage points. Mirroring this thought experiment, I replace the ecologicaldiversity measure with an indicator for being above median diversity. The marginaleffect, in Table 2, is between 6 and 11 percentage points.
The pseudo-R2 statistics, by contrast, are low. While the effect of diversity issizable, the controls here cannot explain more than 10% of the variation in Africanstates. The estimation without controls correctly predicts the level of centralizationfor 42% of the sample, barely an improvement over selecting the mode. Addingcontrols raises this to only 45%. Although the bulk of pre-colonial state centralizationin Africa remains to be explained (Osafo-Kwaako and Robinson 2013), the impact ofecologically-driven gains from trade is robust and economically significant.
I also use Table 2 to show that the results can be expanded to cover the rest of theworld. On a sample of more than 1,000 global societies, ecological diversity continuesto predict the existence of states.13 I conduct as many of the robustness checks aspossible in this global sample that I do for the sub-Saharan sample in Sections 4–6. Results are reported in the Online Appendix.14 These “whole world” results areless robust than those specific to sub-Saharan Africa. Consistent with the historicalliterature, this suggests that access to ecologically-driven trade has been of particularimportance for African states.
4. Robustness
4.1. Validity of the State Centralization Measure
I take two approaches to validate the state centralization measure. First, it is stronglycorrelated with alternative measures of states. Bockstette, Chanda, and Putterman(2002) and Chanda and Putterman (2007) report a country-level index of historicalstate strength for the period 1850–1900, which just precedes colonial rule for mostAfrican societies. The state centralization index has been aggregated to the countrylevel by Gennaioli and Rainer (2007). For 41 countries, I have both measures. Theircorrelation is positive and significant at the 1% level. Similarly, the Standard Cross
13. This sample has been created for Fenske (2012). Details on these are given in the web appendix forthat paper.
14. Some tests cannot be carried out on the global sample due to data availability. I do not have historicaltrade routes, pre-colonial cities, or salt production outside of Africa. Because the global diversity measureis constructed using raster data that uses different classifications than White (1983), I cannot computedistance from an ecological boundary, construct simpler ecological classes, or measure diversity withinartificial ethnic groups in the global sample.
Fenske Ecology, Trade, and States in Pre-colonial Africa 623
Cultural Sample (SCCS) gives additional variables for 186 societies. It only includes28 sub-Saharan observations, so I cannot use it in the baseline. I show in the OnlineAppendix that several SCCS measures of state strength are positively correlated withcentralization, whether they measure the existence of a police force, the presence oftaxation, or the capacity of states to enforce their decrees.15
Second, the main result holds if I use an indicator for any levels of jurisdictionabove the local as an outcome (see the Online Appendix). This might better capturestate strength if, for example, a central authority cannot delegate functions to regionalleaders without losing some control over them.
4.2. Validity of the Gains from Trade Measure
Results are robust to using alternative measures of the gains from trade are presentedin the Online Appendix. Distance from an ecological boundary and ecologicalpolarization both predict states. Distance from a divide also predicts states in thesub-sample of ethnic groups not intersected by a boundary (not reported). Resultsusing an indicator for any diversity (equivalent to intersection by a boundary) aresimilar. I collapse ecological classifications from White’s map into eight “simpler”types.16 This does not change the bi-modal distribution of diversity. I rebuild thedataset discarding slices of map in which historical population density is less than15% of the density of the entire ethnic group.17 These potentially irrelevant regionsdo not determine the results. Finally, an alternative diversity index using the Foodand Agriculture Organization’s (FAO) division of Africa into “dominant ecosystemclasses” also predicts states.18
4.3. Validity of the Estimation
I use a generalized ordered probit model in the Online Appendix (Maddala 1986).Results are similar to the baseline. Because multi-ethnic polities might be double-counted in the data, I down-weight all centralized societies by one half, and the resultsare virtually unchanged (not reported). Major rivers and distances from the coast,Lake Victoria, and slave trade ports may capture trade. I show in the appendix thatexcluding each of these controls barely affects the results. Nor does excluding thedate of observation or including country-level timing of the neolithic revolution (not
15. The centralization measure is v237 in the SCCS.
16. Mountain if altimontane, other if anthropic, water or azonal, bushland if bushland and thicket orbushland and thicket mosaics, shrub if cape shrubland, transitional scrubland or grassy shrubland, desert ifdesert or semi-desert, grassland if grassland, secondary wooded grassland or edaphic grassland mosaics,forest if forest or forest transitions and mosaics, and woodland if woodland or woodland mosaics andtransitions.
17. I use density in 1960.
18. This is plate 55, downloaded from http://www.iiasa.ac.at/Research/LUC/GAEZ/index.htm.
624 Journal of the European Economic Association
reported).19 In the Online Appendix, I discard influential observations. I also drop eachof the “South African bantu”, “Ethiopia/horn”, “Moslem sudan” and “Indian Ocean” inturn, as these are the regions in which most states are concentrated. I also exclude non-agricultural societies, societies with animal husbandry, and the desert fringe. These donot drive the results. The main sample includes only sub-Saharan Africa; results aresimilar using the whole continent (not reported).
4.4. Possible Reverse Causation
To control for the possibility that states may shape their environment, I use variationover space (not time) in rainfall to instrument for ecological diversity.20 I use the logof the rainfall range as an instrument, where:
Log rainfall rangei D ln�1 C �
rainmaxi � rainmin
i
��: (4)
Here, rainmaxi and rainmin
i are the values of the raster points with the most and leastprecipitation for society i . The natural log improves fit. This cannot be computed forsocieties too small to have at least two raster points. Results are robust to assigning thesesocieties a log rainfall range of zero. In addition to controlling for reverse causation,these estimates will correct measurement error in ecological diversity—error that maybe both physical (if the underlying data on vegetation types is coarse or imprecise) andconceptual (if a Herfindahl index is an imperfect measure of the ecologically-drivengains from trade).
Results (including the reduced-form and first stage) are in Table 3. The IVestimates are larger than the ordinary least squares (OLS) estimates. Measurementerror in ecological diversity is a plausible explanation, since vegetation classesare subjective and have imprecise boundaries. Further, ecological diversity may becorrelated with unobservable variables that hinder states. Where ecological boundariesabut agriculturally marginal areas such as deserts and mangrove swamps, states mayhave less agricultural surplus to tax.
4.5. Possible Omitted Heterogeneity
I show that results are robust to six general approaches towards omitted heterogeneityin the Online Appendix. First, I add area shares st
i of each ecological type as additionalcontrols. Second, I include a cubic in latitude and longitude with full interactions,allowing unobservables to vary smoothly across space. Third, I adjust for spatialautocorrelation by including the spatially-weighted observable characteristics of a
19. Data are from Louis Putterman’s website.
20. Variation over time is unlikely to predict ecological diversity, which is variation across space invegetation. Further, fluctuations in rainfall over time may lead to conflict (Miguel, Satyanath, and Sergenti2004), which could directly affect state formation.

Fenske Ecology, Trade, and States in Pre-colonial Africa 625
TABLE 3. The main result is robust to reverse causation.
State centralization
OLS: Baseline IV
(1) (2) (3) (4)
Ecological diversity 0.358�� 0.440�� 1.998� 2.875�
(0.147) (0.203) (1.124) (1.689)Other controls Yes Yes Yes YesObservations 440 370 440 370F -statistic 48.98 7.979
OLS: Reduced form OLS: First StageState centralization Ecological diversity
(5) (6) (7) (8)
Log rainfall range 0.058�� 0.136� 0.029��� 0.047���
(0.027) (0.079) (0.004) (0.016)Other controls Yes Yes Yes YesObservations 440 370 440 370
Notes: Standard errors in parentheses clustered by region. Other controls are log area, major river, agriculturalconstraints, distance to coast, elevation, malaria, precipitation, ruggedness, temperature, distance to Lake Victoria,distance from the Atlantic and Indian Ocean slave trades, and dummies for crop type, unless otherwise specified.The excluded instrument is the log rainfall range. In columns (3), (5), and (7), missing values of the log rainfallrange are recoded to zero. In columns (2), (4), (6), and (8), these observations are excluded. ���Significant at1%; ��significant at 5%; �significant at 10%.
society’s neighbors as controls, and estimating Conley’s OLS with standard errorscorrected for spatial dependence with cutoffs of five decimal degrees.21 I do not useConley’s estimator in the baseline because the dependent variable is ordinal. I insteadcluster standard errors by ethnographic region in the baseline.
Fourth, I interact de-meaned controls with ecological diversity (Wooldridge 2002).Fifth, I compute Altonji–Elder–Taber statistics.22 Finally, I use fixed effects in lieuof controls. In successive columns, I control for ethnographic region, United Nationsregion,23 country,24 and language family.25 I do not use these in the baseline because
21. I select the spatial adjacency matrix W so that all societies whose centroids are within ten decimaldegrees of each other are given a weight inversely proportionate to their distance from each other.
22. Replicating the main regression using OLS, I obtain the estimated coefficient on ecological diversityO1
and the estimated variance of the residuals OV1. Regressing state centralization on the controls, I obtain the
predicted values xb and the estimated variance of the residuals OV2. Regressing ecological diversity on xb,
I obtain the coefficient estimate O2. Altonji, Elder, and Taber (2005) suggest that if . O
1OV2/=. O
2OV1/ > 1,
it is unlikely that unobservables will explain away the result of interest.
23. I make the following assignments. Southern Africa: African Hunters, South African Bantu. WesternAfrica: Guinea Coast, Western Sudan, Nigerian Plateau, Moslem Sudan. Central Africa: Central Bantu,Equatorial Bantu, Eastern Sudan. Eastern Africa: Northeast Bantu, Upper Nile, Ethiopia and Horn, IndianOcean.
24. I assign each ethnic group to the country into which the largest slice of its territory falls.
25. This is constructed from variables 98 and 99 in the Ethnographic Atlas.
626 Journal of the European Economic Association
they will exacerbate measurement error. In an OLS regression, ethnographic regiondummies explain 19% of the variance in state centralization and 25% of the variancein ecological diversity.
5. Alternative Interpretations
The Ricardian view of African states better fits the data than six alternativeinterpretations of the link between ecological diversity and states. Some of theseare complements, rather than rivals, to the Ricardian view. Still, they do not fullyaccount for the relationship between ecology and states.
5.1. Larger Areas are more Diverse and Require Centralized Administration
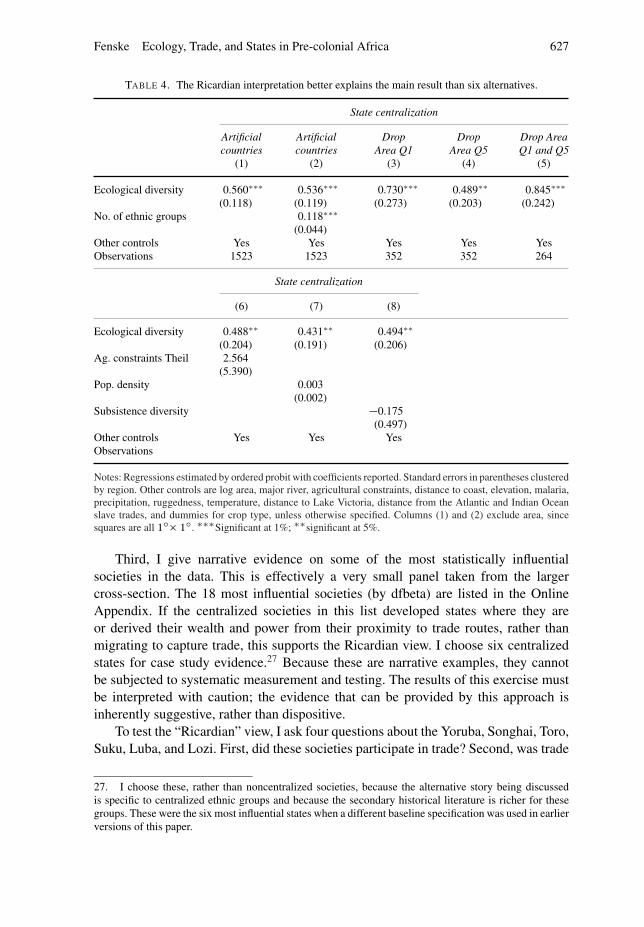
States that cover wider territories for reasons unrelated to their strength may havemore levels of jurisdiction (Spencer 1998, 2010). These areas may be more diverseby construction. I have three strategies for dismissing this alternative. First, I restrictthe sample to societies of similar area. In Table 4, I show that results are robust if thesmallest quintile (Q1), largest quintile (Q5) or both are dropped. Second, I control forthe log of area directly in the main analysis.
Third, I adopt the “virtual countries” approach of Michalopoulos (2012). I dividethe African continent into 1ı by 1ı squares and repeat the main analysis. I mapthese virtual countries in the Online Appendix. Excepting coastal societies, these unitshave a uniform shape and area.26 This exercise shows that, even conditioning on sizeand shape, diverse areas are more likely to host states. Further, this mitigates theconcern that multi-ethnic states are “double-counted”. Some readers may prefer these“exogenous” units. I use centralization of the strongest state in a square as its measureof centralization. Results, in Table 4, are robust to this approach.
5.2. States Conquer Trading Regions
States might emerge for reasons unrelated to the gains from trade, and then occupytrading regions through migration or conquest. This could only be conclusively ruledout using panel data—data that do not exist. I use the cross-section to make threearguments. First, the artificial country previous results suggest that diversity does notresult from the irregularly-shaped boundaries of ethnic groups that have conqueredtheir surroundings. Second, if conquest requires that states expand, I have alreadyshown that controlling for area does not eliminate the main result.
26. Because the length of a degree of longitude varies by distance from the equator, I have also replicatedthe results in Table 4 down-weighting observations by the degree of this distortion. The results (notreported) are nearly identical.
Fenske Ecology, Trade, and States in Pre-colonial Africa 627
TABLE 4. The Ricardian interpretation better explains the main result than six alternatives.
State centralization
Artificial Artificial Drop Drop Drop Areacountries countries Area Q1 Area Q5 Q1 and Q5
(1) (2) (3) (4) (5)
Ecological diversity 0.560��� 0.536��� 0.730��� 0.489�� 0.845���
(0.118) (0.119) (0.273) (0.203) (0.242)No. of ethnic groups 0.118���
(0.044)Other controls Yes Yes Yes Yes YesObservations 1523 1523 352 352 264
State centralization
(6) (7) (8)
Ecological diversity 0.488�� 0.431�� 0.494��
(0.204) (0.191) (0.206)Ag. constraints Theil 2.564
(5.390)Pop. density 0.003
(0.002)Subsistence diversity �0.175
(0.497)Other controls Yes Yes YesObservations
Notes: Regressions estimated by ordered probit with coefficients reported. Standard errors in parentheses clusteredby region. Other controls are log area, major river, agricultural constraints, distance to coast, elevation, malaria,precipitation, ruggedness, temperature, distance to Lake Victoria, distance from the Atlantic and Indian Oceanslave trades, and dummies for crop type, unless otherwise specified. Columns (1) and (2) exclude area, sincesquares are all 1ı� 1ı. ���Significant at 1%; ��significant at 5%.
Third, I give narrative evidence on some of the most statistically influentialsocieties in the data. This is effectively a very small panel taken from the largercross-section. The 18 most influential societies (by dfbeta) are listed in the OnlineAppendix. If the centralized societies in this list developed states where they areor derived their wealth and power from their proximity to trade routes, rather thanmigrating to capture trade, this supports the Ricardian view. I choose six centralizedstates for case study evidence.27 Because these are narrative examples, they cannotbe subjected to systematic measurement and testing. The results of this exercise mustbe interpreted with caution; the evidence that can be provided by this approach isinherently suggestive, rather than dispositive.
To test the “Ricardian” view, I ask four questions about the Yoruba, Songhai, Toro,Suku, Luba, and Lozi. First, did these societies participate in trade? Second, was trade
27. I choose these, rather than noncentralized societies, because the alternative story being discussedis specific to centralized ethnic groups and because the secondary historical literature is richer for thesegroups. These were the six most influential states when a different baseline specification was used in earlierversions of this paper.
628 Journal of the European Economic Association
a source of wealth for the society? Third, was trade a source of state power? Fourth,did these states move to capture trading regions after they grew strong? I summarizethe answers as a table in the Online Appendix. Though two of these did conquer areaswith tradable resources, they relied on trade-related income to become powerful beforeexpanding.
Yoruba. Morton-Williams (1969) argues that Yoruba Oyo “developed under thestimulus of external trade”, benefiting initially from its proximity to northern traderoutes, and later from coastal markets. Law (1977), similarly, links the rise of Oyo to itsimported cavalry, participation in long-distance northern commerce, and engagementin the Atlantic slave trade.
Trade was important. Oyo cloth was sold to Dahomey and Porto Novo, and the stateimported kola nuts from forested areas of Yorubaland for consumption and re-export.Salt and camwood were imported, and the latter was re-exported to Nupe. Cavalryhorses were imported from the north. The Alafin (king) relied on trade taxes forrevenue (Law 1977). Even direct taxes were collected in currencies acquired throughtrade. Trade upheld the Alafin’s authority by enabling him to distribute money andtrade goods while maintaining a superior lifestyle. He and other chiefs engaged intrade personally. Neither Morton-Williams (1969) nor Law (1977) mention conquestof neighboring regions as a pre-condition for trade.
Songhai. The Songhai Empire depended on trans-Saharan trade. Neumark (1977)explains the success of Songhay and the states that preceded it using “their strategiccommercial position on the fringes of the Sahara”. Songhay exported gold and slaves, aswell as ivory, rhinoceros horns, ostrich feathers, skins, ebony, civet, malaguetta pepper,and semi-precious stones. It re-exported cloth and leather goods from Hausaland andkola from the forests. It imported salt, linen, silk, cotton cloth, copper goods, ironwork,paper, books, weapons, cowries, beads, mirrors, dates, figs, sugar, cattle, and horses.This trade brought wealth; Leo Africanus noted the empire’s prosperity (Levzion 1975).
Taxes on trade provided government revenue (Shillington 1989). Lovejoy (1978)notes that Songhay’s cities
controlled trans-Saharan trade, desert-side exchange, and river traffic on the Niger.Located in the Sahil but with easy access to western and central savanna, they were atthe hub of overland and river routes where staples of desert-side trade such as grainand salt could readily be transferred from river boat to camel, and vice versa.
Songhay did expand into the Hausa states to capture their fertile land and into Airto drive out Tuareg raiders (Bovill 1995). The latter was a movement to protect existingtrade interests, not to secure new routes. Songhay’s strength, like the states that camebefore it, was based on its favorable location before it expanded.
Toro. The Toro region was one of relative prosperity, producing iron goods and saltfor sale within the interlacustrine region (Ingham 1975). Trade was a source of staterevenue, through both tribute and direct control. The king, chiefs, and lords of Toromaintained control over land, cattle, lakes, salt lakes, medicinal springs, canoe services,
Fenske Ecology, Trade, and States in Pre-colonial Africa 629
and “certain commodities having exchange or prestige value”, such as tusks and lionskins (Taylor 1962). They collected goods as tribute, reallocating them to relatives,chiefs, officials, and others. Subordinate states introduced agents to collect tax fromboth salt producers and traders, a portion of which was sent to Bunyoro (Ingham 1975).The Toro kings sold slaves, ivory, and cows to Arab traders in return for guns and cloth(Taylor 1962). Toro was also an exporter of salt; until 1923, the okukama or Mukama(king) of Toro held personal ownership over the trade in salt from Lake Katwe andother lake deposits near Kasenyi (Good 1972). Toro did expand to take advantage ofa tradable resource. Lake Katwe, in Busongora, was an early conquest (Good 1972).Salt was, however, only one of many tradable goods that enhanced the power of theToro state.
Suku. The Suku of the Congolese savanna lacked a developed system of marketplaces, sold no cash crops and only limited rubber, and itinerant trade was “not at alldeveloped” in the colonial era (Kopytoff 1967). The Suku did, however, participateas middlemen in the long-distance trade between the raffia and palm-oil producersnorth and east of them and southern groups who traded directly with the Portuguese(Kopytoff 1967). They purchased raw raffia for weaving into cloth, which was exportedto the southeast along with palm oil in return for shell money and European goods(Kopytoff 1967). Though relatively poor, the Suku were known for their wealth inshell money (Kopytoff 1964).
The Suku MeniKongo (king) directly ruled villages around the capital andadministered the remainder through regional chiefs. Shell money was used to rendertribute (Kopytoff 1964), and so direct taxes were indirectly taxes on trade. The effectof trade on the Suku state was inherited in part from the Lunda, from whom Sukuseceded (Kopytoff 1965). Within the Lunda’s territory lay both copper mines and salt,which were sources of trade and tribute (Birmingham 1976). Slaves for export werecollected through war and tributary tax collection, and this revenue allowed the royalcourt to distribute the trade goods over which it held a near monopoly (Birmingham1976). The Suku inherited state forms from their trading predecessor, and prosperedfrom their position as middlemen.
Luba. Before they were unified, the separate Luba states controlled local dried fish,salt, oil palm, raffia cloth, and copper-working industries (Birmingham 1976). In thelate 18th century, Luba Lomami responded to the new long-distance trade in ivory andslaves, unifying the Luba (Birmingham 1976). Traders exchanged cloth, beads, andcattle for tusks that were sold subject to taxation and supervision by either the royalhousehold or by chiefs (Birmingham 1976). This trade was preceded by “pioneeringchiefs”, who advanced into new lands and arranged for the purchase of ivory whileat the same time creating “a more or less permanent Luba political superstructure”behind which traders followed (Birmingham 1976).
After 1780, the Luba expanded, first into the space between the Lualaba and LakeTanganyika, and later into the fishing and palm oil areas of the Lalaba lakes, the copper-producing portions of the Samba, and the ivory-producing province of Manyema(Birmingham 1976). At its peak in the mid-19th century, the empire presided over “a
630 Journal of the European Economic Association
wide-ranging and international trade” in oil, salt, poisons, drums, slaves, copper, palmcloth, baskets, iron, skins, and fish. Wilson (1972) argues that long-distance trade wasthe cause of this expansion. The slave trade pushed the Luba to establish Kazembeas a tributary kingdom. Birmingham (1976) argues that Luba decline followed that ofthe ivory trade. Their trading partners turned to focus on copper. Swahili–Arab tradersbegan to trade directly into the forest, cutting out the Luba. The Luba became unable topurchase the guns needed to secure their power without exporting internally capturedslaves.
Lozi. The pastoral Lozi occupy the Zambezi floodplain (Gluckman 1941). WithinLozi territory, trade was in the specialized products of each region, including bulrushmillet and cassava meal, wood products, and iron (Gluckman 1941). Before 1850, theLozi sent traders to the Lunda areas of the upper Zambezi, trading indirectly withthe Portuguese (Flint 1970). By 1860, long-distance trade, especially in ivory, becameimportant (Flint 1970). The Lozi exported cattle and forest products (Gluckman 1941).
The king and princess chief collected tribute in kind from “tribes” under theircommand, including canoes, weapons, iron tools, meat, fish, fruit, salt, honey, maize,and manioc (Birmingham 1976). The Kololo, who ruled the Lozi between 1840 and1864, obtained ivory as tribute and sold iron hoes to the Tonga. The Kololo kingestablished “caravan chiefs” and kept profits from ivory within his court (Flint 1970).On regaining independence, the Lozi king traded cattle, ivory, and slaves for goodsthat he distributed (Gluckman 1941).
Public Goods. Subjects and traders received greater peace and protection from thesestates. The Toro “expected patronage—protection, justice, undisturbed occupationof their land, and rewards especially in stock or chieftainships or honours for goodservice” (Taylor 1962, p. 60). Lozi political authorities redistributed tribute, sometimesto those in need, serving as a “clearing house” (Gluckman 1941, p. 73). Traders gavegifts to the king, “for they traveled by his permission and largely, despite their muskets,under his protection” (p. 78). Lewanika, for example, sent a punitive expedition againstsubject Ila for having killed a party of traders (p. 79). Oyo caravans, similarly, oftentraveled under cavalry protection (Law 1975).
Summary. These cases are consistent with the Ricardian view. Songhai and Oyoexpanded, but did so after having arisen in locations favorable to trade. The Lubaexpanded after 1780 based on power already acquired through the Bisa ivory trade.When that trade declined, the kingdom collapsed. Lozi dominance over surroundingpeoples depended on trade and tribute from the diverse products of their neighbors.That the Suku participated in long-distance trade while possessing only limited internalmarkets highlights the importance of trade spanning macro-ecological regions. Inevery case, rulers taxed trade. Though Toro conquered Busongora to capture the mostimportant source of salt in the region, it inherited its political structure from Bunyoro,which had previously grown strong due to its sale of metal goods and control of theKibiro salt industry.

Fenske Ecology, Trade, and States in Pre-colonial Africa 631
5.3. Islands of Quality
If states emerge to protect “islands” of land quality that differ from neighboring areas,these will also have diverse ecologies. In Table 4, I control for a Theil index ofagricultural constraints. This captures the variation in land quality over space withinan ethnic group’s territory. The effect of diversity remains significant.
5.4. Population Density
Ecological diversity may be correlated with population density, which itself explainspre-colonial African states (Osafo-Kwaako and Robinson 2013). I proxy for historicpopulation density by measuring it in 1960.28 This is reported in Table 4, and the effectof ecological diversity remains intact. This is also true if I include the log of (one plus)population density (not reported).
5.5. Ethnic Diversity
Ecology-specific human capital gives rise to a greater number of ethnic groupsin regions of diverse ecology (Michalopoulos 2012). Competition between thesegroups may lead them to develop stronger states (Tilly 1992). Alternatively, moreheterogeneous communities might form more sophisticated institutions to reduceconflict (Aghion, Alesina, and Trebbi 2004). To show this is not driving my results,I return to my sample of artificial countries. I count the number of ethnic groups thatintersect each square, and include this as a control in Table 4. The main result survivesthis. It also survives controlling for modern-day heterogeneity, measured as the numberof languages reported in the World Language Mapping System (not reported).29
This alternative interpretation would also contradict several established findings.Ethnic diversity increases the cost of nation-building (Alesina, Spolaore, and Wacziarg2005), inhibits public goods provision (Easterly and Levine 1997), and predicts thebreak-up of nations (Desmet et al. 2009).30 Ecological diversity overcomes both thesepotential effects of greater ethnic diversity and the possible substitutability betweentrade openness and nation-building (e.g. Alesina and Spolaore 1997).
5.6. Diversity and Risk
Ecological diversity may increase the number of activities a society can use to copewith risk and seasonal variation. It may permit animals to be moved to take advantage
28. Raster data are taken from http://na.unep.net/datasets/datalist.php .
29. The map can be purchased from http://www.worldgeodatasets.com/language/ .
30. Within artificial countries, the centralization of the median ethnic group is negatively related to thenumber of ethnic groups (not reported). I have found no evidence that this relationship is non-monotonic.The positive coefficient in Table 4 likely comes from selecting the maximum state from a larger numberof ethnic groups.
632 Journal of the European Economic Association
of seasonal resources and avoid diseases (Beinart 2007). I have shown that the resultsare not driven by societies dependant on animal husbandry. Results are also robust tocontrolling for presence of bovines (not reported). In Table 4, I show they are robustto adding subsistence diversity as a control. This is a Herfindahl index computed fromthe income shares derived from hunting, fishing, gathering, husbandry, and agriculturereported in the Ethnographic Atlas.
Cultivating a diverse set of grains may enable a state to better cope with risk (e.g.McCann 1999). If these grains are exchanged through intra-regional trade, this is notinconsistent with an interpretation linking diversity to states through trade. Controllingfor a Herfindahl index constructed from the shares of each society’s territory that aremost suitable for the grains listed in plate 48 of the FAO-GAEZ data does not changethe main result (not reported).
6. Mechanisms
6.1. How does Trade Cause States?
To illustrate the possible mechanisms connecting trade to state centralization, Iintroduce a simple model in the Online Appendix. This is based on Gennaioli andVoth (2012). In the model, a ruler extends his authority within his ethnic group’sterritory in order to tax trade. This trade cannot occur unless he offers public goodsthat lower the costs of trade. These public goods could include dispute-resolutionservices or physical protection. I do not specify whether these public goods are usedto facilitate trade with the citizens of neighboring states, or to promote internal trade,since state services could lower trade costs in either case. I show that greater gains fromtrade will lead the ruler to centrally administer a larger fraction of group’s territory. Inthe model, there are three mechanisms by which trade may lead to states:
1. Greater gains from trade will directly increase the profitability of statecentralization. It raises the tax base, allowing the ruler to extract greater revenuesfrom the territory he controls. Investment in public goods and administrationbecomes worthwhile. Adding to this direct revenue effect, the ability of rulersto tax exchange and to trade on their own was highlighted by the earlier casestudies.
2. If greater access to trade makes it cheaper to project authority over space,centralization will increase. Access to trade can lower these costs. The abilityto trade for horses and for firearms made it easier for states such as Oyo andSonghai to extend their power over space.
3. If access to trade makes the ruler more effective at providing public goods, statecentralization becomes more profitable. Access to trade may give the ruler accessto goods that increase his authority in settling disputes and in demanding thattraders not be harassed. The Alafin (king) of Oyo gained prestige by maintaining asuperior lifestyle, while the Lozi and Toro rulers secured loyalty by redistributing
Fenske Ecology, Trade, and States in Pre-colonial Africa 633
the profits from trade. Cavalry and firearms could be used to extend protection totraders.
It is beyond the scope of this paper to discuss whether trade or centralization are“good” outcomes in all cases, or whether states that depend on tradable resources forrevenues are “better” than states that have other sources of revenue (Sachs and Warner2001; Mehlum, Moene, and Torvik 2006; Brunnschweiler and Bulte 2008).
6.2. Trade and Intermediate Outcomes
Here, I test whether trade predicts specific outcomes related to state formation. Ifind that ecological diversity is strongly associated with class stratification and localdemocracy, but not with diminished local political authority or with religion. Tradein the SCCS is correlated with a wide selection of state functions, rather than a fewnarrow indicators of state capacity.
Diminished Local Authority. The first possible mechanism is to take over the authorityof other smaller states in its vicinity. The atlas contains a variable (V32) that records thenumber of “levels of local jurisdiction”. I take this as a crude measure of the strengthof local states, and use it as an outcome in place of state centralization in equation(1). While there is a suggestive negative correlation between ecological diversity andlocal states when no other controls are added, this is not robust to the inclusion ofother variables. Similarly, V72 records the rules for succession to the office of the localheadman. I construct a “headman is appointed” dummy if this rule is “appointment byhigher authority”. In Table 5, I show that there is no correlation in the data.
Democracy. Although I do not have the data to test whether trade made central statesmore democratic, I am able to test whether trade predicts the level of democracy inlocal government for the ethnic groups in my sample. As previously, I use V72, whichrecords the rules for succession to the office of the local headman. Following Whatley(2012), I create a variable, “headman is democratic”, which takes the value 1 if V 72
reports that the succession rule is “election or other formal consensus, nonhereditary”.In Table 5, I show that ecological diversity predicts greater local democracy. Althoughpolitical centralization was not necessarily inclusive in pre-colonial Africa, societiessuch as the Tswana and the Ganda did have local assemblies and checks on the powerof the state (Acemoglu, Johnson, and Robinson 2003). Within the sample used here, thecorrelation between state centralization and local democracy is positive and significantat the 10% level.
Islam. Islam diffused in Africa through trade networks that encouraged both tribalunification and the adoption of Arabic (Insoll 2003). This is one of the possiblemechanisms linking trade to states. The data do not directly record Islam. They onlystate whether high gods are “supportive of human morality”. This is only positive fora handful of societies outside of the Moslem Sudan, Western Sudan, and Ethiopia,
634 Journal of the European Economic Association
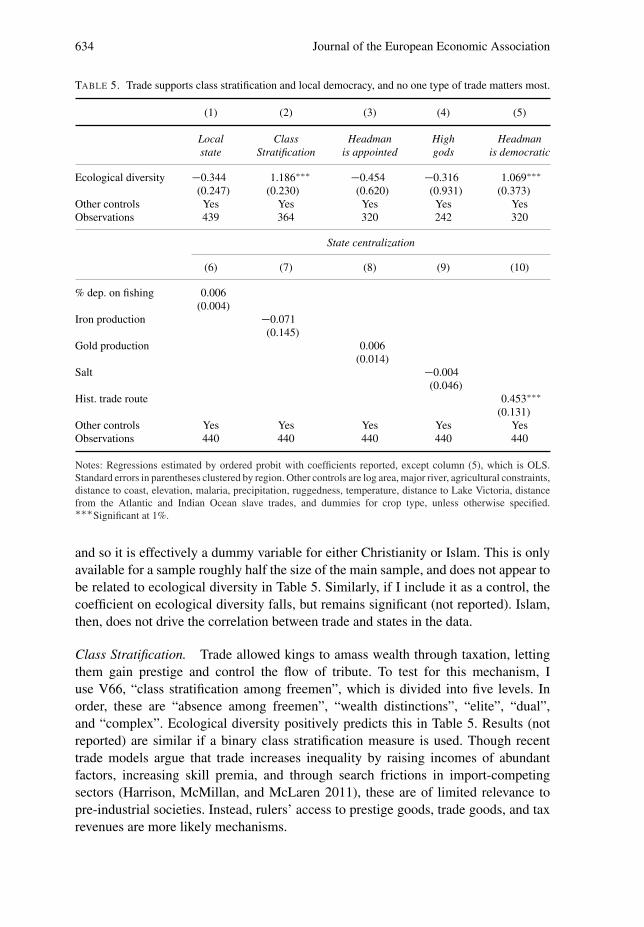
TABLE 5. Trade supports class stratification and local democracy, and no one type of trade matters most.
(1) (2) (3) (4) (5)
Local Class Headman High Headmanstate Stratification is appointed gods is democratic
Ecological diversity �0.344 1.186��� �0.454 �0.316 1.069���
(0.247) (0.230) (0.620) (0.931) (0.373)Other controls Yes Yes Yes Yes YesObservations 439 364 320 242 320
State centralization
(6) (7) (8) (9) (10)
% dep. on fishing 0.006(0.004)
Iron production �0.071(0.145)
Gold production 0.006(0.014)
Salt �0.004(0.046)
Hist. trade route 0.453���
(0.131)Other controls Yes Yes Yes Yes YesObservations 440 440 440 440 440
Notes: Regressions estimated by ordered probit with coefficients reported, except column (5), which is OLS.Standard errors in parentheses clustered by region. Other controls are log area, major river, agricultural constraints,distance to coast, elevation, malaria, precipitation, ruggedness, temperature, distance to Lake Victoria, distancefrom the Atlantic and Indian Ocean slave trades, and dummies for crop type, unless otherwise specified.���Significant at 1%.
and so it is effectively a dummy variable for either Christianity or Islam. This is onlyavailable for a sample roughly half the size of the main sample, and does not appear tobe related to ecological diversity in Table 5. Similarly, if I include it as a control, thecoefficient on ecological diversity falls, but remains significant (not reported). Islam,then, does not drive the correlation between trade and states in the data.
Class Stratification. Trade allowed kings to amass wealth through taxation, lettingthem gain prestige and control the flow of tribute. To test for this mechanism, Iuse V66, “class stratification among freemen”, which is divided into five levels. Inorder, these are “absence among freemen”, “wealth distinctions”, “elite”, “dual”,and “complex”. Ecological diversity positively predicts this in Table 5. Results (notreported) are similar if a binary class stratification measure is used. Though recenttrade models argue that trade increases inequality by raising incomes of abundantfactors, increasing skill premia, and through search frictions in import-competingsectors (Harrison, McMillan, and McLaren 2011), these are of limited relevance topre-industrial societies. Instead, rulers’ access to prestige goods, trade goods, and taxrevenues are more likely mechanisms.
Fenske Ecology, Trade, and States in Pre-colonial Africa 635
Specific State Functions. I test whether the various measures of state centralizationin the SCCS’s global sample are correlated with any of the forms of trade mentionedin that source in the Online Appendix. Trade in food and the importance of tradein subsistence are related with the greatest number of state functions. The degree ofpolice specialization and the level of the highest political office are correlated withall the trade measures. The degree to which the executive is concentrated in a singleperson, the presence of a judiciary and the level of highest overarching jurisdictionare correlated with all but one. Many types of trade, then, are related to several state-related outcomes in the SCCS—no one type of trade operates through one specificmechanism.31
6.3. What Sort of Trade Matters?
Endowments of Tradable Products. The ecological diversity measure cannot captureall forms of trade. In Table 5, I test whether other sources of trade—fishing, iron, gold,and salt—give similar rise to states. These data do not measure trade in these products,only the capacity to trade. Coefficients can be thought of as intent-to-treat effects.
A society’s percentage dependance on fishing is V3 in the Ethnographic Atlas. Ifind no correlation between this and states. To test the importance of minerals, I takedata from the US Geological Service’s Mineral Resources Program.32 These recordscontain data on both metallic and nonmetallic mineral resources at specific sites. “Iron”is the number of sites of iron production found within an ethnic group’s territory, and“gold” is the number of sites of gold production. If there is any bias from using moderndata, it will be positive, since modern states that have inherited the strength of theirpre-colonial predecessors should be better able to exploit their countries’ resources.Despite this, I find no evidence that iron matters.33 Gold enters significantly when nocontrols are added, though the effect of gold is insignificant with controls. “Salt” is thenumber of salt-producing cites listed by Sundstrom (1974) within an ethnic group’sterritory.34 This too appears irrelevant.
31. Other outcomes may be of interest to the reader. Ecological diversity does predict area in an OLSregression, and this is robust to both the standard controls and regional fixed effects (not reported). I havefound no relationship between ecological diversity and urbanization measured by cities in 1,850 reportedby Chandler and Fox (1974) (not reported).
Similarly, some readers may be interested in how ecological diversity and pre-colonial states relate tocolonial outcomes. I show in the Online Appendix that ethnic groups whose largest slice of territory wasconquered by Britain were generally more diverse and more centralized than those captured by France, butless than those not colonized. Within the British empire, Frankema and van Waijenburg (2012) have foundearly 20th century real wages were much higher in West Africa than East Africa. If there is any patternapparent, it is that ethnic groups in Britain’s East African conquests were more diverse and centralizedthan those in Ghana and Nigeria, though Sierra Leone is an exception.
32. The data are available at http://mrdata.usgs.gov/
33. I similarly find no result if I use the number of iron-producing sites within a group’s territory listedby Sundstrom (1974) as a measure of iron.
34. Of 271 sites he lists, I match 84 to ethnic groups in the data and 157 to specific geographic locations,such as Cape Lopez. For 30 I could not find a match. The full table of matches is given in the OnlineAppendix.

636 Journal of the European Economic Association
TABLE 6. Ecological diversity is an instrument for state centralization.
Light density
OLS IV OLS OLS(1) (2) (3) (4)
State centralization 0.279��� 0.810�� 0.263���
(0.066) (0.361) (0.067)Ecological diversity 0.618�� 0.417
(0.259) (0.256)Other controls Yes Yes Yes YesCountry FE Yes Yes Yes YesKleibergen–Paap F 12.09Observations 683 683 683 683
Notes: Standard errors in parentheses clustered by region. Other controls are distance to capital, distance to coast,distance to border, log water area, log land area, elevation, suitability for agriculture, malaria ecology, petroleum,and diamonds. ���Significant at 1%; ��significant at 5%.
Types of Trade. I also test whether state centralization is correlated with any particularform of trade in the SCCS’s global sample. In the Online Appendix, I present thecorrelations between these indicators and state centralization. Societies with states aremore likely to trade for food, through more levels of intermediation, and this tradeis more important to their subsistence. Political power is more likely to depend oncommerce in more centralized states, trade and markets are more likely to exist, andexchange is more important within the community. Interestingly, this suggests that itis the more mundane, intra-community trade in products such as food that matters.
Local and Long-Distance Trade. Despite this suggestive finding, the data sourceshere also provide evidence that favors long-distance trade. I show in Table 5 that thepresence of historical trade routes is correlated with state centralization. This does not,however, rule out the importance of local trade. Similarly, “ecological diversity” isintended as a proxy for intra-ethnic trade and “distance from an ecological boundary”is meant to capture long-distance trade. I show in the Online Appendix that if bothare included in the same regression, only distance from an ecological divide remainssignificant.
6.4. Does Historical Trade Matter Today?
It is not the case today that all African countries have strong states. Even today, aone-standard-deviation increase in the Gennaioli and Rainer (2007) index of StateCentralization predicts a 0.3 standard deviation drop in The Fund for Peace’s FailedStates Index for 2012.35 Michalopoulos and Papaioannou (2013) have shown that pre-colonial states predict greater levels of contemporary development, as measured bythe intensity of night-time lights. In Table 6, I show that historical trade can be used
35. In this bivariate regression, n D 47, p D 0:041.

Fenske Ecology, Trade, and States in Pre-colonial Africa 637
to instrument for these ethnic institutions. Column (1) replicates the main result fromTable 3A in their paper: conditional on controls and country fixed effects, “ethnic”institutions predict present-day luminosity. Column (2) uses ecological diversity as aninstrument for these pre-colonial states. The IV estimate is positive and significant.This supports a causal interpretation of the results in Michalopoulos and Papaioannou(2013); ecological conditions that no longer directly influence trade predict institutionsthat continue to matter in the present.
I present the reduced-form estimate in column (3). In column (4), I perform a roughtest of the over-identification restriction, and report least squares estimates includingboth pre-colonial states and ecological diversity on the right-hand side. Once statesare included, the effect of ecological diversity on luminosity loses magnitude and isno longer significant.
7. Conclusion
I have used this paper to provide empirical support for Bates’s (1983) Ricardian view ofpre-colonial African states. The gains from trade stemming from ecological diversitypredict the presence of state centralization across sub-Saharan societies recorded inthe Ethnographic Atlas. Moving from a homogeneous zone to one that is ecologicallydiverse predicts that the chance a society is centralized rises by more than ten percentagepoints. There is no evidence that the effect is overstated due to endogeneity, or is dueto the influence of outliers or specific ethnographic regions. The histories of Africansocieties are consistent with this interpretation of the data, rather than one in whichstates emerge and then migrate. Similarly, area, defense of fertile islands, correlationwith dense population, risk mitigation, and ethnic competition do not explain away theresults. Ecological diversity continues to matter in the present through the legacy ofpre-colonial states.
What does this result add to our understanding of the link between institutionsand development in the present? First, it suggests that other findings that have beeninterpreted as effects of culture may operate through institutions. For example, theresult in Durante (2009) that historical experience with mutual insurance leads togreater levels of trust may arise through the institutional consequences of mutually-insuring trade. Second, institutions have heterogeneous effects on development, andpart of this heterogeneity is both path-dependent and context-specific. The mechanismsthat shaped pre-colonial states in Africa continue to shape development in thepresent.
References
Acemoglu, Daron, Simon Johnson, and J. Robinson (2005). “The Rise of Europe: Atlantic Trade,Institutional Change, and Economic Growth.” American Economic Review, 95(3), 546–579.
Acemoglu, Daron, Simon Johnson, and James Robinson (2003). “An African Success Story:Botswana.” In Search of Prosperity: Analytical Narrative on Economic Growth, edited by DaniRodrik. Princeton University Press.

638 Journal of the European Economic Association
Acemoglu, Daron, Tristan Reed, and James Robinson (2012). “Chiefs.” Massachusetts Institute ofTechnology. Working paper.
Aghion, Philippe, Alberto Alesina, and Francesco Trebbi (2004). “Endogenous Political Institutions.”Quarterly Journal of Economics, 119, 565.
Ahlquist, John and Erik Wibbels (2012). “Riding the Wave: World Trade and Factor-Based Modelsof Democratization.” American Journal of Political Science, 56, 447–464.
Alesina, Alberto and Enrico Spolaore (1997). “On the Number and Size of Nations.” QuarterlyJournal of Economics, 113, 1027–1056.
Alesina, Alberto, Enrico Spolaore, and Romain Wacziarg (2005). “Trade, Growth and the Size ofCountries.” Handbook of Economic Growth, 1, 1499–1542.
Altonji, Joseph, Todd Elder, and Christopher Taber (2005). “Selection on Observable andUnobservable Variables: Assessing the Effectiveness of Catholic Schools.” Journal of PoliticalEconomy, 113, 151–184.
Bates, Robert (1983). Essays on the Political Economy of Rural Africa. University of CaliforniaPress.
Beinart, William. (2007). “Transhumance, Animal Diseases and Environment in the Cape, SouthAfrica.” South African Historical Journal, 58, 17–41.
Besley, Timothy and Torsten Persson (2009). “The Origins of State Capacity: Property Rights,Taxation, and Politics.” American Economic Review, 99(4), 1218–1244.
Besley, Timothy and Torsten Persson (2010). “State Capacity, Conflict, and Development.”Econometrica, 78, 1–34.
Birmingham, David. (1976). “The Forest and Savanna of Central Africa.” In The Cambridge Historyof Africa, Volume 5: c. 1790 to c. 1870, edited by J. E. Flint. Cambridge University Press,pp. 222–269.
Bisson, Michael. (1982). “Trade and Tribute. Archaeological Evidence for the Origin of States inSouth Central Africa.” Cahiers d’etudes africaines, 22, 343–361.
Bockstette, Valerie, Areendam Chanda, and Louis Putterman (2002). “States and Markets: TheAdvantage of an Early Start.” Journal of Economic Growth, 7, 347–369.
Bovill, Edward (1995). The Golden Trade of the Moors: West African Kingdoms in the FourteenthCentury. Markus Wiener.
Brice, William C. and Hugh Kennedy (2001). An Historical Atlas of Islam. Brill Academic, Leiden.Bruckner, Markus, Antonio Ciccone, and Andrea Tesei (2012). “Oil Price Shocks, Income, and
Democracy.” Review of Economics and Statistics, 94, 389–399.Brunnschweiler, Christia and Erwin Bulte (2008). “The Resource Curse Revisited and Revised: A
Tale of Paradoxes and Red Herrings.” Journal of Environmental Economics and Management,55, 248–264.
Chanda, Areendam and Louis Putterman (2007). “Early Starts, Reversals and Catch-up in the Processof Economic Development.” Scandinavian Journal of Economics, 109, 387–413.
Chandler, Tertius and Gerald Fox (1974). 3000 Years of Urban Growth. Academic Press.De Long, Bradford J. and Andrei Shleifer (1993). “Princes and Merchants: European City Growth
before the Industrial Revolution.” Journal of Law and Economics, 36, 671–702.Desmet, Klaus, Michel Le Breton, Ignacio Ortuno-Ortin, and Shlomo Weber (2009). “The Stability
and Breakup of Nations: A Quantitative Analysis.” Journal of Economic Growth, 16, 1–31.Dippel, Christian (2011). “Forced Coexistence and Economic Development: Evidence from Native
American Reservations.” UCLA Anderson School of Management. Working Paper.Dixit, Avinash (2004). Lawlessness and Economics: Alternative Modes of Governance. Princeton
University Press.Durante, Rueben (2009). “Risk, Cooperation and the Economic Origins of Social Trust: An Empirical
Investigation.” Job Market paper, Brown University.Easterly, William and Ross Levine (1997). “Africa’s Growth Tragedy: Policies and Ethnic Divisions.”
Quarterly Journal of Economics, 112, 1203.Fenske, James (2012). “Does Land Abundance Explain African Institutions?” Economic Journal,
123, 1363–1390.Flint, Eric. (1970). “Trade and Politics in Barotseland During the Kololo Period.” Journal of African
History, 11, 71–86.

Fenske Ecology, Trade, and States in Pre-colonial Africa 639
Frankema, Ewout and Marlous van Waijenburg (2012). “Structural Impediments to African Growth?New Evidence from Real Wages in British Africa, 1880–1965.” Journal of Economic History,72, 895–926.
Gennaioli, Nicola and Ilia Rainer (2007). “The Modern Impact of Precolonial Centralization inAfrica.” Journal of Economic Growth, 12, 185–234.
Gennaioli, Nicola and Hans-Joachim Voth (2012). “State Capacity and Military Conflict.” CEPRdiscussion paper 8699, Department of Economics and Business, Universitat Pompeu Fabra.
Giavazzi, Francesco and Guido Tabellini (2005). “Economic and Political Liberalizations.” Journalof Monetary Economics, 52, 1297–1330.
Gluckman, M. (1941). Economy of the Central Barotse Plain. Rhodes-Livingstone Institute.Good, Charles. (1972). “Salt, Trade, and Disease: Aspects of Development in Africa’s Northern
Great Lakes Region.” International Journal of African Historical Studies, 5, 543–586.Harrison, Ann, Margaret McMillan, and John McLaren (2011). “Recent Perspectives on Trade and
Inequality.” Annual Review of Economics, 3, 261–289.Ingham, Kenneth (1975). The Kingdom of Toro in Uganda. Methuen.Insoll, T. (2003). The Archaeology of Islam in sub-Saharan Africa. Cambridge University Press.Jones, Eric (1981). The European Miracle: Environments, Economies, and Geopolitics in the History
of Europe and Asia. Cambridge University Press.Kopytoff, Igor. (1964). “Family and Lineage among the Suku of the Congo.” In The Family Estate
in Africa: Studies in the Role of Property in Family Structure and Lineage Continuity, edited byRobert T. Gray and Philip H. Gulliver. Boston University Press, pp. 83–116.
Kopytoff, Igor (1965). “The Suku of Southwestern Congo.” Peoples of Africa, edited by James L.Gibbs. Holt, Rinehart and Winston, pp. 441–80.
Kopytoff, Igor (1967). “Labor Allocation Among the Suku.” Paper presented at Conference onCompeting Demands for the Time of Labor in Traditional African Societies.
Law, Robin. (1975). “A West African Cavalry State: the Kingdom of Oyo.” Journal of AfricanHistory, 16, 1–15.
Law, Robin (1977). The Oyo Empire: c.1600–c.1836: A West African Imperialism in the Era of theAtlantic Slave Trade. Clarendon.
Levzion, Nehemia. (1975). “The Western Maghrib and Sudan.” In The Cambridge History of Africa:from c. 1600 to c. 1790, edited by R. Gray. Cambridge University Press, pp. 331–462.
Lopez-Cordova, J. Ernesto and Christopher Meissner (2005). “The Globalization of Trade andDemocracy, 1870–2000.” NBER Working Paper No. 11117.
Lovejoy, Paul. (1978). “The Role of the Wangara in the Economic Transformation of theCentral Sudan in the Fifteenth and Sixteenth Centuries.” Journal of African History, 19,173–193.
Lovejoy, Paul and Stephen Baier (1975). “The Desert-Side Economy of the Central Sudan.”International Journal of African Historical Studies, 8, 551–581.
Maddala, G. S. (1986). Limited-Dependent and Qualitative Variables in Econometrics. CambridgeUniversity Press.
Mamdani, Mahmood (1996). Citizen and Subject: Contemporary Africa and the Legacy of LateColonialism. Princeton University Press.
McCann, James (1999). Green Land, Brown Land, Black Land: An Environmental History of Africa,1800–1990. James Currey.
Mehlum, Halvor, Karl Moene, and Ragnar Torvik (2006). “Institutions and the Resource Curse.”Economic Journal, 116, 1–20.
Michalopoulos, Stelios. (2012). “The Origins of Ethnnolinguistic Diversity.” American EconomicReview, 102(4), 1508–1539.
Michalopoulos, Stelios, Alireza Naghavi, and Giovanni Prarolo (2010). Trade and Geography in theEconomic Origins of Islam: Theory and Evidence. Fondazione Eni Enrico Mattei.
Michalopoulos, Stelios and Elias Papaioannou (2011). “The Long-Run Effects of the Scramble forAfrica.” NBER Working Paper No. 17620.
Michalopoulos, Stelios and Elias Papaioannou (2013). “Pre-colonial Ethnic Institutions andContemporary African Development.” Econometrica, 81, 113–152.

640 Journal of the European Economic Association
Miguel, Edward, Shanker Satyanath, and E. Sergenti (2004). “Economic Shocks and Civil Conflict:An Instrumental Variables Approach.” Journal of Political Economy, 112, 725–753.
Moav, Omer, Zvika Neeman, and Joram Mayshar (2011). “Transparency, Appropriability and theEarly State.” CEPR Discussion Paper No. 8548.
Montalvo, Jose and Marta Reynal-Querol (2005). “Ethnic Polarization, Potential Conflict, and CivilWars.” American Economic Review, 95(3), 796–816.
Morton-Williams, Peter. (1969). “The Influence of Habitat and Trade on the Politics of Oyoand Ashanti.” In Man in Africa, edited by Douglas, Mary and Phyllis M. Kaberry. TavistockPublications, pp. 79–98.
Murdock, George (1959). Africa: Its Peoples and Their Culture History. McGraw-Hill.Murdock, George (1967). Ethnographic Atlas. University of Pittsburgh Press.Neumark, S. Daniel. (1977). “Trans-Saharan Trade in the Middle Ages.” In An Economic History of
Tropical Africa: Vol 1. The Pre-colonial Period, edited by Z. A. Konczacki and J. M. Konczacki.Frank Cass, pp. 127–131.
Oliver, Roland and J. D. Fage (1962). A Short History of Africa. Penguin.Olson, Mancur. (1993). “Dictatorship, Democracy, and Development.” American Political Science
Review, 87, 567–576.Osafo-Kwaako, Philip and James A. Robinson (2013). “Political Centralization in Pre-Colonial
Africa.” NBER Working Paper No. 18770.Papaioannou, Elias and Gregorios Siourounis (2008). “Economic and Social Factors Driving the
Third Wave of Democratization.” Journal of Comparative Economics, 36, 365–387.Putterman, Louis and David N Weil (2010). “Post-1500 Population Flows and the Long-Run
Determinants of Economic Growth and Inequality.” The Quarterly Journal of Economics, 125,1627–1682.
Roberto, Rigobon and Dani Rodrik (2005). “Rule of Law, Democracy, Openness, and Income.”Economics of Transition, 13, 533–564.
Sachs, Jeffrey and Andrew Warner (2001). “The Curse of Natural Resources.” European EconomicReview, 45, 827–838.
Shillington, Kevin (1989). History of Africa. Bedford Books.Spencer, Charles. (1998). “A Mathematical Model of Primary State Formation.” Cultural Dynamics,
10, 5–20.Spencer, Charles. (2010). “Territorial Expansion and Primary State Formation.” Proceedings of the
National Academy of Sciences, 107, 7119–7126.Sundstrom, Lars (1974). The Exchange Economy of Pre-colonial Tropical Africa. C. Hurst and Co.Taylor, Brian (1962). “The Western Lacustrine Bantu.”London: International African Institute.Tilly, Charles (1992). Coercion, Capital, and European States, AD 990–1992. Blackwell.Vansina, Jan (1966). Kingdoms of the Savanna. University of Wisconsin Press, London.Whatley, Warren (2012). “The Trans-Atlantic Slave Trade and the Evolution of Political Authority
in West Africa.” In Africa’s Development in Historical Perspective, edited by EmmanuelAkyeampong, Robert Bates, Nathan Nunn, and James A. Robinson. Cambridge: CambridgeUniversity Press.
White, Frank. (1983). “The Vegetation of Africa: A Descriptive Memoir to Accompany theUNESCO/AETFAT/UNSO Vegetation Map of Africa.” Natural Resources Research, 20, 1–356.
Wilson, Anne. (1972). “Long Distance Trade and the Luba Lomami Empire.” The Journal of AfricanHistory, 13, 575–589.
Wooldridge, Jeffrey (2002). Econometric Analysis of Cross Section and Panel Data. MIT Press.
Supporting Information
Additional Supporting Information may be found in the online version of this articleat the publisher’s website:
Online Appendix: Web Appendix for “Ecology, trade and states in pre-colonial Africa”.